Raman signatures of lattice dynamics across inversion symmetry breaking phase transition in quasi-1D compound, \ch(TaSe4)3I
Abstract
Structural phase transition can occur due to complex mechanisms other than simple dynamical instability, especially when the parent and daughter structure is of low dimension. This article reports such an inversion symmetry-breaking structural phase transition in a quasi-1D compound (TaSe4)3I at T 141 K studied by Raman spectroscopy. Our investigation of collective lattice dynamics reveals three additional Raman active modes in the low-temperature non-centrosymmetric structure. Two vibrational modes become Raman active due to the absence of an inversion center, while the third mode is a soft phonon mode resulting from the vibration of Ta atoms along the {-Ta-Ta-} chains. Furthermore, the most intense Raman mode display Fano-shaped asymmetry, inferred as the signature of strong electron-phonon coupling. The group theory and symmetry analysis of Raman spectra confirm the displacive-first-order nature of the structural transition. Therefore, our results establish (TaSeI as a model system with broken inversion symmetry and strong electron-phonon coupling in the quasi-1D regime.
I Introduction
Collective excitations play a crucial role in understanding emergent quantum phenomena and phases in condensed matter physics [1, 2]. Symmetry or lack of it determines the underlying dynamics of these collective phenomena and phases[3, 4, 5]. For instance, non-centrosymmetric materials, which lack inversion symmetry, exhibit a range of unique physical phenomena including unconventional superconductivity[6, 7, 8], Weyl physics[9, 10], piezoelectricity[11], and ferroelectricity[12, 13], whereas the presence of symmetry can give rise to various novel quantum phases with interesting properties[14]. For example, topological insulators exhibit bulk band gaps with gapless metallic surface states protected by inversion symmetry [15, 16]. Consequently, the discovery of new material with broken inversion symmetry holds great potential for hosting exotic quantum phases.
The quasi-one-dimensional materials exhibit the fascinating collective phenomena known as charge density waves (CDWs) accompanied by spontaneous rearrangement of the lattice structure [17, 18]. Recently, the family of quasi-1D transition metal tetra chalcogenides, (MX4)nY with metal (M) = Ta, Nb; Chelcogen (X) = S, Se, or Te, and Halogen (Y) = I, Br) has been the subject of intense research owing to their exotic physical properties arising from the interplay of the single particle excitation and the highly correlated response of the electronic state [19, 20, 21, 18, 22, 23, 24]. One notable member of this family, (TaSeI is an enantiomorphic system without any inversion center. It has been reported to be a topological Weyl semimetal, whose Weyl nodes with opposite chirality are coupled by CDW modes resulting in an Axion state [24, 25, 26, 27]. Concomitantly, in our recent study, (TaSeI has been found to undergo an inversion symmetry breaking structural phase transition (SPT) at T 145 K, driven by the hybridization energy gain due to the off-centric movement of the Ta atoms, which wins over the elastic energy loss [28]. Furthermore, the low-temperature non-centrosymmetric phase exhibits an unusual coexistence of two antagonistic quantum phenomena - superconductivity and weak magnetism below 2.5 K [29]. Considering the significance of the inversion symmetry breaking in low-dimension and unusual phase coexistence, (TaSeI is a promising platform for studying correlated quantum phenomena and underlying collective lattice dynamics [30].
The inversion symmetry-breaking phase transitions are always associated with the emergence of new collective lattice dynamics [31, 32, 33, 34]. Over the past few decades, the phonon modes in various systems are successfully investigated using Raman spectroscopy[35, 7, 30]. The Raman spectroscopy has also been used to investigate phase transition in quasi-1D compounds, (NbSe4)3I [37, 38] and (TaSeI[39]. It has been reported that [37] (NbSeI goes through two structural-phase transitions. The high temperature phase transition is a continuous one with a phonon (soft) branch cross-over. On the other hand, another study [38] reported no signature of such crossover of the phonon branches across the transition. They claimed to found soft phonon mode associated with the second order phase transition. However, the phonon modes associated with the structural phases of the quasi-1D compound, (TaSeI, a isoelectronic counterpart of (NbSeI, are almost unexplored.
Here, we present a comprehensive investigation of a unique inversion symmetry-breaking phase transition observed at T 141 K [29, 28] of (TaSeI using in-depth Ramanp scattering experiments and theoretical analysis of phonon mode characteristics. By analyzing temperature-dependent spectra, we have identified eleven Raman active vibration modes for the centrosymmetric (CS) phase, while the non-centrosymmetric (NCS) phase exhibits three additional Raman activ e modes in addition to the previously observed eleven modes. Through a combination of polarized Raman spectroscopy and calculations, we have successfully identified all Raman active modes. Among the three newly appeared modes two vibrational modes which were initially Raman inactive at room temperature became Raman active at low temperature due to the absence of inversion symmetry in the crystal structure. And the another one mode at 200.93 cm-1 associated with the symmetry which is identified as the soft phonon mode, disappears above the SPT, which suggests the displacive and first-order nature of the phase transition. Additionally, the Fano-shaped asymmetry of the most intense Raman modes confirms the presence of strong electron-phonon coupling. Consequently, this study provides a comprehensive understanding of the evolution of phonon modes across the idiosyncratic symmetry inversion transition in low-dimensional systems.
II Results and Discussions
II.1 Characterization - Crystal structure and symmetry
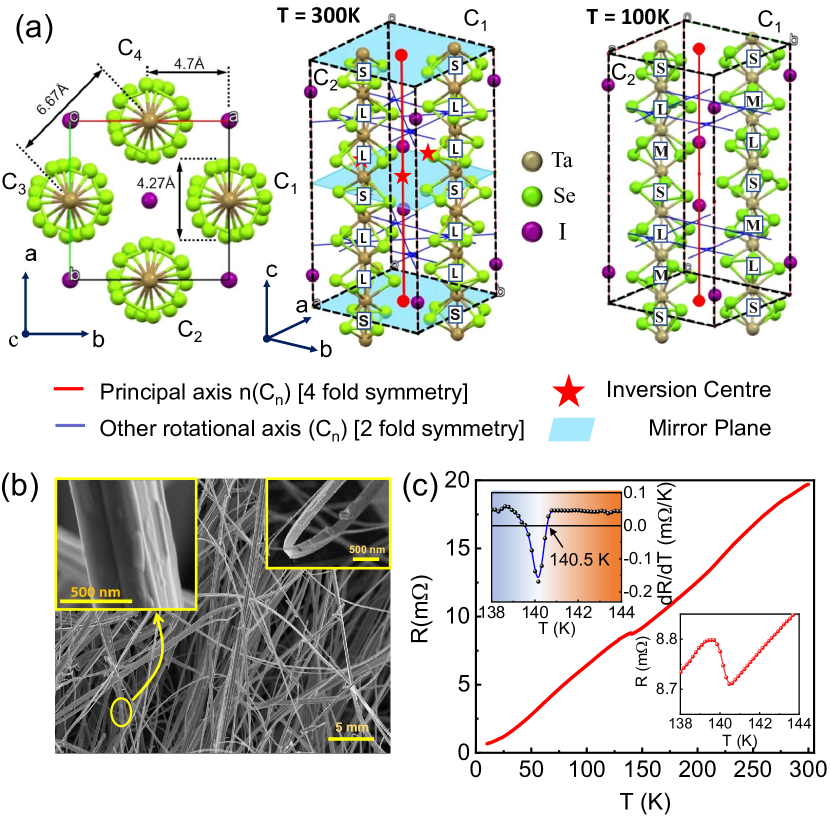
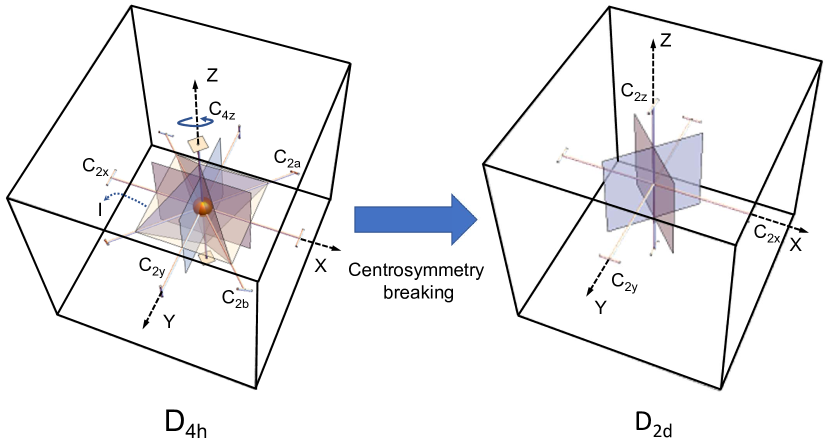
Ribbon-like single crystals with lengths up to a few millimeters and widths up to a few microns (see Fig. 1 (b)) were grown using the chemical vapor transport method, as described in our earlier works [29, 28] and also briefly in the method section. Single crystal x-ray diffraction (SXRD) analysis revealed a simple tetragonal centrosymmetric crystal structure (space group , no. 128) at room temperature. The unit cell has four TaSe4 chains separated by I atoms as shown in Fig. 1 (a). There are 8 Ta atoms of two inequivalent classes Ta(1) and Ta(2) in each chain. The bond length between the Ta-metals shows a sequence along a TaSe4-chain is a repetition of [-Short (3.059Å)- Long (3.251Å)-Long (3.251Å)-] bonds. Whereas the low-temperature crystal structure adopts a non-centrosymmetric configuration, belonging to the same tetragonal crystal family with a space group (no. 114). The small lattice distortion changes the bonding sequence of TaSe4 chains and breaks the inversion center [28]. The 8 Ta atoms in the chain are split into 3 inequivalent classes Ta(1), Ta(2), and Ta(3). The structural distortion is caused by the shift of the Ta(3) atom towards the Ta(2) atom in chain 1 (C1) and away from Ta(2) atoms in chain 2 (C2). The bonding sequence between two nearest chains are like [ - Long(L) (3.306 Å) - Medium(M) (3.116 Å) - Short(S) (3.051 Å) - ] and [ - Long(L) (3.306 Å) - Short(S) (3.051 Å) - Medium(M) (3.116 Å) - ]. The shift of the Ta(3) atom is in the reverse direction for the two nearest neighbor chains making it non-polar.
The CS structure has five inversion centers (IC), with four located at the center of each TaSe4 chain and the remaining one at the center of the unit cell. However, there is no inversion center in the low-temperature crystal structure as shown in Fig. 1(a). The inversion symmetry breaking SPT is also reflected as an anomaly at T 141 K in the temperature-dependent resistance as shown in Fig. 1(c). Notably, the lower inset along with d/d vs. T plot in the upper inset clearly reveals the above structural transition [28].
II.2 Raman signatures of structural phase transition.
| Raman modes | CS phase | NCS phase | ||||||
|---|---|---|---|---|---|---|---|---|
| Exp. | Theo. | Symm. | Origin | Exp. | Theo. | Symm. | Origin | |
| P1 | 101.58 | 101.97 | Se-Se | 102.44 | 101.40 | Se-Se | ||
| P2 | Ta-Se-I | 111.53 | 110.31 | Ta-Se-I | ||||
| P3 | 115.39 | 116.21 | Ta-Se | 117.90 | 116.88 | Ta-Se | ||
| P4 | 143.19 | 141.36 | Se-Se | 143.31 | 144.16 | Se-Se | ||
| P5 | 148.42 | 148.33 | Se-Se | 149.73 | 150.60 | Se-Se | ||
| P6 | 156.50 | 158.14 | Ta-Se | 162.82 | 161.81 | Ta-Se | ||
| P7 | Ta-Se | 176.40 | 175.62 | Ta-Se | ||||
| P8 | 178.42 | 178.35 | Se-Se | 180.56 | 180.96 | Se-Se | ||
| P9 | 187.47 | 189.09 | Ta-Se | 189.57 | 190.86 | Ta-Se | ||
| P10 | 193.80 | 194.10 | Se-Se | 196.18 | 194.47 | Se-Se | ||
| P11 | 200.93 | 197.40 | Ta-Se | |||||
| P12 | 209.14 | 208.88 | Ta-Se | 212.67 | 209.88 | Ta-Se | ||
| P13 | 275.45 | 285.13 | Ta-Se | 277.14 | 284.59 | Ta-Se | ||
| P14 | 291.72 | 301.14 | Ta-Se | 293.86 | 302.94 | Ta-Se | ||
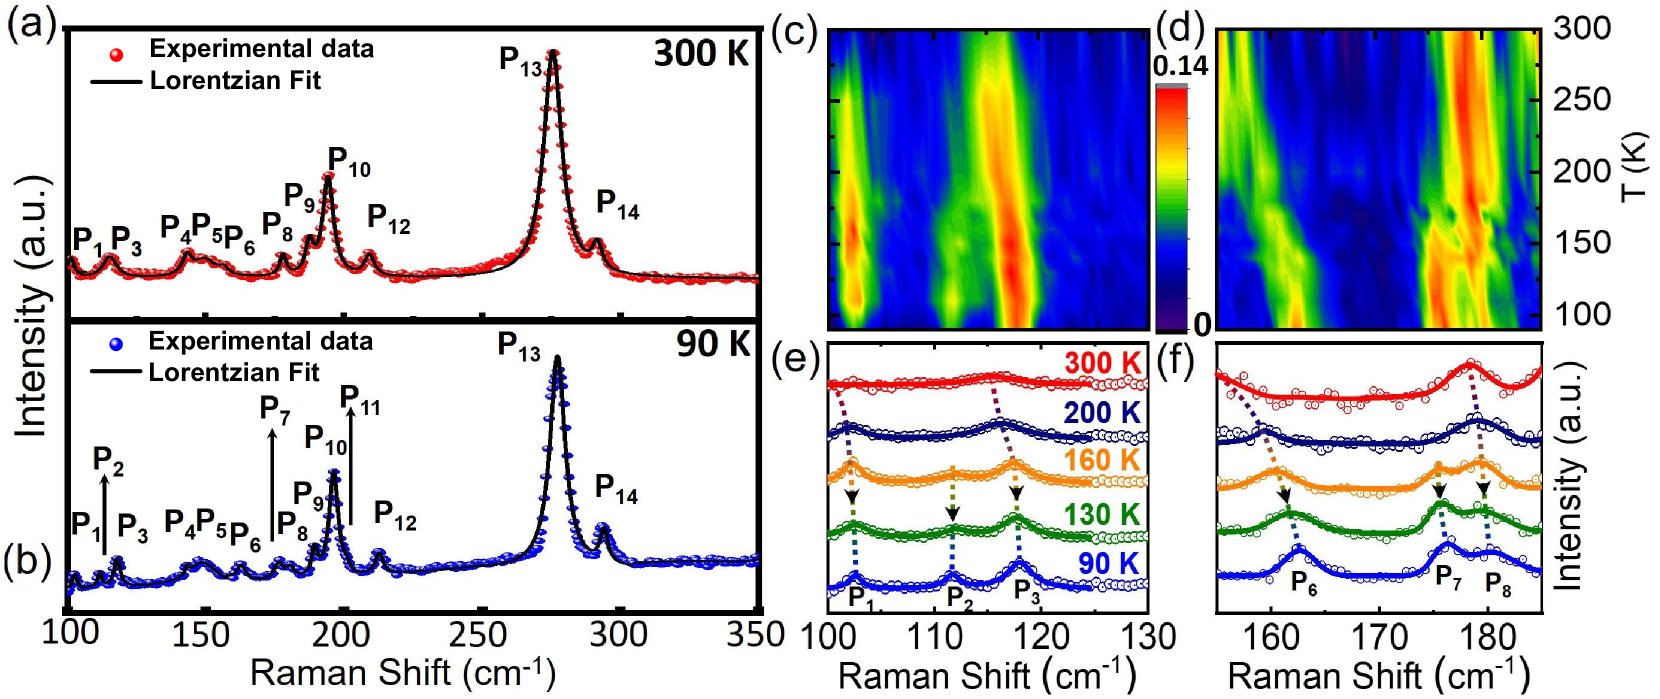
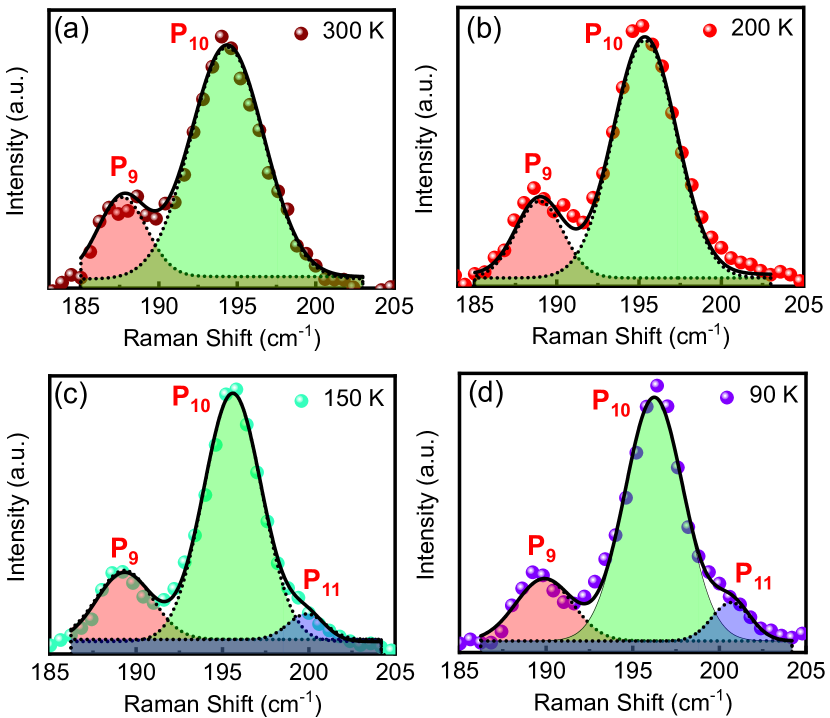
To gain deeper insights into the structural phase transition, temperature-dependent Raman scattering experiments have been carried out on a bulk Crystal of (TaSeI in the temperature range 90 K to 300 K (see raw data in the supplementary section, Fig. S2). Fig. 2(a,b) depicts the representative Raman spectra in the spectral range of 100 cm-1 350 cm-1 at 90 K (LT) and 300 K (RT), respectively. The Raman spectra are fitted with a sum of Lorentzian functions to determine the peak frequency () and line width (FWHM).
The Raman spectrum at 300 K (see Fig. 2(a)) reveal eleven Raman active vibration modes at approximately, 101.58(P1), 115.39(P3), 143.19(P4), 148.42(P5), 156.50(P6), 178.42(P8), 187.47(P9), 193.80(P10), 209.14(P12), 275.45(P13), and 291.72(P14) cm-1. Whereas, Raman spectrum at 90 K shows three additional peaks at 111.53 (P2), 176.40 (P7), and 200.93 (P11) cm-1 (see Fig. 2(b-f)) alongside the modes observed at room temperature. The details of these identified vibration modes, including their mode of symmetry, and origin, are summarized in Table 1. The emergence of these additional Raman-active modes below TS can be attributed to the SPT accompanied by a symmetry-breaking effect [32, 40], as discussed later.
II.3 Temperature evolution of Raman active modes.
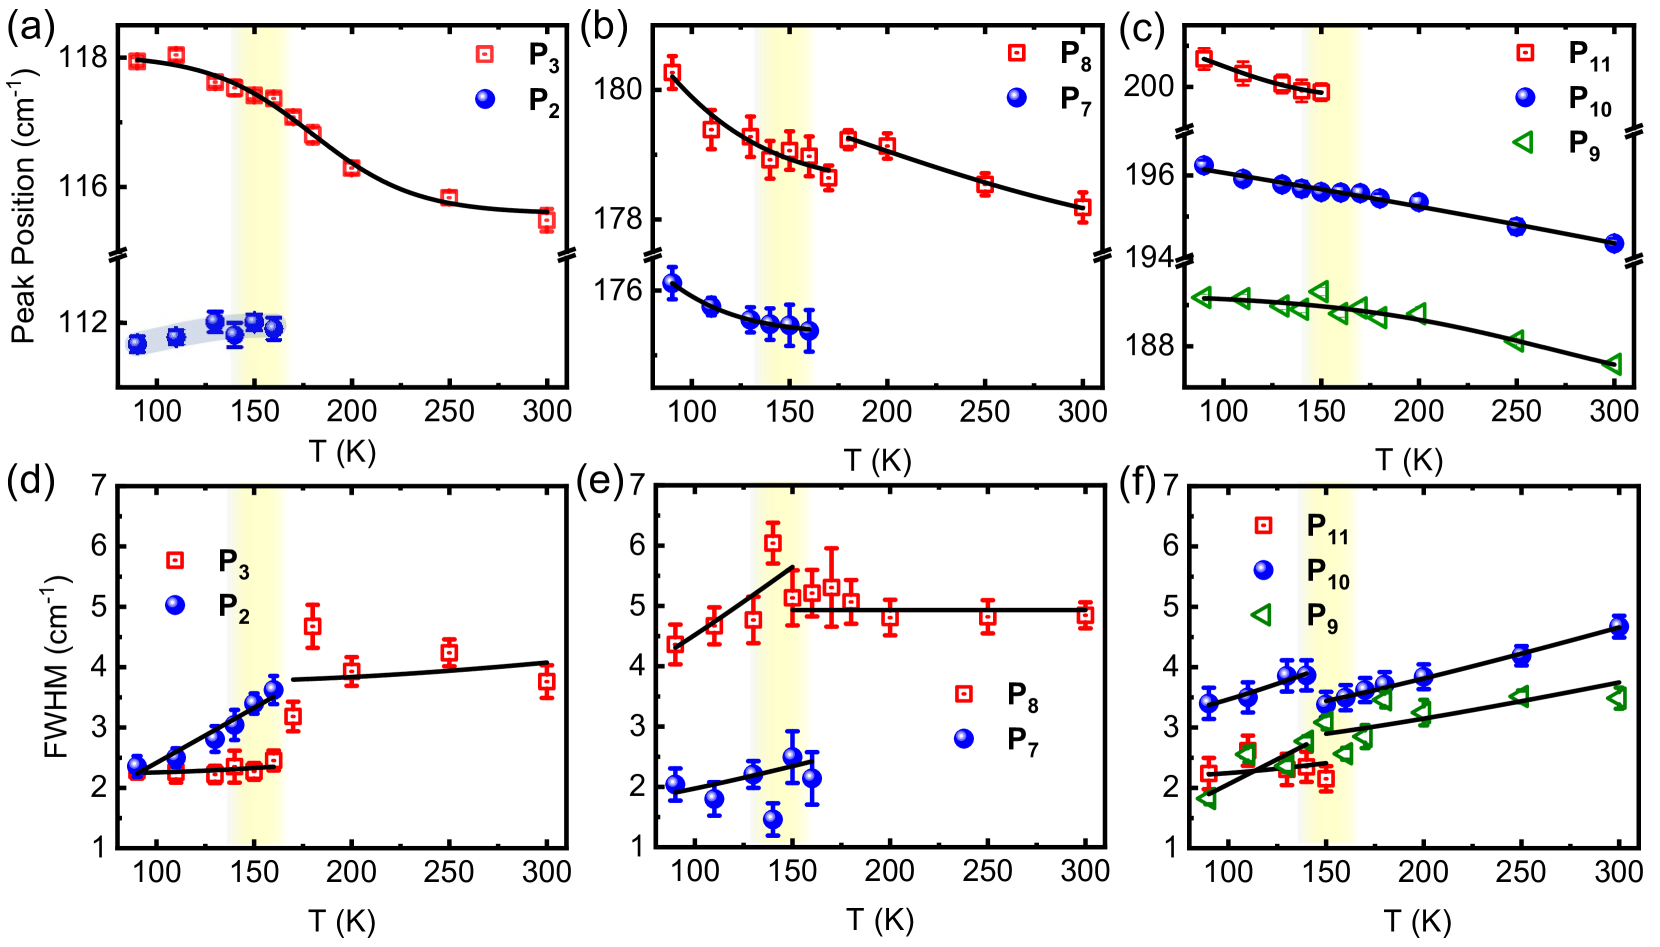
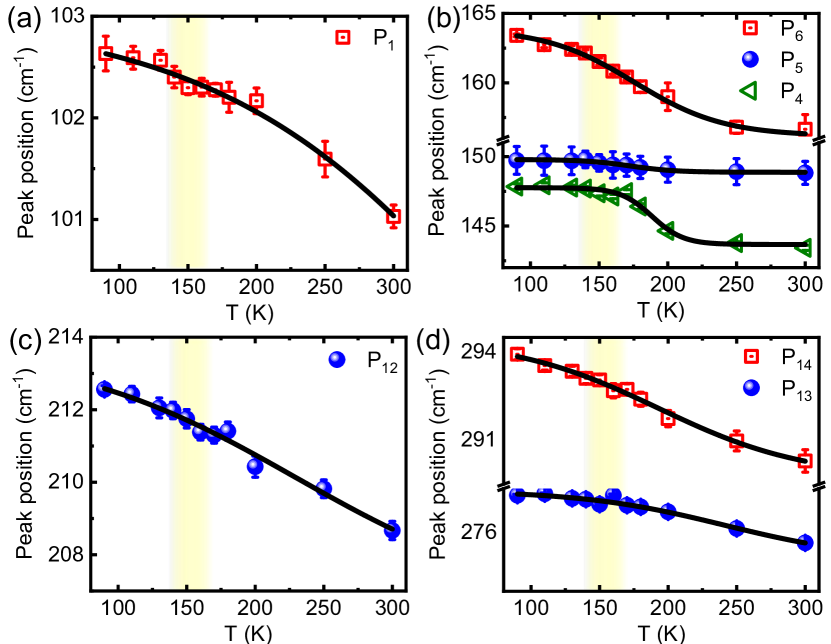
Signatures of structural transition are clearly visible in the temperature dependence of Raman spectra. With decreasing temperature, three additional Raman modes (P2, P7, and P11) appear near the transition suggesting their association with the symmetry of crystal structure as shown in Fig. 3. At around TS, one Raman active mode (labeled as P7) show discrete jumps in the mode frequencies. Except for P2 (discussed later), all the Raman modes show blue shifts, i.e., mode frequency () increases with decreasing temperature (see Fig. 3). Since the phonon modes involve the vibrations of different atoms with varying degrees as well as directions, the amount of the blue shift in each individual mode occurs at different rates and slightly different temperatures. The temperature evolution of Raman active vibration modes is analyzed using the symmetric three-phonon coupling phenomenological model [41],
| (1) |
Here, and represent the top and bottom of the sigmoidal curve, respectively. T0 is the center point and d controls the width of the curve. The results are well described in Fig. 3.
In contrast, the P2 mode shows anomalous redshift, i.e., decreases with decreasing temperature. This anomalous behavior of P2 has been considered as the possible reflection of strong anharmonic phonon-phonon interactions mediated through structural distortion in Ta-chain [42].
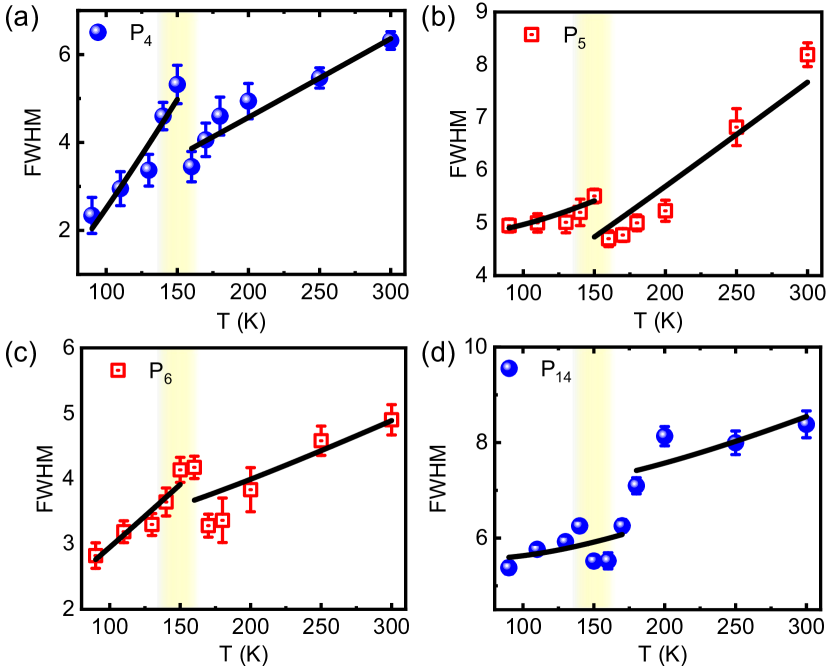
The modes become sharper with decreasing temperature, as shown in Fig. 3(d-f) and Fig. S5. The line widths, i.e., The full width at half maximum (FWHMs), monotonically decrease with decreasing temperature because of increasing phonon lifetime [43]. Interestingly, the FWHMs demonstrate abrupt step-like changes across the transition temperature at TS, indicating a distinct change in the coupling between the lattice and phonon degrees of freedom [40]. The temperature-dependent line width () is described by symmetric three-phonon coupling models [41],
| (2) |
Here, and are the Planck and Boltzmann constants, respectively. The is the speed of light, and T is the temperature. The is the asymptotic value of the linewidth at zero temperature. and are two acoustic phonon modes with different wavenumbers and opposite wavevectors. The observed changes in the characteristics of Raman modes across the phase transition, coupled with the emergence of three new active Raman vibration modes in the low-temperature spectra, provide direct evidence of a SPT occurring at TS.
II.4 Fano asymmetry of Raman spectra: Electron-phonon coupling
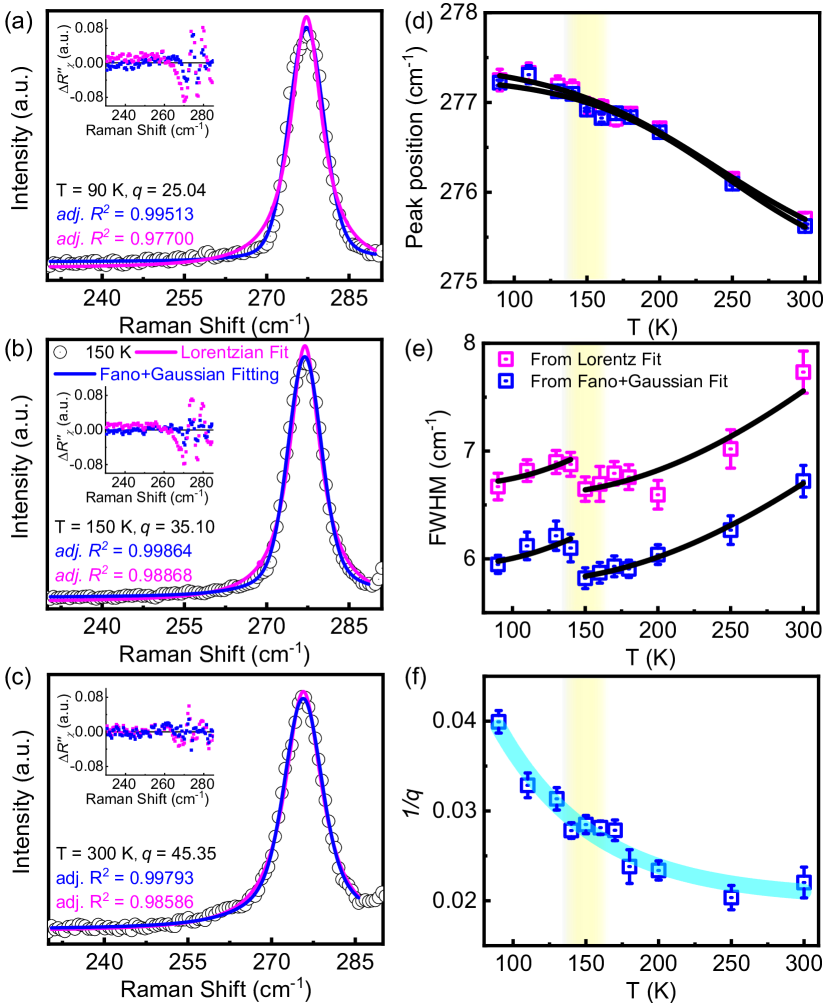
Closer examination of the Raman spectra reveals finer intriguing characteristics of Raman spectra. Notably, the most intense peak, P13 clearly exhibits Fano-shaped asymmetry, which can be attributed to the coupling between the discrete phonon spectra and electronic scattering continuum [44, 45]. To gain a deeper understanding, P13 mode is analyzed using the Fano function, [46]. Here, () = 2(-)/ where is the phonon frequency in the absence of interaction, is the FWHM, and I0 is the intensity. The parameter represents the "Fano" parameter that describes the asymmetry. Additionally, the electron-phonon coupling strength can be inferred from the inverse of the Fano parameter i.e. [47, 45]. To account for the finite spectral resolution, the P13 peak is fitted using the aforementioned Fano profile convolved with a Gaussian function [47]. The comparison between the model fits of the experimental data is presented in Fig. 4(d,e) displays the temperature variation of the phonon frequency , the FWHM and the electron-phonon coupling constant, for the P13 mode. The exponential decay of with temperature signifies that the electron-phonon coupling strength weakens at higher temperatures.
II.5 Identification of Raman active modes
To gain further insights into these Raman modes, such as their symmetry identification and origin, we conducted a group theory analysis of the vibration modes summarized in table 1.
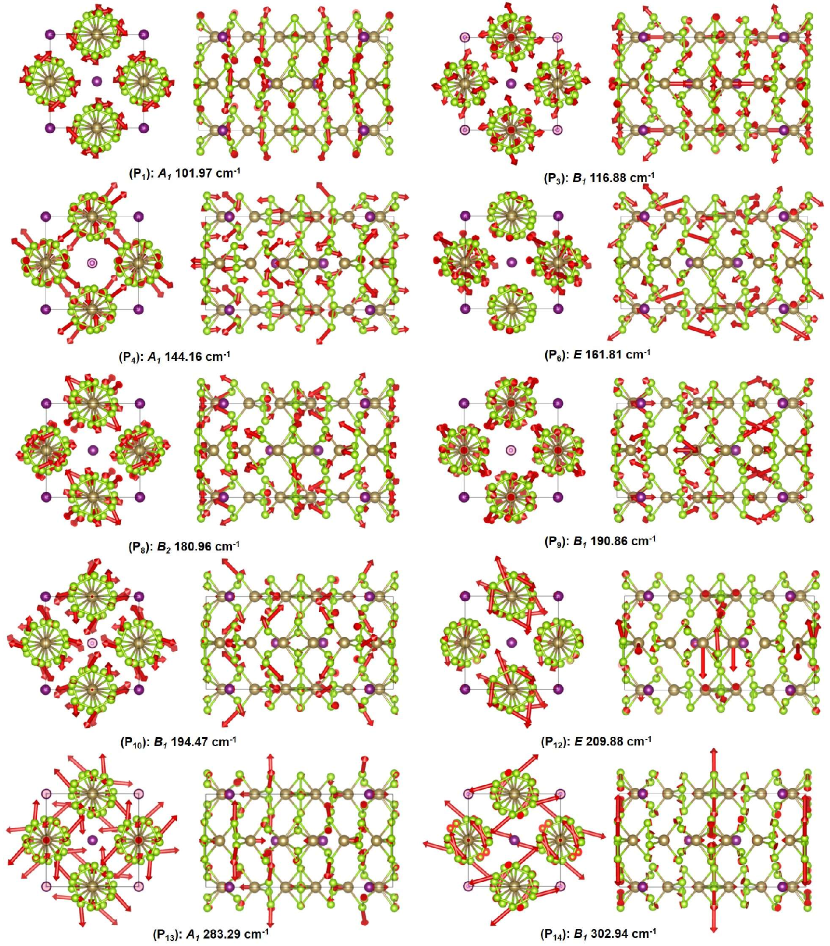
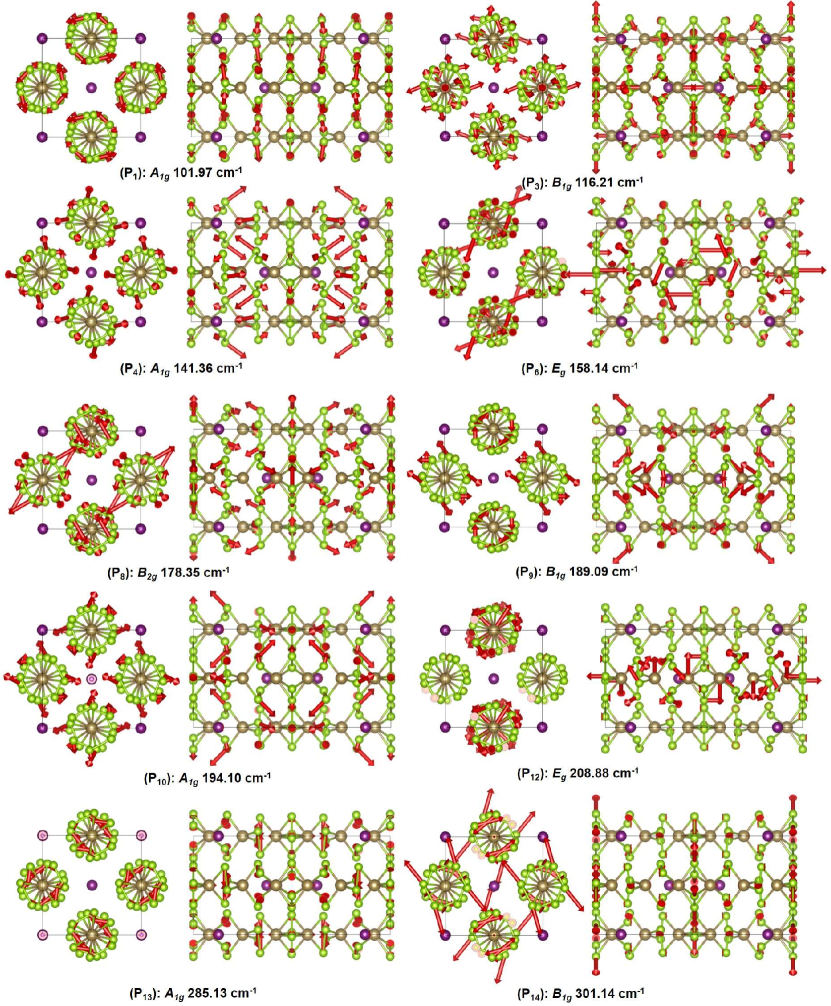
Raman active modes for centrosymmetric structure. The theoretical analysis of the vibration modes for a tetragonal crystal structure with space group: is carried out using lattice dynamics calculations. Since there are 64 () atoms in the unit cell for both structures, the vibrational modes in the centrosymmetric phase differentiate into 192 (3) mechanical representations,. Here, three modes are acoustic modes given by, ( = + ). The remaining 189 modes are optical as given by, ( = 12 + 10 + 13 + 10 + 12 + 10 + 11 + 9 + 27 + 24). Among these optical modes, (10 + 27) are infrared(IR) active and Raman -inactive modes, while (12 + 12 + 11 + 24) shows the reverse characteristics i.e. Raman active, but IR inactive.
Raman active modes for non-centrosymmetric structure. Similarly, the vibrational modes in the non-centrosymmetric phase can be decomposed into 192 mechanical representations, denoted as . Here, the first and second groups of the representation correspond to the acoustic and optical modes. Among optical modes, the IR-active and Raman active modes are 21 + 51, and 22 + 22 + 21 + 51, respectively. Although the total number of vibration modes remains the same, the number of Raman-active modes in the non-centrosymmetric phase (total 167 modes) is found to be much greater than the centrosymmetric phase (total 83 modes). This reflects in the appearance of additional Raman modes in low-temperature Raman spectra as shown in Fig. 2(a,b), which is in very good agreement with the simulated modes presented in Table 1 and described in details in the supplementary section.
II.6 Polarised Raman spectra and Porto’s notation
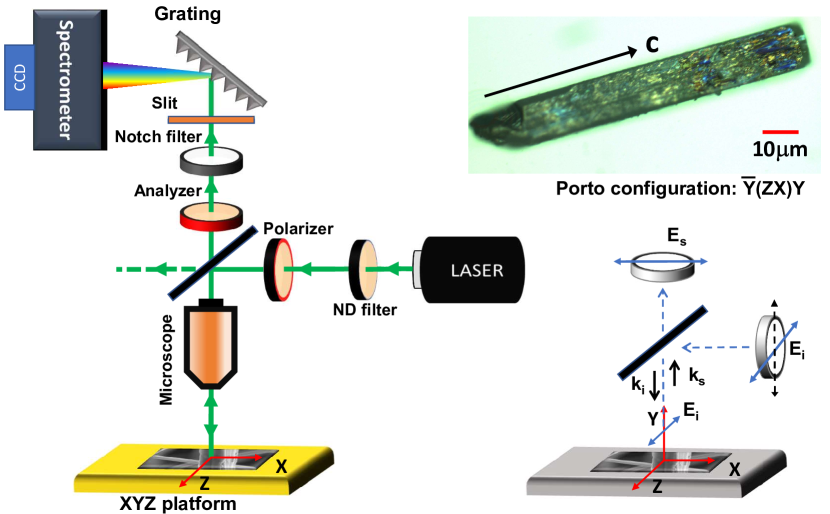
The symmetries of the Raman active modes are identified by polarization-dependent Raman scattering experiments [48]. Based on the theoretical analysis, the selection rules are shown in Table 2 with the help of Porto’s notation (P.N.) backscattering geometry (details can be found in the supplementary section S4). Corresponding to space group, the mode is allowed in the and configurations, while the modes along configuration. The () mode is observable in the configuration. The experimental setup was designed to access the vibrational modes listed in Porto’s notation. To ensure accurate mode assignments based on the selection rules, the polarization of the incident and scattered photons was carefully controlled using a polarizer and analyzer, respectively.
| Porto’s Notiation | Space Group no 117 (RT) | Space Group no 114 (LT) | ||||||
| () | () | () | () | |||||
| Y | Y | N | N | Y | Y | N | N | |
| N | N | N | Y | N | N | N | Y | |
| Y | N | N | N | Y | N | N | N | |
The sample was aligned in such a way that its crystal axis direction was along the propagation of the incident laser. Consequently, the incident laser direction () corresponds to , while the scattered laser direction () corresponds to .To control the polarization direction of the incident light (), we utilized a /2 plate and selected the appropriate configuration. Fig. 5(a,b) summarizes the polarized Raman spectra measured at both 100 K and 300 K. The Raman spectra exhibit seven peaks in the combination originated from the and vibrational modes. By contrast, the configuration exhibited three vibrational modes of , allowing us to distinguish between the two modes. No modes were observed in the configuration, preventing us from identifying any (LO) modes within our experimental range. However, (TO) mode can be present. In that case, a right-angle Raman scattering geometry is needed which is beyond our experimental limit.
Therefore, our polarization-dependent study reveals three and four modes in HT spectra, whereas, in LT (90 K) spectra, we can identify three and five using Porto’s configuration. The newly appeared mode in LT Raman spectra corresponds to the P11 mode. Further details regarding the nature of this P11 mode are discussed later.
II.7 Vibration patterns of Raman modes
The vibration patterns of Raman modes are simulated for two different crystal symmetries. Fig. 6(a-d) depicts the simulated vibrational patterns that are sensitive to breaking the crystal structure’s inversion symmetry. The simulated vibration patterns of the remaining modes are presented in Fig. S10 and S11 in the supplementary section.
II.7.1 Signature of broken inversion symmetry.
Three additional Raman modes P2, P7, and P11 appear below TS as shown in Fig. 3. Symmetry analysis reveals that P2 and P7 belong to the identical irreducible representation of for NC structure, and their corresponding vibration patterns are depicted in Fig. 6(c,d). Though the vibrational patterns of these modes i.e. P2 and P7 above TS remain the same as shown in Fig. 6 (a-d), the corresponding representation of becomes for the crystal structure with an inversion center. As there is inversion symmetry in the RT phase then all the lattice vibrations at the point have either even or odd parity with respect to the inversion center, and the odd ones are Raman-inactive due to selection rules [49]. Hence, this vibrational mode is antisymmetric (i.e. odd parity) with respect to the inversion center and these modes P2 and P7 are now Raman inactive. Therefore, the modes are absent in Raman spectra above TS. Hence, the presence of these modes (P2 and P7) below TS provides direct affirmation of the inversion symmetry-breaking transition in (TaSeI.
II.7.2 Softening of phonon mode, P11
The P11 Raman peak belonging to symmetry, coexists with nearest peaks P10 and P9 at low temperatures as shown in Fig. 2(a) and Fig. S3. The temperature evolution of the P9, P10, and P11 Raman peaks shows that these modes shift to lower frequencies with increasing temperature and the line widths become broader as shown in Fig. 3. As shown in Fig. S3 the intensity of P11 gradually decreases, whereas the intensity of the other two peaks increases with increasing temperature. The behavior of these phonon modes can be explained by the following model. At the point, the P11 is a soft phonon mode associated with the structural transition, whereas P9 and P10 are not sensitive to the structural transition. With increasing temperature, the frequency of the soft mode approaches that of P9 and P10 modes and vanishes above the phase transition.
Fig. 6(e) shows the simulated vibrational pattern of the P11 mode with symmetry, that is antisymmetry with respect to the principle rotational axis and symmetry with respect to other rotational axes. To illustrate this, we have presented the vibrational pattern of Ta atoms of the two nearest chains in Fig. 6(e). The Ta atoms vibrate along the chains.
The movement of Ta(3) atom at low temperature phase change the bond length sequence from -[S-L-L]- to -[S-M-L]-.
Thus, the displacement of Ta atoms is the primary cause of the structural transition in (TaSeI. The disappearance of the P11 phonon mode can be attributed to the displacive nature of this structural transition.
II.8 Theoretical calculations: Nature of phase transition
The symmetry of the phonon-modes is used to trace the Raman active phonon in the LT and RT phases of (TaSeI. RT phase of (TaSeI, being centrosymmetric, have phonon modes that are either of even parity or odd parity. It is found that only odd parity phonon modes are Raman-inactive by applying selection rules. Experimental results show that new phonon modes with the vibrational configuration are present as Raman-inactive modes in the RT phase but become Raman-active in the LT phase. By inspection of the modes, we found that newly arose modes are of odd parity and therefore were not present in RT but present in the LT phase, as it lacks in having inversion point, and the selection rule does allow it to be Raman-active. The selection rule in both phases can be understood by analyzing the character table of the symmetries of the phases (see supplementary section S4).
We can find the nature of the phase transition by tracing the phonon modes with changing temperatures. We have traced each intensity peak in Fig. S2 to guide us in finding the phonon modes that are decreasing in amplitude gradually with the increasing temperature and disappearing near transition temperature (TS). These modes are called soft-phonons [30], and the process mentioned is called softening of the phonon modes. The calculated frequencies of the soft phonons above the transition temperature are imaginary. It signifies that the oscillation of atoms relating soft modes seized to oscillate as there is no restoring force regarding the old equilibrium position, and the force generated from small oscillation with respect to an old equilibrium point shifts the atom further till the new equilibrium position is reached. The starting and final structures in this process differ in structure and symmetry. The above process can solely be driven by temperature alone and described by phenomenological modeling using Landau’s theory of phase-transition of the second kind. Apart from dynamics, SPT can be of first order with the sudden disappearance of phonon mode [11, 7, 8, 9].
various complex processes can drive the softening of the phonon. One such scenario is when the electron-phonon coupling is of significant strength to renormalize the bare phonon frequencies and thus soften them. The resultant dip in the phonon branch is called the Kohn anomaly. If the electron-phonon coupling strength, along with electron-electron correlation, becomes significant enough to reduce the value of the phonon frequency to zero, it can induce a SPT by the process mentioned earlier. Peierls transition in 1D metal [53, 54, 55] goes through each step to form a charge density wave(CDW)insulator[56, 57, 58]. Theoretical calculation of the temperature dependency of the Lindhard function can shed light on this transition. In quasi 1D-metals, such transitions are well reported and assigned to sharp peaks in charge-charge correlation or Lindhard function[55] as an indicator of charge correlation. It implies that charges can rearrange themselves with little or no outside potential as impetus. Though a sharp peak in charge-charge correlation alone can induce a commensurate or in-commensurate charge distribution by rearranging the electronic charge, but may not result in affecting the crystal structure. Lacking electron-phonon coupling can be the reason for such transitions. The transitions may not follow every cause-effect chain in real metals as in the 1D Peierls model.
Lack of gradually vanishing modes in Raman spectra along with the experimentally determined arbitrary displacement direction (specifically, along the c-axis), as calculated in the ISOTROPY suite[4, 6] for possible second-order transition, help to assign the transition to be first order. Indeed the disappearance of P11 mode indicates first-order phase transition. To model the free energy functional for first-order phase transition, we take displacement() of the Ta+5 ion (Ta(3)in Fig-7) along the Ta-Ta chain as our order parameter. The second-order phase transition is clearly an event of dynamical instability originating from the vanishing soft phonon and therefore vanishing restoring force. Although it is not the only way to have a displacive phase transition. A first-order phase transition may occur because of thermodynamic instability[11, 7]. Free energy expression, in our case,
| (3) |
: displacement of Ta(3) atom, : stain coupling (thorough discussion on the choice of functional in supplementary). The sign of the quartic term in the above plays a crucial role in determining the nature of phase transition. The above expression is constructed from invariant monomials [2, 3](listed in supplement) of point group(D4h) of the RT phase crystal, therefore invariant under the action of every element of D4h. As we can see, the coefficient of the anharmonic quartic term plays a central role. For the stability argument, we have added term, the physics played by anharmonicity of a phonon(phonon-phonon interaction) is of a substantial amount. Blue shifting of peak P2 mode confirms it as shown Fig. 3.
The coefficient of the quartic term consists of strain coupling parameters. Without strain coupled with the displacive transition, the nature of it will be of second order[7]. The Fermi surface of the LT structure is calculated (without relaxation) and shows the presence of nesting. The competitive interplay of charge ordering with other events occurring during displacement can cause the strain coupling with the transition by the reason mentioned above. By analyzing the experimental data and comparing it with first-principles calculations, it is found highly intriguing events such as strain, forces acting against possible charge order, strong electron-phonon coupling, and anharmonicity playing in a single arena induce such phase transition.
III Summary and Conclusion
Our study provides compelling evidence of inversion symmetry breaking in the quasi-1D system (TaSe4)3I based on the temperature-dependent evolution of phonon mode characteristics. The unique structural distortion of the Ta-chains leads to the breaking of inversion symmetry at T 141 K, as evidenced by the thermal variation of self-energy parameters of phonon modes. Through polarization-dependent Raman scattering combined with theoretical analysis, we have successfully identified two distinct Raman modes (P2 and P7) that unambiguously confirm the absence of inversion symmetry in the low-temperature crystal structure. Additionally, the identification of the P11 mode as a soft phonon mode that abruptly disappears above the transition temperature strongly suggests a first-order nature of the structural phase transition. The Fano asymmetry revealed considerable coupling between phonon modes and electronic degrees of freedom. By First principles phonon calculations along with symmetry analysis, it is found that anharmonicity, minimal strain coupling and electron-phonon interaction are the reason for the first-order phase transition. Our findings offer a comprehensive study of inversion symmetry breaking in a quasi-1D system through phonon mode renormalization and will stimulate further research into the role of symmetry in collective lattice dynamics, including CDW condensates.
IV Acknowledgements
This work was supported by the (i) ’Department of Science and Technology, Government of India (Grant No. SRG/2019/000674 and EMR/2016/005437), and (ii) Collaborative Research Scheme (CRS) project proposal(2021/CRS/59/58/760). A.B. thanks CSIR Govt. of India for Research Fellowship with Grant No. 09/080(1109)/2019-EMR-I. M.M., A.B., and P.S.R. acknowledge support from Ms. Surabhi Saha for theoretical calculations and inputs. Finally, the authors would like to acknowledge Prof. Tanusri Saha-Dasgupta for the effective discussions and feedback.
The authors declare no competing financial interests.
V Method
(TaSeI Single Crystal Growth: For this study, (TaSeI single crystals were grown by the chemical vapor transport (CVT) method. Ta (Alfa Aeser, purity 99.97%) and Se (Alfa Aeser, purity 99.999%) powders were combined with iodine pieces (Alfa Aeser, 99.0%) in a stoichiometric ratio and ground together into a fine powder. The resulting powder was loaded into a vacuum-sealed quartz tube. The tube was then placed in a two-zone furnace for one week, maintained at temperatures of 400C and 500C. Hair/fiber-like single crystals were grown along random directions. After cooling to room temperature, the crystals (silver/grey) were collected as a lump of fiber wool by breaking the quartz tube in the air at room temperature ( 300 K). The material is stable under ambient conditions. A schematic representation of the CVT method can be found in the supplementary section.
Morphology: To confirm the crystal morphology at room temperature (RT), we employed a high-vacuum scanning electron microscope (SEM) manufactured by JEOL (model LSM-6500). This state-of-the-art equipment allowed us to obtain high-resolution images of the crystals, providing valuable insights into their shape and structure.
Electronic transport measurements were carried out in standard four-probe technique on a few ribbon-like oriented single crystals using a "Keithley 2450 source meter" combined with "Keithley 2182A nanovoltmeter" in Cryogenics 16 Tesla measurement system.
Raman spectroscopy measurement: Raman measurement at room temperature was performed using a 532 nm laser excitation in Horiba T64000 Raman spectrometer (with spot size 1 m).
For temperature-dependent Raman spectra, we used a liquid N2 flow cryostat to measure the sample in the range of 85 to 300 K. we carried out polarized Raman spectroscopy to detect the symmetry-resolved excitations of lattice vibrations. (the schematic is shown in the supplementary section S5 and Fig. S7).
First-principles calculations were performed within the framework of the density functional theory (DFT) as implemented in QUANTUM ESPRESSO [63] and PHONOPY software [64] using () primitive cell to calculate phonon frequencies at zone-center. The ultra-soft potential is used in DFT to calculate the force constants and passed to PHONOPY to calculate the dynamical matrix. The distortion configuration of each relevant mode is visualized first and assigned with proper symmetry.
Data availability. The data that support the findings of this study are available from the corresponding author upon reasonable request.
References
- Rodin et al. [2020] A. Rodin, M. Trushin, A. Carvalho, and A. H. Castro Neto, Collective excitations in 2d materials, Nature Reviews Physics 2, 524 (2020).
- Stringari [1996] S. Stringari, Collective excitations of a trapped bose-condensed gas, Phys. Rev. Lett. 77, 2360 (1996).
- Goldstone et al. [1962] J. Goldstone, A. Salam, and S. Weinberg, Broken symmetries, Phys. Rev. 127, 965 (1962).
- Keimer and Moore [2017] B. Keimer and J. E. Moore, The physics of quantum materials, Nature Physics 13, 1045 (2017).
- Du et al. [2021] L. Du, T. Hasan, A. Castellanos-Gomez, G.-B. Liu, Y. Yao, C. N. Lau, and Z. Sun, Engineering symmetry breaking in 2d layered materials, Nature Reviews Physics 3, 193 (2021).
- Sato and Ando [2017] M. Sato and Y. Ando, Topological superconductors: a review, Reports on Progress in Physics 80, 076501 (2017).
- Mondal et al. [2012] M. Mondal, B. Joshi, S. Kumar, A. Kamlapure, S. C. Ganguli, A. Thamizhavel, S. S. Mandal, S. Ramakrishnan, and P. Raychaudhuri, Andreev bound state and multiple energy gaps in the noncentrosymmetric superconductor bipd, Phys. Rev. B 86, 094520 (2012).
- Smidman et al. [2017] M. Smidman, M. B. Salamon, H. Q. Yuan, and D. F. Agterberg, Superconductivity and spin–orbit coupling in non-centrosymmetric materials: a review, Reports on Progress in Physics 80, 036501 (2017).
- Armitage et al. [2018] N. P. Armitage, E. J. Mele, and A. Vishwanath, Weyl and dirac semimetals in three-dimensional solids, Rev. Mod. Phys. 90, 015001 (2018).
- Morimoto and Nagaosa [2016] T. Morimoto and N. Nagaosa, Chiral anomaly and giant magnetochiral anisotropy in noncentrosymmetric weyl semimetals, Phys. Rev. Lett. 117, 146603 (2016).
- Zhu et al. [2015] H. Zhu, Y. Wang, J. Xiao, M. Liu, S. Xiong, Z. J. Wong, Z. Ye, Y. Ye, X. Yin, and X. Zhang, Observation of piezoelectricity in free-standing monolayer mos2, Nature Nanotechnology 10, 151 (2015).
- Cheong and Mostovoy [2007] S.-W. Cheong and M. Mostovoy, Multiferroics: a magnetic twist for ferroelectricity, Nature Materials 6, 13 (2007).
- Shi et al. [2013] Y. Shi, Y. Guo, X. Wang, A. J. Princep, D. Khalyavin, P. Manuel, Y. Michiue, A. Sato, K. Tsuda, S. Yu, M. Arai, Y. Shirako, M. Akaogi, N. Wang, K. Yamaura, and A. T. Boothroyd, A ferroelectric-like structural transition in a metal, Nature Materials 12, 1024 (2013).
- Senthil [2015] T. Senthil, Symmetry-protected topological phases of quantum matter, Annual Review of Condensed Matter Physics 6, 299 (2015), https://doi.org/10.1146/annurev-conmatphys-031214-014740 .
- Qi et al. [2008] X.-L. Qi, T. L. Hughes, and S.-C. Zhang, Topological field theory of time-reversal invariant insulators, Phys. Rev. B 78, 195424 (2008).
- Fu and Kane [2007] L. Fu and C. L. Kane, Topological insulators with inversion symmetry, Phys. Rev. B 76, 045302 (2007).
- Grüner [1988] G. Grüner, The dynamics of charge-density waves, Reviews of modern physics 60, 1129 (1988).
- Favre-Nicolin et al. [2001] V. Favre-Nicolin, S. Bos, J. E. Lorenzo, J.-L. Hodeau, J.-F. Berar, P. Monceau, R. Currat, F. Levy, and H. Berger, Structural evidence for ta-tetramerization displacements in the charge-density-wave compound from x-ray anomalous diffraction, Phys. Rev. Lett. 87, 015502 (2001).
- Gressier et al. [1984a] P. Gressier, A. Meerschaut, L. Guemas, J. Rouxel, and P. Monceau, Characterization of the new series of quasi one-dimensional compounds(mx4)ny (m =nb, ta; x =s, se; y =br, i), Journal of Solid State Chemistry 51, 141 (1984a).
- Gressier et al. [1984b] P. Gressier, M. H. Whangbo, A. Meerschaut, and J. Rouxel, Electronic structures of transition-metal tetrachalcogenides (mse4)ni (m = nb, ta), Inorganic Chemistry 23, 1221 (1984b).
- Kwok and Brown [1989] R. S. Kwok and S. E. Brown, Thermal conductivity of the charge-density-wave systems and (i near the peierls transition, Phys. Rev. Lett. 63, 895 (1989).
- Tournier-Colletta et al. [2013] C. Tournier-Colletta, L. Moreschini, G. Autès, S. Moser, A. Crepaldi, H. Berger, A. L. Walter, K. S. Kim, A. Bostwick, P. Monceau, E. Rotenberg, O. V. Yazyev, and M. Grioni, Electronic instability in a zero-gap semiconductor: The charge-density wave in , Phys. Rev. Lett. 110, 236401 (2013).
- Sherwin et al. [1984] M. Sherwin, R. Hall, and A. Zettl, Chaotic ac conductivity in the charge-density-wave state of i, Phys. Rev. Lett. 53, 1387 (1984).
- Gooth et al. [2019] J. Gooth, B. Bradlyn, S. Honnali, C. Schindler, N. Kumar, J. Noky, Y. Qi, C. Shekhar, Y. Sun, Z. Wang, B. A. Bernevig, and C. Felser, Axionic charge-density wave in the weyl semimetal (tase4)2i, Nature 575, 315 (2019).
- Li et al. [2021] X.-P. Li, K. Deng, B. Fu, Y. Li, D.-S. Ma, J. Han, J. Zhou, S. Zhou, and Y. Yao, Type-iii weyl semimetals: , Phys. Rev. B 103, L081402 (2021).
- Shi et al. [2021] W. Shi, B. J. Wieder, H. L. Meyerheim, Y. Sun, Y. Zhang, Y. Li, L. Shen, Y. Qi, L. Yang, J. Jena, P. Werner, K. Koepernik, S. Parkin, Y. Chen, C. Felser, B. A. Bernevig, and Z. Wang, A charge-density-wave topological semimetal, Nature Physics 17, 381 (2021).
- Mu et al. [2021] Q.-G. Mu, D. Nenno, Y.-P. Qi, F.-R. Fan, C. Pei, M. ElGhazali, J. Gooth, C. Felser, P. Narang, and S. Medvedev, Suppression of axionic charge density wave and onset of superconductivity in the chiral weyl semimetal , Phys. Rev. Mater. 5, 084201 (2021).
- Bera et al. [2023] A. Bera, S. Rom, S. K. Pradhan, S. Bera, S. Kalimuddin, T. Saha-Dasgupta, and M. Mondal, Centrosymmetric-noncentrosymmetric structural phase transition in the quasi-one-dimensional compound , Phys. Rev. B 108, 035112 (2023).
- Bera et al. [2021] A. Bera, S. Gayen, S. Mondal, R. Pal, B. Pal, A. Vasdev, S. Howlader, M. Jana, T. Maity, R. Ali Saha, B. Das, B. Satpati, A. Nath Pal, P. Mandal, G. Sheet, and M. Mondal, Superconductivity coexisting with ferromagnetism in a quasi-one dimensional non-centrosymmetric (tase4)3i, arXiv:2111.14525 (2021).
- Venkataraman [1979] G. Venkataraman, Soft modes and structural phase transitions, Bulletin of Materials Science 1, 129 (1979).
- Scott [1974] J. F. Scott, Soft-mode spectroscopy: Experimental studies of structural phase transitions, Rev. Mod. Phys. 46, 83 (1974).
- Zhang et al. [2016] K. Zhang, C. Bao, Q. Gu, X. Ren, H. Zhang, K. Deng, Y. Wu, Y. Li, J. Feng, and S. Zhou, Raman signatures of inversion symmetry breaking and structural phase transition in type-ii weyl semimetal mote2, Nature Communications 7, 13552 (2016).
- De et al. [2021] B. K. De, V. Dwij, M. K. Gupta, R. Mittal, H. Bhatt, V. R. Reddy, and V. G. Sathe, Breaking of inversion symmetry in , Phys. Rev. B 103, 054106 (2021).
- Liu et al. [2018] Y. Liu, Q. Gu, Y. Peng, S. Qi, N. Zhang, Y. Zhang, X. Ma, R. Zhu, L. Tong, J. Feng, Z. Liu, and J.-H. Chen, Raman signatures of broken inversion symmetry and in-plane anisotropy in type-ii weyl semimetal candidate tairte4, Advanced Materials 30, 1706402 (2018).
- Cong et al. [2020] X. Cong, X.-L. Liu, M.-L. Lin, and P.-H. Tan, Application of raman spectroscopy to probe fundamental properties of two-dimensional materials, npj 2D Materials and Applications 4, 13 (2020).
- Krumhansl [1992] J. Krumhansl, Landau models for structural phase transitions: Are soft modes needed?, Solid state communications 84, 251 (1992).
- Sekine and Izumi [1988] T. Sekine and M. Izumi, Successive phase transitions in the linear-chain semiconductor (i studied by raman scattering and electrical resistivity, Phys. Rev. B 38, 2012 (1988).
- Dominko et al. [2016] D. Dominko, S. Vdović, H. Skenderović, D. Starešinić, K. Biljaković, D. Ristić, M. Ivanda, J. E. Lorenzo, and J. Demsar, Static and dynamic properties of low-temperature order in the one-dimensional semiconductor , Phys. Rev. B 94, 104113 (2016).
- Ikari and Levy [1985] T. Ikari and F. Levy, Raman spectra of (nbse4)3i and (tase4)2i single crystals, Journal of Physics C: Solid State Physics 18, L1109 (1985).
- Gao et al. [2018] J. J. Gao, J. G. Si, X. Luo, J. Yan, F. C. Chen, G. T. Lin, L. Hu, R. R. Zhang, P. Tong, W. H. Song, X. B. Zhu, W. J. Lu, and Y. P. Sun, Origin of the structural phase transition in single-crystal , Phys. Rev. B 98, 224104 (2018).
- Menéndez and Cardona [1984] J. Menéndez and M. Cardona, Temperature dependence of the first-order raman scattering by phonons in si, ge, and : Anharmonic effects, Phys. Rev. B 29, 2051 (1984).
- Verma et al. [2022] P. K. Verma, S. Saha, D. V. S. Muthu, S. Singh, R. Suryanarayanan, A. Revcolevschi, U. V. Waghmare, A. K. Sood, and H. R. Krishnamurthy, Experimental and theoretical study of anomalous temperature dependence of phonons in pyrochlore, Phys. Rev. B 106, 144303 (2022).
- Uchiyama et al. [2018] H. Uchiyama, Y. Oshima, R. Patterson, S. Iwamoto, J. Shiomi, and K. Shimamura, Phonon lifetime observation in epitaxial scn film with inelastic x-ray scattering spectroscopy, Phys. Rev. Lett. 120, 235901 (2018).
- Hasdeo et al. [2014] E. H. Hasdeo, A. R. T. Nugraha, M. S. Dresselhaus, and R. Saito, Breit-wigner-fano line shapes in raman spectra of graphene, Phys. Rev. B 90, 245140 (2014).
- Djurdji ć Mijin et al. [2023] S. Djurdji ć Mijin, A. Šolajić, J. Pešić, Y. Liu, C. Petrovic, M. Bockstedte, A. Bonanni, Z. V. Popović, and N. Lazarević, Spin-phonon interaction and short-range order in , Phys. Rev. B 107, 054309 (2023).
- Fano [1961] U. Fano, Effects of configuration interaction on intensities and phase shifts, Phys. Rev. 124, 1866 (1961).
- Zhang et al. [2015] W.-L. Zhang, H. Li, D. Xia, H. W. Liu, Y.-G. Shi, J. L. Luo, J. Hu, P. Richard, and H. Ding, Observation of a raman-active phonon with fano line shape in the quasi-one-dimensional superconductor , Phys. Rev. B 92, 060502 (2015).
- Damen et al. [1966] T. C. Damen, S. P. S. Porto, and B. Tell, Raman effect in zinc oxide, Phys. Rev. 142, 570 (1966).
- Derek.A.Long [2002] Derek.A.Long, The raman effect: A unified treatment of the theory of raman scattering by molecules, (2002).
- Waghmare and Rabe [1997] U. V. Waghmare and K. M. Rabe, Ab initio statistical mechanics of the ferroelectric phase transition in , Phys. Rev. B 55, 6161 (1997).
- Krumhansl and Yamada [1990] J. A. Krumhansl and Y. Yamada, Some new aspects of first-order displacive phase transformations: Martensites, Mater. Sci. Eng., A 127, 167 (1990).
- Krumhansl and Gooding [1989] J. A. Krumhansl and R. J. Gooding, Structural phase transitions with little phonon softening and first-order character, Phys. Rev. B 39, 3047 (1989).
- Sólyom [2008] J. Sólyom, Fundamentals of the Physics of Solids (Springer Berlin, Heidelberg, 2008).
- Zhu et al. [2017] X. Zhu, J. Guo, J. Zhang, and E. W. Plummer, Misconceptions associated with the origin of charge density waves, Advances in Physics: X 2, 622 (2017), https://doi.org/10.1080/23746149.2017.1343098 .
- Johannes and Mazin [2008] M. D. Johannes and I. I. Mazin, Fermi surface nesting and the origin of charge density waves in metals, Phys. Rev. B 77, 165135 (2008).
- Lamago et al. [2010] D. Lamago, M. Hoesch, M. Krisch, R. Heid, K.-P. Bohnen, P. Böni, and D. Reznik, Measurement of strong phonon softening in cr with and without fermi-surface nesting by inelastic x-ray scattering, Phys. Rev. B 82, 195121 (2010).
- Weber et al. [2013] F. Weber, R. Hott, R. Heid, K.-P. Bohnen, S. Rosenkranz, J.-P. Castellan, R. Osborn, A. H. Said, B. M. Leu, and D. Reznik, Optical phonons and the soft mode in 2-nbse2, Phys. Rev. B 87, 245111 (2013).
- Hoesch et al. [2009] M. Hoesch, A. Bosak, D. Chernyshov, H. Berger, and M. Krisch, Giant kohn anomaly and the phase transition in charge density wave , Phys. Rev. Lett. 102, 086402 (2009).
- Stokes et al. [2007] H. T. Stokes, D. M. Hatch, and B. J. Campbell, Isotropy software suite, URL http://stokes. byu. edu/iso/isotropy. php (2007).
- Stokes and Hatch [1984] H. T. Stokes and D. M. Hatch, Group-subgroup structural phase transitions: A comparison with existing tables, Phys. Rev. B 30, 4962 (1984).
- Geilhufe and Hergert [2018] R. M. Geilhufe and W. Hergert, GTPack: A Mathematica Group Theory Package for Application in Solid-State Physics and Photonics, Frontiers in Physics 6, 86 (2018).
- Hergert and Geilhufe [2018] W. Hergert and R. M. Geilhufe, Group theory in solid state physics and photonics: Problem solving with mathematica, (2018), isbn: 978-3-527-41133-7.
- Giannozzi et al. [2009] P. Giannozzi, S. Baroni, N. Bonini, M. Calandra, R. Car, C. Cavazzoni, D. Ceresoli, G. L. Chiarotti, M. Cococcioni, I. Dabo, A. D. Corso, S. de Gironcoli, S. Fabris, G. Fratesi, R. Gebauer, U. Gerstmann, C. Gougoussis, A. Kokalj, M. Lazzeri, L. Martin-Samos, N. Marzari, F. Mauri, R. Mazzarello, S. Paolini, A. Pasquarello, L. Paulatto, C. Sbraccia, S. Scandolo, G. Sclauzero, A. P. Seitsonen, A. Smogunov, P. Umari, and R. M. Wentzcovitch, Quantum espresso: a modular and open-source software project for quantum simulations of materials, Journal of Physics: Condensed Matter 21, 395502 (2009).
- Togo and Tanaka [2015] A. Togo and I. Tanaka, First principles phonon calculations in materials science, Scr. Mater. 108, 1 (2015).
Supplement Materials: Raman signatures of lattice dynamics across inversion symmetry breaking phase transition in quasi-1D compound, \ch(TaSe4)3I
VI Single Crystal growth
The schematic of the crystal growth process using the chemical vapor transport (CVT) technique is shown here, along with the optical picture of the as-grown (TaSe4)3I (TSI3) crystals.
VII Thermal evolution of Raman spectra.
To elucidate the nature of the observed phase transition in TSI3, we plot the intensity (a.u.) color-map of the Raman spectra, as a function of temperature(T) and frequency() (see Fig. 8). The color variation, ranging from red to purple, represents a decrease in sample temperature, T from 300 K to 90 K. Notably, below 160 K (highlighted in red), the P2, P7, and P11 modes become apparent. To provide a clearer visualization of the P11 mode, which emerges at lower temperatures, we have presented the thermal evolution of this specific mode for four distinct temperature points (two above and two below the transition) in Fig. 9. This analysis of the P11 mode allows us to examine its behavior and relationship with the phase transition.
VII.1 Temperature variation of Raman Mode characteristics
The temperature evolution of the full width at half maxima (FWHM) is depicted in Fig. 11. The yellow-shaded regions represent the temperature regime of the phase transition (see Fig. S4 and Fig. 11). Their line widths (FWHMs) monotonically increase with increasing temperature, T along with sudden jumps at around TS. More often in solids at high temperatures phonon-phonon interaction increases, resulting in the lowering of phonon lifetime and increase in line widths with increasing temperature. The sudden upturn of FWHM at around TS strongly suggests an abrupt change in coupling between lattice and phonon degrees of freedom associated with phase transition.
VII.2 Details of Raman modes
The details of the Raman modes simulated from the theoretical calculation are described below and represented in Fig.6 of main text and Fig.S9 and Fig. S10 of supplementary. principle rotational axis presented in Fig.1 of main text.
(i) : Non-degenerate 1D mode, that is symmetric with respect to the principle rotational axis, other rotational axis, mirror plane, and inversion.
(ii) : Non-degenerate 1D mode, which is symmetric with respect to the principle rotational axis (n()), other rotational axes ()), mirror plane (), and anti-symmetric to the inversion ().
(iii) : Non-degenerate 1D mode, which is symmetric to the inversion, principle rotation axis, and anti-symmetric with respect to the rotational axis and mirror plane.
(iv) : Non-degenerate 1D mode, which is symmetric to the principle rotational axis and anti-symmetric with respect to the rotation axis (), mirror plane, and inversion center.
(v) : Non-degenerate 1D mode, which is anti-symmetric with respect to the principle rotational axis and symmetric to mirror plane, inversion center, and other rotational axes ().
(vi) : Non-degenerate 1D mode, which is anti-symmetric with respect to the principle rotational axis, inversion center, and symmetric to mirror plane (m), another rotational axis ().
(vii) : Non-degenerate 1D mode, which is anti-symmetric with respect to any rotational axis (n() or ), mirror plane and symmetric to the inversion center ().
(ix) : Non-degenerate 1D mode, which is anti-symmetric under all symmetry operations (rotation, mirror plane, and inversion center).
(x) : Double-degenerate 2D mode, which is anti-symmetry to inversion.
(xi) : Double-degenerate 2D mode, which is symmetric under inversion.
VIII Polarisation dependent Raman Spectroscopy
VIII.1 Measurement setup
The setup for angle-resolved Raman spectroscopy is depicted in Fig.12 at the beginning the linearly polarised light touches the sample, thereafter the scattered light is passed through a polariser oriented either parallel or perpendicular to the polarisation of the incident beam.
VIII.2 Porto notation
The orientation of the crystal w.r.t the polarization of the laser in both the excitation and analyzing directions; scattering geometry is expressed in this notation, termed as Porto notation (P.N). This notation was first coined by S.P.S. Porto in 1966 [1]. The general representation of Porto notation is,
| (4) |
A = The direction of the propagation of the incident light.(ki)
B = The direction of the polarization of the incident light. (Ei)
C = The direction of the polarization of the scattered light. (Es)
D = The direction of the propagation of the scattered light. (ks)
Example: where implies the photons are incident in the direction and directly back-scattered light is detected along direction. Moreover, the direction of the polarization of the incident and scattered light is along the direction.
IX Group analysis and Landau free energy functional of the phase transition:
Group elements of D4h:
Group elements of D2d:
Bethe to Mulliken( used in GTPack[3] ) to Miller and Love( used in ISOTROPY suite[4]) notation of irredicible representations( irreps):
Checking the invarance of monomial terms, under the action of above irreps, in expansion of upto n=6.
n=1:
n=2:
n=3:
n=4:
n=5:
n=6
From ISOTROPY[4, 5, 6] subgroup calculation, , and modes are related to order parameters(strain/displacement), and only mode causes continuous phase transition. Although mode or B1u mode (h ere P10 peak which can be allowed both in RT as B1u mode and LT as B1 mode by symmetry) appears to be the cause of phase transition, macroscopic strain from mode plays a crucial role here due to its symmetry( strain tensor elements associated to irrep are and ). Continuous phase transition demands gradual softening of the order parameter to zero, not sudden disappearance( in the present case, P10 peak disappears with increasing temperature). Two possible order parameters, one for strain () and another displacive in nature(), can both be present with minimal coupling. Keeping the experimental data in mind, we can have a general landau function considering the displacement of the Ta(3) atom along the Ta-Ta chain, as our order parameter, with elastic strain[7, 8, 9, 10].
where elastic strain is coupled to displacement . As strain is in equilibrium with displacement
putting this value of in the expression of free energy F
We want to scale the order parameter so that the free energy can be cast into a single parameter functional of the order parameter.
and
| (5) |
If and the transition is of first order in nature, if and it is a second-order or continuous one. The strength of the strain coupling parameter () and overall strain() is high enough to surpass the dynamic anharmonic phonon-phonon scattering strength(). Therefore anharmonicity and strain coupling are both needed to have such a first-order phase transition. Such first principle calculation is done For ferroelectric phase transition PbTiO3[11], where in BaTiO3, it is continuous phase transition[12].
X Vibration Symmetry Representations of Raman modes
Here we present Calculated vibration spectra for all the observed corresponding to Raman-active modes (except P2, P6, P11) at RT and LT.
References
- Damen et al. [1966] T. C. Damen, S. P. S. Porto, and B. Tell, Raman effect in zinc oxide, Phys. Rev. 142, 570 (1966).
- Geilhufe and Hergert [2018] R. M. Geilhufe and W. Hergert, GTPack: A Mathematica Group Theory Package for Application in Solid-State Physics and Photonics, Frontiers in Physics 6, 86 (2018).
- Hergert and Geilhufe [2018] W. Hergert and R. M. Geilhufe, Group theory in solid state physics and photonics: Problem solving with mathematica, (2018), isbn: 978-3-527-41133-7.
- [4] D. M. H. H. T. Stokes and B. J. Campbell, Isotropy software suite, iso.byu.edu, .
- Stokes and Hatch [1984a] H. T. Stokes and D. M. Hatch, Group-subgroup structural phase transitions: A comparison with existing tables, Phys. Rev. B 30, 4962 (1984a).
- Stokes and Hatch [1984b] H. T. Stokes and D. M. Hatch, Group-subgroup structural phase transitions: A comparison with existing tables, Phys. Rev. B 30, 4962 (1984b).
- [7] J. Krumhansl, Landau models for structural phase transitions: Are soft modes needed?, 84, 251, a Festschrift Issue of Solid State Communication to Pay Tribute to Professor Ellias Burstein.
- Krumhansl and Yamada [1990] J. A. Krumhansl and Y. Yamada, Some new aspects of first-order displacive phase transformations: Martensites, Mater. Sci. Eng., A 127, 167 (1990).
- Krumhansl and Gooding [1989] J. A. Krumhansl and R. J. Gooding, Structural phase transitions with little phonon softening and first-order character, Phys. Rev. B 39, 3047 (1989).
- Dove [2003] M. Dove, Structure and Dynamics an Atomic View of Materials; chapter-12, (2003), isbn: 0-19-850677-5.
- [11] U. V. Waghmare and K. M. Rabe, Ab initio statistical mechanics of the ferroelectric phase transition in , 55, 6161.
- Ma et al. [2017] Z. Ma, L. Xi, H. Liu, F. Zheng, H. Gao, Z. Chen, and H. Chen, Ferroelectric phase transition of BaTiO3 single crystal based on a tenth order Landau-Devonshire potential, Comput. Mater. Sci. 135, 109 (2017).
- Momma and Izumi [2011] K. Momma and F. Izumi, VESTA 3 for three-dimensional visualization of crystal, volumetric and morphology data, J. Appl. Crystallogr. 44, 1272 (2011).