Emergence of solid-like Debye scaling in the vibrational density of states of liquids under nanoconfinement
Abstract
At frequencies higher than the inverse of the structural relaxation time , the dynamics of liquids display several solid-like properties, including propagating collective shear waves and emergent elasticity. However, in classical bulk liquids, where is typically of the order of 1 ps or less, this solid-like behavior remains elusive in the low-frequency region of the vibrational density of states (VDOS). Here, we provide compelling evidence for the emergent solid-like nature of liquids at short distances through inelastic neutron scattering measurements of the low-frequency VDOS in liquid water and glycerol confined within graphene oxide membranes. In particular, upon increasing the strength of confinement, we observe a transition from a liquid-like VDOS (linear in the frequency ) to a solid-like behavior (Debye law, ) in the range of - meV. Molecular dynamics simulations confirm these findings and reveal additional solid-like features, including propagating collective shear waves and a reduction in the self-diffusion constant. Finally, we show that the onset of solid-like dynamics is pushed towards low frequency along with the slowing-down of the relaxation processes upon confinement, and that the scale at which solidity emerges is qualitatively compatible with k-gap theory and the concept of gapped momentum states. Our results provide a convincing experimental evidence of the continuity between liquids and solids, as originally advocated by Frenkel and Maxwell, and a deeper understanding of the dynamics of liquids across a wide range of length scales.
I Introduction
From a structural point of view, liquids are profoundly different from solids. They do not display long-range order and they cannot be defined using the theoretical concept of spontaneous symmetry breaking and its direct consequences, such as the existence of long-wavelength phonon modes and the elasticity that emerges from thatChaikin and Lubensky (2000). This poses fundamental questions in the description of the low-energy collective dynamics of liquids which are predominantly relaxational, rather than vibrational, and usually described with the theory of hydrodynamicsBoon and Yip (1991).
It comes then as no surprise that the dynamical properties of liquids and solids at large distances and over long timescales – the hydrodynamic regime – are substantially different. To make this distinction more precise, it is instructive to introduce the concept of structural relaxation time , which determines the speed of atomic re-arrangements in a liquid and the extent of the hydrodynamic regime. For bulk water at room temperature is of the order of ps Cunsolo et al. (1999), close to the value for the Maxwell relaxation time Malomuzh and Shakun (2019); O’Sullivan et al. (2019). In the rest of the manuscript, we will use the term low-frequency to indicate the range of energies below the inverse of the structural relaxation time for the bulk liquid, in which we do not expect any solid-like features. This corresponds to an energy of approximately meV for water at room temperature.
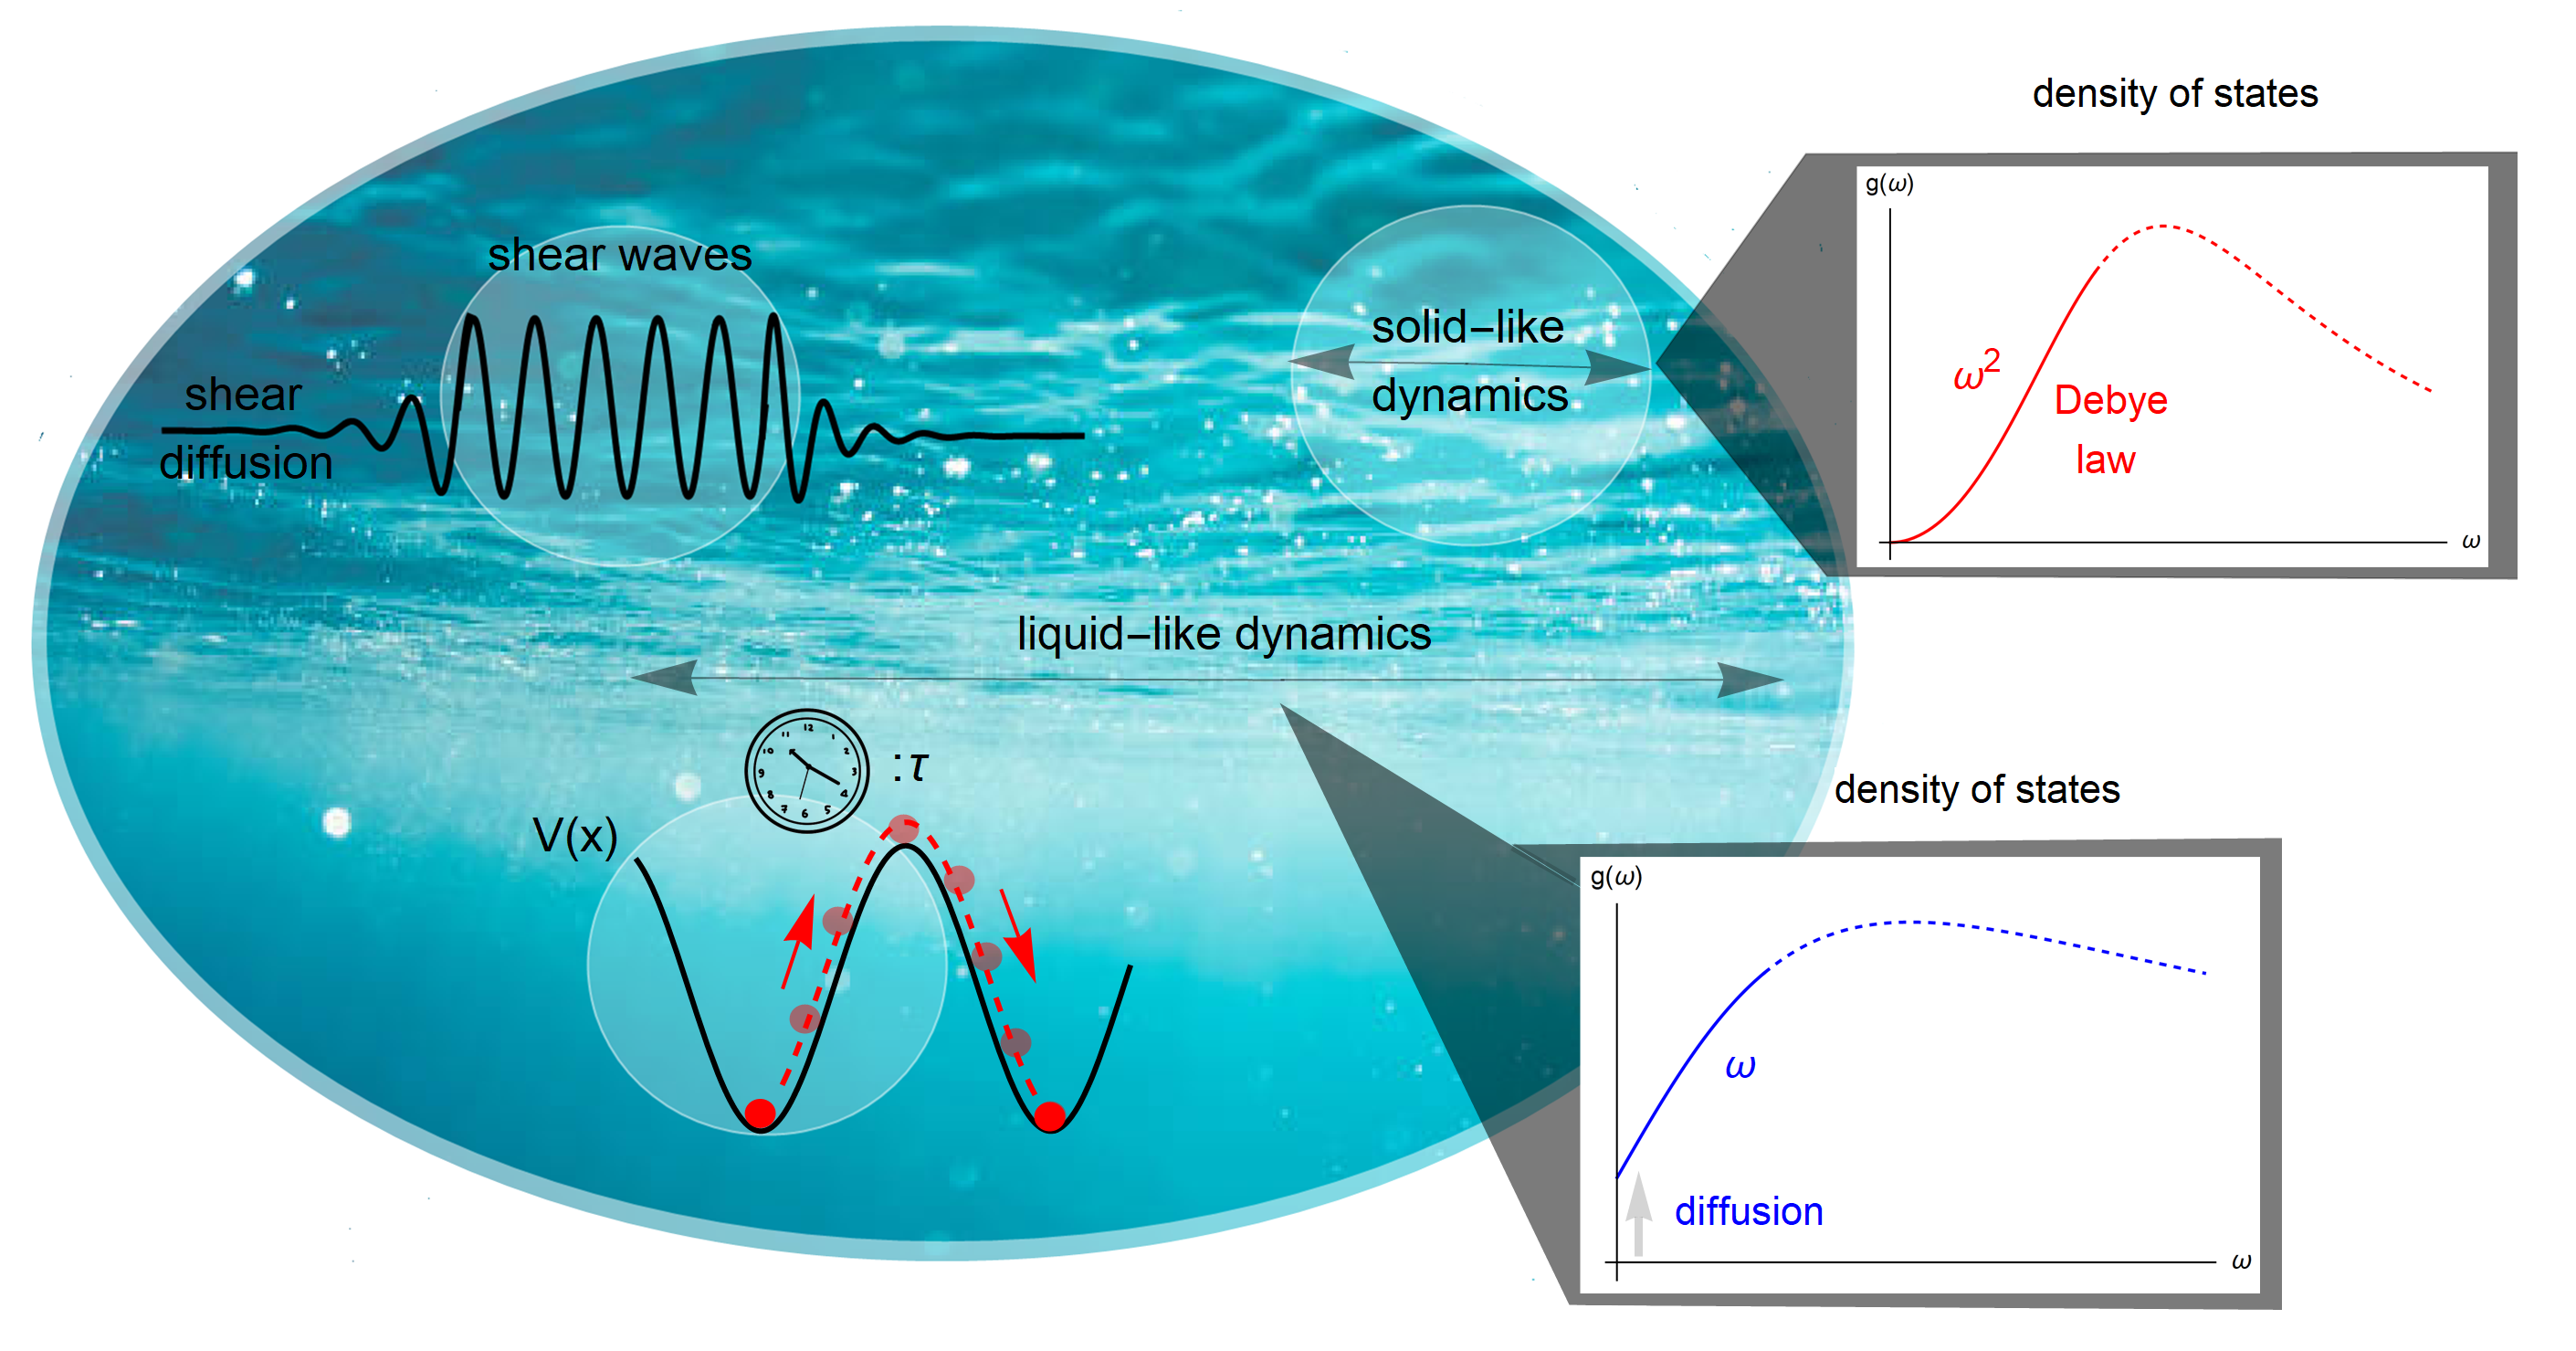
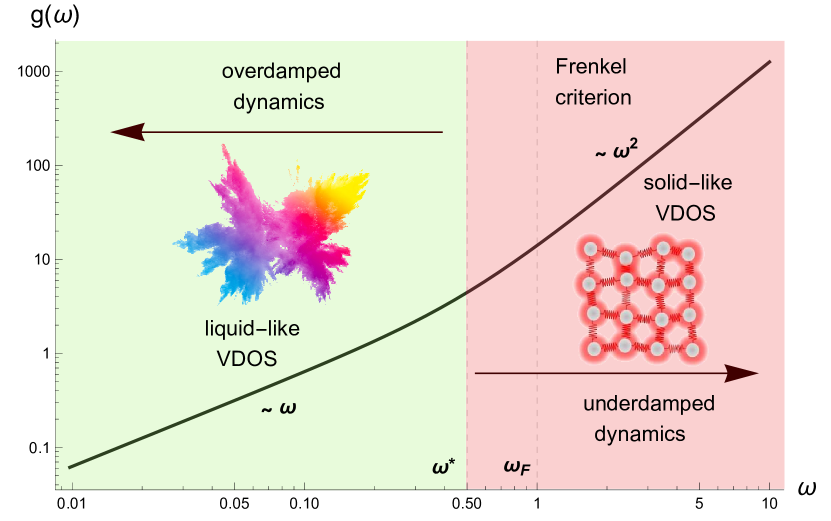
A direct manifestation of the contrast between solids and liquids can be observed in the low-frequency behavior of their vibrational density of states (VDOS), . 3D bulk solids display a characteristic quadratic scaling at low frequency , which is known as the Debye lawKittel (2021). The law indicates that the low-frequency dynamics of solids are governed by collective vibrational and propagating modes known as phonons, which can be identified with the Goldstone modes for the spontaneously broken translational symmetryLeutwyler (1997). On the contrary, the low-frequency VDOS of liquids exhibits two distinctive characteristics. First, the zero frequency value of does not vanish and directly relates to the liquid relaxational dynamics, i.e., a non-zero self-diffusion constantHansen and McDonald (1990). Second, the low-frequency scaling of the VDOS for 3D bulk liquids is linear in frequency, , as derived from theoretical arguments Keyes (1994); Zaccone and Baggioli (2021); Zürcher and Keyes (1997); Wu and Loring (1993); Wan and Stratt (1994); Schirmacher et al. (2022); Keyes et al. (2002); Keyes (2005); Xu et al. (2023), by instantaneous normal mode (INM) simulations Keyes (1994, 1997), and confirmed by neutron scattering experiments Phillips et al. (1989); Dawidowski et al. (2000); Stamper et al. (2022a); Jin et al. (2023); Achibat et al. (1995). For simplicity, in the rest of the manuscript, we will refer to the quadratic Debye behavior as solid-like and to the linear scaling in frequency as liquid-like (see insets in Figure 1). Since the dynamics of liquids for frequencies do not involve any solid-like motion, their VDOS cannot display any Debye-like behavior at low frequency, as experimentally confirmed in Phillips et al. (1989); Dawidowski et al. (2000); Stamper et al. (2022a); Jin et al. (2023); Achibat et al. (1995).
After acknowledging that the low-frequency dynamics of bulk liquids are drastically different from those in solids, a question arises as whether this sharp contrast persists at high frequencies or short scales.
It has been early realized by FrenkelFrenkel (1984) (see also Zwanzig Zwanzig (1967), or the more recent reviews Trachenko and Brazhkin (2015); Baggioli et al. (2020)) that liquid dynamics involve solid-like oscillatory motion around a position of local equilibrium interrupted by diffusive jumps toward different potential minima. These jumps constitute the fundamental origin of fluidity (liquid flow) and they happen at an average rate (see Figure 1), where is the structural Maxwell relaxation time or the average time for a particle to jump out of the cage formed by its neighbors. As a consequence, the dynamics of liquids are expected to be solid-like for frequencies faster than this relaxation rate, , simply because relaxation has no time to take place. In other words, one does expect the appearance of solid-like vibrational modes in the high-frequency dynamics of liquids. This is indeed the case, as reported by many works Copley and Rowe (1974); Hosokawa et al. (2009); Giordano and Monaco (2010); Hosokawa et al. (2015); Simeoni et al. (2010); Scopigno et al. (2005).
Another way to model a continuous transition between a propagating oscillatory frequency behavior and a low-frequency liquid-like collective diffusive dynamics is by using the so-called telegrapher equation, or k-gap theory Baggioli et al. (2020):
| (1) |
where is the asymptotic speed of propagation of the collective waves at , and are respectively the wave-vector and the frequency of the collective mode.
In the expression above, is a timescale governing relaxation processes and expected to decrease with temperature increasing. By using Maxwell interpolation, one can make the assumption of identifying with the Maxwell relaxation time , where and are respectively the shear viscosity and the instantaneous shear modulus Trachenko and Brazhkin (2015); Baggioli et al. (2020). Despite this assumption looking reasonable, a formal derivation of this equivalence does not exist (see discussion in Baggioli et al. (2022)). Only one instance, liquid GaKhusnutdinoff et al. (2020a), has been reported in which this equivalence is quantitatively confirmed. Because of these reasons, at this stage we will consider as an independent parameter which can be extracted from the dispersion relation of gapped shear waves in liquids (see for example Yang et al. (2017)).
Back to Eq.(1), in the low frequency limit, the first term can be neglected and the dynamics is purely diffusive (liquid-like), with macroscopic diffusion constant (not to be confused with the single-particle self-diffusion constant ). In the opposite limit, the second term can be neglected and the dynamics is purely vibrational and solid-like. A more careful analysis reveals still a crucial difference between the large frequency behavior arising from Eq.(1) and the dynamics of phonons in solids. Indeed, expanding the solution of Eq.(1) at large frequency, we obtain a dispersion of the type , whose imaginary part is wave-vector independent and therefore qualitatively different from that of phonons in solids Chaikin and Lubensky (2000) (where at finite temperature and low wave-vector is quadratic in , i.e., Akhiezer damping). This distinction is compatible with the observed broadening of high-frequency solid-like modes in liquids, which arises physically from the distribution of the liquid local structures Giordano and Monaco (2010).
Eq.(1) appears in the description of several physical systemsBaggioli et al. (2020) (e.g., Cattaneo heat conduction equation) and plays a fundamental role in the understanding of the dynamics of collective shear waves in liquids, where it has been relabeled as the k-gap equationTrachenko and Brazhkin (2015). Besides modelling the high-frequency solid-like collective motion in liquids, Eq.(1) presents another striking prediction. In particular, it suggests the existence of shear waves with finite real frequency in liquids above a certain wave-vector cutoff, known as k-gap, and given by . This prediction has been verified in simulations of classical liquidsYang et al. (2017); Khusnutdinoff et al. (2020b); Fomin (2020); Guarini et al. (2023); Yakovlev et al. (2020); Kryuchkov et al. (2020) and plasmasKhrapak et al. (2019); Goree et al. (2012); Murillo (2000); Ohta and Hamaguchi (2000), but experimentally confirmed only in a two-dimensional Yukawa dusty plasma Nosenko et al. (2006). In the literature, it is often claimed that the presence of a k-gap is tantamount to saying that below a critical length-scale , and independently of the value of the frequency, the collective dynamics of liquids is akin to that of solids as it presents propagating shear waves. A more conservative approach requires that the real part of the frequency is at least larger than its imaginary part, or in other words, that the wave is able to propagate over a few wave-lengths before decaying. This second criterion applied to the k-gap equation qualitatively agrees with Frenkel original argument (see Appendix D). This liquid-like to overdamped to propagating dynamics is in perfect agreement with the previous experimental analysis for water presented in Sampoli et al. (1997). There, it has been shown that the dynamics of room temperature water is liquid-like (hydrodynamic) for nm-1 (to be compared with our value for given by nm-1), overdamped in the range nmnm-1, and solid-like above nm-1.
In parallel to this discussion, in recent years there has been intense progress in revealing and understanding the emergent short-scale elasticity of liquids Kume et al. (2021); Zaccone and Noirez (2021); Zaccone and Trachenko (2020), which has ultimately led to the question of where the hydrodynamic limit really isHansen (2021); Baggioli (2021). The solid-like vibrational dynamics at short-scale are obviously connected to the emergence of macroscopic rigidity at short distances. A large part of this research program has been focused on disclosing the solid-like nature of liquids by considering confined systems, and therefore directly probing their short-scale dynamics. Confined liquid systems include liquids in nanoporous materials, droplets, liquid films, and liquids affected by interfacial interactions on the microscopic scale. Under these circumstances, the interactions between atoms or molecules in confined liquids undergo significant changes due to geometric constraints, resulting in distinct manifestations in the VDOS. The effects of confinement on liquid structure, transport and dynamics have been explored in several works, specially for the case of waterTripathy et al. (2019); Calero and Franzese (2020); Li and Riedo (2008); Khan et al. (2010); Corti et al. (2021); Kuo et al. (2023).
In confined liquids, the mechanical relaxation times have been shown to increase dramatically as compared to bulk behaviorKhan et al. (2010). A strong enhancement of the thermal conductivity has also been observed under confinement Frank and Drikakis (2017) and attributed, following Frenkel’s idea Frenkel (1984), to the presence of additional transverse oscillations occurring because of the larger liquid relaxation time. More closely to the topic of this manuscript, the low-energy behavior of the VDOS of confined water has been investigated in Chen et al. (2019) and more recently in Kuo et al. (2023). In Chen et al. (2019) a distinctive difference between fragile confined water, where , and strong water, where , was observed and explained using mode-coupling theory and the idea of a crossover between heteoregeneity dominated dynamics to phonon-like excitations. In Kuo et al. (2023), a reduction of the fraction of unstable instantaneous normal modes and of the diffusion constant as a function of the confinement width, indicating the solid-like emergent dynamics, was reported. More importantly, the low-frequency power-law of the instantaneous normal mode VDOS has been studied as a function of the width and the direction. Interestingly, Kuo et al.Kuo et al. (2023) found that the power-law in the direction of confinement,which is perpendicular to the confinement surface, grows gradually by reducing the width and reaches a value around , close to Debye law.
In summary, despite the effects of confinement on the structure and dynamics of liquids being largely explored in the past, a convincing experimental proof of the emergence of a solid-like collective dynamics under confinement is still missing. Furthermore, it is not yet clear how to connect the emergence of solid-like dynamics in bulk liquids at high-frequency to the same phenomenon in confined liquids at low frequency.
In this work, we employed a combination of inelastic neutron scattering and molecular dynamics simulations to analyze the low-frequency (below meV) VDOS in liquid water and glycerol nano-confined within graphene oxide membranes (GOM). GOM, prepared by the modified Hummer’s method Marcano et al. (2010), have oxidation and hydrophilic interfaces, enabling water and glycerol molecules easy access to the interlayers. Additionally, the sandwich-like structure of GOM, as illustrated in the inset of Figure 2c, provides quasi-two-dimensional spatial confinement for the liquid. These characteristics have made GOM a widely used spatial confinement material for studying confined systems Romanelli et al. (2016); Zhang et al. (2022). Inelastic neutron scattering has been widely used to investigate the vibrational density of states (VDOS) in liquids and solids Frick et al. (2005); Stamper et al. (2022b); Buchsteiner et al. (2006); Yu et al. (2022); Trouw and Price (1999).
Utilizing such experimental techniques, we provide compelling evidence of the evolution of the scaling for the low-frequency VDOS in these two systems from a linear to quadratic Debye-like behavior by decreasing the confinement size. The validation of this phenomenon in two different systems suggests that emergent solid-like vibrational modes induced by confinement may be a universal feature of confined liquids, consistent with the observation of elastic response previously reported in the literature Gao et al. (2007); Ortiz-Young et al. (2013a). Various microscopic quantities of the liquids, including current correlation functions, transverse and longitudinal wave dispersions, and self-diffusion constants are analyzed in order to characterize this finding in more detail. Exploiting qualitative arguments based on the k-gap theory Baggioli et al. (2020), we attribute the emergence of solid-like VDOS to the slowing down of relaxation processes under nanoconfinement, which corroborates the original perspective of liquid dynamics by Frenkel and Maxwell.
II Experimental results
Using inelastic neutron scattering, we measured the vibrational density of states (VDOS) of water confined within GOM at K and glycerol confined within GOM at K, for various confinement sizes. More details regarding sample preparation and experimental methods are provided in Appendix A. See also Yu et al. (2022); Zhang et al. (2022) for a similar setup.
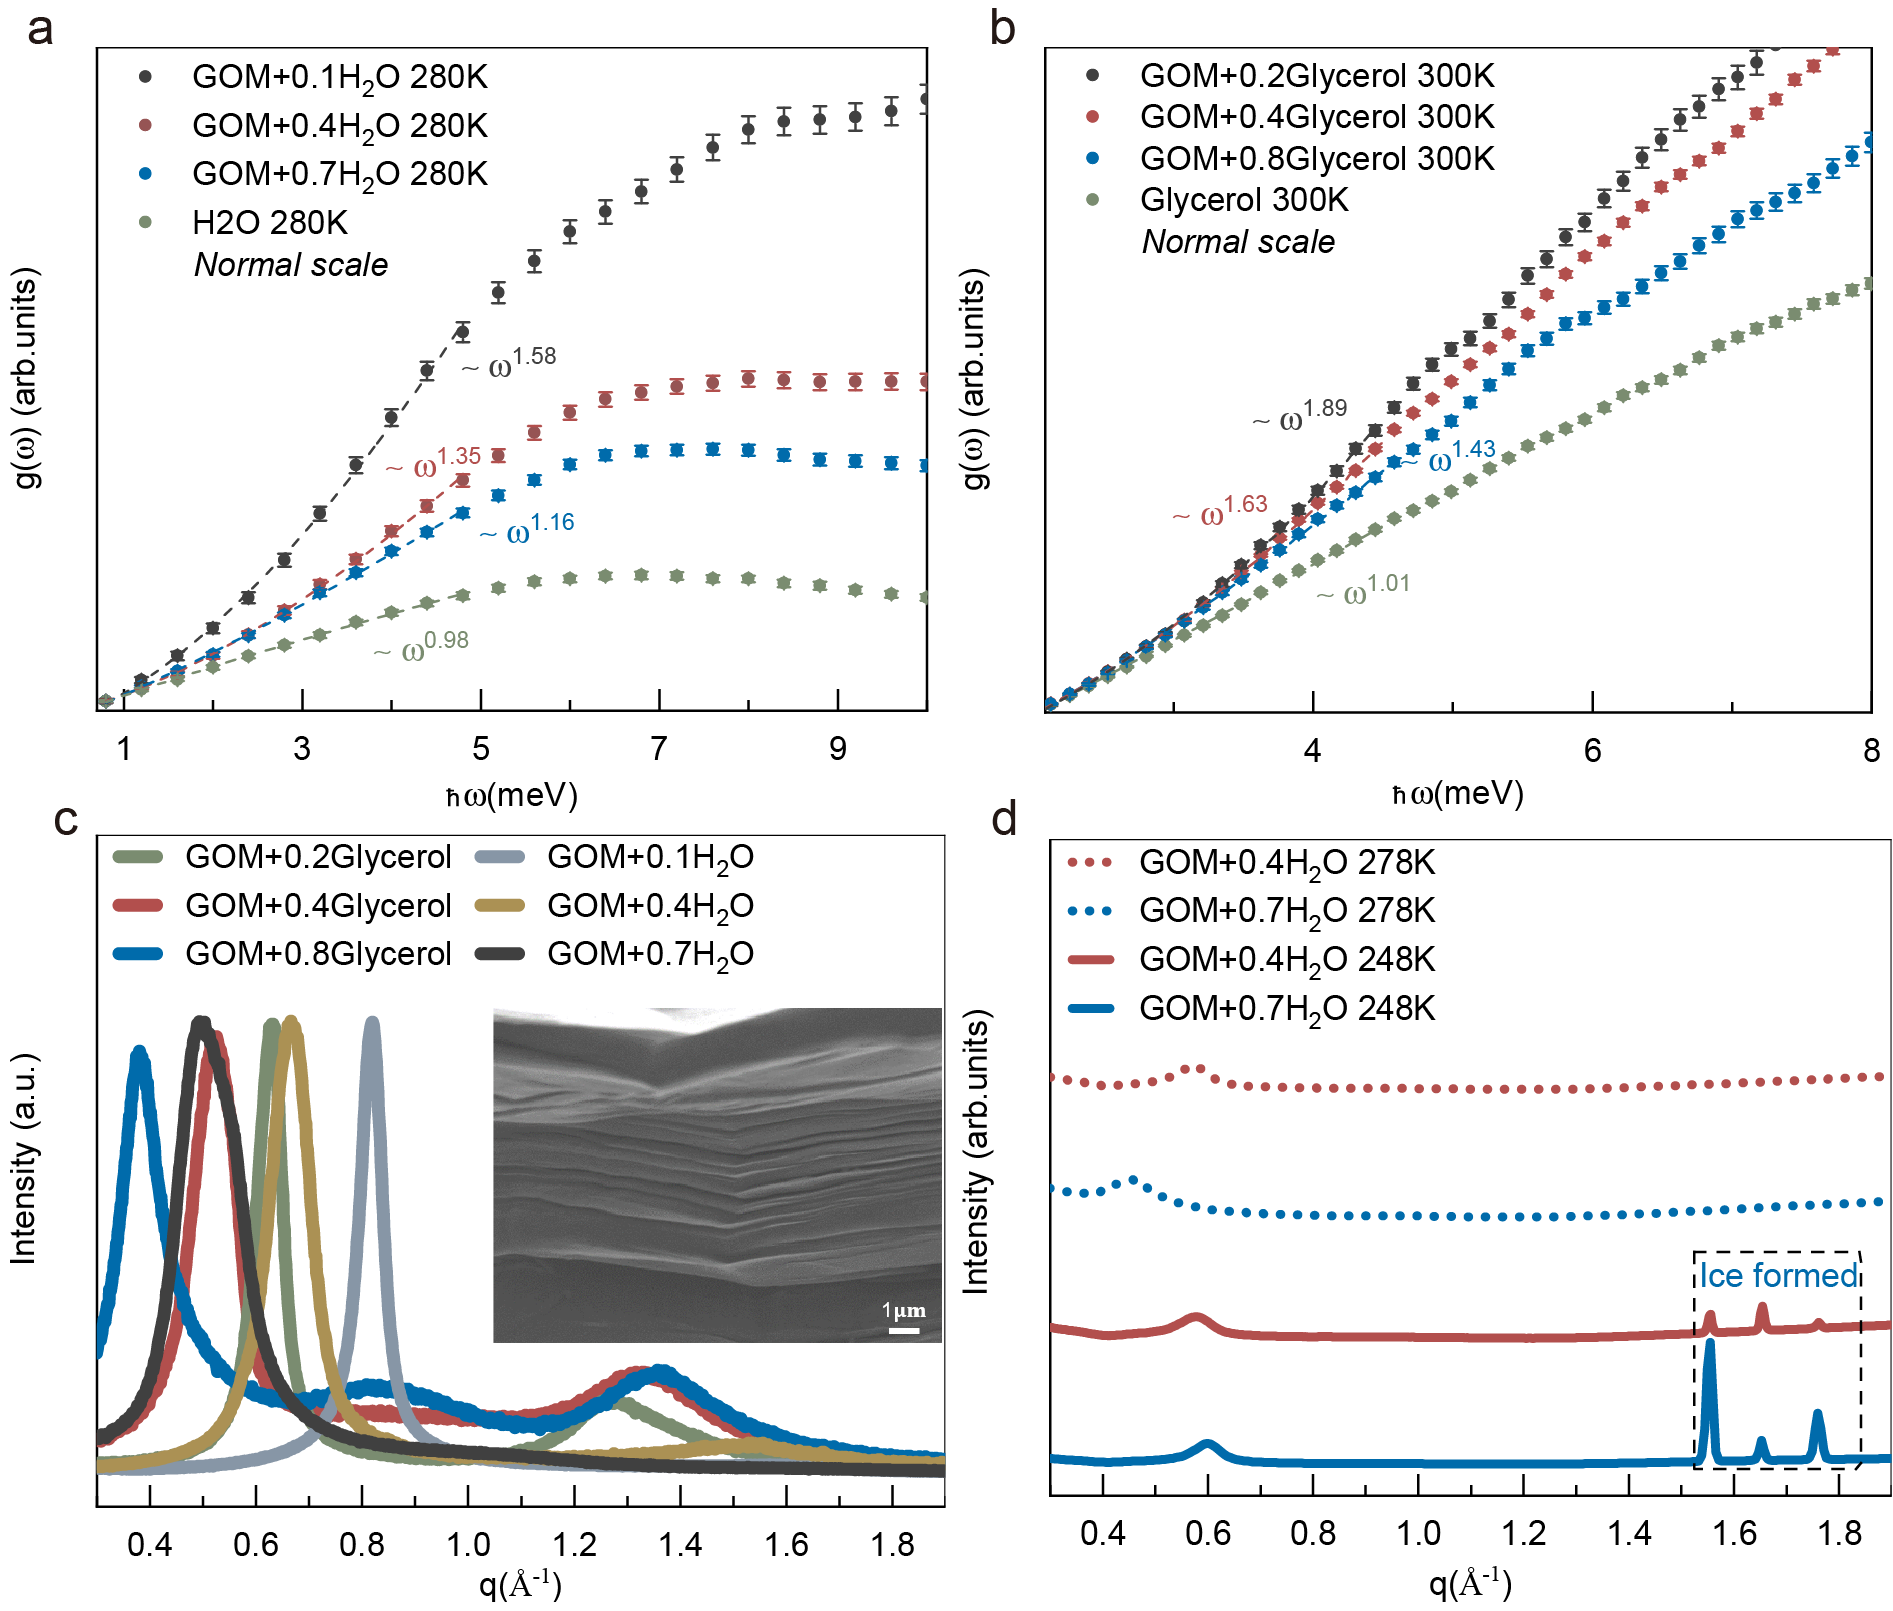
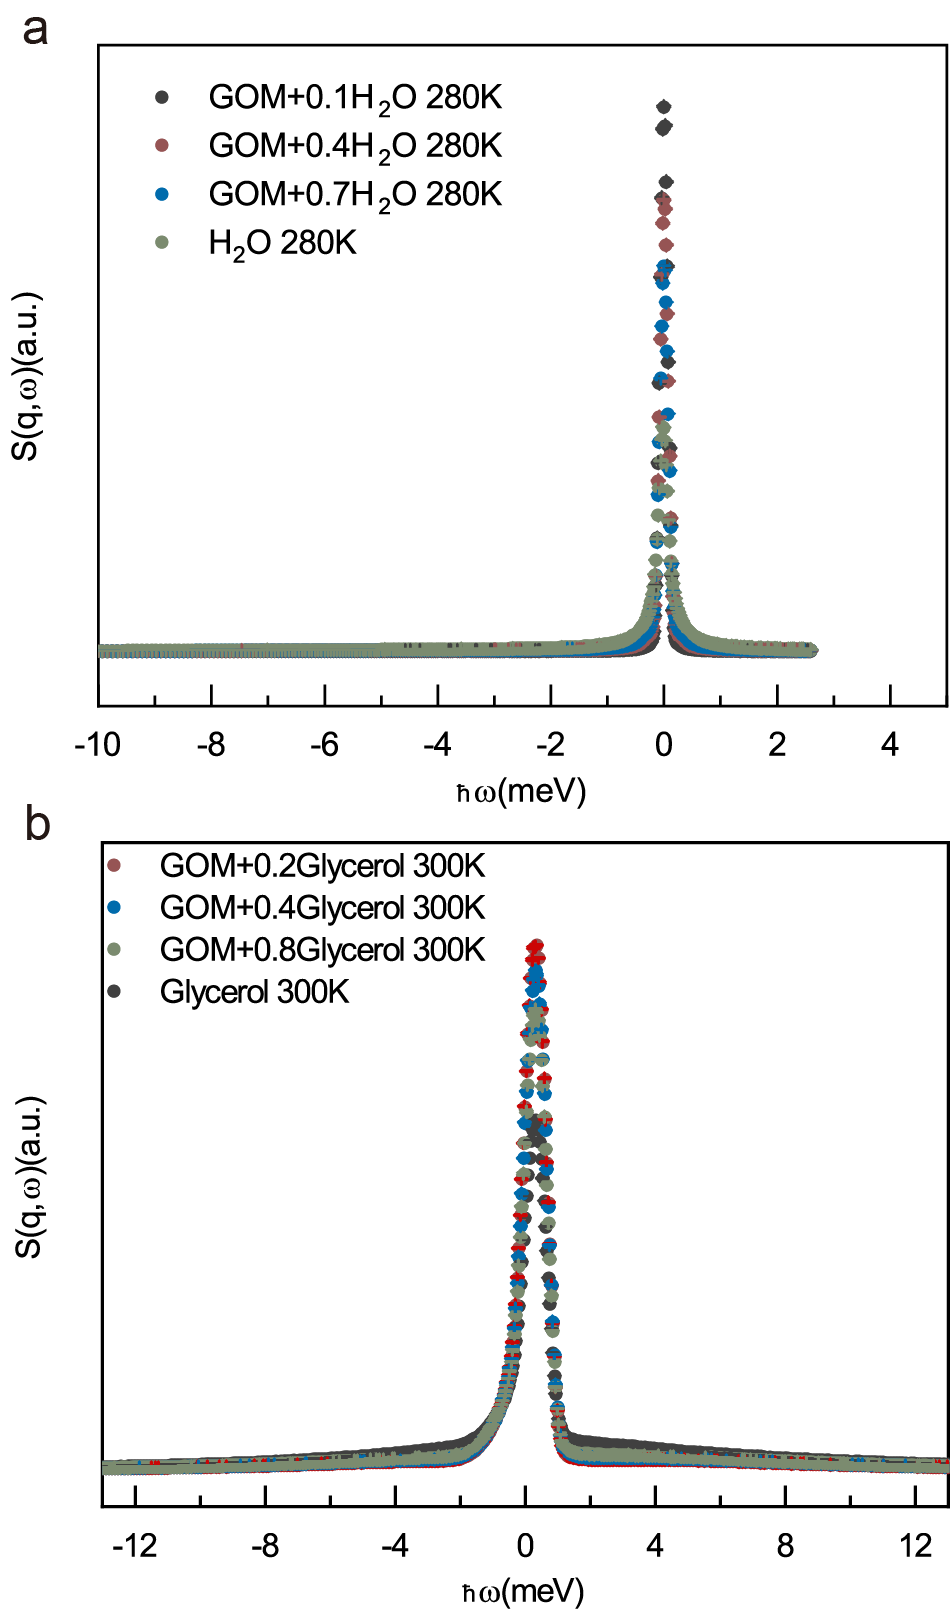
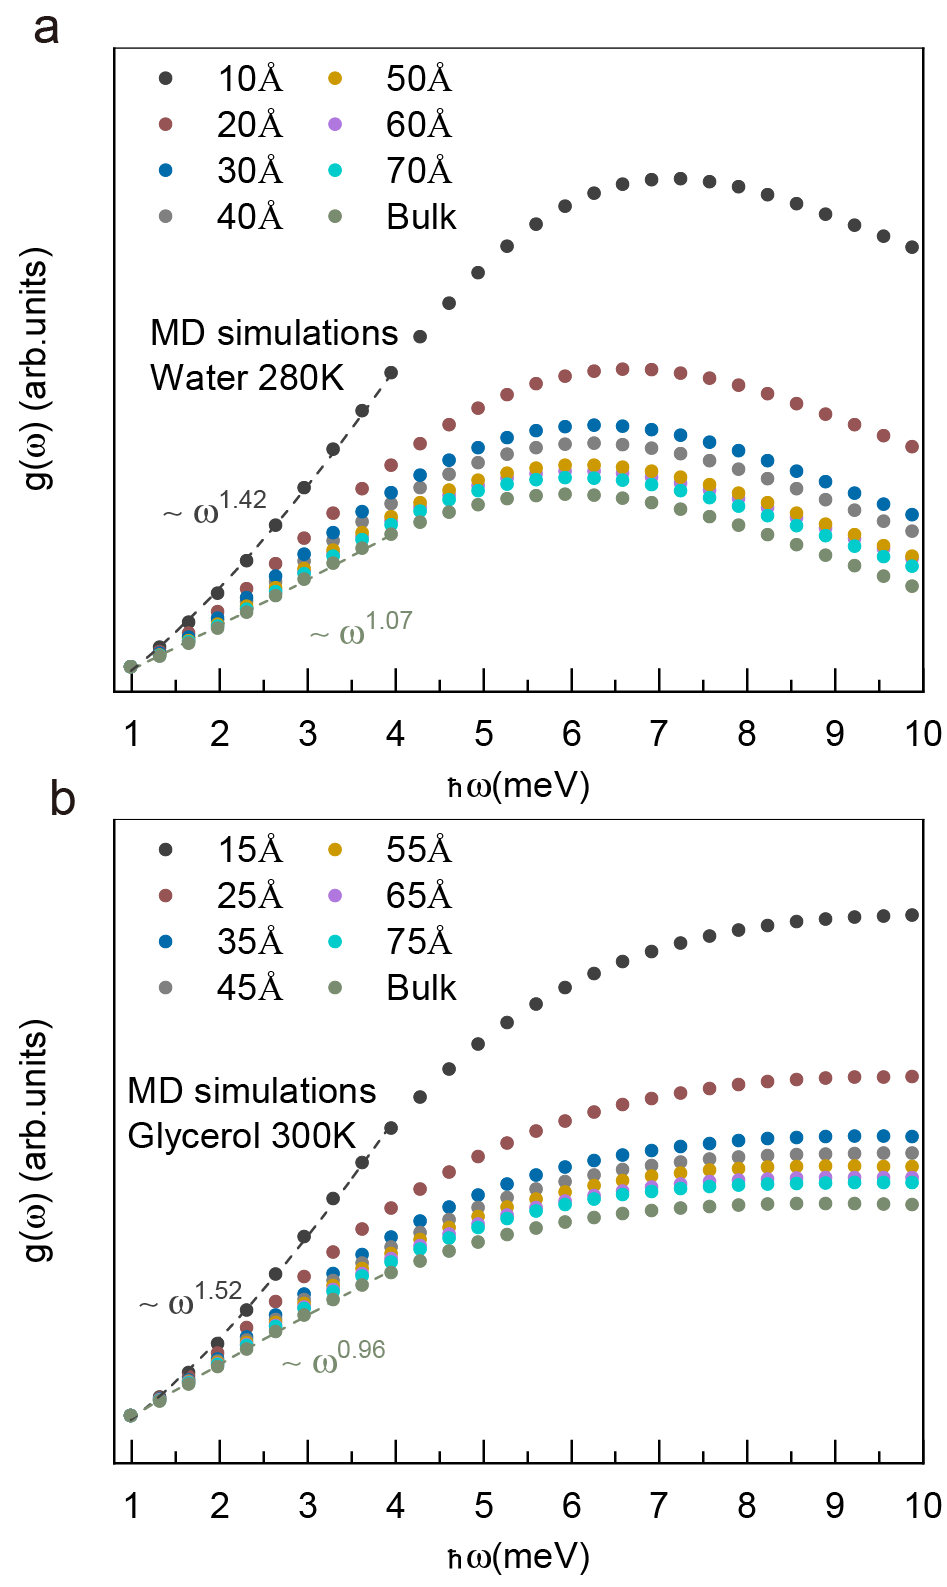
As a reference, we present the data for bulk water at K and glycerol at K in Figure 2a and Figure 2b respectively. The corresponding dynamical structure factors could be found in Figure 3. Both systems exhibit a linear scaling of the VDOS at low frequencies, consistent with previous experimental results Phillips et al. (1989); Stamper et al. (2022a); Jin et al. (2023). We note that the measured energy range of the experimental VDOS for the confined glycerol begins at larger energy( meV) than water due to the different observable energy range of instruments. Notice that the results for water are consistent with previous estimates for the structural relation time, or equivalently Maxwell relaxation time, which at room temperature is around ps Cunsolo et al. (1999); Malomuzh and Shakun (2019); O’Sullivan et al. (2019). This implies that the dynamics of water at room temperature is expected to be fully liquid-like (linear in frequency) below meV, consistent with our fits.
| Samples | GOM 0.2gly | GOM 0.4gly | GOM 0.8gly |
|---|---|---|---|
| 8.9 | 7.4 | 5.3 | |
| Distance | 10.0 | 12.0 | 16.6 |
| Samples | GOM 0.1H2O | GOM 0.4H2O | GOM 0.7H2O |
| 11.4 | 9.2 | 6.9 | |
| Distance | 7.8 | 9.6 | 12.8 |
These findings are further supported by molecular dynamics simulations (see next section). In stark contrast, under extremely confined conditions, where the water (or glycerol) to GOM weight ratio reaches () respectively, the scaling of the low-frequency VDOS deviates significantly from the linear liquid-like scaling. The VDOS displays a power law behavior where the exponent lies between the quadratic Debye law for solids and the linear in frequency law for liquids. The relationship between the weight ratio (liquid to GOM) and the confinement size is examined by X-ray diffraction in Figure 2c, and the detailed results are presented in Table 1, where the inter-layer distance in GOM varies from 7 Å to 13 Å for water when this ratio changes from 0.1 to 0.7 while it varies from 1 nm to 1.6 nm for glycerol when the ratio changes from 0.2 to 0.8. The extreme confinement size provided by GOM for both liquids is approximately 7 Å (see Figure 2c). At that scale, the power reaches the value of and respectively for water and glycerol. By fitting with a power-law function, we find that the scaling of the low-frequency VDOS of confined water and glycerol gradually deviates from the linear scaling of the bulk liquid as the confinement size is reduced. This suggests that under unidirectional confinement, the influence on low-frequency vibrational modes in liquids positively correlates with the degree of confinement, and the scaling tends to approach the Debye value typical of solids.
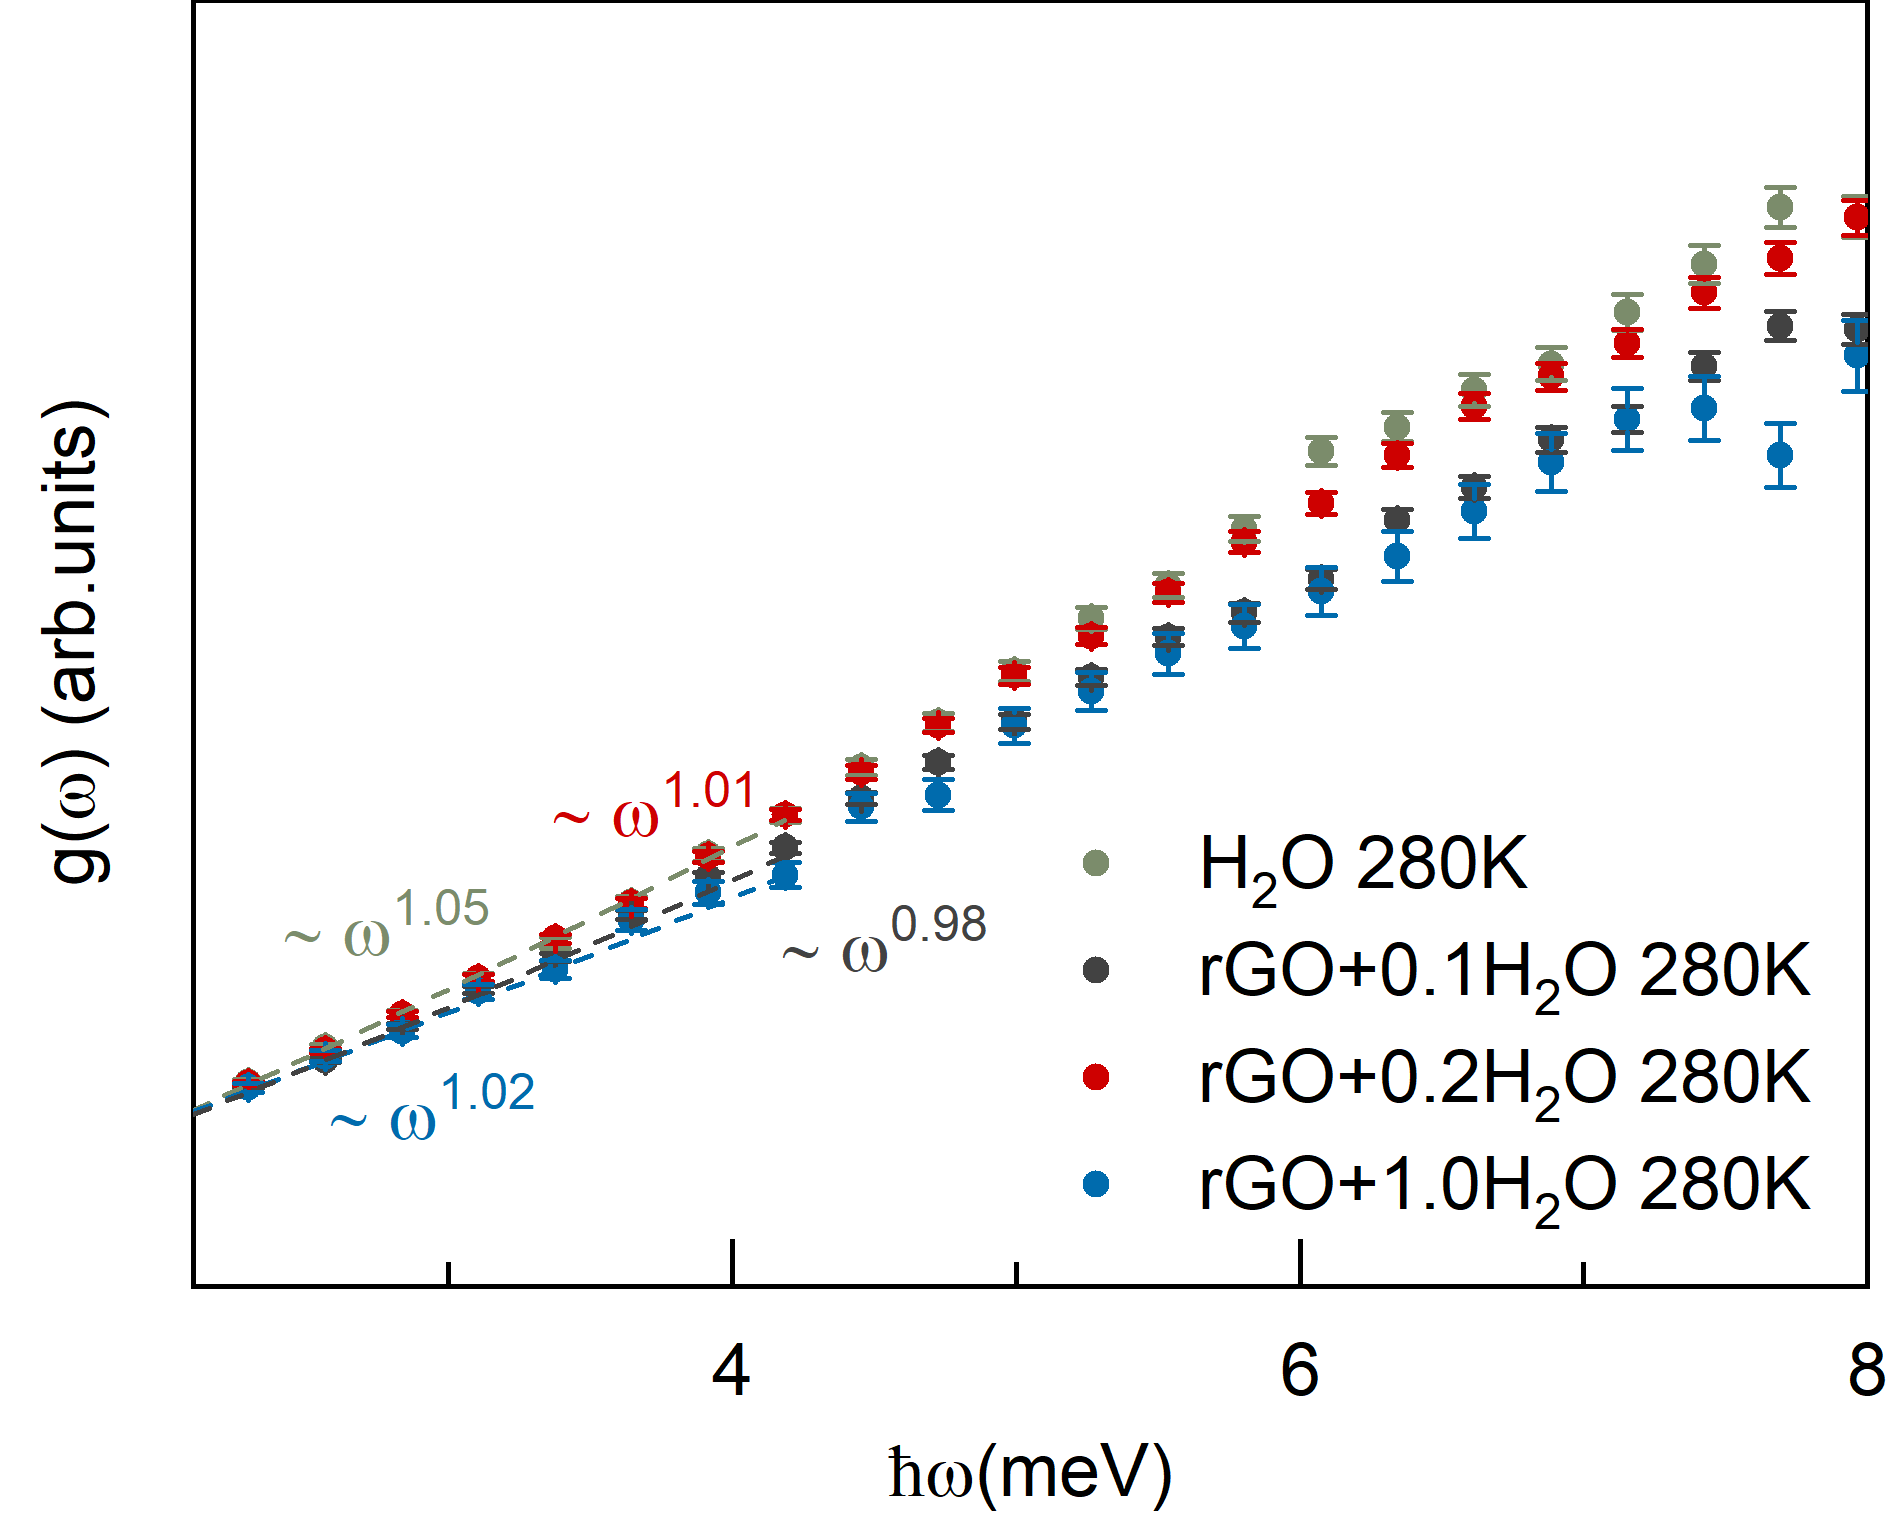
In our previous work Yu et al. (2022), we have demonstrated that the VDOS of GOM itself does not contribute significantly to the VDOS of the confined system in this frequency range. Moreover, we conducted inelastic neutron scattering on water at the surface of reduced graphene oxide(rGO) with the absence of any confinement effect. As shown in Figure 4, with only oxygen-containing groups and surface effects Liu et al. (2020), the low-frequency scaling of VDOS for water exhibits minimal differences. The scaling of the low-frequency VDOS for three different water contents on rGO samples remains around 1 at temperature above freezing point. We note that even in the case of the lowest water content (h=0.1), there is no significant change in the scaling compared with pure water. Therefore, the low-frequency scaling just reported does not arise from the interactions between water and GOM. Additionally ,the small angle X-ray scattering (SAXS) for water confined in GOM, shown in Figure 2d , is employed to provide proof that the liquid remains in the liquid phase under confinement and no crystalline structure is formed. The presence of Bragg peaks, which symbolize crystalline solid ice, only occurs at lower temperatures, below K. At temperature above the freezing point, proved by the absence of characteristic Bragg peaks, water confined within GOM remains in the liquid state. The diffusive behavior of the water confined in GOM has also been reported in our previous work Zhang et al. (2022). Therefore, the low-frequency scaling does not originate from a crystalline phase but rather from the confined liquid water itself.
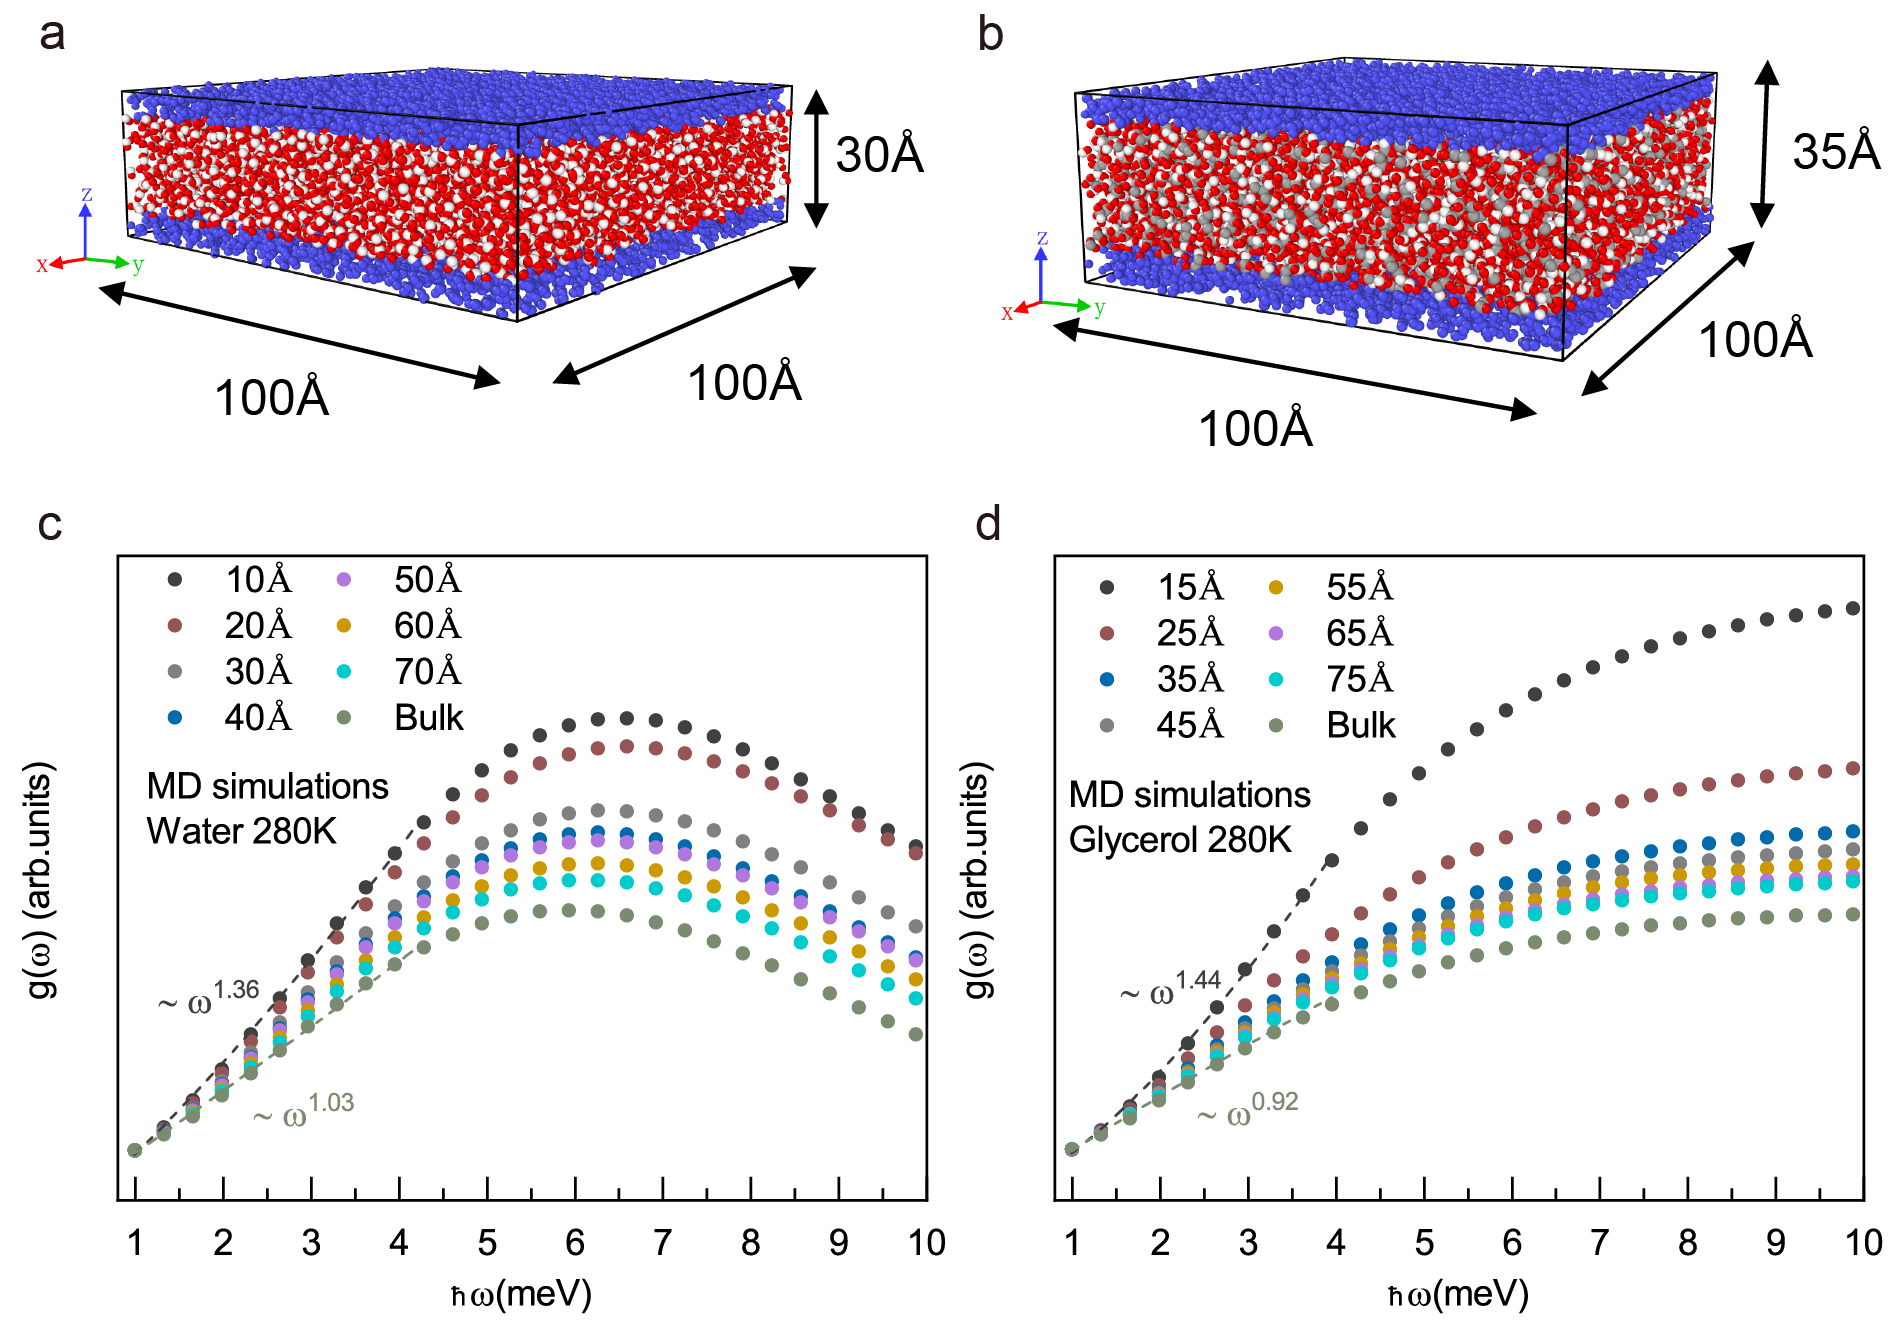
To confirm the experimental results of this faster-than-linear scaling in confined liquids, we conducted molecular dynamics (MD) simulations for water and glycerol. A snapshot of the two setups is provided in the top panels of Figure 5. In the MD simulations, we utilized additional confinement sizes to validate the experimental results in depth. More details regarding the MD simulations can be found in Appendix A.6. For the water and glycerol systems, the confinement sizes ranged respectively from to and to (see Figures 5a and 5b). In both of the systems, the largest size is considered as a bulk sample.
As shown in Figures 5c and 5d, the results of confined water and glycerol from the MD simulations are consistent with the experimental observations. In order to be comparable with neutron scattering experiments, only the trajectories of hydrogen atoms are calculated when calculating VDOS, which has been shown to qualitatively coincide with the results from all atoms in Figure 9 in Appendix A.6. More precisely, the low-frequency VDOS exhibits a larger scaling as the confinement size is reduced, strongly deviating from the linear scaling of the bulk state. For the maximum confinement simulated, we observe respectively a power law scaling for water and for glycerol, which are compatible but slightly smaller than the experimental values. This indicates that the simulations can qualitatively reproduce the experimental conditions but they underestimate the confinement strength.
Interestingly, both in experiments and simulations we find that for the same level of confinement the power law for glycerol is larger than the one of water. This implies that glycerol exhibits a solid-like dynamics on larger scales with respect to water. Assuming that the critical scale for the emergence of solidity is roughly given by , we can, at least qualitatively, explain this observation. In particular, by following Maxwell’s idea and interpreting with the Maxwell relaxation time, the critical length becomes proportional to the viscosity of the liquid. That said, glycerol is more viscous than water, times larger at room temperature and therefore the solid-like dynamics are expected to emerge on larger scales, as observed in both experiments and simulations.
III Explaining the low-frequency solidity of liquids under confinement
In the previous section, by means of experiments and simulations, we have shown that by decreasing the confinement size from several nanometers to the low-frequency behavior of the vibrational density of states of water and glycerol drastically changes. In particular, we observed a continuous transition in the vibrational density of states (VDOS) from a linear scaling in frequency dependence in bulk liquids to a solid-like Debye law in strongly nanoconfined liquids.
In order to explain this behavior, we rely on the interpretation of liquid dynamics originally proposed by Maxwell and Frenkel Frenkel (1984) (see also Zwanzig Zwanzig (1967)), and later re-interpreted by Trachenko and collaborators Trachenko and Brazhkin (2015); Baggioli et al. (2020). The main idea, as previously introduced, is that the dynamics of liquids are characterized by solid-like quasi-harmonic vibrations around local minima of the potential landscape interrupted by thermally activated re-arrangements corresponding to jumps over the barrier towards a different minimum (see inset in Figure 1). This relaxational processes happen at an average rate , where is a so far undetermined re-arrangement timescale. Following this simple picture, one could immediately argue that for times shorter than a liquid should not be too different from a solid, i.e., the Frenkel criterion.
Mathematically, this framework can be described using the telegrapher equation, Eq.(1), which determines the dynamics of the collective (shear) modes in liquids, up to the lowest order in the frequency and the wave-vector and provides a simple interpolation between a solid-like behavior at high frequencies and a liquid-like dynamics at low frequencies.
By solving Eq.(1), and focusing on the real part of the frequency, one finds the simple expression:
| (2) |
where we have kept a distinction between the structural relaxation time (ps for bulk water) and the timescale appearing in the k-gap equation above. In bulk liquids, decreases with temperature, and therefore can be taken as a measure of “fluidity”.
Using MD simulations,we obtained the dispersion relation of the collective shear waves in liquid water, as shown in Figure 6a. Unfortunately, the statistical quality of the data points and the fitting curve in the low-wavenumber region is poor. This limitation is attributed to the finite size of our simulations (). For the bulk sample at K, we find that . which is of the same order as liquid gallium at K Khusnutdinoff et al. (2020b) and liquid sodium at K Giordano and Monaco (2010). Most importantly, the obtained value is in quantitative agreement with a previous estimate for water at room temperature, where the system has been proven to be fully hydrodynamic below a value of Sampoli et al. (1997).
It should be noted that, as derived in Sampoli et al. (1997), the dynamics of bulk water at room temperature becomes underdamped as is the case in solids only above . This implies that the requirement of having the wave-vector larger than the k-gap is not enough to have a well-defined underdamped solid-like dynamics in liquids. As explained in Appendix D, this is consistent with k-gap theory. More precisely, above but near the k-gap, , meaning that the dynamics are not liquid-like but still overdamped. This is consistent with the range of found experimentally in Sampoli et al. (1997). More interestingly, at a quantitative level, is approximately twice of the k-gap, and converted in frequency scale is very close to the Frenkel criterion (see Appendix D for more details about this).
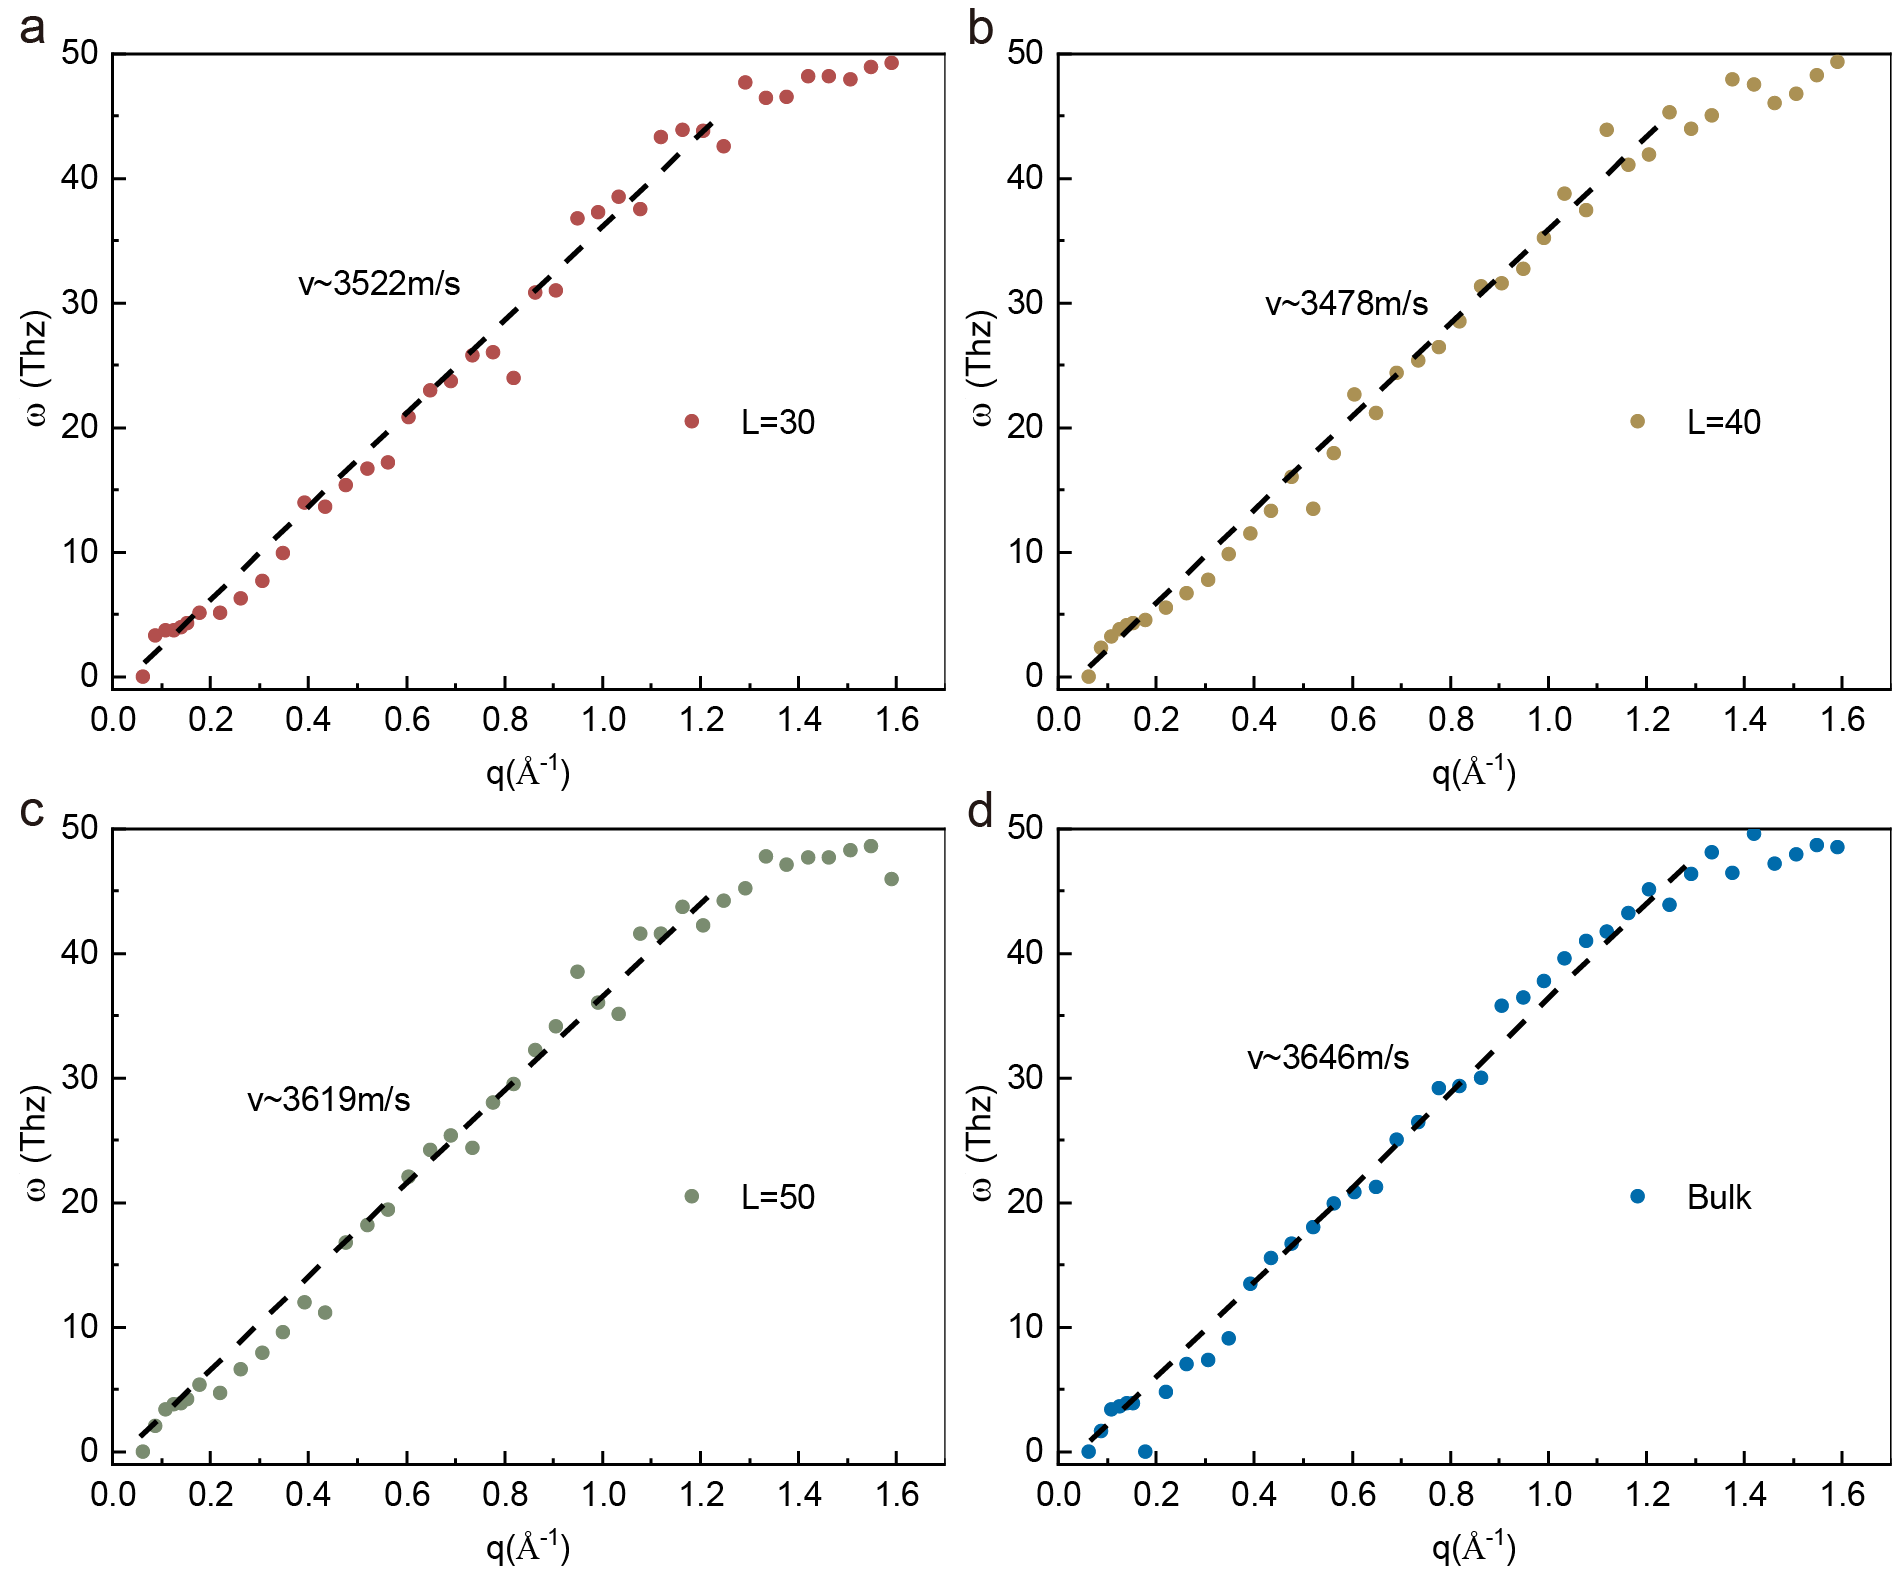
In order to prove the emergence of solidity under confinement, in Figure 6a, we analyze the dispersion relation of the collective shear waves in the water sample by reducing the confinement size. The detailed results of the fit can be found in Table 2 in Appendix D. We observe that the momentum gap of the collective modes decreases with decreasing confinement size. In other words, under strong confinement the gap in the wave-vector closes and the dispersion relation shifts towards the solid-like one . Before analyzing this behavior in detail, we seek further confirmation of this trend by examining the experimental and simulation diffusion constants as a function of the confinement size.
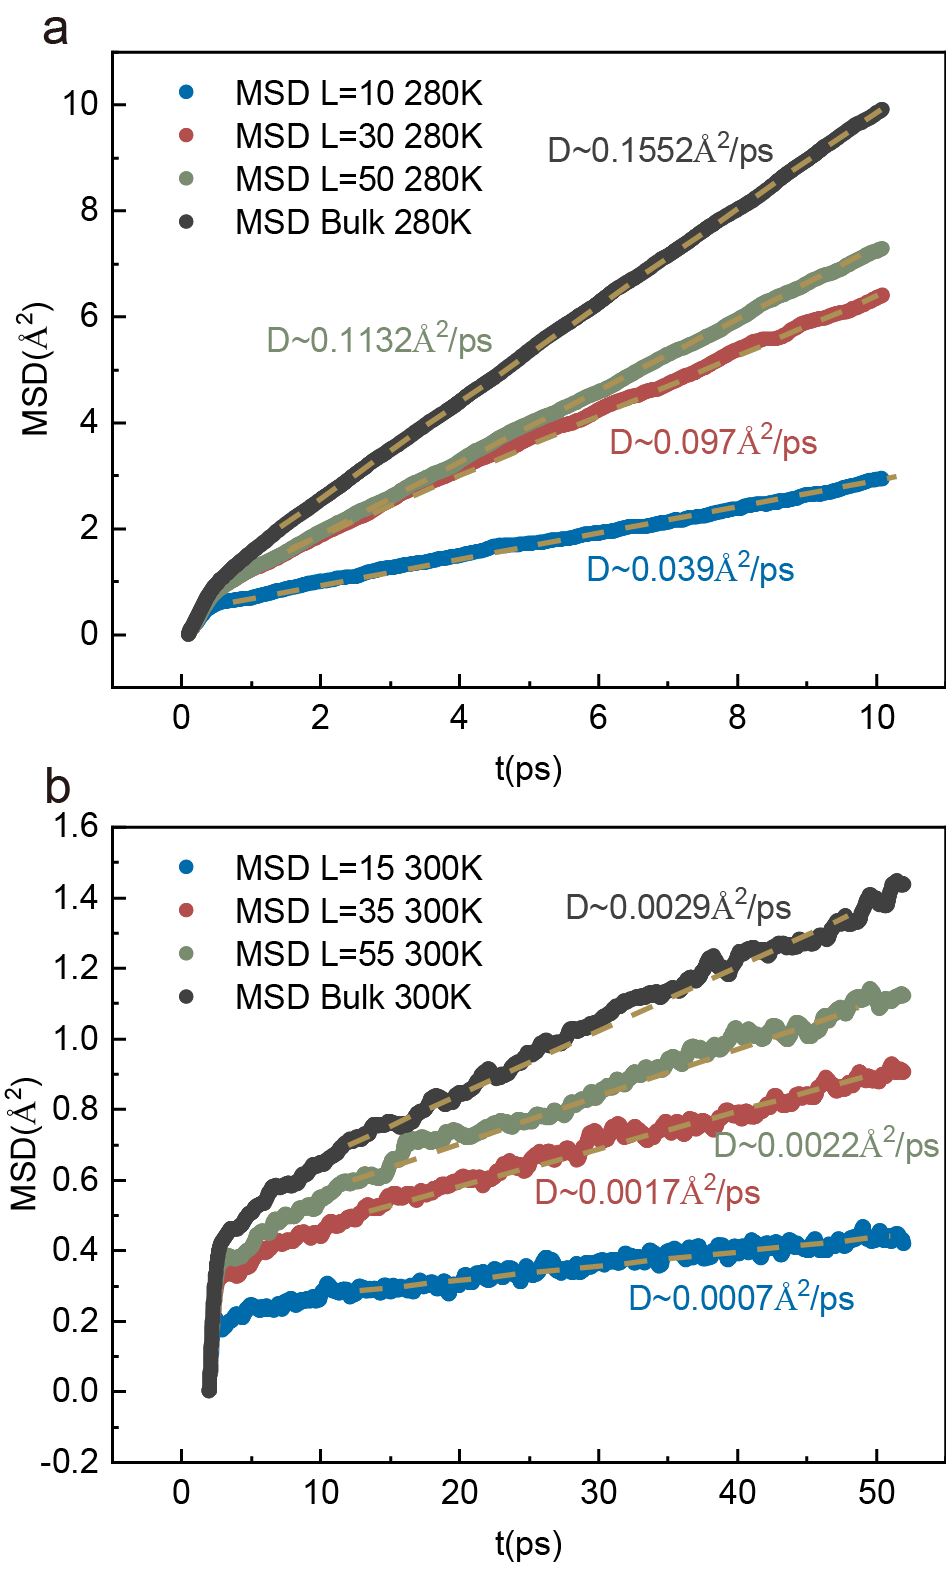
As shown in Figure 6b, the diffusion constant obtained from the mean square displacement (see Figure 8) increases monotonically with the confinement size and approaches the value for bulk water for larger . A decrease of the self-diffusion constant with confinements size, and a dramatic increase of the viscous forces have been already reported in simulations and experiments Zhang et al. (2022); Li and Riedo (2008); Kuo et al. (2023); Ortiz-Young et al. (2013b). For comparison, in the same panel, we also show the behavior of the diffusion constant for confined glycerol at K. The diffusion constant in glycerol is approximately two orders of magnitude smaller than that of water, as the dynamics therein are much slower and the effective viscosity is much larger.
We then extract the parameters and . Despite the precision of the fitting is limited, specially for very low values of , the analysis can still provide a useful qualitative estimate. In Figure 6c, we show the behavior of and as a function of the confinement size . As explicitly verified in Appendix D (see Table 2), the shear waves speed (and the speed of longitudinal sound as well) are to a first approximation constant with respect to , and therefore their effect can be neglected. On the contrary, the relaxation time and the momentum gap are very sensitive to the confinement scale. The relaxation time grows approximately linearly with , and the momentum gap follows approximately the inverse behavior . From a physical perspective, these results indicate that,with the increasing the strength of the confinement, collective shear waves in the liquid may start to propagate at lower frequencies and the solid-like dynamics extends lower wave-vectors. Moreover, the dynamics and the local-rearrangements are substantially slowed down, as a further evidence that the liquidity of the system is hindered at short distances.
We notice that for the bulk water the relaxation time is ps. This is about a factor of two larger than the structural relaxation time and the Maxwell relaxation time reported for bulk water at room temperature Cunsolo et al. (1999); Malomuzh and Shakun (2019); O’Sullivan et al. (2019). While we cannot derive a conclusive relation, the qualitative consistency suggests and could both characterize certain relaxation processes in liquids. Though they do not quantitatively agree, at least in water. As a final remark, the k-gap analysis and the behavior of the diffusion constant confirm a close connection between the retardation of relaxation dynamics and the tendency toward solid-like vibrational modes. The same conclusion has been reached in several MD simulations by changing the temperature of the system Khusnutdinoff et al. (2020a); Yang et al. (2017).
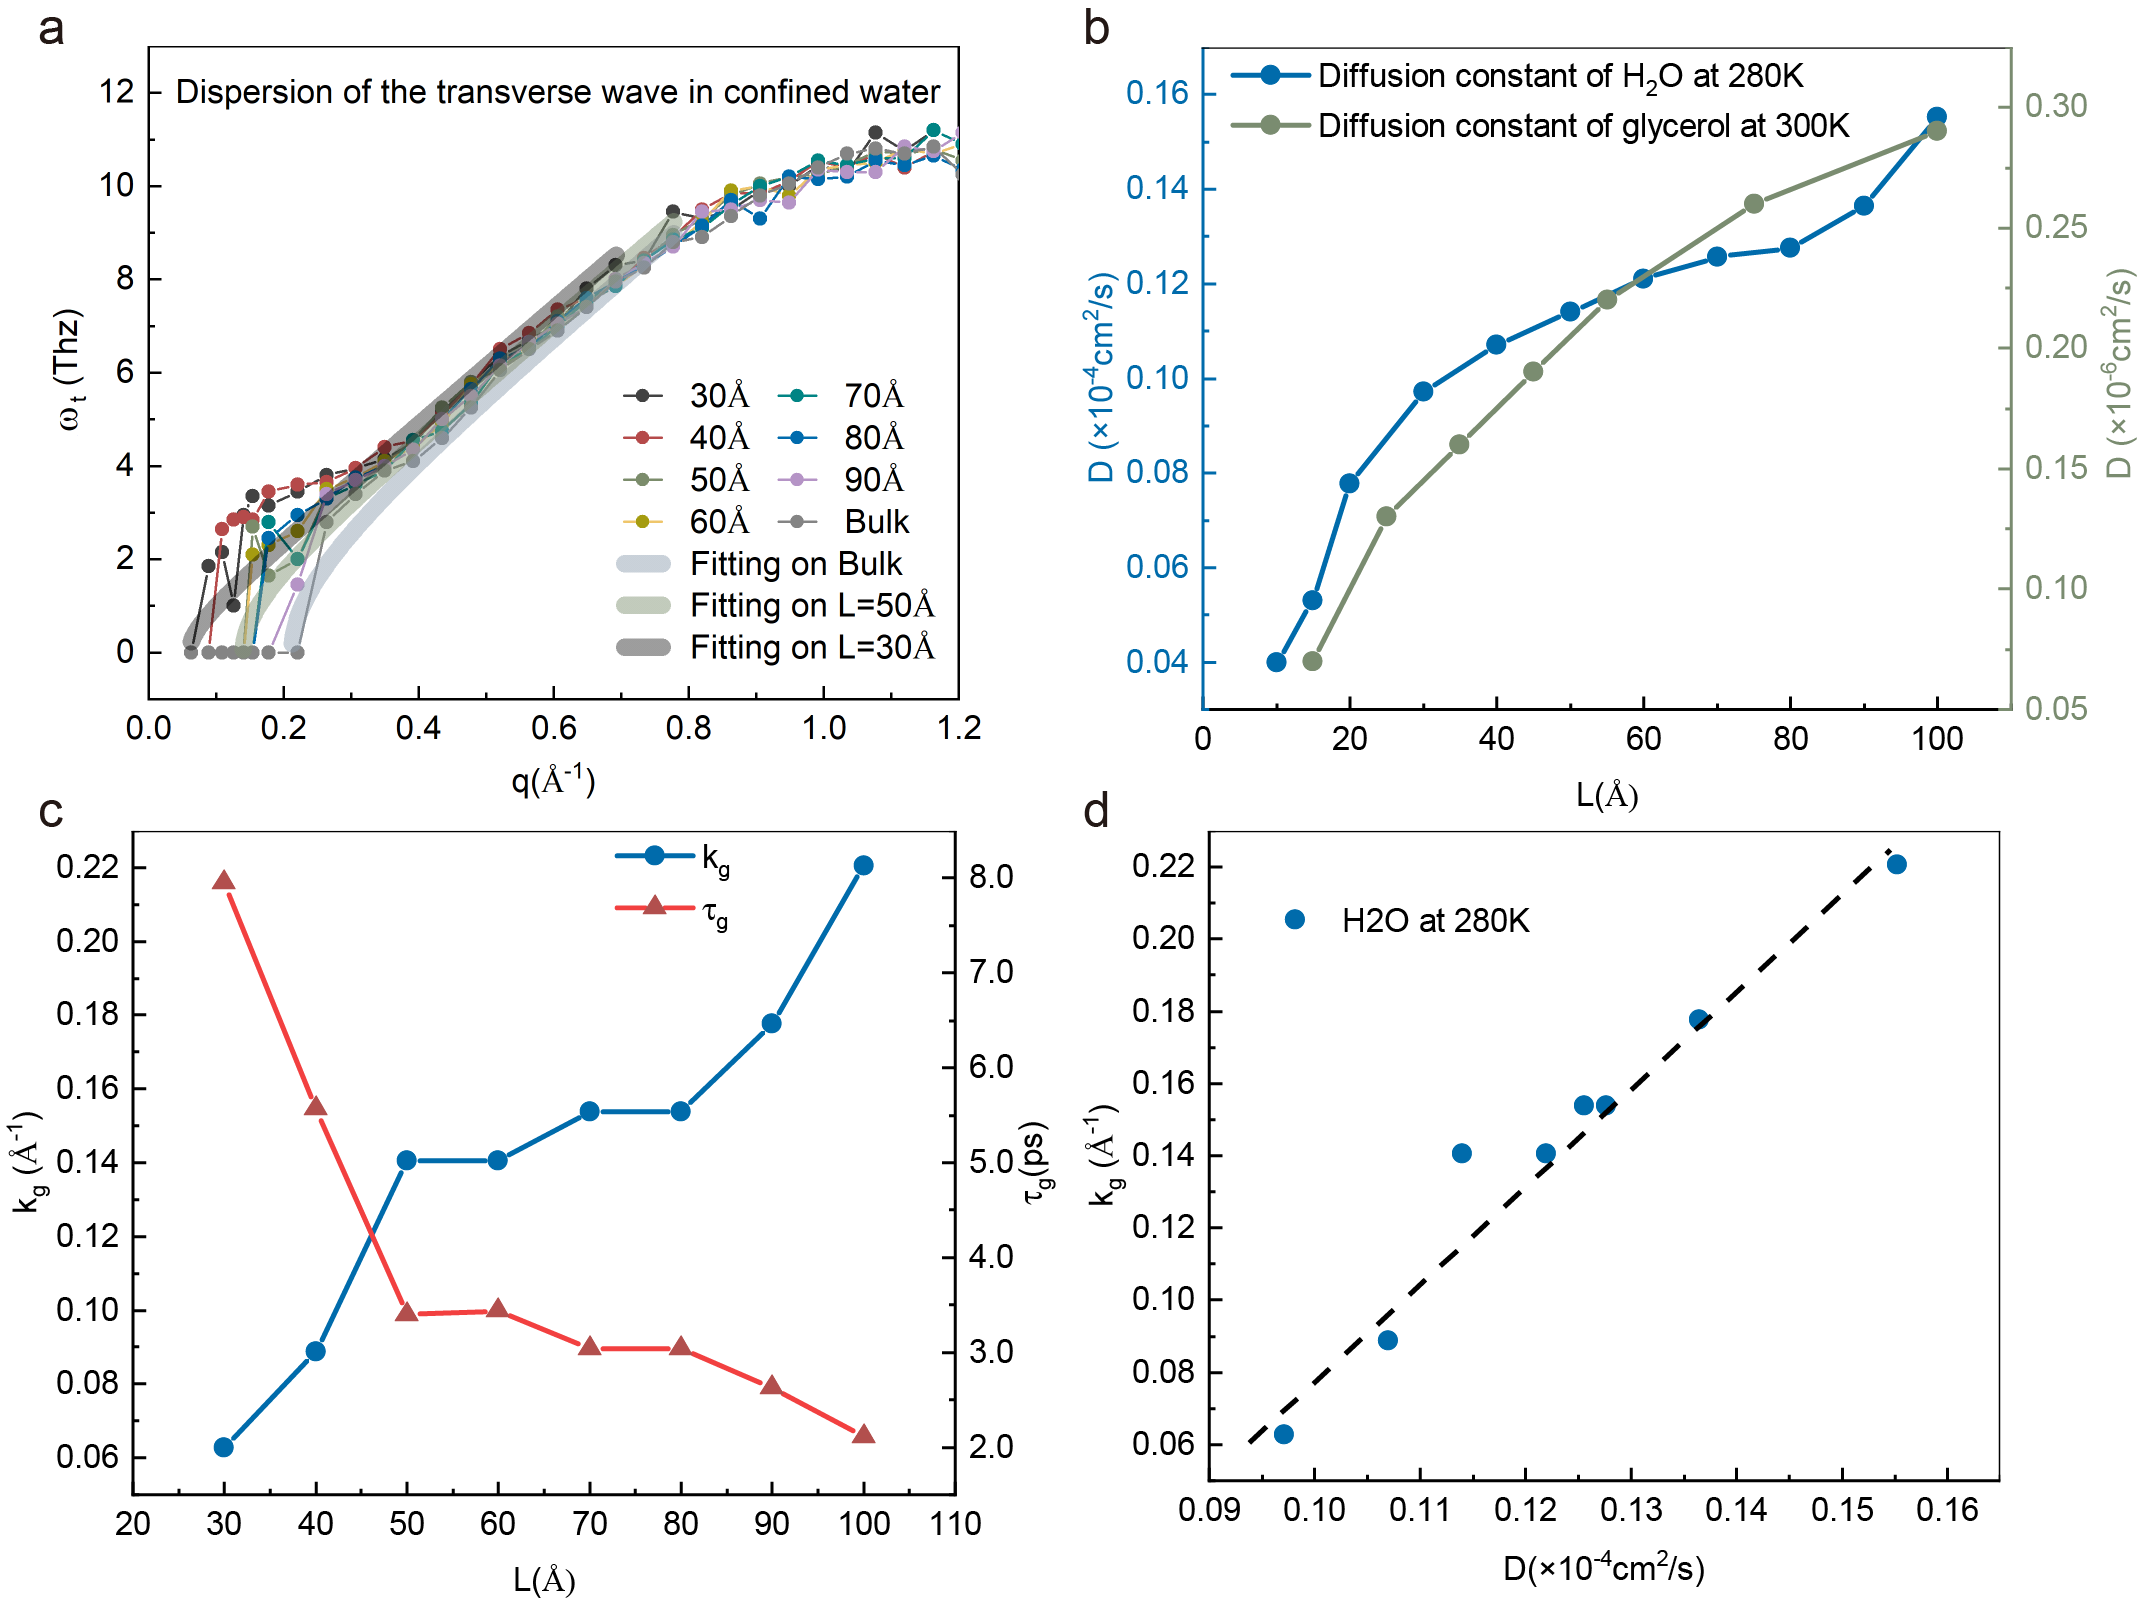
In Figure 6d, we reveal a direct linear correlation between the size of the momentum gap for collective shear waves and the single-particle self-diffusion constant. The two quantities show an approximate linear relation of the type confirming that they are both measurements of the fluidity of a system. The larger the gap of shear waves, the larger the self-diffusion constant and the ability of the system to flow as a fluid. To the best of our knowledge, this direct correlation between the k-gap and the diffusion constant has not been revealed before, and it certainly deserves further investigation.
At this point, it is reasonable to ask how the transition from the linear in frequency liquid-like behavior to the quadratic Debye law happens upon moving the confinement size and how it is related to the re-appearance of collective shear waves and the behavior of the momentum gap . In order to reach a qualitative argument, a simplified toy model based on the k-gap equation Eq.(1) can be constructed (see Appendix D for more details). By neglecting the effects of the other excitations and concentrating on the gapped shear waves, and by assuming a spherical phase space for their wave-vector unaffected by the confinement size, one can derive a simple expression for the contribution of the shear waves to the VDOS given by:
| (3) |
Despite the simplicity of this derivation, one striking prediction emerges. Precisely, one would expect a transition from the liquid-like linear VDOS to a Debye law at frequencies , which is another manifestation of the Frenkel criterion. In other words, we expect that the deviations from the purely linear behavior will appear only at frequencies larger than the inverse relaxation time . Since increases by reducing the confinement size , as shown in Figure 6c, one would expect the Debye scaling to reach lower and lower frequencies upon confining the liquid.
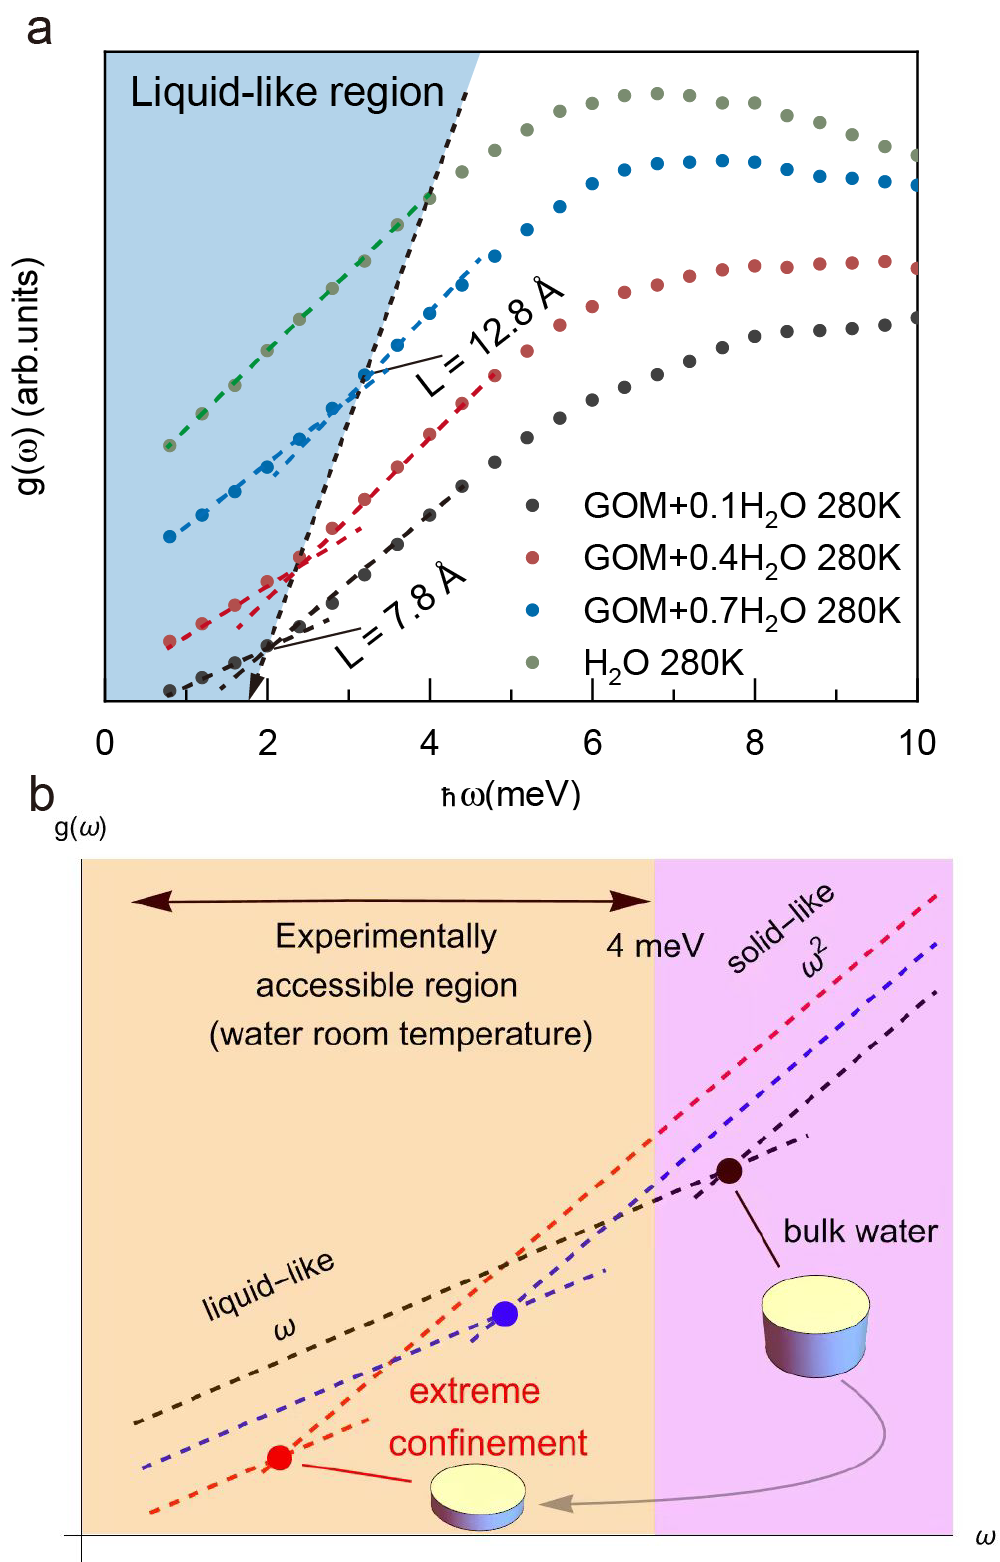
In order to check this prediction, in Figure 7a, we revisit the experimental data for confined water under this new perspective and we estimate the frequency at which the linear behavior is lost as a function of the confinement size . We denote such an energy scale as the crossover frequency . In bulk water at K we do not observe any crossover and the low-frequency VDOS is perfectly linear below meV. This is in perfect agreement with the idea that the solid-like dynamics can appear only above . For bulk water, ps and therefore the cutoff for solid-like vibrations is around meV.
As proved in Figure 6, under confinement the relaxation time strongly increases, moving the onset for solid-like vibrations in confined liquids to energies below the bulk cutoff of meV. Indeed, for higher degrees of confinement – shorter – we start observing a crossover between a linear behavior, that appear within the blue region in Figure 7a, and a quadratic Debye-like one that emerges above , in the white region in Figure 7a. These two different scalings are emphasized in Fig.7a by dashed black lines. The crossover frequency becomes smaller by decreasing the confinement size , ranging from meV at to meV at .
This is compatible with the relaxation time becoming longer and longer under the enhanced confinement and the onset of solid-like dynamics, , appearing at lower frequencies, below the experimental cutoff of meV (see Figure 7b for a representation of this phenomenon).
This simple argument also suggests that the fractional power laws extracted in the previous section from the experimental data using a single power fitting function might be the result of a combination of a liquid-like linear term and a Debye quadratic contribution. Qualitatively, the smaller the confinement size , the more the Debye contribution enters at low frequency and the larger the power extracted from a single power fitting law. This also explains why a perfect Debye scaling is not recovered for small values of . This would happen only in the unrealistic limit in which the crossover frequency goes to zero and the relaxational dynamics are completely frozen. For the shortest confinement scale we can achieve, , we see a crossover frequency of meV, implying that below such a scale a residual linear in frequency liquid-like contribution is still present.
IV Conclusions
In this study, we investigated the vibrational density of states (VDOS) of water and glycerol liquids nano-confined in multiple-layer graphene oxide membranes (GOM) using inelastic neutron scattering and molecular dynamics simulations. We focused on the low-frequency (below meV) scaling of the VDOS in confined liquids, its variation with the confinement length and its relation with the relaxational dynamics and the dispersion of gapped shear waves. Experimental observations revealed that the low-frequency VDOS of the confined liquid evolves from a linear behavior in the bulk state to a faster scaling, close to the Debye-like quadratic behavior, under strong confinement.
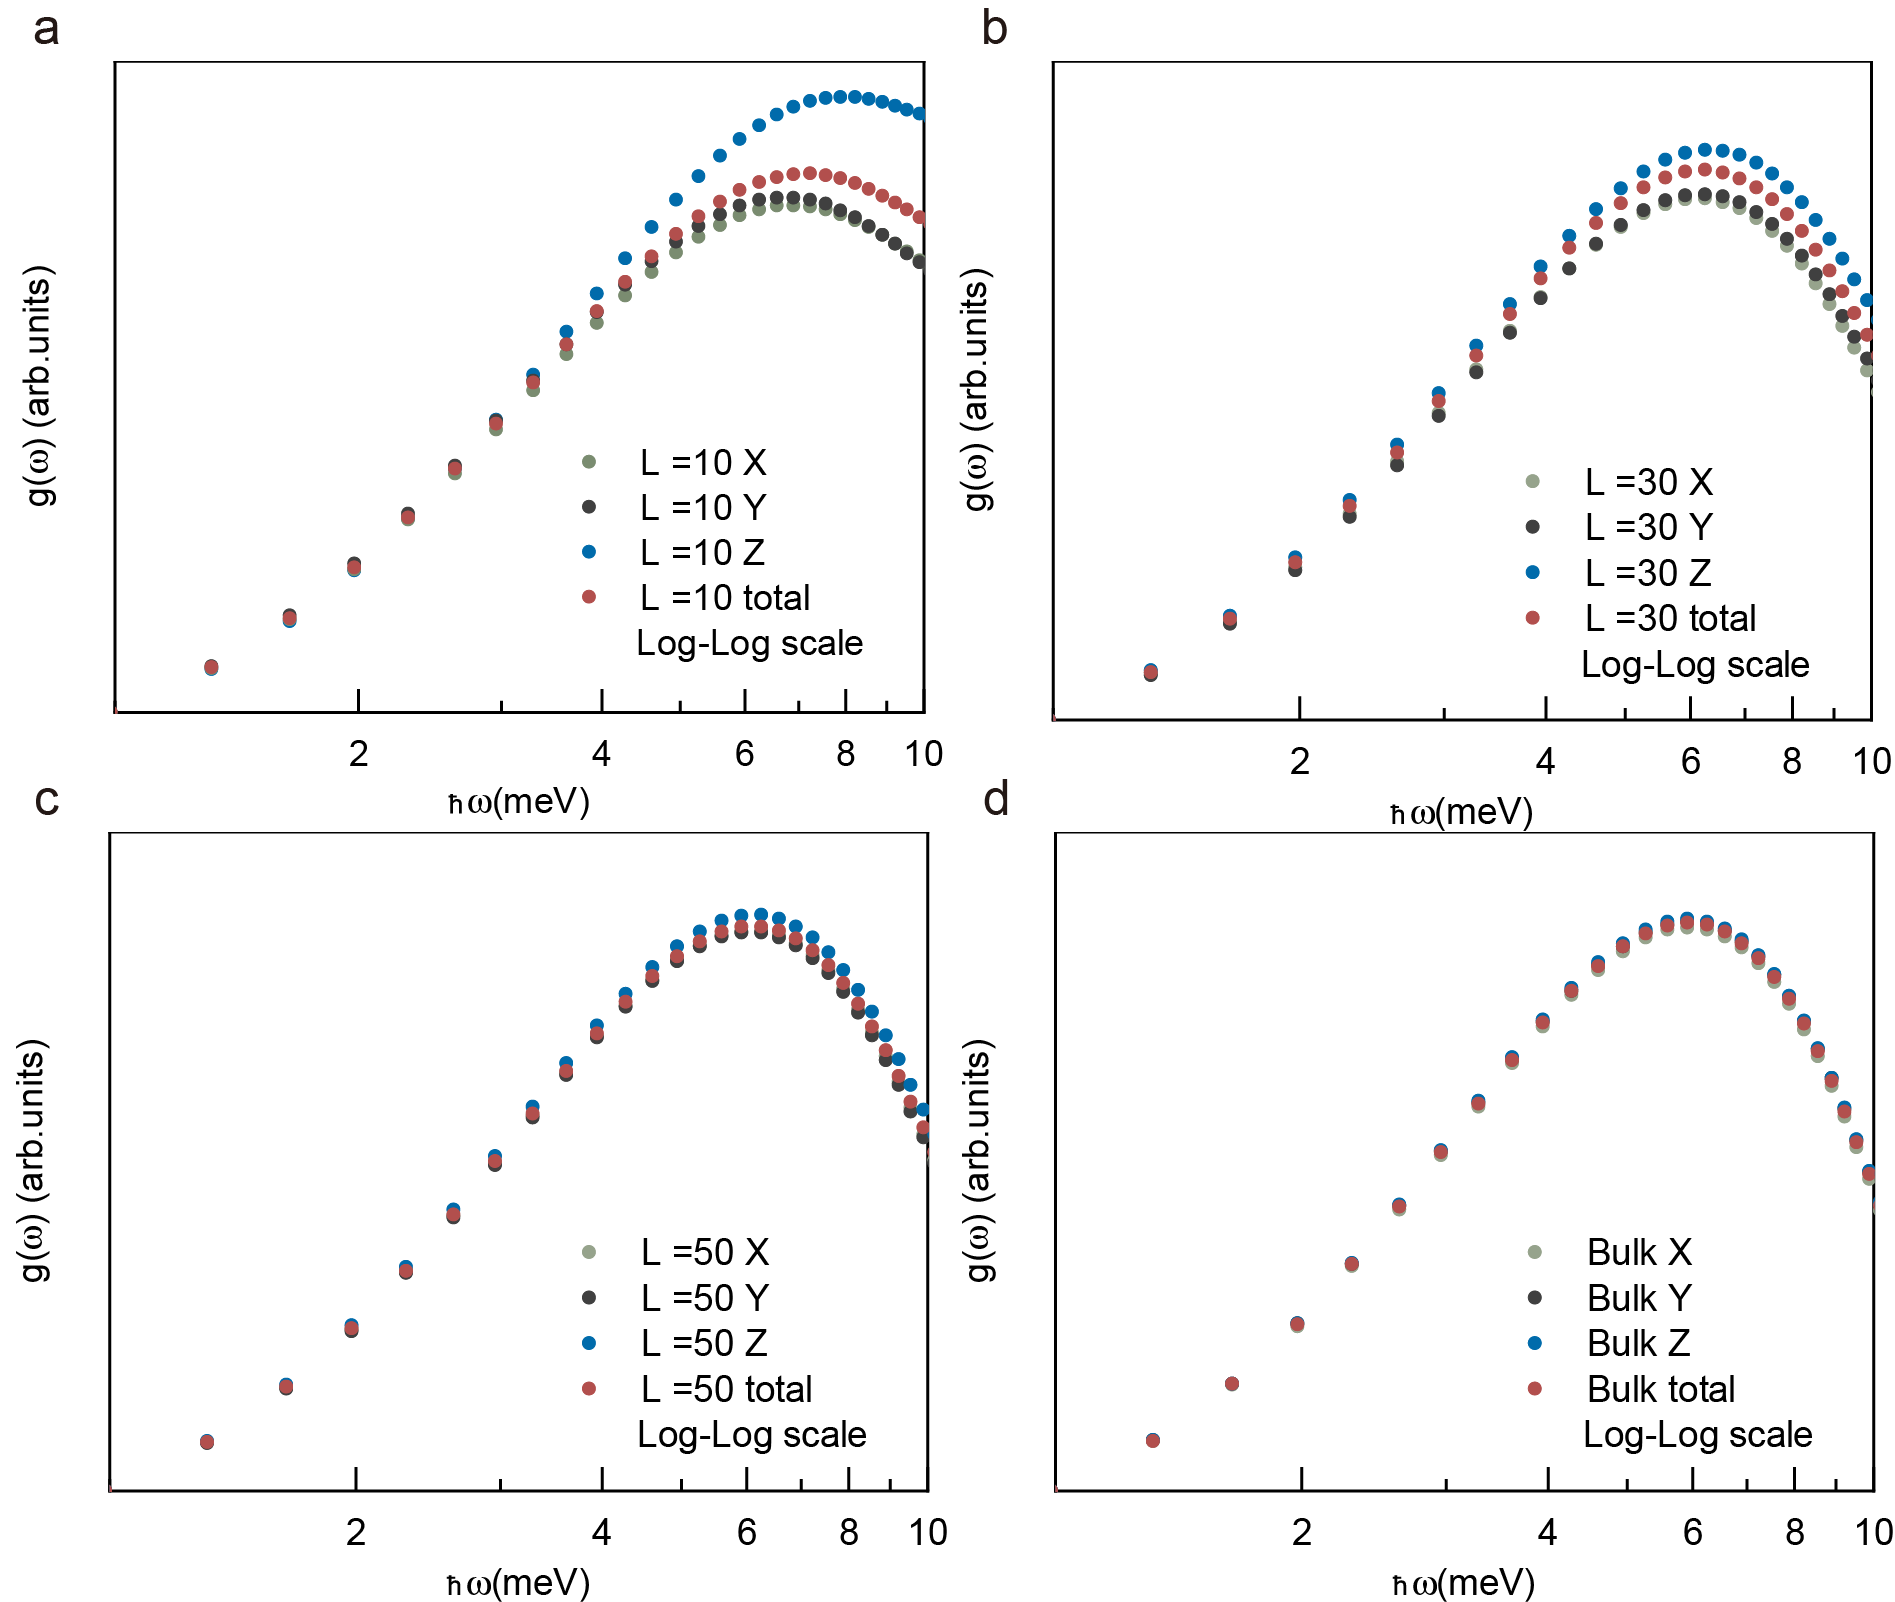
Through molecular dynamics simulations, we explored a broad range of confinement sizes and confirmed the gradual solid-like evolution of both liquids as the confinement size decreases. Analyzing the vibrational modes in the different directions, we found that emergent solid-like vibrational modes primarily arise along the confined direction, in agreement with previous simulation results Kuo et al. (2023), and that spatial confinement strongly affects the dispersion relation of transverse waves in the liquid. As the confinement size decreases, both the diffusive processes and the structural rearrangements are slowed down, and the transverse dispersion curves progressively resemble those of a solid, with no wave-vector gap. Upon confinement, the longitudinal waves of the liquid are not significantly affected. On the contrary, the momentum gap for collective shear waves, typical of liquids, closes by decreasing and beautifully correlates with the behavior of the self-diffusion constant . In a nutshell, decreasing the confinement size is akin to decreasing the temperature and going towards the solid phase in a continuous fashion. In addition, we have found that the relaxation time extracted from the k-gap equation is strongly slowed down upon confinement.
Building upon Frenkel-Maxwell’s ideas Frenkel (1984) and the more recent k-gap theory Baggioli et al. (2020), we provided a simple physical picture for the experimental and simulation observations. In particular, we have corroborated that the appearance of solid-like dynamics at low frequency in water, below meV, is highly correlated with slow down of the relaxation time under confinement. This confirms the idea that at frequencies above the inverse of the relaxation time , solid-like vibrational modes appear. Under nanoconfinement conditions, the corresponding energy scale becomes smaller than meV and strongly alters the low-frequency VDOS of liquids. This mechanism is accompanied by the reduction of the gap for transverse shear waves, which is again controlled, according to k-gap theory, by the inverse of the relaxation scale. In other words, we have shown that the closing of the k-gap under confinement is the microscopic origin behind the solid-like low-frequency VDOS of liquids under confinement and it strogly correlates with the decrease of the self-diffusion constant. This picture gives a direct verification of the Frenkel criterion and of the idea of continuity between the liquid and solid phases of matter.
In conclusion, our study elucidates the impact of spatial confinement on the vibrational dynamics and on the onset of solid-like vibrational modes in liquids. Our findings contribute to a better understanding of the behavior of liquids under confinement, and on the short-scale dynamics of liquids in general, providing important insights into the fundamental aspects of their vibrational properties. Further investigations are necessary to explore different confinement geometries, liquid systems, and environmental conditions to deepen our knowledge of liquid dynamics and their implications for various fields such as materials science, nanotechnology, and energy storage.
Acknowledgements.
We would like to thank H. Xu, A. Zaccone, K. Trachenko, L. Noirez and T. Keyes for fruitful discussions on the topic of liquids. We thank Dr. Victoria Garcia Sakai from ISIS Neutron and Muon Facility for assistance with the inelastic neutron scattering. We acknowledge the Instrumental Analysis Center of Shanghai Jiao Tong University for assistance with structural characterization via SEM and XRD. We thank Dr. Xiaran Miao from BL16B1 beamline of Shanghai Synchrotron Radiation Facility (SSRF) for help with synchrotron X-ray measurements. This work was supported by the National Natural Science Foundation of China (11974239), the Innovation Program of Shanghai Municipal Education Commission(2019-01-07-00-02-E00076),and Shanghai Jiao Tong University Scientific and Technological Innovation Funds (21X010200843). M.B. acknowledges the support of the Shanghai Municipal Science and Technology Major Project (Grant No.2019SHZDZX01) and the sponsorship from the Yangyang Development Fund. We acknowledge the support of the Australian Centre for Neutron Scattering, ANSTO and the Australian Government through the National Collaborative Research Infrastructure Strategy, in supporting the neutron research infrastructure used in this work via ACNS proposal P7273.Appendix A Experimental and simulation method
A.1 Sample preparation
The GOM sample was synthesized using the modified Hummers’ methodMarcano et al. (2010).Initially, the sample was dehydrated by heating it from room temperature to 313 K and subsequently annealed at this temperature for 12 hours under vacuum conditions to achieve a dry state. The oxidation rate of the GOM sample was determined to be using X-ray Photoelectron Spectroscopy (XPS). After dehydration, the GOM sample was sealed in a desiccator and exposed to water vapor to facilitate the adsorption of water molecules onto the surface and between the interlayers of the GOM sheets. The exposure time of the sample was adjusted to control the hydration levels. The final hydration levels were determined by measuring the weight of the sample before and after water adsorption, providing a quantitative assessment of the absorbed water content.The dehydrated GOM is soaked in glycerol for varying amounts of time and dried at 40 for 24 hours after removal to thoroughly remove the water. The specific gravity of glycerol is determined by the soaking time of the samples.
A.2 Powder X-ray Diffraction (PXRD)
The powder X-ray diffraction (PXRD) data for GOM at various hydration levels were obtained using a Rigaku Mini Flex600 X-ray diffractometer. The instrument was equipped with a Cu K source ( = 1.5406 Å) and operated at 40 kV and 15 mA. The data were collected over a scanning range of 10 to 60 at a scan rate of 10/min. The analysis of the PXRD data was performed using MDI Jade software.
A.3 Small Angle X-ray Scattering (SAXS)
SAXS measurements were utilized to track the changes in interlayer distance within graphene-oxide membranes (GOM) during temperature reduction and ice formation. The experiments were conducted at the BL16B1 beamline of the Shanghai Synchrotron Radiation Facility (SSRF) using X-rays with a wavelength of . The SAXS patterns were captured using a Pilatus 2M detector, featuring a resolution of 1475 pixels 1679 pixels and a pixel size of . To ensure accurate data collection, each SAXS frame had an acquisition time of 10 s. The sample-to-detector distance for SAXS measurements was maintained at 258 mm.
A.4 Scanning Electron Spectroscopy (SEM)
The SEM images were acquired using a MIRA 3 FE-SEM operating at a 5 kV accelerating voltage.
A.5 Inelastic Neutron Scattering (INS).
Due to the significantly larger incoherent scattering cross section of hydrogen atomZheng et al. (2022), the intensity measured in neutron signals in the system are primarily influenced by the incoherent scattering function, which predominantly reflects the self-motion of water molecules within the sample(the contribution from the graphene oxide will be very smallYu et al. (2022)). The experimental vibrational density of states (DOS), denoted as , can be derived from the dynamic structure factor, , using the approachTaraskin and Elliott (1997):
| (4) |
where is the Planck constant, is the scattering wavevector, is the frequency which related to the energy transfer, is the Boltzmann constant, and T is the temperature. For water confined in GOM, three samples were fabricated with different weight ratio h (gram water/gram GOM) : 0.1, 0.4 and 0.7. The inelastic neutron scattering experiment were conducted by the time-of-flight cold neutron spectrometer - PELICAN at Australian Nuclear Science and Technology Organisation (ANSTO). The incident neutron energy is 14.9 meV with an energy resolution meV at the elastic peakYu et al. (2013). The range covered is from to . The samples were contained inside aluminum foils which were sealed in aluminum sample cans under helium atmosphere. The empty can signal was subtracted as background at each temperature. The detector efficiency was normalized using a vanadium standard. Data reduction and DOS extraction were performed by LAMP software packageRichard et al. (1996) and the scripts are available upon request. The experiment for glycerol confined in GOM was conducted using the cold neutron multi-chopper spectrometer LET at ISIS in UKBewley et al. (2011). The confined glycerol samples were also fabricated in three different weight ratio h (gram glycerol/gram GOM): 0.2,0.4 and 0.8 The measurement was done with incident energy meV which covers the energy transfer range up to meV and the range from to . Data reduction was performed on Mantid software packagesArnold et al. (2014).
A.6 Molecular dynamics (MD) simulations
The classical MD simulation was performed via the large-scale atomic/molecular massively parallel simulator (LAMMPS)Plimpton (1995) to simulate water and glycerol at K and K, respectively. Water molecules are simulated with the widely used four-point TIP4P/2005Abascal and Vega (2005) model where the energy parameter is eV and the size parameter is Å. The interactions potential of water molecules is modeled by 12-6 Lennard-Jones (LJ) potential with a cutoff radius of Å and the electrostatic forces are calculated with PPPM algorithm with an accuracy of . The system of glycerol was modeled using Material Studio and simulated using the AMBER force field parameters, which have been proven to accurately describe the dynamics and structure of the glycerol system Chelli et al. (1999). All initial structures were relaxed at given temperatures with the isothermal-isobaric (NPT) ensemble for 300 ps. The Nosé-Hoover thermostat and Parrinello-Rahman barostat to control the temperature and pressure, and then switched to NVT ensemble at 100 ps (equilibrium time) to calculate dynamical properties. The Newton equation of motion was integrated using the velocity-Verlet algorithm with a time step of fs per step. We freeze the bottom and top layer ( Å) of the slab systems to force the structure to remain 2D confined during the whole simulation.
A snapshot of the slab geometry can be found in Figure 5 a,b in the main text. The VDOS is calculated by the Fourier transform of the velocity auto-correlation function:
| (5) |
The velocity auto-correlation function (VACF) is defined as:
| (6) |
where are the oxygen velocities. In order to compare with the VDOS from neutron experiments, which mainly comes from the signal of hydrogen atoms, we calculated the VACF with the corresponding VDOS of hydrogen atoms and all atoms(see Figure 5 and Figure 9), respectively.
The Diffusion constant is calculated by the mean square displacements of the water molecules:
| (7) |
where is the position of the particle at time .
The current density is a vector quantity which can be decomposed into a longitudinal part containing the component parallel to the -vector and a transverse part containing the perpendicular component, according to
| (8) |
where we have defined
| (9) | |||
| (10) |
and use to denote the unit vector.
The current correlation functions can now be computed as:
| (11) |
| (12) |
Then the velocity current spectra could be derived using:
| (13) |
Since simple fluids are isotropic, we average over all directions of the wavevector .
| (14) |
where is the number of directions used for averaging.
Appendix B Partial density of states and self-diffusion constant
In Figure 10, we present the simulation density of states of water under different confinement conditions and decomposed into the three different spatial directions x,y,z. At the smallest confinement size (), the scaling of the vibrational density of states (VDOS) in the z-direction, which represents the confined direction, is significantly separated from the scaling of the other two components. It grows faster compared to the horizontal components and its low-frequency power-law is closer to the Debye value. In other words, and perhaps not surprisingly, the the solid-like dynamics is more pronounced along the confined direction. This is in agreement with the results recently appeared in Kuo et al. (2023). The overall VDOS exhibits a scaling that falls between the faster one along the direction and the on-plane one. This might also explains why the full VDOS does not exhibit a quadratic Debye law even at the highest degree of confinement. This is simply because the dynamics along the non-confined directions are still mostly liquid-like. This phenomenon becomes less pronounced as the confinement size increases. In the reference case of bulk water, where the anisotropy is lost, the VDOS scaling for all three components and the overall VDOS perfectly overlap.
Finally, in Figure 8, we report the behavior of the mean-square displacement (MSD) as a function of time and for different degrees of confinement. By fitting the late-time linear behavior we can directly obtain the self-diffusion constant of the system for various confinement strengths. For both confined water and glycerol, the diffusion constant decreases with confinement as reported in the main text in Figure 6.
Appendix C Longitudinal and shear waves dispersion relations and fits
In Figure 6 in the main text, we have reported the simulation dispersion relation for collective shear waves in confined water. We have fitted the simulation data with the following formula obtained from k-gap theory:
| (15) |
and extracted the value of the phenomenological parameters as a function of the confinement size . The results of the fit are reported in Table 2. The data for the k-gap and the relaxation time as a function of are shown in Figure 6 in the main text. Upon confinement, the propagation speed of the collective shear waves varies only of and it can therefore be considered in first approximation as constant.
Unlike shear waves, the dispersion relation of longitudinal waves in confined water is not significantly affected by the variations in the confinement size. The longitudinal speed of sound varies only of under confinement and it can be approximated as well by a constant.
Appendix D The dynamics of shear waves in liquids and the k-gap model
Let us return to our initial telegrapher equation
| (16) |
which describes the dynamical crossover between a propagating wave at large frequency/wave-vector to a overdamped diffusive motion at low energy. By keeping the wave-vector real and assuming the frequency to be a complex number, the solution of the above equation is given by
| (17) |
Clearly, the real part of the frequency becomes non-zero only above the so-called k-gap wave-vector which is given by
| (18) |
Below the k-gap, the mode with lowest energy is diffusive, with dispersion relation . Importantly, and often overlooked in the related literature, the appearance of a non-zero real frequency is not enough to have a propagating mode. Indeed, in order to have a well-defined propagating excitation the real part of the frequency must be larger than its imaginary part. This is nothing else than requiring the relaxation time of the wave excitation to be larger than the period of oscillation, such that oscillations might appear before being completely attenuated. In the opposite scenario, where the imaginary part is too large, the wave decays too quickly and no wave-like oscillation has time to take place. By identifying the overdamped-to-underdamped crossover with the location at which imaginary and real part are of the same order, one obtains a critical wave-vector/frequency which are given respectively by
| (19) |
Notice that this frequency cutoff is a factor smaller than the original Frenkel criterion . The latter corresponds to a larger value of the wave-vector, given by
| (20) |
30 40 50 60 0.06283 0.08886 0.1405 0.1405 (m/s) 1001 1011 1047 1035 7.949 5.565 3.399 3.438 70 80 90 100 0.1539 0.1539 0.1777 0.2205 (m/s) 1070 1070 1071 1072 3.036 3.036 2.626 2.114
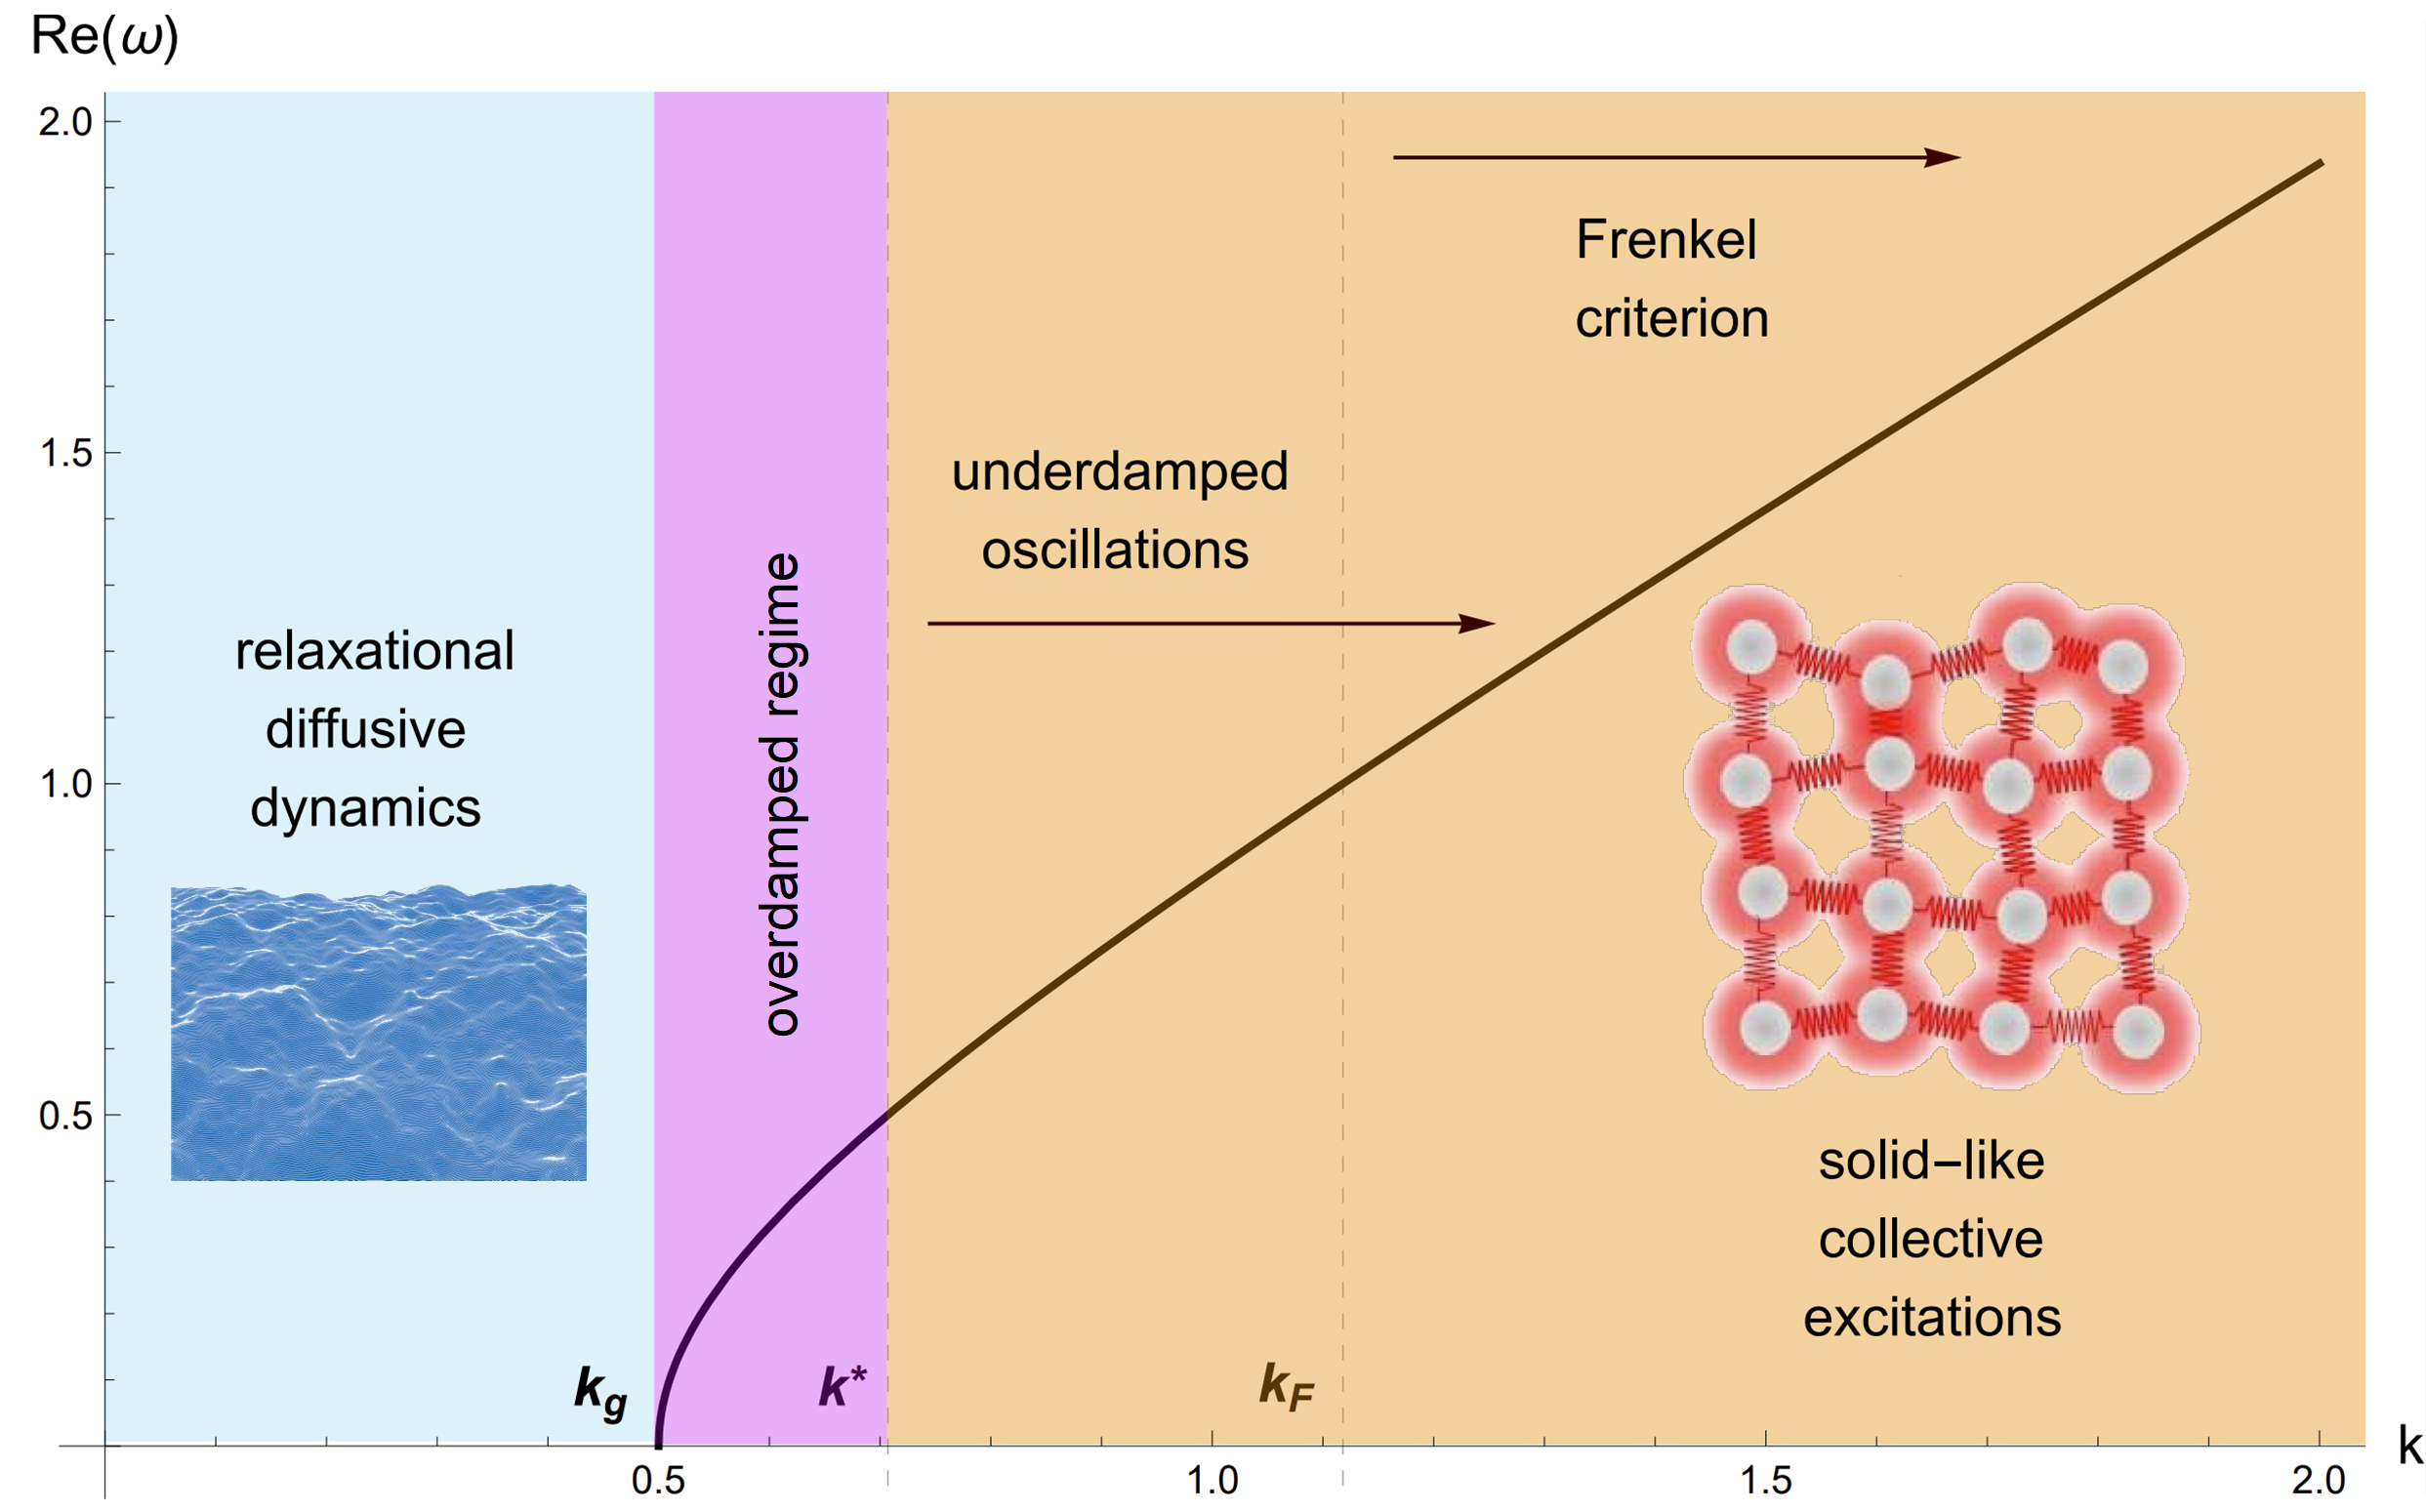
This hierarchy of scales is displayed in Figure 12 together with the real part of the dispersion relation of the collective waves. Importantly, apart from numerical factor (see for example the factor of between for bulk water and the values reported in the literature for the structural relaxation time Cunsolo et al. (1999); Malomuzh and Shakun (2019); O’Sullivan et al. (2019)), which given the simplicity of the models are likely irrelevant, the major outcome of this analysis is that in classical liquids one can define a critical scale, , below which the dynamics is expected to be solid-like.
After discussing the dispersion relation of the collective shear waves described via the telegrapher equation, let us briefly emphasize an interesting outcome of this toy model (see Trachenko (2023) for a recent preprint appeared during the completion of our manuscript and discussing a similar idea). Let us assume that the wave-vector phase space of the shear waves in a liquids is still given by a Debye sphere, as for phonons in solids. Then, the density of states can be derived using the identity
| (21) |
where is the volume in -space. By neglecting the imaginary part of the frequency, and identifying with , we can immediately obtain the frequency dependent density of states which reads
| (22) |
The behavior of this VDOS is shown in Figure 13. The VDOS displays a crossover between a low frequency linear scaling to a quadratic Debye law at large frequency. Interestingly, the change in the behavior coincides exactly with the crossover between the overdamped to underdamped dynamics. Not surprisingly, when the wave is underdamped, the corresponding VDOS is Debye-like as for solids. On the contrary, whenever the wave is overdamped or even not-well defined (relaxational), the VDOS is liquid like. At least in first approximation, this simple computation tells us that the liquid-like linear behavior in liquids should disappear, and smoothly connect with the quadratic Debye scaling, at a frequency scale which is approximately of the order of the Frenkel frequency . In other words, for , even a liquid is expected to display a Debye-like density of state . When the temperature is high, then is very large and the Debye solid like scaling is likely overwhelmed and dominated by other frequency modes. Nevertheless, when the temperature is low, or like in our case when confinement makes small enough, then one could possibly directly see the crossover between and in the low-frequency DOS of liquids. This is exactly what we show in the main text in Figure 7 for the experimental data of confined water. This is qualitatively in perfect agreement with k-gap theory and the original Frenkel idea.
References
- Chaikin and Lubensky (2000) P. Chaikin and T. Lubensky, Principles of Condensed Matter Physics (Cambridge University Press, 2000).
- Boon and Yip (1991) J. P. Boon and S. Yip, Molecular hydrodynamics (Courier Corporation, 1991).
- Cunsolo et al. (1999) A. Cunsolo, G. Ruocco, F. Sette, C. Masciovecchio, A. Mermet, G. Monaco, M. Sampoli, and R. Verbeni, Phys. Rev. Lett. 82, 775 (1999).
- Malomuzh and Shakun (2019) N. P. Malomuzh and K. S. Shakun, Journal of Molecular Liquids 293, 111413 (2019).
- O’Sullivan et al. (2019) T. J. O’Sullivan, S. K. Kannam, D. Chakraborty, B. D. Todd, and J. E. Sader, Phys. Rev. Fluids 4, 123302 (2019).
- Kittel (2021) C. Kittel, Introduction to solid state physics Eighth edition (2021).
- Leutwyler (1997) H. Leutwyler, Helv. Phys. Acta 70, 275 (1997), arXiv:hep-ph/9609466 .
- Hansen and McDonald (1990) J.-P. Hansen and I. R. McDonald, Theory of simple liquids (Elsevier, 1990).
- Keyes (1994) T. Keyes, The Journal of Chemical Physics 101, 5081 (1994).
- Zaccone and Baggioli (2021) A. Zaccone and M. Baggioli, Proceedings of the National Academy of Sciences 118, e2022303118 (2021).
- Zürcher and Keyes (1997) U. Zürcher and T. Keyes, Phys. Rev. E 55, 6917 (1997).
- Wu and Loring (1993) T. Wu and R. F. Loring, The Journal of Chemical Physics 99, 8936 (1993).
- Wan and Stratt (1994) Y. Wan and R. M. Stratt, The Journal of Chemical Physics 100, 5123 (1994).
- Schirmacher et al. (2022) W. Schirmacher, T. Bryk, and G. Ruocco, Proceedings of the National Academy of Sciences 119, e2119288119 (2022).
- Keyes et al. (2002) T. Keyes, J. Chowdhary, and J. Kim, Phys. Rev. E 66, 051110 (2002).
- Keyes (2005) T. Keyes, “Normal mode analysis: Theory and applications to biological and chemical systems,” (Chapman and Hall/CRC, 2005) Chap. The Relation Between Unstable Instantaneous Normal Modes and Diffusion.
- Xu et al. (2023) H. Xu, M. Baggioli, and T. Keyes, arXiv preprint arXiv:2305.02524 (2023).
- Keyes (1997) T. Keyes, The Journal of Physical Chemistry A 101, 2921 (1997).
- Phillips et al. (1989) W. A. Phillips, U. Buchenau, N. Nücker, A.-J. Dianoux, and W. Petry, Phys. Rev. Lett. 63, 2381 (1989).
- Dawidowski et al. (2000) J. Dawidowski, F. Bermejo, C. Cabrillo, and S. Bennington, Chemical Physics 258, 247 (2000).
- Stamper et al. (2022a) C. Stamper, D. Cortie, Z. Yue, X. Wang, and D. Yu, The Journal of Physical Chemistry Letters 13, 3105 (2022a).
- Jin et al. (2023) S. Jin, X. Fan, C. Stamper, R. A. Mole, Y. Yu, L. Hong, D. Yu, and M. Baggioli, arXiv preprint arXiv:2304.14609 (2023).
- Achibat et al. (1995) T. Achibat, E. Duval, J. Dupuy-Philon, J. F. Jal, B. Prevel, and I. Zorkani, The Journal of Chemical Physics 102, 8114 (1995).
- Frenkel (1984) J. Frenkel, Kinetic Theory of Liquids (Peter Smith Publisher, Incorporated, 1984).
- Zwanzig (1967) R. Zwanzig, Phys. Rev. 156, 190 (1967).
- Trachenko and Brazhkin (2015) K. Trachenko and V. Brazhkin, Reports on Progress in Physics 79, 016502 (2015).
- Baggioli et al. (2020) M. Baggioli, M. Vasin, V. Brazhkin, and K. Trachenko, Physics Reports 865, 1 (2020), gapped momentum states.
- Copley and Rowe (1974) J. R. D. Copley and J. M. Rowe, Phys. Rev. Lett. 32, 49 (1974).
- Hosokawa et al. (2009) S. Hosokawa, M. Inui, Y. Kajihara, K. Matsuda, T. Ichitsubo, W.-C. Pilgrim, H. Sinn, L. González, D. González, S. Tsutsui, et al., Physical review letters 102, 105502 (2009).
- Giordano and Monaco (2010) V. M. Giordano and G. Monaco, Proceedings of the National Academy of Sciences 107, 21985 (2010).
- Hosokawa et al. (2015) S. Hosokawa, M. Inui, Y. Kajihara, S. Tsutsui, and A. Q. R. Baron, Journal of Physics: Condensed Matter 27, 194104 (2015).
- Simeoni et al. (2010) G. Simeoni, T. Bryk, F. Gorelli, M. Krisch, G. Ruocco, M. Santoro, and T. Scopigno, Nature Physics 6, 503 (2010).
- Scopigno et al. (2005) T. Scopigno, G. Ruocco, and F. Sette, Rev. Mod. Phys. 77, 881 (2005).
- Baggioli et al. (2022) M. Baggioli, M. Landry, and A. Zaccone, Phys. Rev. E 105, 024602 (2022).
- Khusnutdinoff et al. (2020a) R. M. Khusnutdinoff, C. Cockrell, O. A. Dicks, A. Jensen, M. D. Le, L. Wang, M. T. Dove, A. V. Mokshin, V. Brazhkin, and K. Trachenko, Physical Review B 101, 214312 (2020a).
- Yang et al. (2017) C. Yang, M. T. Dove, V. V. Brazhkin, and K. Trachenko, Phys. Rev. Lett. 118, 215502 (2017).
- Khusnutdinoff et al. (2020b) R. M. Khusnutdinoff, C. Cockrell, O. A. Dicks, A. C. S. Jensen, M. D. Le, L. Wang, M. T. Dove, A. V. Mokshin, V. V. Brazhkin, and K. Trachenko, Phys. Rev. B 101, 214312 (2020b).
- Fomin (2020) Y. D. Fomin, Journal of Physics: Condensed Matter 32, 395101 (2020).
- Guarini et al. (2023) E. Guarini, M. Neumann, A. De Francesco, F. Formisano, A. Cunsolo, W. Montfrooij, D. Colognesi, and U. Bafile, Phys. Rev. E 107, 014139 (2023).
- Yakovlev et al. (2020) E. V. Yakovlev, N. P. Kryuchkov, P. V. Ovcharov, A. V. Sapelkin, V. V. Brazhkin, and S. O. Yurchenko, The Journal of Physical Chemistry Letters 11, 1370 (2020), pMID: 31999463.
- Kryuchkov et al. (2020) N. P. Kryuchkov, L. A. Mistryukova, A. V. Sapelkin, V. V. Brazhkin, and S. O. Yurchenko, Phys. Rev. Lett. 125, 125501 (2020).
- Khrapak et al. (2019) S. A. Khrapak, A. G. Khrapak, N. P. Kryuchkov, and S. O. Yurchenko, The Journal of Chemical Physics 150 (2019), 10.1063/1.5088141, 104503.
- Goree et al. (2012) J. Goree, Z. Donkó, and P. Hartmann, Phys. Rev. E 85, 066401 (2012).
- Murillo (2000) M. S. Murillo, Phys. Rev. Lett. 85, 2514 (2000).
- Ohta and Hamaguchi (2000) H. Ohta and S. Hamaguchi, Phys. Rev. Lett. 84, 6026 (2000).
- Nosenko et al. (2006) V. Nosenko, J. Goree, and A. Piel, Phys. Rev. Lett. 97, 115001 (2006).
- Sampoli et al. (1997) M. Sampoli, G. Ruocco, and F. Sette, Phys. Rev. Lett. 79, 1678 (1997).
- Kume et al. (2021) E. Kume, A. Zaccone, and L. Noirez, Physics of Fluids 33 (2021), 10.1063/5.0051587, 072007.
- Zaccone and Noirez (2021) A. Zaccone and L. Noirez, The Journal of Physical Chemistry Letters 12, 650 (2021), pMID: 33393306.
- Zaccone and Trachenko (2020) A. Zaccone and K. Trachenko, Proceedings of the National Academy of Sciences 117, 19653 (2020).
- Hansen (2021) J. S. Hansen, Molecular Simulation 47, 1391 (2021).
- Baggioli (2021) M. Baggioli, Phys. Rev. D 103, 086001 (2021).
- Tripathy et al. (2019) M. K. Tripathy, D. K. Mahawar, and K. R. S. Chandrakumar, Journal of Chemical Sciences 132, 7 (2019).
- Calero and Franzese (2020) C. Calero and G. Franzese, Journal of Molecular Liquids 317, 114027 (2020).
- Li and Riedo (2008) T.-D. Li and E. Riedo, Phys. Rev. Lett. 100, 106102 (2008).
- Khan et al. (2010) S. H. Khan, G. Matei, S. Patil, and P. M. Hoffmann, Phys. Rev. Lett. 105, 106101 (2010).
- Corti et al. (2021) H. R. Corti, G. A. Appignanesi, M. C. Barbosa, J. R. Bordin, C. Calero, G. Camisasca, M. D. Elola, G. Franzese, P. Gallo, A. Hassanali, K. Huang, D. Laria, C. A. Menéndez, J. M. M. de Oca, M. P. Longinotti, J. Rodriguez, M. Rovere, D. Scherlis, and I. Szleifer, The European Physical Journal E 44, 136 (2021).
- Kuo et al. (2023) Y.-W. Kuo, C.-W. Wang, P.-H. Tang, and T.-M. Wu, Chemical Physics Letters , 140612 (2023).
- Frank and Drikakis (2017) M. Frank and D. Drikakis, Microfluidics and Nanofluidics 21, 148 (2017).
- Chen et al. (2019) S.-H. Chen, C. Corsaro, F. Mallamace, E. Fazio, and D. Mallamace, International Journal of Molecular Sciences 20 (2019), 10.3390/ijms20215373.
- Marcano et al. (2010) D. C. Marcano, D. V. Kosynkin, J. M. Berlin, A. Sinitskii, Z. Sun, A. Slesarev, L. B. Alemany, W. Lu, and J. M. Tour, ACS nano 4, 4806 (2010).
- Romanelli et al. (2016) G. Romanelli, A. Liscio, R. Senesi, R. Zamboni, E. Treossi, F. Liscio, G. Giambastiani, V. Palermo, F. Fernandez-Alonso, and C. Andreani, Carbon 108, 199 (2016).
- Zhang et al. (2022) L. Zhang, Z. Liu, C. Yang, V. Garcia Sakai, M. Tyagi, and L. Hong, ACS nano 16, 13771 (2022).
- Frick et al. (2005) B. Frick, C. Alba-Simionesco, G. Dosseh, C. Le Quellec, A. Moreno, J. Colmenero, A. Schönhals, R. Zorn, K. Chrissopoulou, S. Anastasiadis, and K. Dalnoki-Veress, Journal of Non-Crystalline Solids 351, 2657 (2005).
- Stamper et al. (2022b) C. Stamper, D. Cortie, Z. Yue, X. Wang, and D. Yu, The Journal of Physical Chemistry Letters 13, 3105 (2022b), pMID: 35362320.
- Buchsteiner et al. (2006) A. Buchsteiner, A. Lerf, and J. Pieper, The Journal of Physical Chemistry B 110, 22328 (2006), pMID: 17091972.
- Yu et al. (2022) Y. Yu, C. Yang, M. Baggioli, A. E. Phillips, A. Zaccone, L. Zhang, R. Kajimoto, M. Nakamura, D. Yu, and L. Hong, Nature Communications 13, 3649 (2022).
- Trouw and Price (1999) F. R. Trouw and D. L. Price, Annual Review of Physical Chemistry 50, 571 (1999), pMID: 15012422.
- Gao et al. (2007) J. Gao, R. Szoszkiewicz, U. Landman, E. Riedo, et al., Physical Review B 75, 115415 (2007).
- Ortiz-Young et al. (2013a) D. Ortiz-Young, H.-C. Chiu, S. Kim, K. Voïtchovsky, and E. Riedo, Nature Communications 4, 2482 (2013a).
- Liu et al. (2020) Z. Liu, C. Yang, L. Zhang, Y. Yu, M. Yu, V. Garcia Sakai, M. Tyagi, T. Yamada, L. He, X. Zhang, et al., The Journal of Physical Chemistry C 124, 11064 (2020).
- Ortiz-Young et al. (2013b) D. Ortiz-Young, H.-C. Chiu, S. Kim, K. Voïtchovsky, and E. Riedo, Nature Communications 4, 2482 (2013b).
- Zheng et al. (2022) L. Zheng, Z. Liu, Q. Zhang, S. Li, J. Huang, L. Zhang, B. Zan, M. Tyagi, H. Cheng, T. Zuo, et al., Chemical Science 13, 4341 (2022).
- Taraskin and Elliott (1997) S. Taraskin and S. Elliott, Physical Review B 55, 117 (1997).
- Yu et al. (2013) D. Yu, R. Mole, T. Noakes, S. Kennedy, and R. Robinson, Journal of the Physical Society of Japan 82, SA027 (2013).
- Richard et al. (1996) D. Richard, M. Ferrand, and G. Kearley, J. Neutron Res 4, 33 (1996).
- Bewley et al. (2011) R. Bewley, J. Taylor, and S. Bennington, Nuclear Instruments and Methods in Physics Research Section A: Accelerators, Spectrometers, Detectors and Associated Equipment 637, 128 (2011).
- Arnold et al. (2014) O. Arnold, J.-C. Bilheux, J. Borreguero, A. Buts, S. I. Campbell, L. Chapon, M. Doucet, N. Draper, R. F. Leal, M. Gigg, et al., Nuclear instruments and methods in physics research section a: accelerators, spectrometers, detectors and associated equipment 764, 156 (2014).
- Plimpton (1995) S. Plimpton, Journal of Computational Physics 117, 1 (1995).
- Abascal and Vega (2005) J. L. F. Abascal and C. Vega, The Journal of Chemical Physics 123, 234505 (2005).
- Chelli et al. (1999) R. Chelli, P. Procacci, G. Cardini, R. G. Della Valle, and S. Califano, Physical Chemistry Chemical Physics 1, 871 (1999).
- Trachenko (2023) K. Trachenko, “Viscosity and diffusion in life processes and tuning of fundamental constants,” (2023), arXiv:2307.05273 [physics.bio-ph] .