Cluster charge-density-wave glass in hydrogen-intercalated TiSe2
Abstract
The topotactic intercalation of transition-metal dichalcogenides with atomic or molecular ions acts as an efficient knob to tune the electronic ground state of the host compound. A representative material in this sense is 1-TiSe2, where the electric-field-controlled intercalations of lithium or hydrogen trigger superconductivity coexisting with the charge-density wave phase. Here, we use the nuclear magnetic moments of the intercalants in hydrogen-intercalated 1-TiSe2 as local probes for nuclear magnetic resonance experiments. We argue that fluctuating mesoscopic-sized domains nucleate already at temperatures higher than the bulk critical temperature to the charge-density wave phase and display cluster-glass-like dynamics in the MHz range tracked by the 1H nuclear moments. Additionally, we observe a well-defined independent dynamical process at lower temperatures that we associate with the intrinsic properties of the charge-density wave state. In particular, we ascribe the low-temperature phenomenology to the collective phason-like motion of the charge-density wave being hindered by structural defects and chemical impurities and resulting in a localized oscillating motion.
I Introduction
The wide range of electronic properties characterizing the transition-metal dichalcogenides (TMDs) makes these materials remarkably interesting from both fundamental and application-oriented perspectives [1, 2, 3, 4, 5]. The representative chemical formula of TMDs is MX2, M and X being transition-metal and chalcogen elements, respectively. In spite of their vast chemical variety, TMDs share a common crystallographic structure resulting from the stacking of MX2 trilayers. Each trilayer is composed of an atomically-thin layer of M ions sandwiched between two closely-packed layers made of X ions covalently-bonded with the M ions [6]. The stacked trilayers interact among them via weak van-der-Waals-like forces, the covalent-bond-free interface between different trilayers being referred to as the van der Waals gap. As a result, TMDs can be conveniently exfoliated down to the single-trilayer, two-dimensional limit. The layered structure makes TMDs suited hosts for topotactic intercalation with atomic or molecular ions as well as neutral molecules [7]. The interest for intercalated TMDs is their potential as solid ionic conductors [8, 9, 10] and, at the same time, the efficient control on the electronic properties of the host material offered by the intercalation [11, 12, 13, 14, 15, 16, 17, 18].
A prototypal example in this sense is 1-TiSe2. The pristine composition has been investigated extensively since the 1970’s after the first reports of a commensurate charge-density wave (CDW) state developing from a high-temperature semimetallic phase [19, 20]. The historical relevance of this discovery, together with similar observations in other TMDs, was the departure from the then-accepted paradigm, due to Peierls, of the CDW transition being specific of one-dimensional systems simultaneously undergoing a metal-to-insulator phase transition – both aspects being violated in TMDs [21, 22, 23, 24, 25, 26, 27, 28, 29]. Although the transition temperature to the CDW phase is K, a gap opening was reported in limited portions of the Fermi surface already at higher temperatures [30, 31], consistently with the observation of higher transition temperatures to the CDW state in the single-trilayer limit [32, 33, 34]. The properties of the CDW phase in pristine 1-TiSe2 are highly peculiar [35, 36] and, almost fifty years after its first observation, the discussion on the main driving microscopic mechanism underlying such state – electron-phonon coupling as opposed to exciton condensation – is still ongoing [37, 38, 39, 40, 41, 42, 43, 44, 45, 46, 47, 48, 49, 50].
The electronic properties of the pristine 1-TiSe2 composition can be tuned by physical and/or chemical means. Superconductivity with critical temperatures around a few Kelvins is triggered by pressure [51], electric-field-induced charge doping [52], and by intercalation using different atomic ions [53, 54, 55]. The CDW phase is suppressed by electric-field-induced charge doping [52], copper intercalation [53], and titanium self-doping [56] – however, the electric-field-controlled intercalation using lithium [54] and hydrogen [55] does not alter the value estimated by means of electrical transport measurements. Remarkably, a structure of nanoscopic domains with alternating commensurate-incommensurate CDW phases emerges in 1-TiSe2 when perturbed by electric fields or by the Li intercalation, the superconducting state being possibly confined to the incommensurate-CDW domains [52, 54]. In spite of the detailed description of the spatial intertwining of different phases at low temperatures, a microscopic investigation of the high-temperature CDW state in the intercalated systems is still missing.
In this work, we use the magnetic moments of 1H nuclei in hydrogen-intercalated 1-TiSe2 as local probes for nuclear magnetic resonance (NMR) experiments. Based on our modelling of the temperature dependence of the spin-lattice relaxation rate of the 1H nuclear magnetization, we argue that a cluster CDW glass state is realized in the high-temperature limit, favoured by the disordered configuration of the intercalants. Our evidences suggest that fluctuating mesoscopic-sized domains nucleate already at temperatures higher than , slowing down towards a percolating CDW state throughout the sample and resulting in slow dynamics in the MHz range tracked by the 1H nuclear moments. Additionally, we observe a well-defined independent dynamical process at lower temperatures that we associate with the intrinsic properties of the CDW state. In particular, we argue that the collective phason-like motion of the CDW is hindered by structural defects and chemical impurities acting as pinning centres, resulting in a localized oscillating motion detected by the nuclear moments.
II Experimental details and results
We protonated flake-like 1-TiSe2 single crystals (HQ Graphene) immersing them in a Duran crucible filled with -ethyl--methylimidazolium tetrafluoroborate (Sigma Aldrich) immediately after cleavage and applying a gate voltage V between a platinum electrode and 1-TiSe2 [55]. For this aim, the crystals were electrically contacted via a small droplet of silver paste (RS Components). All the samples were gated in ambient atmosphere and at temperature K, using the gating time as a knob to control the protonation state [55]. After the gating process, we thoroughly rinsed the crystals with acetone and ethanol and stored them in a vacuum dessicator.
We performed pulsed 1H NMR experiments [57, 58, 59, 60, 61] at two fixed values of magnetic field ( T and T). The field was oriented parallel to the crystallographic planes of a collection of six stacked protonated 1-TiSe2 crystals (gating time minutes), each with approximate surface mm2. We controlled the sample temperature with a dynamic continuous-flow cryostat using either liquid helium or liquid nitrogen, quantifying the temperature value using a thermocouple end close to the sample site. The data shown in the text belong to several cooling and warming cycles and, in order to maximize the reproducibility of the results, we always aimed at comparable thermal protocols. In particular, we cooled the sample in-field down to the lowest attainable temperature (depending on the cryogenic liquid being used) and settled the temperature on warming to perform each measurement.
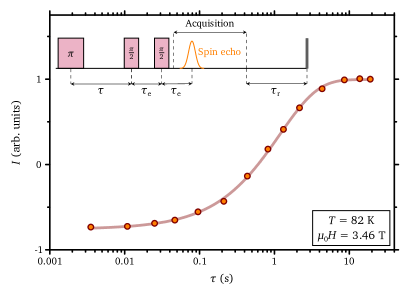
We base all our results on the conventional inversion-recovery sequence of radiofrequency pulses shown in Fig. 1 (inset). The two pulses, with typical length s and separated by s, generate a solid echo at time after the second pulse. The sign and amplitude of the echo depend on the variable time between the inversion pulse and the first pulse. For each value, the sequence is repeated and the signal cumulated until a satisfactory signal-to-noise ratio is achieved. The second half of the echo signal is fast-Fourier-transformed and the integral of the transform is reported as a function of to obtain the time-recovery of the nuclear magnetization towards the state of thermal equilibrium – see Fig. 1 for representative data. In the case of spin- nuclei, the expected recovery for the nuclear magnetization is purely exponential according to the following function [60]
| (1) |
from which the spin-lattice relaxation time is quantified. The fitting function in Eq. (1) accounts for possible deviations of the pulse lengths from their ideal values, resulting in an imperfect initial inversion of the nuclear magnetization. Also, Eq. (1) accounts for possible deviations from the expected exponential behaviour through the empirical stretching parameter , so accounting for non homogeneous local environments probed by the nuclei. Finally, the fast-Fourier-transformed echo for the longest value, i.e., such that the thermal equilibrium is attained, is fitted using an empirical Gaussian function
| (2) |
in order to quantify the linewidth – see the inset to Fig. 2 for representative data ( is the Larmor frequency and the subtended area). Importantly, the repetition time is calibrated in every measurement so that to allow the nuclear magnetization to reach the equilibrium state before starting the pulsed sequence over again.
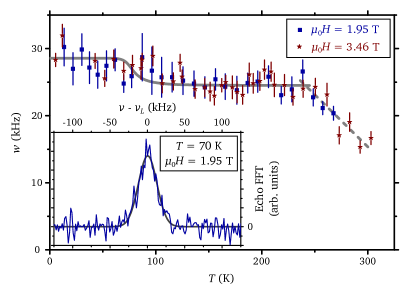
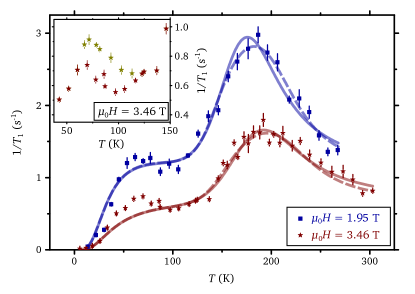
We report the dependence of the spectral width on temperature in Fig. 2. The linewidth is approximately constant below K and it sharply gets much narrower at higher temperatures. In spite of the sizeable error bars, it is possible to detect a weak, field-independent increase of the linewidth on cooling the sample below K. The dependence of on temperature is shown in Fig. 3 for the two values of magnetic field. Although not shown explicitly, the stretching parameter takes values within the whole investigated temperature window without any detectable trend. As prominent features, we notice a local maximum at around K followed by a marked peak at around K. The amplitude as well as the position of these peaks are dependent on the magnetic field. In spite of the comparable thermal protocols used to perform our measurements, we stress that the spin-lattice relaxation rate shows effects of thermal history, as highlighted in the inset to Fig. 3. In the following analysis, we will refer to the lower branch (red stars) because of an overall agreement shown between cooling cycles using liquid nitrogen and helium (with the exception of one specific cooling cycle using liquid nitrogen, denoted with yellow stars).
III Modelling the spin-lattice relaxation rate
The nuclear spin-lattice relaxation rate is proportional to the spectral density of the fluctuating local magnetic field at the nuclear site in the directions orthogonal to the quantization axis, and calculated at the Larmor angular frequency [57, 60]. Assuming that the autocorrelation function for the fluctuations of the local field is an exponentially-decaying function leads to a conventional Lorentzian functional form for the spectral density [62]
| (3) |
governed by the correlation time characterizing the dynamics. In the particular case of the relaxation being driven by the time-modulation of the nuclear dipole-dipole interaction, the following Kubo-Tomita (KT) formula is valid for the spin-lattice relaxation rate [63, 57]
| (4) |
where the factor includes the mean square amplitude of the transverse fluctuating field and the proton gyromagnetic ratio . Accordingly, we write
| (5) |
to account for the two independent processes observed at low and high temperature in the experimental data (LT and HT, respectively). Assuming and , i.e., an Arrhenius-like dependence on temperature for both the correlation times with activation temperatures and , gives us a fitting function to describe the experimental data in Fig. 3.
The results of a global data fitting based on Eq. (5), sharing all the fitting parameters except the Larmor frequencies between the two datasets, are shown in the main panel of Fig. 3 as continuous lines. The numerical results of the fitting parameters are reported in Tab. 1. The agreement with the experimental data is satisfactory in spite of the deviation observed for K for the high-field data. We stress that the slowing down of a time-modulated nuclear dipole-dipole interaction should be reflected in an extra-broadening of the spectral linewidth upon decreasing temperature based on the expression [57]
| (6) |
where is the rigid-lattice linewidth. We solved Eq. (6) using the fitting parameters estimated from the global-fitting procedure described above and, in particular, the numerical values defining . The result is shown by the continuous line in the main panel of Fig. 2. In spite of the sizeable error bars, the experimental data are consistent with the expected trend. A similar increase in the linewidth is expected at even lower temperatures based on Eq. (6) using – however, our experimental data at low temperatures are not dense enough to resolve the expected behaviour.
The quality of the global fitting in the main panel of Fig. 3 can be improved by assuming a statistical distribution of correlation times . For this aim, a straightforward way to proceed is to assume a well-defined value for and a flat, square distribution of activation energies extended over the window . The analytical result is derived in Appendix A. Plugging Eq. (A) for the HT process in Eq. (5) and repeating the global data fitting results in the dashed lines in Fig. 3. The numerical results of the fitting parameters are reported in Tab. 1.
IV Discussion
We interpret the sharp decrease of the spectral linewidth upon increasing temperature above K as a motional-narrowing effect associated with the diffusion of the intercalated hydrogen ions. More precisely, we argue that the condition (i.e., s) is satisfied for K, where is the correlation time characteristic of the hydrogen diffusion throughout the lattice. To reinforce our interpretation, we notice that our results are in perfect qualitative agreement with previous continuous-wave NMR measurements on hydrogen-intercalated 1-TiS2 [64]. This latter material is of particular importance for our aims since it is isostructural to 1-TiSe2 and, interestingly, it does not show any transition to a CDW phase. Based on these arguments, we safely conclude that the hydrogen ions form a rigid lattice integral with the 1-TiSe2 host crystal lattice for K, i.e., where we observe all the features that we are going to discuss below.
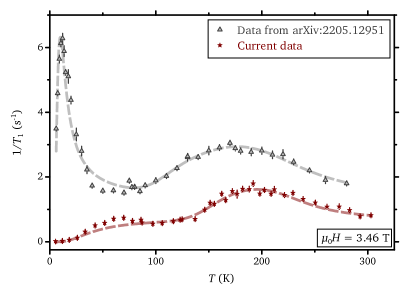
Before proceeding with the interpretation of our data, is interesting to compare the current results with the dependence of on temperature at T reported previously in Ref. [55] for another collection of stacked protonated 1-TiSe2 crystals (gating time minutes – see Fig. 4). Our previous interpretation of those data was based on the Korringa-like linear trend between and K, suggesting that the deviations at higher temperatures could be due to a reconstruction of the Fermi surface resulting from the CDW state onset [55]. Such an interpretation was motivated by the observation of generalized Korringa trends both in pristine, isotopically-enriched TiSe2 measured by 77Se NMR [65] as well as in other TMDs such as VSe2, VS2 and IrTe2 [66, 67, 68]. The additional marked peak at lower temperature was reported for pristine TiSe2 as well [65] – although its origin has remained, to the best of our knowledge, elusive [69] – clearly suggesting that our 1H NMR measurements are directly probing the intrinsic dynamics of TiSe2. However, at this stage, the new currently discussed results urge us to reinterpret all the data within the same model. In particular, it is clear that the spin-lattice relaxation rate should be described for all the samples in terms of two well-defined maxima located at low and high temperatures, respectively, the latter seemingly correlating with . The result of a best-fitting procedure based on Eqs. (5) and (A), again assuming a flat distribution of correlation times for the HT process, is reported as a dashed line in Fig. 4 (and the resulting fitting parameters in Tab. 1) showing a satisfactory agreement with the experimental data. In spite of the major quantitative differences between the two samples, we argue that the underlying mechanisms leading to the spin-lattice relaxation are the same.
IV.1 High-temperature peak
We focus on the K limit first. In spite of the limited amount of experimental data, the results for pristine TiSe2 in Ref. [65] do not highlight any well-defined maximum in the spin-lattice relaxation rate for K, thus suggesting that the currently observed feature is specific to the hydrogen-intercalated system. The broad shape of the temperature dependence of , together with the characteristic dependence on the magnetic field, suggest that the origin of the observed maximum should not be associated with any critical dynamics. Consistently with the observation on the narrowing of the spectral linewidth, it is unrealistic to associate such dynamics to the diffusion of the intercalated ions as, based on our comments above, the condition is satisfied at least up to K. Consistently with these arguments, we stress that several systems with comparable structure and chemical formula show diffusion-related maxima in at higher temperatures if compared to our observations [70, 71, 72, 73, 74, 75, 76].
It is reasonable that the – presumably sample-dependent – intrinsic disorder associated with the intercalation process is reflected in a short-range ordered CDW phase [77]. Here, the order is confined within correlated mesoscopic islands lacking phase coherence among themselves at high temperatures until long-range order is recovered for . The slow dynamics of the disordered state, corresponding to a CDW glass [78] or – more precisely – cluster glass, results in a non-critical peak in the spin-lattice relaxation rate consistent with our observations [79, 80]. The persistence of the contribution to at temperatures well above could imply that the intercalation process favours the insurgence of a segregated, preemptive CDW state at high temperatures, amplifying the tendency of the system towards the order implied by the partial gap opening for [30, 31].
Within this scenario, two different mechanisms can be identified in order to justify the relaxation mechanism for the nuclear ensemble. On the one hand, the dynamics of the CDW clusters would induce a slow, non-critical local dynamics of the lattice and of the intercalated hydrogen ions, in turn. In this view, a conventional nuclear dipole-dipole relaxation among the intercalated ions would be induced and drive the spin-lattice relaxation – thus justifying the use of Eq. (4) above. Another possible mechanism is the time-modulation of the Knight shift distribution induced by the CDW state [81, 82]. The lack of any dependence of the extra linewidth broadening for K on the magnetic field (see Fig. 2), seems to rule out the latter mechanism in favour of the nuclear dipole-dipole relaxation.
IV.2 Low-temperature peak
We now focus on the peak in observed for K in Figs. 3 and 4. As mentioned above, this maximum as well as a frequency-dependent anomaly in the internal friction were observed in the same temperature range in pristine TiSe2 [65, 83, 84]. This is a strong hint that the phenomenology observed by our experiments is not induced by the hydrogen intercalation but that it should rather be related to the intrinsic electronic properties of 1-TiSe2. Another interesting observation comes from copper-intercalated CuxTiSe2. It is well known that increasing the amount of intercalated copper acts as an efficient knob to progressively weaken the CDW state until its full suppression for while superconductivity develops for [53]. This said, it is remarkable that the spin-lattice relaxation rate measured by 77Se NMR in two CuxTiSe2 samples where the CDW state is strongly suppressed or even absent only show a well-defined Korringa-like linear dependence on temperature over the entire accessed range down to low temperatures [85]. Associating the well-defined low-temperature peak in to the intrinsic properties of the CDW is consistent with this latter observation. We stress that the local detection of intrinsic CDW features at the hydrogen site confirms that the phase segregation of CDW-ordered, hydrogen-poor regions and superconducting, hydrogen-rich regions – with progressive volume redistribution within the two as the protonation time increases – is not the correct model to describe the state realized by the intercalation, as already argued in [55].
Having excluded that the low-temperature maximum in arises from a change in the electronic structure or from the onset of magnetism [19, 65, 86, 87], a possible explanation for our results is that the spin-lattice relaxation is influenced by the low-frequency dynamics of the CDW itself. Indeed, the collective excitations of the CDW state (i.e., phase- and amplitude-modes) can influence the spin-lattice relaxation [88, 89, 90] – however, some words of caution are in order. The vast majority of the results have been obtained using quadrupolar nuclei that couple directly with the local electric-field gradients and lattice distortions generated by the CDW state [91, 92, 93, 94, 95, 96, 97]. In our current case of 1H-NMR, we argue that the mechanism underlying the spin-lattice relaxation is due to a time-modulated nuclear dipole-dipole interaction due to a time-modulated lattice distortion induced by the CDW dynamics (see above).
At the same time, it is well-known that collective phase-mode excitations are not free to slip throughout the system in the case of a commensurate CDW state [90] akin to the one realized in TiSe2, where the lattice is particularly efficient in pinning the spatial modulation of the charge. For this reason, we assume that the CDW state is localized but still able to oscillate around its equilibrium position as a result of thermal excitations. In this case, the time-dependent oscillations of the CDW can induce an efficient relaxation when the characteristic correlation time of the dynamics matches the inverse of the Larmor frequency. We expect that this phenomenology is strongly influenced by the level (and, more in general, the strength) of impurities, structural defects, and disorder in the system [98, 99, 100, 101, 102], acting as pinning centres for the CDW state. Both the sample-dependent position and amplitude of the low-temperature peak as well as the observation of clear thermal-history hysteretic effects are consistent with this expectation [103]. Based on this interpretation, the observation of a higher value for the current data – if compared to the results reported in Ref. [55] – suggest that the currently-investigated sample contains a much higher degree of impurities and structural defects. This expectation is seemingly confirmed by the dependence of the electrical resistivity () on temperature (see Ref. [55]) and by the residual resistivity ratio (), , characteristic of the two samples ( being the residual resistivity just before superconductivity sets in). for the current sample while for the sample studied in Ref. [55], consistently with a lower degree of impurities and defects in the latter case.
V Summarizing remarks and conclusions
We discussed the results of 1H nuclear magnetic resonance experiments on hydrogen-intercalated TiSe2 crystals, where the intercalation induces robust and non-volatile superconductivity [55]. Our results suggest that the disorder associated with the intercalation induces an inhomogeneous charge-density wave phase. In particular, we argue that stable mesoscopic charge-density-wave-ordered regions lacking phase coherence among them nucleate already at temperatures higher than the bulk transition temperature . The non-critical dynamics of this cluster-glass charge-density wave state influences the spin-lattice relaxation of the 1H nuclear magnetization, showing a well-defined Kubo-Tomita-like trend with a characteristic dependence on temperature and on the magnetic field. Additionally, we reported clear evidences of an additional anomaly in the spin-lattice relaxation rate at low temperatures akin to what was reported for the pristine TiSe2 composition in Ref. [65] and whose origin should be related to the intrinsic properties of the charge-density wave phase. The low-temperature dynamics is strongly sample-dependent and is likely associated with the complicated interplay of the charge-density wave state with pinning centres such as impurities and structural defects. Further complementary insights into the charge-density wave dynamics could be obtained performing 7Li nuclear magnetic resonance experiments on lithiated TiSe2, exploiting the non-vanishing quadrupole moment of 7Li nuclei and its direct coupling to local electric-field gradients and lattice distortions generated by the charge-density wave phase.
Acknowledgements
We acknowledge insightful discussions with F. Borsa and A. Rigamonti. We thank S. Resmini for support during the NMR measurements.
Appendix A Generalization of the Kubo-Tomita expression in the presence of a constant distribution of activation temperatures
The well-known Kubo-Tomita expression for the spin-lattice relaxation induced by the nuclear dipole-dipole interaction can be written as follows [63]
| (7) |
with contributions from the spectral density for the fluctuations of the local magnetic field perpendicular to the quantization axis calculated at and . Assuming an Arrhenius-like temperature dependence for both the correlation time and substituting in Eq. (7), it is straightforward to show that
| (8) | |||||
The effect of a distribution of correlation times (and, in particular, of activation energies) can be accounted for by considering the expression
where is a normalized probability distribution function. An approximated but convenient choice is that of a constant distribution such that for (and elsewhere). Consequently,
| (10) | |||||
which is solved as
References
- Radisavljevic et al. [2011] B. Radisavljevic, A. Radenovic, J. Brivio, V. Giacometti, and A. Kis, Single-layer MoS2 transistors, Nature Nanotechnology 6, 147 (2011).
- Wang et al. [2012] Q. H. Wang, K. Kalantar-Zadeh, A. Kis, J. N. Coleman, and M. S. Strano, Electronics and optoelectronics of two-dimensional transition metal dichalcogenides, Nature Nanotechnology 7, 699 (2012).
- Geim and Grigorieva [2013] A. Geim and I. Grigorieva, Van der Waals heterostructures, Nature 499, 419 (2013).
- Koppens et al. [2014] F. H. L. Koppens, T. Mueller, P. Avouris, A. C. Ferrari, M. S. Vitiello, and M. Polini, Photodetectors based on graphene, other two-dimensional materials and hybrid systems, Nature Nanotechnology 9, 780 (2014).
- Manzeli et al. [2017] S. Manzeli, D. Ovchinnikov, D. Pasquier, O. V. Yazyev, and A. Kis, 2D transition metal dichalcogenides, Nature Reviews Materials 2, 17033 (2017).
- Wilson and Yoffe [1969] J. A. Wilson and A. D. Yoffe, The transition metal dichalcogenides. Discussion and interpretation of the observed optical, electrical and structural properties, Advances in Physics 18, 193 (1969).
- Dresselhaus [1986] M. S. Dresselhaus, ed., Intercalation in layered materials (Springer, 1986).
- Whittingham [1978] M. S. Whittingham, Chemistry of intercalation compounds: metal guests in chalcogenide hosts, Progress in Solid State Chemistry 12, 41 (1978).
- Samaras et al. [1989] I. Samaras, S. I. Saikh, C. Julien, and M. Balkanski, Lithium insertion in layered materials as battery cathodes, Materials Science and Engineering: B 3, 209 (1989).
- Powell [1993] A. V. Powell, Intercalation compounds of low-dimensional transition metal chalcogenides, Annual Reports on the Progress of Chemistry, Section C 90, 177 (1993).
- Parkin and Friend [1979] S. S. P. Parkin and R. H. Friend, 3d transition-metal intercalates of the niobium and tantalum dichalcogenides. I. Magnetic properties, Philosophical Magazine B 41, 65 (1979).
- Friend and Yoffe [1987] R. H. Friend and A. D. Yoffe, Electronic properties of intercalation complexes of the transition metal dichalcogenides, Advances in Physics 36, 1 (1987).
- Klemm [2015] R. A. Klemm, Pristine and intercalated transition metal dichalcogenide superconductors, Physica C 514, 86 (2015).
- Voiry et al. [2015] D. Voiry, A. Mohite, and M. Chhowalla, Phase engineering of transition metal dichalcogenides, Chemical Society Reviews 44, 2702 (2015).
- Wang et al. [2018] R. Wang, Y. Yu, S. Zhou, H. Li, H. Wong, Z. Luo, L. Gan, and T. Zhai, Strategies on phase control in transition metal dichalcogenides, Advanced Functional Materials 28, 1802473 (2018).
- Li et al. [2021] Y. Li, H. Yan, B. Xu, L. Zhen, and C.-Y. Xu, Electrochemical intercalation in atomically thin van der Waals materials for structural phase transition and device applications, Advanced Materials 33, 2000581 (2021).
- Wang et al. [2021] M. Wang, S. Xu, and J. J. Cha, Revisiting intercalation-induced phase transitions in 2D group VI transition metal dichalcogenides, Advanced Energy & Sustainability Research 2, 2100027 (2021).
- Vaney et al. [2022] J.-B. Vaney, B. Vignolle, A. Demourgues, E. Gaudin, E. Durand, C. Labrugère, A. Bernardini, F. Cano, and S. Tencé, Topotactic fluorination of intermetallics as an efficient route towards quantum materials, Nature Communications 13, 1462 (2022).
- Di Salvo et al. [1976] F. J. Di Salvo, D. E. Moncton, and J. V. Waszczak, Electronic properties and superlattice formation in the semimetal TiSe2, Physical Review B 14, 4321 (1976).
- Rasch et al. [2008] J. C. E. Rasch, T. Stemmler, B. Müller, L. Dudy, and R. Manzke, 1T-TiSe2: semimetal or semiconductor?, Physical Review Letters 101, 237602 (2008).
- Peierls [1955] R. E. Peierls, Quantum theory of solids (Oxford University Press, 1955).
- Di Salvo and Rice [1979] F. J. Di Salvo and T. M. Rice, Charge-density waves in transition-metal compounds, Physics Today 32(4), 32 (1979).
- Coleman et al. [1988] R. V. Coleman, B. Giambattista, P. K. Hansma, A. Johnson, W. W. McNairy, and C. G. Slough, Scanning tunnelling microscopy of charge-density waves in transition metal chalcogenides, Advances in Physics 37, 559 (1988).
- Grüner [1988] G. Grüner, The dynamics of charge-density waves, Reviews of Modern Physics 60, 1129 (1988).
- Thorne [1996] R. E. Thorne, Charge-density-wave conductors, Physics Today 49(5), 42 (1996).
- Wilson et al. [2001] J. A. Wilson, F. J. Di Salvo, and S. Mahajan, Charge-density waves and superlattices in the metallic layered transition metal dichalcogenides, Advances in Physics 50, 1171 (2001).
- Li et al. [2007] G. Li, W. Z. Hu, D. Qian, D. Hsieh, M. Z. Hasan, E. Morosan, R. J. Cava, and N. L. Wang, Semimetal-to-semimetal charge density wave transition in 1T-TiSe2, Physical Review Letters 99, 027404 (2007).
- Monceau [2012] P. Monceau, Electronic crystals: an experimental overview, Advances in Physics 61, 325 (2012).
- Zhu et al. [2017] X. Zhu, J. Guo, J. Zhang, and E. W. Plummer, Misconceptions associated with the origin of charge density waves, Advances in Physics X 2, 622 (2017).
- Miyahara et al. [1995] Y. Miyahara, H. Bando, and H. Ozaki, Tunnelling spectroscopic study of the CDW energy gap in TiSe2, Journal of Physics: Condensed Matter 7, 2553 (1995).
- Chen et al. [2016] P. Chen, Y.-H. Chan, X.-Y. Fang, S.-K. Mo, Z. Hussain, A.-V. Fedorov, M. Y. Chou, and T.-C. Chiang, Hidden order and dimensional crossover of the charge density waves in TiSe2, Scientific Reports 6, 37910 (2016).
- Goli et al. [2012] P. Goli, J. Khan, D. Wickramaratne, R. K. Lake, and A. A. Balandin, Charge density waves in exfoliated films of van der Waals materials: evolution of Raman spectrum in TiSe2, Nano Letters 12, 5941 (2012).
- Chen et al. [2015] P. Chen, Y.-H. Chan, X.-Y. Fang, Y. Zhang, M. Y. Chou, S.-K. Mo, Z. Hussain, A.-V. Fedorov, and T.-C. Chiang, Charge density wave transition in single-layer titanium diselenide, Nature Communications 6, 8943 (2015).
- Sugawara et al. [2016] K. Sugawara, Y. Nakata, R. Shimizu, P. Han, T. Hitosugi, T. Sato, and T. Takahashi, Unconventional charge-density-wave transition in monolayer 1T-TiSe2, ACS Nano 10, 1341 (2016).
- Ishioka et al. [2010] J. Ishioka, Y. H. Liu, K. Shimatake, T. Kurosawa, K. Ichimura, Y. Toda, M. Oda, and S. Tanda, Chiral charge-density waves, Physical Review Letters 105, 176401 (2010).
- Xu et al. [2020] S.-Y. Xu, Q. Ma, Y. Gao, A. Kogar, A. Zong, A. M. Mier Valdivia, T. H. Dinh, S.-M. Huang, B. Singh, C.-H. Hsu, T.-R. Chang, J. P. C. Ruff, K. Watanabe, T. Taniguchi, H. Lin, G. Karapetrov, D. Xiao, P. Jarillo-Herrero, and N. Gedik, Spontaneous gyrotropic electronic order in a transition-metal dichalcogenide, Nature 578, 545 (2020).
- Halperin and Rice [1968a] B. I. Halperin and T. M. Rice, Possible anomalies at a semimetal-semiconductor transistion, Reviews of Modern Physics 40, 755 (1968a).
- Halperin and Rice [1968b] B. I. Halperin and T. M. Rice, The excitonic state at the semiconductor-semimetal transition, Solid State Physics 21, 115 (1968b).
- Hughes [1977] H. P. Hughes, Structural distortion in TiSe2 and related materials - a possible Jahn-Teller effect?, Journal of Physics C: Solid State Physics 10, L319 (1977).
- White and Lucovsky [1977] R. M. White and G. Lucovsky, Suppression of antiferroelectricity in TiSe2 by excess carriers, Il Nuovo Cimento B 38, 280 (1977).
- Wilson [1977] J. A. Wilson, Concerning the semimetallic characters of TiS2 and TiSe2, Solid State Communications 22, 551 (1977).
- Gaby et al. [1981] J. H. Gaby, B. DeLong, F. C. Brown, R. Kirby, and F. Lévy, Origin of the structural transition in TiSe2, Solid State Communications 39, 1167 (1981).
- Holt et al. [2001] M. Holt, P. Zschack, H. Hong, M. Y. Chou, and T.-C. Chiang, X-ray studies of phonon softening in tise2, Physical Review Letters 86, 3799 (2001).
- Kidd et al. [2002] T. E. Kidd, T. Miller, M. Y. Chou, and T.-C. Chiang, Electron-hole coupling and the charge density wave transition in TiSe2, Physical Review Letters 88, 226402 (2002).
- Rossnagel et al. [2002] K. Rossnagel, L. Kipp, and M. Skibowski, Charge-density-wave phase transition in 1T-TiSe2: excitonic insulator versus band-type Jahn-Teller mechanism, Physical Review B 65, 235101 (2002).
- Kogar et al. [2017] A. Kogar, M. S. Rak, S. Vig, A. A. Husain, F. Flicker, Y. I. Joe, L. Venema, G. J. MacDougall, T. C. Chiang, E. Fradkin, J. van Wezel, and P. Abbamonte, Signatures of exciton condensation in a transition metal dichalcogenide, Science 358, 1314 (2017).
- Wegner et al. [2020] A. Wegner, J. Zhao, J. Li, J. Yang, A. A. Anikin, G. Karapetrov, K. Esfarjani, D. Louca, and U. Chatterjee, Evidence for pseudo-Jahn-Teller distortions in the charge density wave phase of 1T-TiSe2, Physical Review B 101, 195145 (2020).
- Otto et al. [2021] M. R. Otto, J.-H. Pöhls, L. P. R. de Cotret, M. J. Stern, M. Sutton, and B. J. Siwick, Mechanisms of electron-phonon coupling unraveled in momentum and time: The case of soft phonons in TiSe2, Science Advances 7, eabf2810 (2021).
- Lin et al. [2022] Z. Lin, C. Wang, A. Balassis, J. P. Echeverry, A. S. Vasenko, V. M. Silkin, E. V. Chulkov, Y. Shi, J. Zhang, J. Guo, and X. Zhu, Dramatic plasmon response to the charge-density-wave gap development in 1T-TiSe2, Physical Review Letters 129, 187601 (2022).
- Novko et al. [2022] D. Novko, Z. Torbatian, and I. Lončarič, Electron correlations rule the phonon-driven instability in single-layer TiSe2, Physical Review B 106, 245108 (2022).
- Kusmartseva et al. [2009] A. F. Kusmartseva, B. Sipos, H. Berger, L. Forró, and E. Tutiš, Pressure induced superconductivity in pristine -TiSe2, Physical Review Letters 103, 236401 (2009).
- Li et al. [2016] L. J. Li, E. C. T. O’Farrell, K. P. Loh, B. Özyilmaz, and A. H. Castro Neto, Controlling many-body states by the electric-field effect in a two-dimensional material, Nature 529, 185 (2016).
- Morosan et al. [2006] E. Morosan, H. W. Zandbergen, B. S. Dennis, J. W. G. Bos, Y. Onose, T. Klimczuk, A. P. Ramirez, N. P. Ong, and R. J. Cava, Superconductivity in CuxTiSe2, Nature Physics 2, 544 (2006).
- Liao et al. [2021] M. Liao, H. Wang, Y. Zhu, R. Shang, M. Rafique, L. Yang, H. Zhang, D. Zhang, and Q.-K. Xue, Coexistence of resistance oscillations and the anomalous metal phase in a lithium intercalated TiSe2 superconductor, Nature Communications 12, 5342 (2021).
- Piatti et al. [2022] E. Piatti, G. Prando, M. Meinero, C. Tresca, M. Putti, S. Roddaro, G. Lamura, T. Shiroka, P. Carretta, G. Profeta, D. Daghero, and R. S. Gonnelli, Superconductivity induced by gate-driven hydrogen intercalation in the charge-density-wave compound 1T-TiSe2, arXiv:2205.12951 (2022).
- Jaouen et al. [2019] T. Jaouen, B. Hildebrand, M.-L. Mottas, M. Di Giovannantonio, P. Ruffieux, M. Rumo, C. W. Nicholson, E. Razzoli, C. Barreteau, A. Ubaldini, E. Giannini, F. Vanini, H. Beck, C. Monney, and P. Aebi, Phase separation in the vicinity of Fermi surface hot spots, Physical Review B 100, 075152 (2019).
- Abragam [1961] A. Abragam, Principles of nuclear magnetism (Oxford University Press, 1961).
- Fukushima and Roeder [1981] E. Fukushima and S. B. W. Roeder, Experimental pulse NMR. A nuts and bolts approach (Addison-Wesley Publishing Company, Inc., 1981).
- Ernst et al. [1987] R. R. Ernst, G. Bodenhausen, and A. Wokaun, Principles of nuclear magnetic resonance in one and two dimensions (Oxford University Press, 1987).
- Slichter [1990] C. P. Slichter, Principles of magnetic resonance, 3rd ed. (Springer-Verlag, Berlin, Heidelberg, 1990).
- Levitt [2008] M. H. Levitt, Spin dynamics. Basics of nuclear magnetic resonance (John Wiley & Sons, Ltd, 2008).
- Bloembergen et al. [1948] N. Bloembergen, E. M. Purcell, and R. V. Pound, Relaxation effects in nuclear magnetic resonance absorption, Physical Review 73, 679 (1948).
- Kubo and Tomita [1954] R. Kubo and K. Tomita, A general theory of magnetic resonance absorption, Journal of the Physical Society of Japan 9, 888 (1954).
- Ritter et al. [1986] C. Ritter, W. Müller-Warmuth, and R. Schöllhorn, Location of hydrogen in intercalation compounds of layered transition metal disulfides, a 1H NMR study, Solid State Ionics 20, 283 (1986).
- Dupree et al. [1977] R. Dupree, W. W. Warren, and F. J. Di Salvo, 77Se NMR study of the electronic instability in TiSe2, Physical Review B 16, 1001 (1977).
- Tsuda et al. [1981] T. Tsuda, Y. Kitaoka, and H. Yasuoka, NMR studies of the CDW state in 1T-VSe2, Physica B+C 105, 414 (1981).
- Tsuda et al. [1983] T. Tsuda, H. Yasuoka, Y. Kitaoka, and F. J. Di Salvo, 51V NMR study of the phase transition in 1T-VS2, Journal of Magnetism and Magnetic Materials 31-34, 1101 (1983).
- Mizuno et al. [2002] K. Mizuno, K. Magishi, Y. Shinonome, T. Saito, K. Koyama, N. Matsumoto, and S. Nagata, 125Te NMR study of IrTe2, Physica B 312-313, 818 (2002).
- Naito et al. [1992] M. Naito, H. Nishihara, and T. Butz, Nuclear spectroscopy on charge density wave systems (Kluwer Academic Publishers, 1992) Chap. Layered transition metal dichalcogenides, pp. 35–112.
- Skripov et al. [1989] A. V. Skripov, S. V. Rychkova, M. Y. Belyaev, and A. P. Stepanov, NMR study of hydrogen motion in hydrogen-stabilized C15-type compounds ZrTi2Hx, Solid State Communications 71, 1119 (1989).
- Skripov et al. [1991a] A. V. Skripov, M. Y. Belyaev, and A. P. Stepanov, NMR study of hydrogen mobility in C14- and C15-type compounds ZrCr2Hx, Solid State Communications 78, 909 (1991a).
- Skripov et al. [1991b] A. V. Skripov, M. Y. Belyaev, S. V. Rychkova, and A. P. Stepanov, Nuclear magnetic resonance study of hydrogen diffusion in HfV2Hx(Dx) and ZrV2Hx(Dx): effects of phase transitions and isotope substitution, Journal of Physics: Condensed Matter 3, 6277 (1991b).
- Bowman et al. [1993] R. C. Bowman, D. R. Torgeson, and A. J. Maeland, Proton NMR studies of hydrogen diffusion behavior for ZrBe2H1.4, Zeitschrift für Physikalische Chemie 181, 181 (1993).
- Küchler et al. [1994] W. Küchler, P. Heitjans, A. Payer, and R. Schöllhorn, 7Li NMR relaxation by diffusion in hexagonal and cubic LixTiS2, Solid State Ionics 70-71, 434 (1994).
- Wilkening et al. [2006] M. Wilkening, W. Küchler, and P. Heitjans, From ultraslow to fast lithium diffusion in the 2D ion conductor Li0.7TiS2 probed directly by stimulated-echo NMR and nuclear magnetic relaxation, Physical Review Letters 97, 065901 (2006).
- Wilkening and Heitjans [2008] M. Wilkening and P. Heitjans, Li jump process in H-Li0.7TiS2 studied by two-time 7Li spin-alignment echo NMR and comparison with results on two-dimensional diffusion from nuclear magnetic relaxation, Physical Review B 77, 024311 (2008).
- Spera et al. [2019] M. Spera, A. Scarfato, E. Giannini, and C. Renner, Energy-dependent spatial texturing of charge order in 1T-CuxTiSe2, Physical Review B 99, 155133 (2019).
- Nad’ and Monceau [1995] F. Nad’ and P. Monceau, Charge-density-wave glass state in quasi-one-dimensional conductors, Physical Review B 51, 2052 (1995).
- Julien et al. [1999] M.-H. Julien, F. Borsa, P. Carretta, M. Horvatić, C. Berthier, and C. T. Lin, Charge segregation, cluster spin glass, and superconductivity in La1.94Sr0.06CuO4, Physical Review Letters 83, 604 (1999).
- Urai et al. [2022] M. Urai, K. Miyagawa, Y. Watanabe, E. I. Zhilyaeva, S. A. Torunova, R. N. Lyubovskaya, N. Drichko, and K. Kanoda, Anomalously field-susceptible spin clusters emerging inthe electric-dipole liquid candidate -(ET)2Hg(SCN)2Br, Science Advances 8, eabn1680 (2022).
- Borsa et al. [1977] F. Borsa, D. R. Torgeson, and H. R. Shanks, Charge-density wave amplitudes in 2H-NbSe2 and 2H-TaSe2 determined by 77Se NMR, Physical Review B 15, 4576 (1977).
- Skripov et al. [1995] A. V. Skripov, D. S. Sibirtsev, Y. G. Cherepanov, and B. A. Aleksashin, 77Se NMR study of the charge density wave state in 2H-NbSe2 and 1T-VSe2, Journal of Physics: Condensed Matter 7, 4479 (1995).
- Barmatz et al. [1977] M. Barmatz, R. C. Farrow, and F. J. Di Salvo, Large elastic softening in the semimetal TiSe2, 1977 IEEE Ultrasonics Symposium Proceedings , 378 (1977).
- Barmatz et al. [1975] M. Barmatz, L. R. Testardi, and F. J. Di Salvo, Elasticity measurements in the layered dichalcogenides TaSe2 and NbSe2, Physical Review B 12, 4367 (1975).
- Lumata et al. [2010] L. L. Lumata, K. Y. Choi, J. S. Brooks, A. P. Reyes, P. L. Kuhns, G. Wu, and X. H. Chen, 77Se and 63Cu NMR studies of the electronic correlations in CuxTiSe2 (, ), Journal of Physics: Condensed Matter 22, 295601 (2010).
- Woo et al. [1976] K. C. Woo, F. C. Brown, W. L. McMillan, R. J. Miller, M. J. Schaffman, and M. P. Sears, Superlattice formation in titanium diselenide, Physical Review B 14, 3242 (1976).
- Guy et al. [1982] D. R. P. Guy, R. H. Friend, D. C. Johnson, and M. J. Sienko, Magnetic susceptibility of hydrazine intercalated TiSe2, Journal of Physics C 15, L1251 (1982).
- Overhauser [1971] A. W. Overhauser, Observability of charge-density waves by neutron diffraction, Physical Review B 3, 3173 (1971).
- Overhauser [1978] A. W. Overhauser, Phase excitations of charge density waves, Hyperfine Interactions 4, 786 (1978).
- Bak [1982] P. Bak, Commensurate phases, incommensurate phases and the devil’s staircase, Reports on Progress in Physics 45, 587 (1982).
- Blinc [1981] R. Blinc, Magnetic resonance and relaxation in structurally incommensurate systems, Physics Reports 79, 331 (1981).
- Zumer and Blinc [1981] S. Zumer and R. Blinc, Nuclear spin-lattice relaxation in incommensurate systems, Journal of Physics C: Solid State Physics 14, 465 (1981).
- Blinc et al. [1983] R. Blinc, D. C. Ailion, P. Prelovsek, and V. Rutar, Floating of the modulation wave and phase pinning in incommensurate Rb2ZnBr4, Physical Review Letters 50, 67 (1983).
- Kogoj et al. [1984] M. Kogoj, S. Zumer, and R. Blinc, Motion of the modulation wave and the NMR lineshape in incommensurate systems, Journal of Physics C: Solid State Physics 17, 2415 (1984).
- Papavassiliou et al. [1991] G. Papavassiliou, F. Milia, R. Blinc, and S. Zumer, Spin-lattice relaxation via floating of the incommensurate modulation wave in Rb2ZnCl4, Solid State Communications 77, 891 (1991).
- Papavassiliou et al. [1993] G. Papavassiliou, A. Anagnostopoulos, and F. Milia, Impurity pinning and thermally excited collective motions in incommensurately modulated structures, Journal of Physics: Condensed Matter 5, 9295 (1993).
- Matus et al. [1999] P. Matus, P. Bánki, and G. Kriza, 87Rb NMR spin-lattice relaxation in the charge-density wave phase of Rb0.3MoO3, Journal de Physique IV - Proceedings 9, Pr10 (1999).
- Hildebrand et al. [2014] B. Hildebrand, C. Didiot, A. M. Novello, G. Monney, A. Scarfato, A. Ubaldini, H. Berger, D. R. Bowler, C. Renner, and P. Aebi, Doping nature of native defects in 1TTiSe2, Physical Review Letters 112, 197001 (2014).
- Wu et al. [2015] T. Wu, H. Mayaffre, S. Krämer, M. Horvatić, C. Berthier, W. N. Hardy, R. Liang, D. A. Bonn, and M.-H. Julien, Incipient charge order observed by NMR in the normal state of YBa2Cu3Oy, Nature Communications 6, 6438 (2015).
- Hildebrand et al. [2018] B. Hildebrand, T. Jaouen, M.-L. Mottas, G. Monney, C. Barreteau, E. Giannini, D. R. Bowler, and P. Aebi, Local real-space view of the achiral 1T-TiSe2 charge density wave, Physical Review Letters 120, 136404 (2018).
- Liu et al. [2021] L. Liu, C. Zhu, Z. Y. Liu, H. Deng, X. B. Zhou, Y. Li, Y. Sun, X. Huang, S. Li, X. Du, Z. Wang, T. Guan, H. Mao, Y. Sui, R. Wu, J.-X. Yin, J.-G. Cheng, and S. H. Pan, Thermal dynamics of charge density wave pinning in ZrTe3, Physical Review Letters 126, 256401 (2021).
- Feng et al. [2023] X. Y. Feng, Z. Zhao, J. Luo, J. Yang, A. F. Fang, H. T. Yang, H. J. Gao, R. Zhou, and G.-Q. Zheng, Commensurate-to-incommensurate transition of charge-density-wave order and a possible quantum critical point in pressurized kagome metal CsV3Sb5, npj Quantum Materials 8, 23 (2023).
- Wang and Zhang [1996] X.-M. Wang and D.-L. Zhang, Effects of impurities and temperature on the thermal hysteresis of Ohmic resistance in Tl-doped blue bronze, Physical Review B 54, 1443 (1996).