JWST’s TEMPLATES for Star Formation: The First Resolved Gas-Phase Metallicity Maps of Dust-Obscured Star-Forming Galaxies at 4
Abstract
We present the first spatially resolved maps of gas-phase metallicity for two dust-obscured star-forming galaxies (DSFGs) at 4, from the JWST TEMPLATES Early Release Science program, derived from NIRSpec integral field unit spectroscopy of the H and [Nii] emission lines. Empirical optical line calibrations are used to determine that the sources are globally enriched to near-solar levels. While one source shows elevated [Nii]/H ratios and broad H emission consistent with the presence of an AGN in a 1 kpc region, we argue that both systems have already undergone significant metal enrichment as a result of their extremely high star formation rates. Utilizing ALMA rest-frame 380 m continuum and [Ci](3P2–3P1) line maps we compare the spatial variation of the metallicity and gas-to-dust ratio in the two galaxies, finding the two properties to be anticorrelated on highly resolved spatial scales, consistent with various literature studies of 0 galaxies. The data are indicative of the enormous potential of JWST to probe the enrichment of the interstellar medium on kpc scales in extremely dust-obscured systems at 4 and beyond.
1 Introduction
At so-called “cosmic noon” ( 2) and beyond, a significant fraction of the Universe’s star formation occurs in dust-obscured star-forming galaxies (DSFGs; Casey et al., 2014; Swinbank et al., 2014; Dudzevičiūtė et al., 2020; Zavala et al., 2021). In such systems, the majority of the rest-frame optical and ultraviolet (UV) light associated with young stars is absorbed by dust and reprocessed into the far-infrared.
Multiwavelength analyses and molecular gas observations have revealed that DSFGs are massive, gas rich and highly star forming, with infrared luminosities 10, implied star-formation rates (SFRs) of 100–1000 M⊙ yr-1 (see e.g. Swinbank et al., 2014; Spilker et al., 2015; Aravena et al., 2016; Strandet et al., 2017; Dudzevičiūtė et al., 2020; Reuter et al., 2020; Birkin et al., 2021) and dense interstellar media (e.g. Spilker et al., 2014; Birkin et al., 2021; Rybak et al., 2022; Reuter et al., 2023). The observed properties of DSFGs (such as their high IR luminosities) and the fact that sources have been detected up to 7 has made them challenging to reproduce in current models of galaxy formation and evolution (Davé et al., 2010; Lacey et al., 2016; McAlpine et al., 2019; Hayward et al., 2021; Bassini et al., 2022). Therefore, observations of DSFGs can provide strong constraints on such theories.
The interstellar medium (ISM) plays a critical role in the ongoing processes within DSFGs, such as star formation, supernovae and winds which add, remove, and redistribute metals. Therefore, measuring the gas-phase metallicity and its variation across the galaxy is a powerful indicator of its past evolution (e.g. Maiolino & Mannucci, 2019), for example through scaling relations such as the mass-metallicity relation (MZR; e.g. Tremonti et al., 2004) and fundamental metallicity relation (FMR; e.g. Mannucci et al., 2010; Curti et al., 2020). A simple and effective method for estimating metallicity is to measure the relative strengths of the [Nii] and H emission lines (e.g. Pettini & Pagel, 2004; Marino et al., 2013; Dopita et al., 2016; Maiolino & Mannucci, 2019), which suffer similar levels of dust extinction due to their close proximity in wavelength. This method has limitations, such as being highly sensitive to the ionisation parameter and N/O abundance (Pérez-Montero & Contini, 2009; Dopita et al., 2016; Pilyugin & Grebel, 2016; Peng et al., 2021), but the brightness of these lines and their accessibility at high redshifts have made it a popular observable for metallicity (e.g. Steidel et al., 2014; Sanders et al., 2015; Gillman et al., 2022).
The launch of JWST and its successful commissioning (Gardner et al., 2023; McElwain et al., 2023; Menzel et al., 2023; Rigby et al., 2023a, b) have transformed our ability to study galaxy formation and evolution, and we are now entering a new era for extragalactic astronomy. JWST’s Near-Infrared Spectrograph (NIRSpec; Böker et al., 2023) can study high-redshift galaxies at sub-kpc spatial resolution, offering a vast improvement over previous ground-based (and therefore seeing-limited) studies. Additionally, at high redshifts the spectral coverage of NIRSpec encompasses the key emission lines that trace gas-phase metallicity such as H, [Nii]6584, [Oiii]5007,4958, H, [Sii]6717,31, [Oii]3727,29 and [Neiii]3870 (e.g. Wuyts et al., 2014; Maiolino & Mannucci, 2019; Sanders et al., 2020).
At high redshifts, strong gravitational lensing due to massive foreground structures allows us to observe galaxies at higher spatial resolution than would otherwise be possible. This technique is commonly used to study the DSFG population, with modest samples of lensed sources characterized by the Herschel, Planck, Atacama Cosmology Telescope (ACT), South Pole Telescope (SPT) (e.g Negrello et al., 2010; Vieira et al., 2013; Marsden et al., 2014; Bussmann et al., 2015; Harrington et al., 2016; Spilker et al., 2016; Everett et al., 2020; Kamieneski et al., 2023), and through the ALMA Cluster Lensing Survey (ALCS; e.g. Sun et al., 2022). Many sources have been detected up to 7 (e.g. Marrone et al., 2018; Reuter et al., 2020; Endsley et al., 2023).
In this work, we present Director’s Discretionary Early Release Science (DD-ERS) NIRSpec IFU observations of two SPT-selected gravitationally lensed DSFGs: SPT0418-17 at 4.2246 and SPT2147-50 at 3.7604 (Reuter et al., 2020), with which we demonstrate the significant advancements that JWST is already providing in our study of this population. The outline of this paper is as follows: in §2 we describe the observations carried out, our data reduction methods, and our analysis of the reduced data. In §3 we present the results and discuss their implications. In §4 we summarise our findings. Throughout this paper we adopt the cosmology measured by Planck Collaboration et al. (2020), i.e. flat with 0.310 and H0 67.7 km s-1 Mpc-1, and a solar metallicity of 12 log(O/H) 8.69 (Asplund et al., 2021).


2 Observations, data reduction and analysis
2.1 JWST
JWST/NIRSpec observations are drawn from the DD-ERS programme TEMPLATES: Targeting Extremely Magnified Panchromatic Lensed Arcs and Their Extended Star formation (Program 1355; PI: J. Rigby; Co-PI: J. Vieira). From TEMPLATES we utilize NIRSpec IFU G395M/F290LP observations of two SPT-selected DSFGs: SPT0418-47 and SPT2147-50. From spectral energy distribution (SED) fitting it is known that both galaxies are highly massive and highly star-forming (Cathey et al., 2023, and see Table 1).
The JWST data used in this manuscript can be found in MAST: http://dx.doi.org/10.17909/fdje-fq59 (catalog 10.17909/fdje-fq59). We reduce the data with the standard JWST pipeline (Version 1.10.2; Bushouse et al., 2023) using calibration reference data system (CRDS) context jwst_1089.pmap, with some modifications. Full details on the TEMPLATES data reduction will be provided in Rigby et al. (in prep.), but here we describe how our process differs from the standard pipeline. We modify the outlier detection stage of the pipeline as we found that in some cases the default stage can remove real signal. In our alternate sigma clipping method we first mask the galaxy and clip the background, and then perform the same process on layers of the galaxy of increasing signal-to-noise ratio (S/N). This layering was chosen to ensure that spaxels with weaker emission did not affect the clipping of spaxels with strong emission. We also applied a small offset ( 0.5′′ for both sources) to match the data to ALMA rest-frame 380 m continuum data (see §2.2). These astrometric shifts were determined by comparing the coordinates of the central continuum source with HST/WFC3 F140W imaging (Ma et al., 2015).
As part of our analysis we also generate NIRSpec cubes with 0.5′′ resolution (as opposed to the original 0.1′′ resolution). This is done to ensure consistency with existing ALMA data (see §2.2), which we use to derive maps of the dust and gas emission. To generate the 0.5′′ resolution NIRSpec cubes we convolve the original (0.1′′ pixel scale) cubes with a circular Gaussian point spread function (PSF) of FWHM 0.49′′. The target spatial resolution (0.5”, and Gaussian by construction) is sufficiently poorer than the intrinsic JWST PSF (0.1”) that the wings and spikes in the JWST PSF can be safely ignored.
2.2 ALMA
To supplement the data from JWST/NIRSpec, we utilize ALMA data covering the rest-frame 380 m continuum emission and the [Ci](3P2–3P1) line emission, which will be used in §3.3 as proxies for dust mass and gas mass, respectively. For SPT0418-47 we utilize Band 4 data from program 2021.1.00252.S (PI: J. Vieira), which we image using natural weighting and taper to a spatial resolution of 0.5′′, creating continuum images and CO(7-6)/[Ci](2–1) cubes. For SPT2147-50 we utilize Band 5 data from program 2018.1.01060.S (PI: J. Vieira) which is processed in the same way, except the imaging was performed using Briggs weighting with a robust parameter of 0.45. This enabled us to achieve the same resolution as the SPT0418-47 data.
| SPT0418-47 | SPT2147-50 | |
| R.A. | 04:18:39.67 | 21:47:19.05 |
| Dec | 47:51:52.5 | 50:35:53.5 |
| 29.5 1.2 | 6.6 0.4 | |
| SFR / M⊙ yr-1 | 3770 545 | 4630 230 |
| / M⊙ | (4.5 0.9) | (4.2 1.0) 1011 |
| 3.8 0.1 | 2.5 0.1 | |
| 4.2246(4) | 3.7604(2) | |
| Whole source | ||
| [Nii]/H | 0.43 0.03 | 0.62 0.04 |
| [Sii]/H | 0.23 0.01 | 0.24 0.01 |
| 12 log(O/H)M13 | 8.57 0.16 | 8.65 0.16 |
| / Z⊙ | 0.8 0.3 | 0.9 0.3 |
| Masking [Nii]/H 0.5 | ||
| [Nii]/H | 0.34 0.02 | 0.53 0.02 |
| [Sii]/H | 0.21 0.01 | 0.23 0.01 |
| 12 log(O/H)M13 | 8.53 0.16 | 8.55 0.16 |
| / Z⊙ | 0.7 0.3 | 0.7 0.3 |
2.3 Resolved fitting
To achieve our goal of determining how the metallicity varies across our two targets, we model the H and [Nii] complex as a triple-Gaussian profile, on a pixel-by-pixel basis, tying the wavelengths of the emission and coupling their linewidths, with the H/[Nii] flux ratio left as a free parameter. The flux ratio of [Nii]/[Nii] is fixed at 2.8 (Osterbrock & Ferland, 2006), and we also include a constant continuum component. We attempt to model the emission lines in each pixel, and if we measure a S/N of at least 8 across the H+[Nii] complex the pixel is included in the flux maps. Otherwise, the pixel is ignored, and not used in our subsequent analysis. The threshold of S/N 8 was chosen through trial and error, to minimize pixels where the apparent H emission is largely due to noise while ensuring that the derived flux maps contain enough pixels to study the resolved properties. To boost the S/N we bin each spaxel with its eight neighbouring spaxels. Finally, we visually inspect the resultant H flux maps along with the fits to each spaxel, and mask by hand any spaxels where the emission does not appear to be coming from the target galaxy. This includes masking emission from a newly detected companion galaxy (Peng et al., 2022; Cathey et al., 2023, and see §3.1), which we elect not to study in detail in this work.
3 Results and discussion
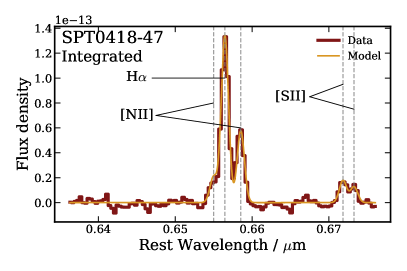
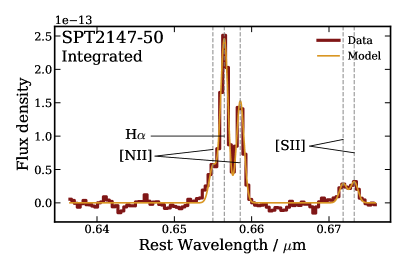
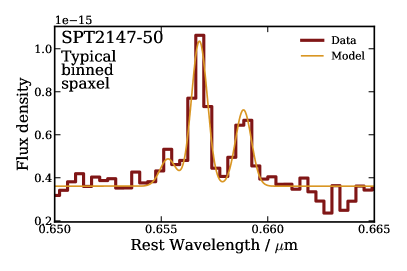
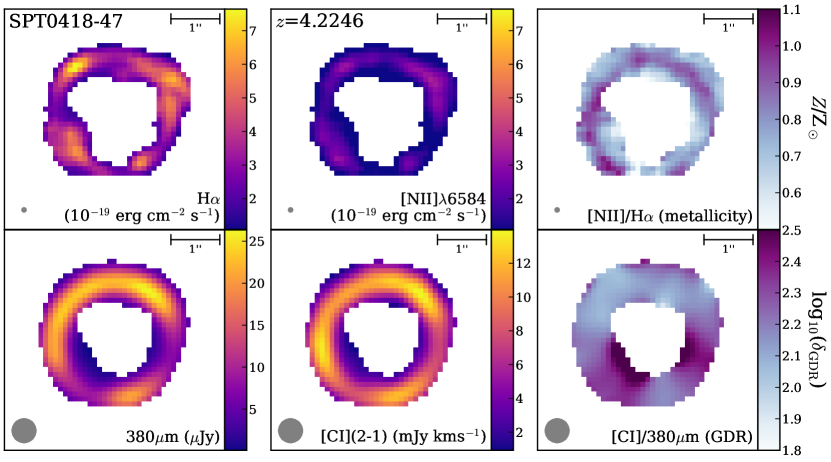
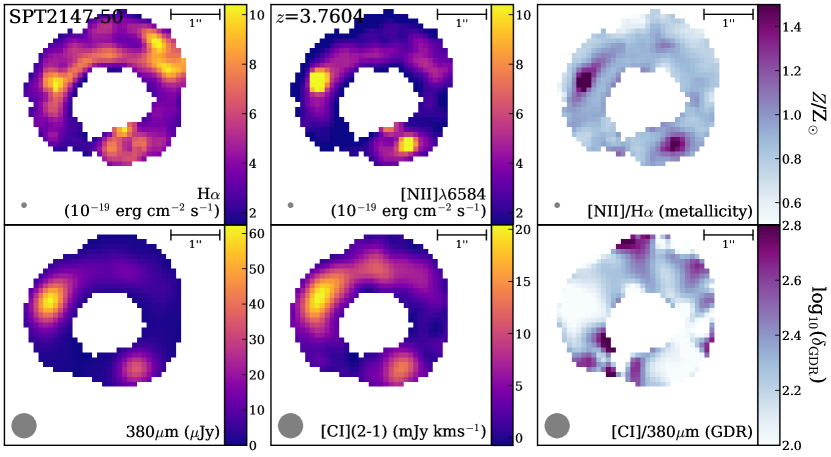
Fig. 1 shows the 1-D spectra extracted from the two DSFGs in pixels where H and [Nii] are detected, and Fig. 2 shows the same spectra, but this time zoomed into the H, [Nii] and [Sii] lines. We show both the integrated spectra, and a sample spaxel (binned with neighbouring spaxels) for each galaxy. The [Sii] doublet is shown with a double-Gaussian fit in the integrated spectra as it is clearly detected, but the S/N is insufficient to detect it in individual pixels. Therefore we do not model [Sii] in our resolved fitting. The triple Gaussian fit models the H and [Nii] lines well in both cases. The resultant maps of H and [Nii] emission are shown in Figs. 3 and 4 for SPT0418-47 and SPT2147-50, respectively. We detect continuum emission across the observed wavelength range in both sources, a combination of stellar continuum from the background DSFGs and light from the bright foreground lenses blurred into the background emission by the JWST PSF. We model the continuum using a running median with a window size large enough so as to avoid removing any flux from the emission lines ( 10000 km s-1). Both DSFGs display strong H and [Nii] emission, along with the [Sii]6717,31 and [Siii]9071,9533 doublets. Additionally, in the lower-redshift SPT2147-50 we detect Hei and Pa emission, with tentative evidence for Pa.
3.1 Line ratios and metallicities
To derive metallicities for the two DSFGs we first convert the [Nii]/H ratio from the line fits to an oxygen abundance 12 log(O/H) using the calibration for N2 log10([Nii]/H) as derived by Marino et al. (2013) (hereafter M13):
| (1) |
which is derived from a fit to 452 Hii regions with -based metallicity measurements. The regions considered are valid up to N2 0.2 or [Nii]/H 0.63. A number of other calibrations were considered, including those proposed by Pettini & Pagel (2004) (hereafter PP04), Curti et al. (2020) (hereafter C20) and Dopita et al. (2016) (hereafter D16), the latter of which also uses the [Sii] doublet. We selected the M13 calibration as it is considered more reliable at high redshifts and in better agreement with other calibrations than PP04 (e.g. Poetrodjojo et al., 2021), and simpler to extrapolate to higher metallicities than C20, who used a fourth-order polynomial fit which is not well constrained in the high-metallicity regime. As an alternative measurement we briefly discuss results using the D16 calibration, but as the S/N of our [Sii] detections is low we are unable to use this line on a spatially resolved basis. Therefore for consistency we primarily use the M13 calibration. We note here that while we later study the global mass-metallicity relation and fundamental metallicity relation, our main concern in this work is the spatial variation of the metallicity with other properties rather than their absolute values.
As the [Nii]/H ratio is very high ( 0.8) in several regions of both sources, we cannot rule out active galactic nuclei (AGN) as being responsible for this emission. In SPT2147-50 this is supported by very broad line FWHMs ( 800 km s-1) which correspond with regions of high [Nii]/H. This could be evidence for AGN-driven winds in this system. No previous work on these two sources has suggested that either are AGN hosts (e.g. Bothwell et al., 2017; De Breuck et al., 2019). The same is true for other DSFGs from the same parent sample (Ma et al., 2016; Apostolovski et al., 2019). Therefore, this is a surprising result, particularly for SPT2147-50 which shows the highest [Nii]/H ratios.
Galaxies are commonly classified as AGN dominated or otherwise using the Baldwin, Phillips and Terlevich (BPT; Baldwin et al., 1981) diagram (e.g. Kewley et al., 2006). However, the other BPT diagnostics [Oiii] and H (neither of which fall within the coverage of our data) are needed to confirm this. Even with these additional diagnostics, the boundary between star-forming galaxies and AGN in the BPT diagram is uncertain at 2, let alone at 4 where the two DSFGs reside (Kewley et al., 2013). We therefore also derive metallicities masking out individual pixels with [Nii]/H 0.5, which we choose to provide a conservative lower limit on the integrated metallicity.
In the former case, i.e. using all pixels with H detections, and based on the M13 calibration, SPT0418-47 has 12 log(O/H) 8.57 0.16 and 0.8 0.3 Z⊙, respectively. SPT2147-50 has 12 log(O/H) 8.65 0.16 and 0.9 0.3 Z⊙, respectively. Adopting a conservative cutoff of [Nii]/H 0.5 (which masks 43 and 70 of the pixels in SPT0418-47 and SPT2147-50 respectively) these values change to 0.7 0.3 Z⊙ for SPT0418-47 and 0.7 0.3 Z⊙ for SPT2147-50. Interestingly, applying this correction does not significantly change the global metallicity values; both are still a significant fraction of the solar value, and consistent with solar abundances in all cases.
The detections of [Sii]6717,31 are significant enough in the integrated spectra of both galaxies (see Fig. 2) to provide an independent estimate of the metallicity. Additionally, [Sii] is sufficiently close in wavelength to H and [Nii] that any extinction corrections would be negligible. We therefore also apply the D16 calibration for H, [Nii] and [Sii] to estimate 12 log(O/H). Interestingly, this calibration gives significantly higher values of metallicity: 1.8 0.7 Z⊙ for SPT0418-47 and 2.7 1.0 Z⊙ for SPT2147-50 (decreasing to 1.5 0.6 Z⊙ and 1.7 0.7 Z⊙ respectively when applying our AGN masking). The D16 calibration has been claimed to have a reduced dependence on the ionisation parameter when compared to N2, and therefore this is further evidence that the two DSFGs are highly enriched with metals, possibly even to solar or super-solar levels.
We note here that the two [Siii] lines that we detect here can also be used to trace the ionization parameter and metallicity. There remains uncertainty over the reliability of NIRSpec flux calibrations as a function of wavelength, and so we prefer to only use ratios between emission lines that are close in wavelength. Additionally, we would require the application of extinction corrections to our data, given the large wavelength difference between [Siii] and the other lines. As we do not have measurements of the H flux, and therefore the Balmer decrement, our extinction corrections would be highly uncertain. Therefore we have elected not to use the [Siii] lines in our analysis.
As a side note, a companion source to SPT0418-47 (SPT0418-47B) has been detected by Peng et al. (2022) and Cathey et al. (2023). While we are not focused on the nature of this source here, we note that we measure a metallicity of 0.6–0.7 Z⊙ (applying the M13 calibration), which we find to be consistent with Peng et al. (2022). Therefore the smaller merging companion to SPT0418-47 is a slightly less metal-rich system.
A potential source of uncertainty in our metallicity estimates may arise from diffuse ionized gas (DIG), as the resolution of our observations is much greater than the scale of individual Hii regions. Vale Asari et al. (2019) investigated this effect for star-forming galaxies in the MaNGA survey and found the diffuse component to have a 0.1 dex contribution to metallicity estimates derived using the [Nii]/H index, at the high-metallicity end. They also found the DIG to have a more prominent effect on the mass-metallicity relation at the high stellar mass end, where our sources (particularly SPT2147-50) lie. Similar findings were also made by Poetrodjojo et al. (2019). A correction for this potential effect is beyond the scope of this work, however.
In general, due to the systematic uncertainties in different calibrations and the fact that these are derived for galaxies at much lower redshifts than the two SPT DSFGs, it is highly challenging to confidently constrain their global metallicities. However, even while being conservative over the possibility of AGN emission in the two DSFGs, we can confidently say that both are enriched to near-solar levels, likely as a result of their very high SFRs.
3.2 Mass-metallicity relation and the fundamental metallicity relation
In general, galaxies appear to display a correlation between gas-phase metallicity and stellar mass, the so-called Mass-Metallicity Relation (MZR; e.g. Tremonti et al., 2004). In addition, a “three-dimensional” relation between stellar mass, metallicity and SFR has been suggested and named the Fundamental Metallicity Relation (FMR; Mannucci et al., 2010). In the FMR, low-mass galaxies with higher SFRs typically contain a lower proportion of metals, and in high-mass galaxies the metallicity saturates and becomes independent of SFR (as in the mass-metallicity relation). Mannucci et al. (2010) found this relation to hold constant with low scatter up to 2.5 (also see e.g. Lara-López et al., 2010; Troncoso et al., 2014; Curti et al., 2020), attributing the result to the dominance and consistency of smooth secular processes at low to intermediate redshifts, with this equilibrium being reached at least as early as 2.5.
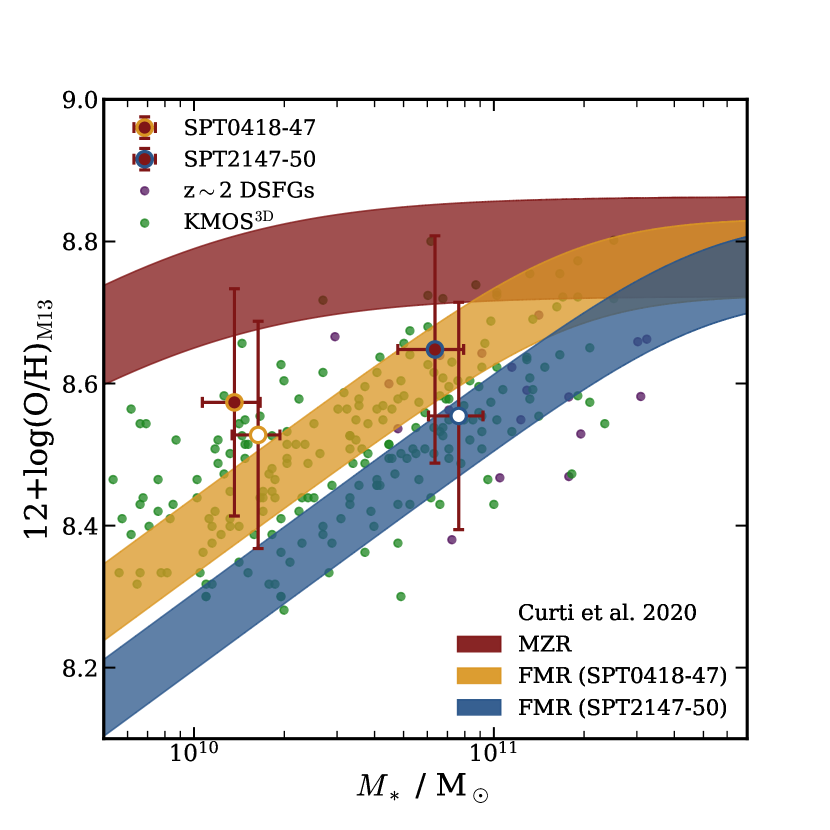
At higher redshifts the picture is less clear. Mannucci et al. (2010) showed that galaxies at 2.5 are offset from the FMR, specifically around 0.6 dex towards lower metallicities, which may imply that smooth secular processes are less prominent in higher redshift sources. To test this for the two 4 DSFGs, in Fig. 5 we show the derived oxygen abundances 12 log(O/H) using the C20 calibration versus stellar masses derived from SED fitting with cigale (Cathey et al., 2023, Phadke et al. in prep.). The open points indicate the oxygen abundances derived from masking emission in pixels with [Nii]/H 0.5, and are shifted horizontally for visual clarity.
For comparison with other similarly selected sources, we also include in Fig. 5 2 DSFGs with [Nii]/H measurements from the -band Multi-Object Spectrograph (KMOS; Birkin, 2022), along with 1.3–2.6 galaxies from the KMOS3D survey (Wisnioski et al., 2015), the latter of which is generally comprised of galaxies with lower SFRs than those studied in this work. The two DSFGs presented in this work are consistent with the majority of the comparison sources, albeit generally on the more metal-rich end.
From C20 we show the mass-metallicity relation for local galaxies, along with the FMR for the SFRs of the two galaxies (see Table 1), including the scatter in both cases. Both galaxies are consistent with the local mass-metallicity relation within the uncertainties — they are high-mass galaxies, at which point the metallicity is expected to saturate at around 12 log(O/H) 8.7–8.8. According to the FMR they are both marginally more metal rich than expected, although generally consistent within the large uncertainties, especially when we account for potential AGN emission.
Mannucci et al. (2010) claim that the relatively small scatter in the FMR up to 2.5 implies constant relative significance of star formation, infall and outflows of gas. The two galaxies presented in this paper appear to have metallicities consistent with the FMR and could therefore fit into this picture. However, SPT0418-47 seems to be interacting with a companion (Peng et al., 2022; Cathey et al., 2023), which may be expected to drive it away from the FMR. Studies using both observations and simulations have shown that in the early stages of a merger the gas is diluted, thus lowering the metallicity. Subsequently, the metallicity is increased as the merger proceeds, when the star-formation rate is enhanced (e.g. Rupke et al., 2008; Montuori et al., 2010; Rupke et al., 2010). It is therefore interesting that SPT0418-47 remains consistent with the FMR. We choose not to overinterpret this result given the large uncertainties on the oxygen abundances.
We note that we use the relations from C20 as Marino et al. (2013) do not derive either the FMR or the MZR from their calibration. However, we note that we would expect both to move down if these relations were available for the M13 calibration, and if anything this would place the two DSFGs 0.2 dex further above the FMR than we see in Fig. 5. This would put both sources firmly above the FMR.
An important consideration to make is whether or not the line calibrations we assume are applicable at 4. There are few method-based metallicity measurements calibrated to H and [Nii] at this epoch (although some work has been done with H and [Oiii]; e.g. Curti et al., 2023; Trump et al., 2023), hence our reliance on local calibrations, and it is possible DSFGs exhibit different relative abundances than nearby galaxies. For instance, a top-heavy initial mass function, as has been suggested as necessary to reconcile DSFG number counts with theory (e.g. Baugh et al., 2005), and therefore a large number of high-mass stars, would lead to a change in the relative abundance of nitrogen, oxygen and hydrogen. A lack of observational data limits our ability to draw the correct conclusion, however some work on this topic has already been done with NIRSpec. For example, for 2.18 galaxies Sanders et al. (2023) have found evidence that the local C20 N2 calibration for metallicity is biased 0.5 dex high when compared to direct measurements from auroral lines. This bias may be as significant, or potentially even worse, at 4.
A further consideration is that if SPT2147-50 does in fact host an AGN that is contributing significantly to the infrared emission, then this could result in a larger estimate of the SFR from SED fitting than the true value. This would in turn mean that the expected metallicity from the FMR is actually lower than it should be. Additionally, the SFRs used in the C20 scaling relations are derived from the H luminosities, scaled to a total SFR. Given the high levels of dust extinction in the two galaxies (see Table 1), we do not derive H-based SFRs in this work, as the corrections are likely to be significant and uncertain. We instead use total SFRs derived from cigale SED fitting, which uses the parameterization from Boquien et al. (2019), with the star-formation histories modelled as an exponential decay ( 1 Gyr) including an additional burst component using the stellar population model from Bruzual & Charlot (2003).
3.3 Resolved metallicities and the gas-to-dust ratio
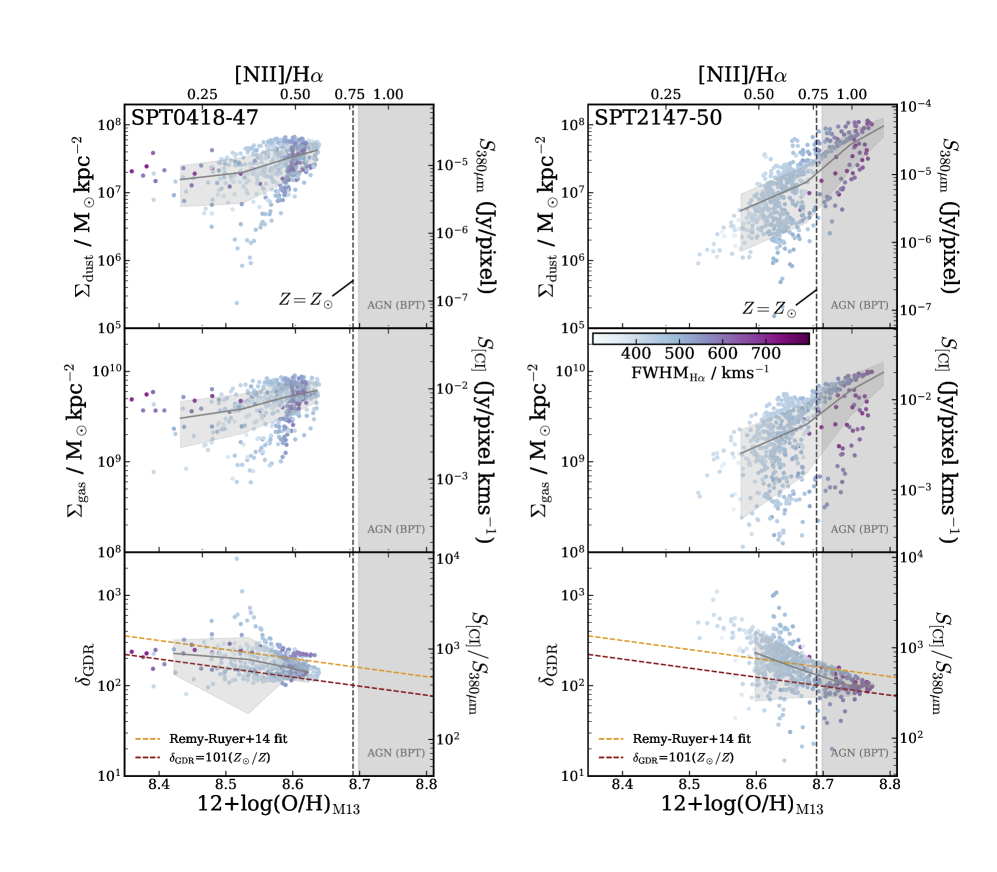
The impressive sensitivity and resolution of JWST has allowed us to spatially resolve the [Nii]/H flux ratio (see Figs. 3 and 4). We wish to compare these with the distribution of dust and gas in the two galaxies in order to determine how they are related. We therefore compare the [Nii]/H maps from NIRSpec with existing ALMA imaging of the rest-frame 380 m continuum and [Ci] line emission, which provide estimates of the dust and ISM masses.
Figs. 3 and 4 show ALMA rest-frame 380 m continuum maps and [Ci] emission line maps of the two DSFGs, the latter of which are derived by summing the flux within twice the FWHM of the line. We also show the ratio of the [Ci] to 380 m maps, which we use as a proxy for the gas-to-dust ratio (). Visually, these three maps are broadly consistent in terms of regions of high [Nii]/H coinciding with regions of high flux in the ALMA maps. This is most clear in SPT2147-50, which displays two bright regions in the 380 m maps that are also present in the NIRSpec data.
To quantify the relation between the metallicity, gas, and dust, we convert the ALMA maps to dust and gas mass surface density and and plot both versus [Nii]/H on a pixel-by-pixel basis, as shown in Fig. 6. To convert the ALMA rest-frame 380 m continuum maps to dust mass maps we apply Eq. (1) of Dunne et al. (2003), assuming a dust mass opacity coefficient at 125 m of 2.64 m2 kg-1, a dust temperature of 40 K, and extrapolating to 380 m with dust emissivity index 2.0.
This approach ignores any potential variations in and . However, Spilker et al. (2023) recently analysed rest-frame 120 m and 160 m data from SPT0418-47 and found no evidence of significant variations in dust temperature across the source. If indeed we are seeing AGN emission in SPT2147-50 then we may expect these regions to display higher dust temperatures, but we flag regions of the parameter space in Fig. 6 where this is likely to be the case and avoid overinterpreting these regions. There has yet to be significant study of variations in the dust emissivity across individual galaxies, and indeed we cannot rule this out in our sources.
To convert the [Ci] emission line maps to molecular gas mass maps we use Eq. (6) of Bothwell et al. (2017), except in our case we use the Einstein 2.68 10-7 s-1 coefficient (Papadopoulos & Greve, 2004) and excitation factor 0.22 (Dunne et al., 2022) for the [Ci](2–1) transition instead of the [Ci](1–0) values. Following Papadopoulos & Greve (2004) and Bothwell et al. (2017) we adopt a [Ci]/H2 abundance ratio of 3 10-5. This is a commonly adopted value in the literature, but we note that this value cannot be measured for high- galaxies and is therefore based on measurements from local galaxies. It is therefore subject to considerable uncertainty. Indeed, through a comparison with dust-based gas masses, Bothwell et al. (2017) suggested that a higher value of 7 10-5 could also be reasonable. Given that we are primarily concerned with the variation of with metallicity, rather than its absolute value, this assumption should not significantly affect our conclusions.
In Fig. 6 we plot three quantities as a function of [Nii]/H, a proxy for metallicity. These are , and /, which we use as proxies for dust mass surface density, gas mass surface density, and gas-to-dust ratio respectively. The points are color-coded by H FWHM. Given the various caveats and assumptions which come with these proxies, we choose to plot both the observed and converted quantities. Our interpretation will mostly focus on the variation of these properties rather than their absolute values. Additionally, all corresponding panels are shown on the same scale (of absolute values) to enable a direct comparison between the two galaxies. We also indicate the solar metallicity and shade the region where [Nii]/H 0.8 which the BPT diagram suggests is likely to result from AGN emission.
Firstly, we note that in both galaxies, there appears to be a positive correlation between dust/gas mass surface density and metallicity. This indicates that regions containing more gas and dust are also more metal rich. This trend is stronger in SPT2147-50, in which we see that the most metal-rich regions also display the broadest H emission. Given that these points fall within the shaded region, it is likely that the most “metal-rich” regions of SPT2147-50 are in fact regions of AGN emission. This is a striking conclusion given that no clear AGN have previously been identified in any SPT-selected DSFG, including some objects more extreme than those targeted here (e.g. Ma et al., 2016; Apostolovski et al., 2019). It is theorized that DSFGs proceed to evolve through a quasi-stellar object (QSO) phase (Blain et al., 2002; Swinbank et al., 2006; Hopkins et al., 2008), and therefore we may be observing the beginnings of this evolution in SPT2147-50. NIRSpec follow up should be proposed for other sources in the SPT DSFG sample, in order to identify any further AGN candidates.
Turning to the bottom panels, we see that the gas-to-dust ratio appears to decline with increasing metallicity, a result that has been observed in local galaxies (e.g. Leroy et al., 2011; Rémy-Ruyer et al., 2014; Aniano et al., 2020). In the bottom panels of Fig. 6 we plot two models to compare with our data. We show the model fit by Rémy-Ruyer et al. (2014) to 126 local galaxies spanning 2 dex in metallicity, derived from strong-line calibrations. Next we include a simple model from Aniano et al. (2020) in which the gas-to-dust ratio is estimated assuming that essentially all heavy elements are in dust grains, with solar relative abundances. This results in a linear relation between metallicity and . Both models appear to match the results from both galaxies within the uncertainties. Even if we ignore the absolute values, the trend of decreasing with metallicity is generally well described by both models. We tentatively conclude that the gas-to-dust ratio and its variation with metallicity in these two DSFGs is consistent with findings from local galaxies, which is not necessarily unexpected but has not yet been shown for DSFGs as distant as the two we present in this paper.
4 Conclusions
We have presented two of the first spatially resolved metallicity maps of dust-obscured star-forming galaxies at 4, utilizing IFU observations with JWST/NIRSpec. Both sources are detected in H and [Nii] at very high S/N, enabling us to perform resolved spectroscopy on these lensed systems. We find both SPT0418-47 and SPT2147-50 to be enriched to near-solar metallicity (conservatively 0.7 ), with evidence for AGN-like [Nii]/H ratios and broad H emission. The derived oxygen abundances are consistent with the fundamental metallicity relation for both galaxies. Through a direct comparison with ALMA rest-frame 380 m continuum and [Ci] line maps at matched resolution, which we use as proxies for dust and gas mass, we find that the gas-to-dust ratio is negatively correlated with the metallicity, a result that is consistent with literature studies of local galaxies. At least qualitatively, it appears that these early-universe dusty galaxies bear some resemblance to expectations from 0 galaxies, even on highly resolved spatial scales.
In the absence of [Oiii] and H coverage we interpret these results with caution, as the possibility remains that regions of high [Nii]/H are actually the result of AGN emission. Furthermore, detailed lens modelling analysis and source plane reconstruction of these data have not yet been carried out; this will be explored in future work. Regardless, this work presents the first resolved metallicity maps in DSFGs at 4, and the data quality shows the potential of JWST to further our understanding of the processes that shape the ISM in high-redshift DSFGs.
References
- Aniano et al. (2020) Aniano, G., Draine, B. T., Hunt, L. K., et al. 2020, ApJ, 889, 150, doi: 10.3847/1538-4357/ab5fdb
- Apostolovski et al. (2019) Apostolovski, Y., Aravena, M., Anguita, T., et al. 2019, A&A, 628, A23, doi: 10.1051/0004-6361/201935308
- Aravena et al. (2016) Aravena, M., Spilker, J. S., Bethermin, M., et al. 2016, MNRAS, 457, 4406, doi: 10.1093/mnras/stw275
- Asplund et al. (2021) Asplund, M., Amarsi, A. M., & Grevesse, N. 2021, A&A, 653, A141, doi: 10.1051/0004-6361/202140445
- Astropy Collaboration et al. (2018) Astropy Collaboration, Price-Whelan, A. M., Sipőcz, B. M., et al. 2018, AJ, 156, 123, doi: 10.3847/1538-3881/aabc4f
- Baldwin et al. (1981) Baldwin, J. A., Phillips, M. M., & Terlevich, R. 1981, PASP, 93, 5, doi: 10.1086/130766
- Bassini et al. (2022) Bassini, L., Feldmann, R., Gensior, J., et al. 2022, arXiv e-prints, arXiv:2211.08423, doi: 10.48550/arXiv.2211.08423
- Baugh et al. (2005) Baugh, C. M., Lacey, C. G., Frenk, C. S., et al. 2005, MNRAS, 356, 1191, doi: 10.1111/j.1365-2966.2004.08553.x
- Birkin (2022) Birkin, J. E. 2022, PhD thesis, Durham University, UK
- Birkin et al. (2021) Birkin, J. E., Weiss, A., Wardlow, J. L., et al. 2021, MNRAS, 501, 3926, doi: 10.1093/mnras/staa3862
- Blain et al. (2002) Blain, A. W., Smail, I., Ivison, R. J., Kneib, J. P., & Frayer, D. T. 2002, Phys. Rep., 369, 111, doi: 10.1016/S0370-1573(02)00134-5
- Böker et al. (2023) Böker, T., Beck, T. L., Birkmann, S. M., et al. 2023, PASP, 135, 038001, doi: 10.1088/1538-3873/acb846
- Boquien et al. (2019) Boquien, M., Burgarella, D., Roehlly, Y., et al. 2019, A&A, 622, A103, doi: 10.1051/0004-6361/201834156
- Bothwell et al. (2017) Bothwell, M. S., Aguirre, J. E., Aravena, M., et al. 2017, MNRAS, 466, 2825, doi: 10.1093/mnras/stw3270
- Bruzual & Charlot (2003) Bruzual, G., & Charlot, S. 2003, MNRAS, 344, 1000, doi: 10.1046/j.1365-8711.2003.06897.x
- Bushouse et al. (2023) Bushouse, H., Eisenhamer, J., Dencheva, N., et al. 2023, JWST Calibration Pipeline, 1.9.6, Zenodo, doi: 10.5281/zenodo.7714020
- Bussmann et al. (2015) Bussmann, R. S., Riechers, D., Fialkov, A., et al. 2015, ApJ, 812, 43, doi: 10.1088/0004-637X/812/1/43
- Casey et al. (2014) Casey, C. M., Narayanan, D., & Cooray, A. 2014, Phys. Rep., 541, 45, doi: 10.1016/j.physrep.2014.02.009
- Cathey et al. (2023) Cathey, J., Gonzalez, A. H., Lower, S., et al. 2023, arXiv e-prints, arXiv:2307.10115, doi: 10.48550/arXiv.2307.10115
- Curti et al. (2020) Curti, M., Mannucci, F., Cresci, G., & Maiolino, R. 2020, MNRAS, 491, 944, doi: 10.1093/mnras/stz2910
- Curti et al. (2023) Curti, M., D’Eugenio, F., Carniani, S., et al. 2023, MNRAS, 518, 425, doi: 10.1093/mnras/stac2737
- Davé et al. (2010) Davé, R., Finlator, K., Oppenheimer, B. D., et al. 2010, MNRAS, 404, 1355, doi: 10.1111/j.1365-2966.2010.16395.x
- De Breuck et al. (2019) De Breuck, C., Weiß, A., Béthermin, M., et al. 2019, A&A, 631, A167, doi: 10.1051/0004-6361/201936169
- Dopita et al. (2016) Dopita, M. A., Kewley, L. J., Sutherland, R. S., & Nicholls, D. C. 2016, Ap&SS, 361, 61, doi: 10.1007/s10509-016-2657-8
- Dudzevičiūtė et al. (2020) Dudzevičiūtė, U., Smail, I., Swinbank, A. M., et al. 2020, MNRAS, 494, 3828, doi: 10.1093/mnras/staa769
- Dunne et al. (2003) Dunne, L., Eales, S. A., & Edmunds, M. G. 2003, MNRAS, 341, 589, doi: 10.1046/j.1365-8711.2003.06440.x
- Dunne et al. (2022) Dunne, L., Maddox, S. J., Papadopoulos, P. P., Ivison, R. J., & Gomez, H. L. 2022, MNRAS, 517, 962, doi: 10.1093/mnras/stac2098
- Endsley et al. (2023) Endsley, R., Stark, D. P., Lyu, J., et al. 2023, MNRAS, 520, 4609, doi: 10.1093/mnras/stad266
- Everett et al. (2020) Everett, W. B., Zhang, L., Crawford, T. M., et al. 2020, ApJ, 900, 55, doi: 10.3847/1538-4357/ab9df7
- Gardner et al. (2023) Gardner, J. P., Mather, J. C., Abbott, R., et al. 2023, PASP, 135, 068001, doi: 10.1088/1538-3873/acd1b5
- Gillman et al. (2022) Gillman, S., Puglisi, A., Dudzevičiūtė, U., et al. 2022, MNRAS, doi: 10.1093/mnras/stac580
- Harrington et al. (2016) Harrington, K. C., Yun, M. S., Cybulski, R., et al. 2016, MNRAS, 458, 4383, doi: 10.1093/mnras/stw614
- Hayward et al. (2021) Hayward, C. C., Sparre, M., Chapman, S. C., et al. 2021, MNRAS, 502, 2922, doi: 10.1093/mnras/stab246
- Hopkins et al. (2008) Hopkins, P. F., Hernquist, L., Cox, T. J., & Kereš, D. 2008, ApJS, 175, 356, doi: 10.1086/524362
- Kamieneski et al. (2023) Kamieneski, P. S., Yun, M. S., Harrington, K. C., et al. 2023, arXiv e-prints, arXiv:2301.09746, doi: 10.48550/arXiv.2301.09746
- Kewley et al. (2013) Kewley, L. J., Dopita, M. A., Leitherer, C., et al. 2013, ApJ, 774, 100, doi: 10.1088/0004-637X/774/2/100
- Kewley et al. (2006) Kewley, L. J., Groves, B., Kauffmann, G., & Heckman, T. 2006, MNRAS, 372, 961, doi: 10.1111/j.1365-2966.2006.10859.x
- Lacey et al. (2016) Lacey, C. G., Baugh, C. M., Frenk, C. S., et al. 2016, MNRAS, 462, 3854, doi: 10.1093/mnras/stw1888
- Lara-López et al. (2010) Lara-López, M. A., Cepa, J., Bongiovanni, A., et al. 2010, A&A, 521, L53, doi: 10.1051/0004-6361/201014803
- Leroy et al. (2011) Leroy, A. K., Bolatto, A., Gordon, K., et al. 2011, ApJ, 737, 12, doi: 10.1088/0004-637X/737/1/12
- Ma et al. (2015) Ma, J., Gonzalez, A. H., Spilker, J. S., et al. 2015, ApJ, 812, 88, doi: 10.1088/0004-637X/812/1/88
- Ma et al. (2016) Ma, J., Gonzalez, A. H., Vieira, J. D., et al. 2016, ApJ, 832, 114, doi: 10.3847/0004-637X/832/2/114
- Maiolino & Mannucci (2019) Maiolino, R., & Mannucci, F. 2019, A&A Rev., 27, 3, doi: 10.1007/s00159-018-0112-2
- Mannucci et al. (2010) Mannucci, F., Cresci, G., Maiolino, R., Marconi, A., & Gnerucci, A. 2010, MNRAS, 408, 2115, doi: 10.1111/j.1365-2966.2010.17291.x
- Marino et al. (2013) Marino, R. A., Rosales-Ortega, F. F., Sánchez, S. F., et al. 2013, A&A, 559, A114, doi: 10.1051/0004-6361/201321956
- Marrone et al. (2018) Marrone, D. P., Spilker, J. S., Hayward, C. C., et al. 2018, Nature, 553, 51, doi: 10.1038/nature24629
- Marsden et al. (2014) Marsden, D., Gralla, M., Marriage, T. A., et al. 2014, MNRAS, 439, 1556, doi: 10.1093/mnras/stu001
- McAlpine et al. (2019) McAlpine, S., Smail, I., Bower, R. G., et al. 2019, MNRAS, 488, 2440, doi: 10.1093/mnras/stz1692
- McElwain et al. (2023) McElwain, M. W., Feinberg, L. D., Perrin, M. D., et al. 2023, PASP, 135, 058001, doi: 10.1088/1538-3873/acada0
- McMullin et al. (2007) McMullin, J. P., Waters, B., Schiebel, D., Young, W., & Golap, K. 2007, in Astronomical Society of the Pacific Conference Series, Vol. 376, Astronomical Data Analysis Software and Systems XVI, ed. R. A. Shaw, F. Hill, & D. J. Bell, 127
- Menzel et al. (2023) Menzel, M., Davis, M., Parrish, K., et al. 2023, PASP, 135, 058002, doi: 10.1088/1538-3873/acbb9f
- Montuori et al. (2010) Montuori, M., Di Matteo, P., Lehnert, M. D., Combes, F., & Semelin, B. 2010, A&A, 518, A56, doi: 10.1051/0004-6361/201014304
- Negrello et al. (2010) Negrello, M., Hopwood, R., De Zotti, G., et al. 2010, Science, 330, 800, doi: 10.1126/science.1193420
- Osterbrock & Ferland (2006) Osterbrock, D. E., & Ferland, G. J. 2006, Astrophysics of gaseous nebulae and active galactic nuclei
- Papadopoulos & Greve (2004) Papadopoulos, P. P., & Greve, T. R. 2004, ApJ, 615, L29, doi: 10.1086/426059
- Peng et al. (2021) Peng, B., Lamarche, C., Stacey, G. J., et al. 2021, ApJ, 908, 166, doi: 10.3847/1538-4357/abd4e2
- Peng et al. (2022) Peng, B., Vishwas, A., Stacey, G., et al. 2022, arXiv e-prints, arXiv:2210.16968. https://arxiv.org/abs/2210.16968
- Pérez-Montero & Contini (2009) Pérez-Montero, E., & Contini, T. 2009, MNRAS, 398, 949, doi: 10.1111/j.1365-2966.2009.15145.x
- Pettini & Pagel (2004) Pettini, M., & Pagel, B. E. J. 2004, MNRAS, 348, L59, doi: 10.1111/j.1365-2966.2004.07591.x
- Pilyugin & Grebel (2016) Pilyugin, L. S., & Grebel, E. K. 2016, MNRAS, 457, 3678, doi: 10.1093/mnras/stw238
- Planck Collaboration et al. (2020) Planck Collaboration, Aghanim, N., Akrami, Y., et al. 2020, A&A, 641, A6, doi: 10.1051/0004-6361/201833910
- Poetrodjojo et al. (2019) Poetrodjojo, H., D’Agostino, J. J., Groves, B., et al. 2019, MNRAS, 487, 79, doi: 10.1093/mnras/stz1241
- Poetrodjojo et al. (2021) Poetrodjojo, H., Groves, B., Kewley, L. J., et al. 2021, MNRAS, 502, 3357, doi: 10.1093/mnras/stab205
- Rémy-Ruyer et al. (2014) Rémy-Ruyer, A., Madden, S. C., Galliano, F., et al. 2014, A&A, 563, A31, doi: 10.1051/0004-6361/201322803
- Reuter et al. (2020) Reuter, C., Vieira, J. D., Spilker, J. S., et al. 2020, ApJ, 902, 78, doi: 10.3847/1538-4357/abb599
- Reuter et al. (2023) Reuter, C., Spilker, J. S., Vieira, J. D., et al. 2023, ApJ, 948, 44, doi: 10.3847/1538-4357/acaf51
- Rigby et al. (2023a) Rigby, J., Perrin, M., McElwain, M., et al. 2023a, PASP, 135, 048001, doi: 10.1088/1538-3873/acb293
- Rigby et al. (2023b) Rigby, J. R., Lightsey, P. A., García Marín, M., et al. 2023b, PASP, 135, 048002, doi: 10.1088/1538-3873/acbcf4
- Rupke et al. (2010) Rupke, D. S. N., Kewley, L. J., & Chien, L. H. 2010, ApJ, 723, 1255, doi: 10.1088/0004-637X/723/2/1255
- Rupke et al. (2008) Rupke, D. S. N., Veilleux, S., & Baker, A. J. 2008, ApJ, 674, 172, doi: 10.1086/522363
- Rybak et al. (2022) Rybak, M., Hodge, J. A., Greve, T. R., et al. 2022, A&A, 667, A70, doi: 10.1051/0004-6361/202243894
- Sanders et al. (2015) Sanders, R. L., Shapley, A. E., Kriek, M., et al. 2015, ApJ, 799, 138, doi: 10.1088/0004-637X/799/2/138
- Sanders et al. (2020) Sanders, R. L., Shapley, A. E., Reddy, N. A., et al. 2020, MNRAS, 491, 1427, doi: 10.1093/mnras/stz3032
- Sanders et al. (2023) Sanders, R. L., Shapley, A. E., Clarke, L., et al. 2023, ApJ, 943, 75, doi: 10.3847/1538-4357/aca9cc
- Spilker et al. (2014) Spilker, J. S., Marrone, D. P., Aguirre, J. E., et al. 2014, ApJ, 785, 149, doi: 10.1088/0004-637X/785/2/149
- Spilker et al. (2015) Spilker, J. S., Aravena, M., Marrone, D. P., et al. 2015, ApJ, 811, 124, doi: 10.1088/0004-637X/811/2/124
- Spilker et al. (2016) Spilker, J. S., Marrone, D. P., Aravena, M., et al. 2016, ApJ, 826, 112, doi: 10.3847/0004-637X/826/2/112
- Spilker et al. (2023) Spilker, J. S., Phadke, K. A., Aravena, M., et al. 2023, Nature, 618, 708, doi: 10.1038/s41586-023-05998-6
- Steidel et al. (2014) Steidel, C. C., Rudie, G. C., Strom, A. L., et al. 2014, ApJ, 795, 165, doi: 10.1088/0004-637X/795/2/165
- Strandet et al. (2017) Strandet, M. L., Weiss, A., De Breuck, C., et al. 2017, ApJ, 842, L15, doi: 10.3847/2041-8213/aa74b0
- Sun et al. (2022) Sun, F., Egami, E., Fujimoto, S., et al. 2022, ApJ, 932, 77, doi: 10.3847/1538-4357/ac6e3f
- Swinbank et al. (2006) Swinbank, A. M., Chapman, S. C., Smail, I., et al. 2006, MNRAS, 371, 465, doi: 10.1111/j.1365-2966.2006.10673.x
- Swinbank et al. (2014) Swinbank, A. M., Simpson, J. M., Smail, I., et al. 2014, MNRAS, 438, 1267, doi: 10.1093/mnras/stt2273
- Tremonti et al. (2004) Tremonti, C. A., Heckman, T. M., Kauffmann, G., et al. 2004, ApJ, 613, 898, doi: 10.1086/423264
- Troncoso et al. (2014) Troncoso, P., Maiolino, R., Sommariva, V., et al. 2014, A&A, 563, A58, doi: 10.1051/0004-6361/201322099
- Trump et al. (2023) Trump, J. R., Arrabal Haro, P., Simons, R. C., et al. 2023, ApJ, 945, 35, doi: 10.3847/1538-4357/acba8a
- Vale Asari et al. (2019) Vale Asari, N., Couto, G. S., Cid Fernandes, R., et al. 2019, MNRAS, 489, 4721, doi: 10.1093/mnras/stz2470
- Vieira et al. (2013) Vieira, J. D., Marrone, D. P., Chapman, S. C., et al. 2013, Nature, 495, 344, doi: 10.1038/nature12001
- Wisnioski et al. (2015) Wisnioski, E., Förster Schreiber, N. M., Wuyts, S., et al. 2015, ApJ, 799, 209, doi: 10.1088/0004-637X/799/2/209
- Wuyts et al. (2014) Wuyts, E., Kurk, J., Förster Schreiber, N. M., et al. 2014, ApJ, 789, L40, doi: 10.1088/2041-8205/789/2/L40
- Zavala et al. (2021) Zavala, J. A., Casey, C. M., Manning, S. M., et al. 2021, ApJ, 909, 165, doi: 10.3847/1538-4357/abdb27