Stop Simulating!
Efficient Computation of
Tournament Winning Probabilities
Abstract
In the run-up to any major sports tournament, winning probabilities of participants are publicized for engagement and betting purposes. These are generally based on simulating the tournament tens of thousands of times by sampling from single-match outcome models. We show that, by virtue of the tournament schedule, exact computation of winning probabilties can be substantially faster than their approximation through simulation. This notably applies to the 2022 and 2023 FIFA World Cup Finals, and is independent of the model used for individual match outcomes.
1 Introduction
Predicting sports tournament winning probabilities is not just a popular pastime and an academic proxy competition, but also sets expectations and thus informs bookmaker odds and gamblers’ bet placements (Winston et al.,, 2022). Hence, a flurry of predictions is published before each major tournament. Our focus here is on association football (soccer), and specifically the most recent FIFA World Cup Finals, but the technique we introduce is more generally applicable.
Winning probabilities are commonly obtained via tournament simulations sampling from single-match outcome prediction models. While attention-seeking media tend to use cute animals to sample match outcomes (see also Horvat, 2020 for their proper naming), machine learning and other statistical models (Tsokos et al.,, 2019; Horvat and Job,, 2020) enable repeated sampling to stabilize predictions. Prominent examples of simulation-based predictions include those of Website FiveThirtyEight,111https://projects.fivethirtyeight.com/2022-world-cup-predictions/, accessed 19 July 2023 the Alan Turing Institute,222https://github.com/alan-turing-institute/WorldCupPrediction, accessed 19 July 2023 Joshua Bull,333https://www.maths.ox.ac.uk/node/61756, accessed 19 July 2023 the DTAI Sports Analytics Lab,444https://dtai.cs.kuleuven.be/sports/worldcup2023/, accessed 19 July 2023 and other groups of academic forecasters.555https://www.zeileis.org/news/fifawomen2023/, accessed 19 July 2023
We do not attempt to add to the rich list of outcome prediction models, but rather question whether a shared feature – the use tournament simulations to extend single-match predictions to winning probabilities – is computationally efficient. Published probabilities would often be based on 100,000 simulation runs, and never less than 10,000. Our main contribution is an algorithm that computes the exact probabilities implied by a single-match model in a time equivalent to a few hundred simulation runs.
As has been discussed multiple times, probabilities are efficiently computed in a bottom-up traversal of the tournament bracket, if the seeding of teams is fixed (Edwards,, 1991; Schwertman et al.,, 1991; Bettisworth et al.,, 2023). For a variety of reasons, including a guaranteed minimum number of matches for each participating team, seeding in the bracket is generally not fixed, but determined in a preceding group phase. For tournaments such as the most recent FIFA World Cup Finals the number of possible bracket seedings is in the hundreds of millions and therefore prohibitively expensive to enumerate. Koning et al., (2003) propose a hybrid approach in which they simulate only the group stage and then calculate winning probabilities conditional on the sampled group ranking. Our approach differs in that we enumerate outcomes for each group separately, and propagate the rank probabilities through the bracket while considering dependencies created by teams on trajectories that meet, especially those that already originate from the same group. By making these dependencies explicit we are able to exploit independence among the remaining outcomes for efficient computation of exact probabilities.
Our approach therefore relies on limited mixing of team trajectories in the current world cup formats. There are several other tournament formats that allow for the computation of exact probabilities. Among them are single-elimination tournaments with random seeding (David,, 1959; Hartigan,, 1966), double-elimination tournaments with a given seeding (Edwards,, 1996), a variant of single- and double-elimination in which a team must win two matches against an opponent to advance (Searls,, 1963), and a random knockout tournament for the case that the number of participants is not a power of two (Narayana and Zidek,, 1969).
In addition to the scenarios above, exact winning probabilities can further be used to assess seeding criteria empirically (David,, 1988). The issue of effectiveness, i.e., whether the highest rated team is most likely to win, has been studied for various tournament designs (Glenn,, 1960; Maurer,, 1975; Hwang,, 1977; Chung and Hwang,, 1978; Appleton,, 1995; Mcgarry and Schutz,, 1997; Schwenk,, 2000; Marchand,, 2002). This includes, in particular, FIFA World Cups (Scarf and Yusof,, 2011; Cea et al.,, 2020; Sziklai et al.,, 2022).
The remainder of this paper is organized as follows. In Section 2, we define terminology and the tournament format considered. An examplary single-match outcome model is introduced in Section 3, and the extension of any such model to tournament winning probabilities is described in Section 4. Results for the 2022 and 2023 FIFA World Cups are presented in Section 5 before we conclude in Section 6.
2 Preliminaries
We consider tournaments in which teams compete for a single title. The goal is to determine the probability of each team to win that title, given an oracle that returns outcome probabilities for matches between any two teams. A number of other results are obtained as a byproduct, for instance the probabilities of teams exiting the tournament in a particular round.
2.1 Tournament schedule and notation
Denote by the set of participating teams. While there are many ways to design a sports tournament (Scarf et al.,, 2009), we are specifically interested in the FIFA Men’s World Cup 2022 and FIFA Women’s World Cup 2023, where in both cases. In their rather common tournament formats, the schedule is fixed in advance and consists of two phases:
-
1.
Group stage: participants compete in equal-sized groups to which they have been assigned in a random draw from urns (“pots”) such that every group consists of one team from each pot.666Pots are generally stratified with respect to past performance to balance expected opponent strengths (Engist et al.,, 2021). W.l.o.g., we assume , , so that team is in group , where denotes integer division without remainder (e.g., ). After separate round-robin tournaments in which each team plays every other team from the same group, the two teams ranking first and second in each group advance to the elimination rounds, and the other teams are eliminated from the competition.
-
2.
Knockout stage: the remaining teams are paired in successive rounds of elimination matches, each time halving the number of teams remaining in competition for the title.
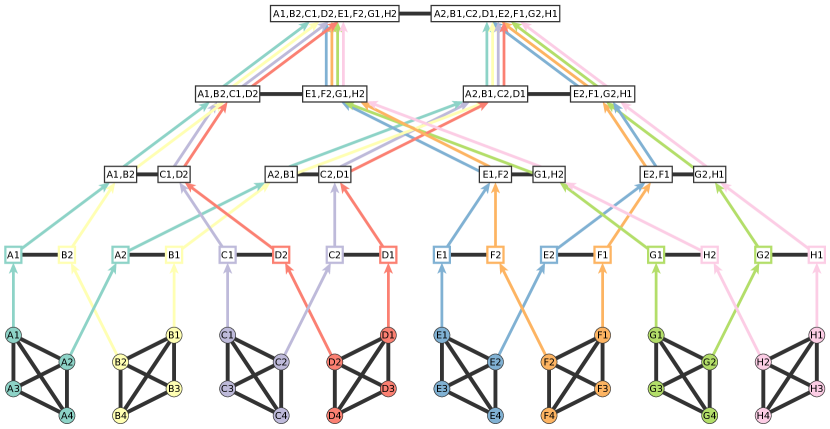
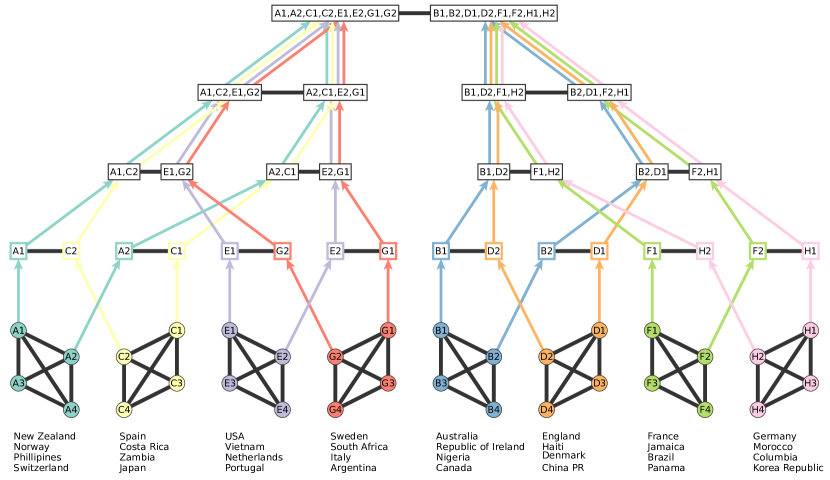
As shown in Figure 1, the fixtures of the two focal tournaments differ in the way teams can meet in the elimination rounds. We will see below that this matters also for computation time, because the mixing of team trajectories creates dependencies among winning probabilities.
2.2 Assumptions
We assume knowledge of the outcome distribution of individual matches on the level of wins, draws, and losses, i.e., we do not consider scorelines. The basis on which match outcome probabilities are determined varies. Proposed models often include past performance, but also player roster and market value, match location and weather conditions, betting behavior and social media signals, and for international sides even country characteristics and stock market trends (Hubáček et al.,, 2022; Groll et al.,, 2015; Schauberger and Groll,, 2018; Kuper and Szymanski,, 2022; Batarfi and Reade,, 2021; Lepschy et al.,, 2020).
Our computational scheme is independent of the particular model used to predict match outcomes. We only require the following conditions to be met:
-
•
predictions are to be made before the start of the tournament, i.e., in particular without evidence from matches and developments during the tournament
-
•
match outcome probabilities are independent, i.e., based only on information about the two teams playing each other
-
•
the only outcomes distinguished are winning, drawing, and losing, i.e., tie-breaking to determine a ranking at the end of the group stage (based on goal differences, direct comparisons, fair-play etc.) as well as extra time and penalty shootouts in the elimination phase are not considered and instead treated as fair coin flips.
While most of these assumptions could be relaxed or dropped altogether, they are instructive and simplify the exposition.
3 Single-Match Outcome Probabilities
With the assumptions above, we can pre-compute match outcome distributions for an upper-triangular matrix of random variables with values in for a loss, draw, or win of team when playing against team . The diagonal is empty (teams are not playing themselves) and the other off-diagonal entries are implicit, because transposed outcomes are related by .
This ternary representation will prove more convenient than a symmetric or point-based representation, because it allows us to encode sequences of outcomes as single integers with ternary digits.
Elimination matches end with one team advancing. For ease of exposition, we split the probability of a draw evenly between the probabilities of winning and losing. Only two possible outcomes remain and by setting the probability of advancing by eliminating to
we also obtain . In other words, we make no predictions about one team having higher chances in extra time or in penalty shootouts, the standard mechanisms to break a tie. This could be included, of course.
In principle, the algorithm described in the next section can be applied to any model for single-match outcomes. For demonstration purposes we choose here a model that is simple, yet relevant, as it underlies the FIFA/Coca-Cola World Rankings (Szczecinski and Roatis,, 2022). These rankings are variants of Élőratings (Élő,, 2008) and therefore based on a point system that rewards past results. Teams are assigned points , , which are updated regularly based on the differences between expected and actual match outcomes. Expected outcomes are determined by a logistic function in the differences of points,
so that equally rated teams yield an expectation of . The rate at which the expectation tends to for , and to for , is governed by sensitivity scale . The update mechanisms, and in fact even the way an outcome is determined, differ between the FIFA rankings for men and women. Except for the scaling factor, however, expected outcomes are determined the same. FIFA uses in the men’s ranking, and while the scale is not published for the women’s ranking, the magnitudes of recent updates suggest that it is .
To turn the continuous value for expected match outcomes into a discrete distribution over losses, draws (group stage only), and wins, we follow the model of Bradley and Terry, (1952). For a match between teams , there are two perspectives on the expected outcome,
which we interpret as the respective team strengths. Draws during the group stage are accomodated by the extension of Davidson and Beaver, (1977).
In a final step we re-calibrate the model by adjusting scaling factor . Since has an influence on the number of points re-allocated between teams, it appears that the above values are motivated in part by an attempt to dampen fluctuations, and as such too conservative for predictions in a high-stakes competition. We therefore determined the scaling factor for the women’s world cup by computing tournament winning probabilities (as described in the next section) for different scaling factors, and then chose as the minimizer of the squared differences between winning probabilities and averaged betting odds before the start of the tournament. Since this is of the estimated value of used in the FIFA ranking, we made the same adjustment for the men’s by setting .
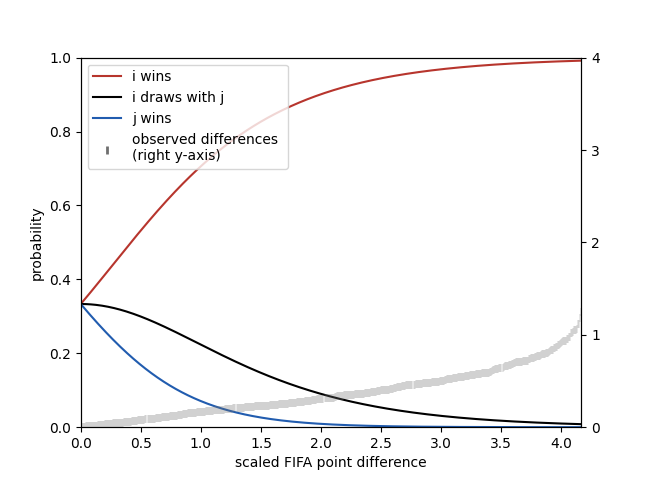
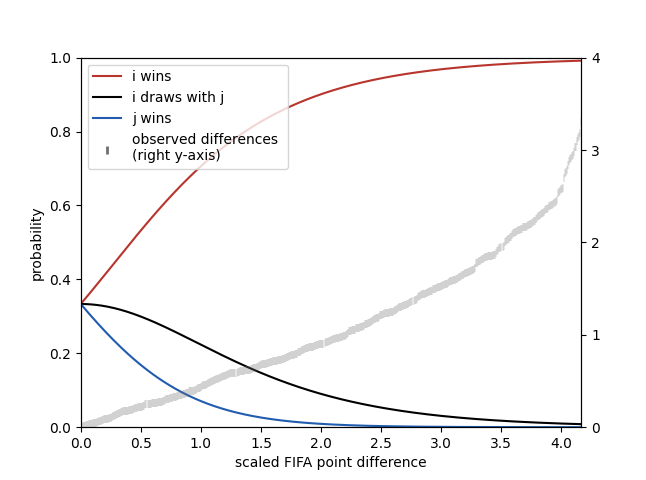
As illustrated in Figure 2, estimated team strengths not only differ more strongly in the women’s tournament, but are also more skewed. Despite the different scaling factors, this generally leads to more definite predictions in the women’s case.
4 Tournament Probabilities
It is important to note that in the tournaments we consider all fixtures are determined in advance. The possible trajectory of a team is fixed as soon as their table rank is known at the end of the group stage. In contrast, most national and international cup competitions for clubs feature additional draws after group stages and elimination rounds.
4.1 Group stage
The group stage is organized into separate round-robin tournaments within each group. Whether a team advances through this stage thus depends on the results of all matches in the group, including those between other teams, but not on matches in other groups.
We assume that match outcomes are independent from each other, both within and across groups. This assumptions is violated, for instance, if a team attempts to engineer a result to prevent a specific team in their group from entering the knockout stage, or to avoid a specific opponent from another group by entering it in a different seed position.
To determine the probability of ranks in the final group standings, all possible combinations of match outcomes are enumerated in each group. Hardness results for round-robin tournaments suggest that there is no substantially more efficient alternative (Bernholt et al.,, 1999; Kern and Paulusma,, 2001; Bernholt et al.,, 2002).
There are teams per group, playing a total of matches, which leads to possible combinations of outcomes. Because of the independence assumption,777Since all combinations are considered anyway, it would be possible, for instance, to make later results depend on earlier ones. the joint probability of each combination is given by the product of its six single-match outcome probabilities.
Moreover, all these outcome combinations are disjoint events, so that the probability of a team finishing in a specific table position is the sum of the probabilities of all six-match combinations that lead to this position. If an outcome combination leads to two or more teams having the same number of points, we rank them uniformly at random, because we did not require single-match outcome distributions to include probabilities for exact scorelines, and tie-breaking rules may depend on even more factors.
To enumerate all outcome sequences, we associate them with integers . In their ternary representation, , we let digit correspond to the result of the th match, . As in the previous section, indicate a loss, draw, or win. We then number matches in relation to the pots from which teams were drawn into the group, and order them column-wise for ease of index calculation in Algorithm 1.
Any given outcome sequence determines the number of points for each team and thus the final group standings separately in each group. Since we break ties at random, the same outcome sequence can lead to different rankings and, in particular, different teams advancing. We therefore associate with each outcome sequence a list of pairs containing all possible combinations of teams advancing as first and second into the round of the last 16. Only such pairs actually occur across all outcome sequences, so that iterating over these lists is more efficient than iterating over the rows of a table with all combinations of pairs and outcome sequences.888To simplify the management of data structures, we can nevertheless store the lists in a matrix of integers, in which the entry in the first column of row gives the number of possible top-ranked pairs for outcome sequence , and integer entries in the next columns represent the pair .
group table rank team points 1. 2 7 2. 1 4 2. 3 4 4. 0 1
Algorithm 1 summarizes the computation of probabilities for all pairs of teams to jointly advance in first and second place from the group stage. The outcomes are enumerated and for every group their respective probability is determined as the product of independent match outcome probabilities. For each ordered pair of teams in a group, the probability to advance together is obtained as the expected value of the relative frequency with which they finish in the first two places in this order. In other words, the probability of the potentially advancing pair is increased by the probability of said outcome sequence weighted by the inverse of the number of different pairs in the first two places when ties are broken at random. As a byproduct we obtain as the probability that team exits the tournament after the group stage.
Computation time is dominated by the enumeration of all outcome sequences, and their evaluation in each group. Entries in the pre-computed lists of possibly top-ranked pairs are iterated over once per group, so that the amortized number of elementary steps is .
We note that the result matrix has at most non-zero entries, and could clearly be stored more space-efficiently. We use it here only to highlight similarity with, and possible re-use in, the other rounds.
4.2 Knockout stage
With half of the teams eliminated after the group stage, the knockout stage consists of matches in the round of the last , quarterfinals, semifinals, and final.
Curiously, the schedule differs between the two FIFA tournaments as shown in Figure 1. While it was possible for two teams from the same group to play the final in the men’s competition, (had they won their semifinals, Croatia and Morocco, both from Group F, would have played the final rather then the match for 3rd place) this is not possible in the women’s competition, because the tournament bracket separates the eight groups into two subtrees of four that do not mix before the final. As a consequence of this difference, for instance, England (Group D) and the USA (Group E) will not have to face each other before the final, if at all.
In both tournaments, the brackets are set up such that each group sends a pair of teams into the round of the last 16 where they face a pair of opponents from the same other group, i.e., their two subtrees are mixing. The key observation, depicted in Figure 4 is that whatever happens in these two matches is independent from all other groups, and that this continues up the elimination tree. In each round, there is pairwise merging of intervals of consecutive groups.
In the first elimination round, the round of the last 16, a team can face any of the teams from a specific other group, while another pair of teams from the same two groups faces each other. The probability of these pairs of matches happening are not independent, because the probability of a team finishing first in the group influences the probabilities that some team finishes second, in particular it reduces said probability to zero for the team itself.
As for the groups, we therefore compute probabilities to advance for pairs of teams that win the two matches in which two subtrees are mixing. Possible fixtures are obtained by combining all pairs of teams advancing from one subtree with all those advancing from another.
The round of the last 16 (Algorithm 2) and the quarterfinals (Algorithm 3) can be implemented using the same principles. Because this part of the schedule is shared, they apply to both world cups. The number of elementary steps is determined by the number of matches and the number of pairs that can populate each of them. In pairs of matches in the round of the last 16, pairs from one group are matched (cross-wise, first against second) with pairs from another group for cases to consider per match. There are only pairs of quarterfinals, but the number of ordered pairs from two already mixed groups grows to for a total of possible matchups. Note that the indexing in Algorithm 3 is different, because incoming pairs are no longer ordered as first and second in group, but by trajectory from left to right.
| World Cup 2022: | World Cup 2023: |
In the men’s competition this scheme continued with the two semifinals where pairs of teams from four mixed groups face pairs of teams from the other four already mixed groups. Since there are possible pairs of teams advancing from four groups, we have a total of cases to consider. In the women’s competition, however, the semifinals are played between the two pairs of teams advancing together from the quarterfinals, so that there are only possible matchups. The pseudo-code in Algorithm 4 reflects this difference between the fixtures from Figure 4.
| World Cup 2022: | World Cup 2023: |
| for do |
Consequently, every team could meet any other team in the final of the 2022 World Cup, and even on two different routes initiated by finishing in reverse order in their groups. In the schedule for the 2023 World Cup, only teams from separate subtrees can play the final. The enumerations differ therefore, again, in Algorithm 5, and yield and cases, respectively.
The aggregate number of cases considered is therefore given by the following account:
| combinations | 2022 | 2023 |
|---|---|---|
| group stage | 15,912 | 15,912 |
| last 16 | 576 | 576 |
| quarterfinals | 6,272 | 6,272 |
| semifinals | 56,700 | 240 |
| final | 992 | 256 |
| total | 80,452 | 23,256 |
There are no large hidden constants in this computation of exact probabilities. Any one simulation run, on the other hand, samples match outcomes (not counting the match for third place). This suggests, and is confirmed by computational experiments presented in Section 5, that the exact computation requires no more time than is needed for a few hundred simulation runs.
5 Results
In this section we present winning probabilities obtained by running our algorithm on top of the single-match model introduced in Section 3. Recall that other models will lead to other outcomes, and that our objective is only to demonstrate computational feasibility, not quality of prediction.
Retrospective winning probabilities for the 2022 World Cup are given in Figure 5. Not surprisingly, the teams many consider to have deviated from prior expectations are semifinalists Morocco, and group-stage exits Belgium and Germany. Belgium may also be the team that had the highest variance in predictions across models.
Winning probabilities for the 2023 World Cup are given in Figure 6. Due to a stronger skew in points in the women’s ranking, probabilities also differ more strongly between the top and bottom teams. One consequence of the schedule is that both France and Brazil are expected to advance from Group F, but in uncertain order. The trajectory of the team placed second leads past the winners of Groups H and D, who are most likely Germany and England. With one very difficult path, their chances of advancing to the final are therefore reduced more strongly than, for instance, Australia’s, who are expected to face Denmark or China from Group D.
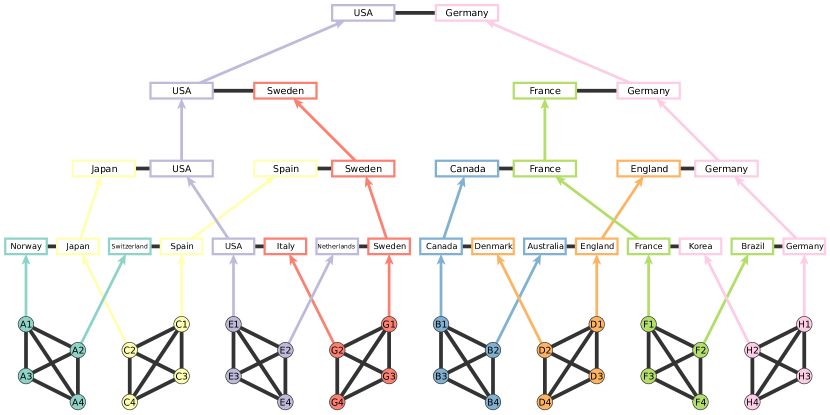
In Figure 7, the most likley tournament bracket is shown. Like the winning probabilities, it is a consequence of our use of the most recent FIFA ranking prior to the tournament and should not be taken too seriously.
Since our winning probabilities largely reflect the FIFA ranking and to some degree the expected difficulty of a team’s schedule, the above only served to demonstrate that results are plausible, given the assumptions. The real interest is in the relative computational efficiency of our exact algorithm with respect to simulation-based approximation.
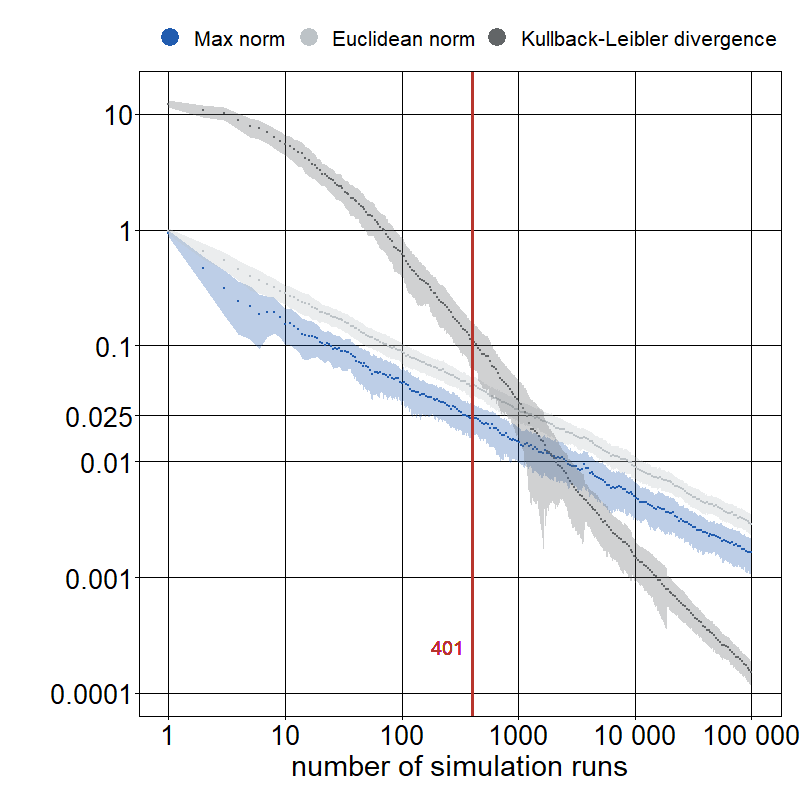
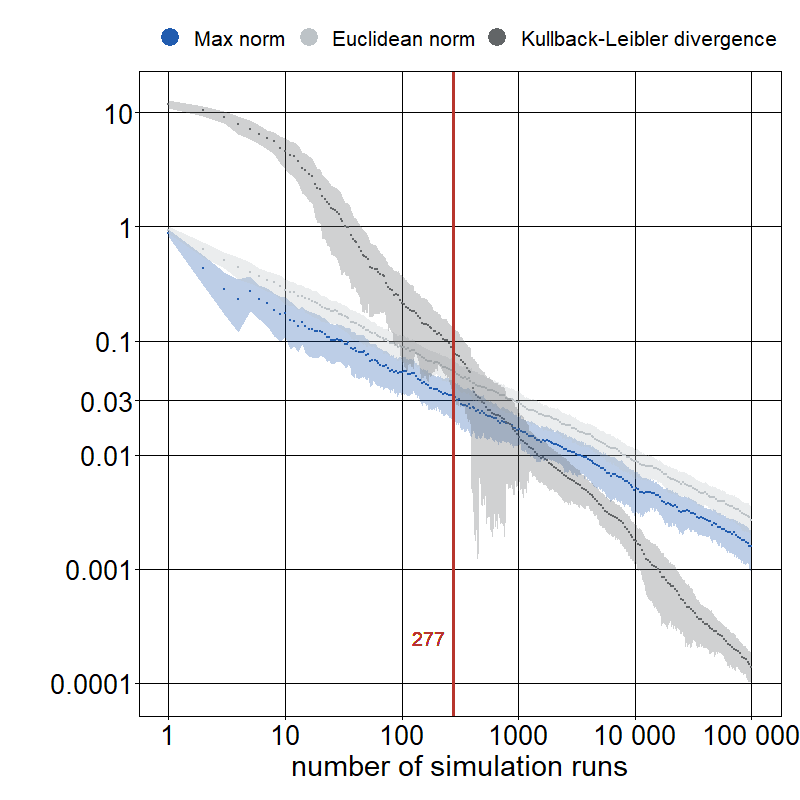
We therefore ran tournament simulations with the same outcome model and compare the quality of approximation to the (now available) exact probabilties in Figure 8. When the exact algorithm finishes, the maximum error in a probability estimate is around points, and thus larger than the majority of entries. To reduce it to even point, at least 10,000 simulations are necessary, no less than 20,000 simulations are required for reasonable accuracy, and even after 100,000 simulations the maximum error is still above points.
6 Conclusion
We have shown how to exploit limited mixing in sports tournament brackets to compute winning probabilities exactly. The computation is independent of the model used for single-match outcomes, and for the current FIFA World Cup schedules it is two orders of magnitude faster than any reasonably accurate approximation through tournament simulation.
This should make our approach interesting for the assessment of tournament-level consequences of differences in single-match prediction models, and hence also for experiments with different parameter settings. Note also that the algorithm can be run on partial tournaments by setting the probabilities of known outcomes to . Updates after any number of matches played, or projections from current scores can thus be computed live.
The speed-up is facilitated by limited mixing of team trajectories in the tournament design. In each elimination round, the number of groups which opposing teams may originate from is no more than doubling. Our approach therefore generalizes to tournament settings in which integer parameters describe the number of elimination rounds after teams advance and exit at the end of the group stage ( and for the FIFA World Cup Finals above):
-
•
teams
-
•
equal-sized groups, and therefore teams per group
-
•
teams advance from each of the groups, so that elimination rounds are needed to determine the winner
-
•
groups are ordered such that an th-round elimination match between and is possible only if
The last item constrains the degree of mixing.
Running times are still prohibitive, however, if group sizes are large. The FIFA Men’s World Cup 2026 is planned for participants. If they were to be organized in groups of teams each, with teams from each group advancing into the elimination round, then and , and therefore . The number of matches would increase to in the group stage and elimination matches (including a match for third place). Each team plays five matches during the group stage and up to four in the elimination rounds. Not only does this add up to an enormous tournament of matches, but there are possible outcome sequences to enumerate in the group stage alone.
If participants are instead organized into groups of teams each, the format does not fit our generalization, because the number of groups is not a power of . It is unlikely that a second stage with groups of teams will be used to set up a round of the last 16. The more common format consists of of the third-placed teams advancing to complete an elimination round of the last 32. This would yield a total of matches in the group stage and elimination matches (including a match for third place). Each team plays three matches during the group stage and up to five in the elimination rounds. While a tournament with matches is almost twice as big as the current format, the greater challenge for the computation of winning probabilities will lie in the higher degree of trajectory mixing caused by third-placed teams from a subset of groups not known in advance.
For the current format (which may soon be used for the UEFA EURO Finals), and even for tournaments with teams in groups or teams in groups, both the number of matches and running time of exact computation scale reasonably well with .
References
- Appleton, (1995) Appleton, D. R. (1995). May the Best Man Win? The Statistician, 44(4):529.
- Batarfi and Reade, (2021) Batarfi, M. and Reade, J. (2021). Why are We So Good At Football, and They So Bad? Institutions and National Footballing Performance. De Economist, 169(1):63–80.
- Bernholt et al., (1999) Bernholt, T., Gülich, A., Hofmeister, T., and Schmitt, N. (1999). Football Elimination Is Hard to Decide Under the 3-Point-Rule. In Kutyłowski, M., Pacholski, L., and Wierzbicki, T., editors, Mathematical Foundations of Computer Science 1999, Lecture Notes in Computer Science, pages 410–418, Berlin, Heidelberg. Springer.
- Bernholt et al., (2002) Bernholt, T., Gülich, A., Hofmeister, T., Schmitt, N., and Wegener, I. (2002). Komplexitätstheorie, effiziente Algorithmen und die Bundesliga. Informatik-Spektrum, 25(6):488–502.
- Bettisworth et al., (2023) Bettisworth, B., Jordan, A. I., and Stamatakis, A. (2023). Phylourny: efficiently calculating elimination tournament win probabilities via phylogenetic methods. Statistics and Computing, 33(4):80.
- Bradley and Terry, (1952) Bradley, R. A. and Terry, M. E. (1952). Rank Analysis of Incomplete Block Designs: I. The Method of Paired Comparisons. Biometrika, 39(3/4):324–345. Publisher: [Oxford University Press, Biometrika Trust].
- Cea et al., (2020) Cea, S., Durán, G., Guajardo, M., Sauré, D., Siebert, J., and Zamorano, G. (2020). An analytics approach to the FIFA ranking procedure and the World Cup final draw. Annals of Operations Research, 286(1-2):119–146.
- Chung and Hwang, (1978) Chung, F. R. K. and Hwang, F. K. (1978). Do Stronger Players Win More Knockout Tournaments? Journal of the American Statistical Association, 73(363):593–596.
- David, (1959) David, H. A. (1959). Tournaments and Paired Comparisons. Biometrika, 46(1/2):139.
- David, (1988) David, H. A. (1988). The method of paired comparisons. Number no. 41 in Monograph. C. Griffin ; Oxford University Press, London : New York, 2nd ed., rev edition.
- Davidson and Beaver, (1977) Davidson, R. R. and Beaver, R. J. (1977). On Extending the Bradley-Terry Model to Incorporate Within-Pair Order Effects. Biometrics, 33(4):693–702.
- Edwards, (1991) Edwards, C. T. (1991). The combinatorial theory of single-elimination tournaments. PhD thesis, Montana State University.
- Edwards, (1996) Edwards, C. T. (1996). Double-Elimination Tournaments: Counting and Calculating. The American Statistician, 50(1):27–33.
- Élő, (2008) Élő, A. E. (2008). The Rating of Chess Players, Past and Present. Ishi Press, Bronx, NY.
- Engist et al., (2021) Engist, O., Merkus, E., and Schafmeister, F. (2021). The Effect of Seeding on Tournament Outcomes: Evidence From a Regression-Discontinuity Design. Journal of Sports Economics, 22(1):115–136. Publisher: SAGE Publications.
- Glenn, (1960) Glenn, W. A. (1960). A Comparison of the Effectiveness of Tournaments. Biometrika, 47(3/4):253.
- Groll et al., (2015) Groll, A., Schauberger, G., and Tutz, G. (2015). Prediction of major international soccer tournaments based on team-specific regularized Poisson regression: An application to the FIFA World Cup 2014. Journal of Quantitative Analysis in Sports, 11(2):97–115. Publisher: De Gruyter.
- Hartigan, (1966) Hartigan, J. A. (1966). Probabilistic Completion of a Knockout Tournament. The Annals of Mathematical Statistics, 37(2):495–503.
- Horvat, (2020) Horvat, J. (2020). From Paul the Octopus to Achilles the Cat – Proper Names of Animals which Predict the Outcomes of Sports Competitions. Folia Onomastica Croatica, 29:73–121.
- Horvat and Job, (2020) Horvat, T. and Job, J. (2020). The use of machine learning in sport outcome prediction: A review. WIREs Data Mining and Knowledge Discovery, 10(5):e1380.
- Hubáček et al., (2022) Hubáček, O., Šourek, G., and železný, F. (2022). Forty years of score-based soccer match outcome prediction: an experimental review. IMA Journal of Management Mathematics, 33(1):1–18.
- Hwang, (1977) Hwang, F. K. (1977). Several problems on knockout tournaments. In Hoffman, F., Lesniak-Foster, L., and McCarthy, D., editors, Proceedings of the Eighth Southeastern Conference on Combinatorics, Graph Theory, and Computing: Baton Rouge, Louisiana, February 28 - March 3, 1977, volume 19 of Congressus Numerantium, pages 363–380. Utilitas Mathematica Publishing.
- Kern and Paulusma, (2001) Kern, W. and Paulusma, D. (2001). The new FIFA rules are hard: complexity aspects of sports competitions. Discrete Applied Mathematics, 108(3):317–323.
- Koning et al., (2003) Koning, R. H., Koolhaas, M., Renes, G., and Ridder, G. (2003). A simulation model for football championships. European Journal of Operational Research, 148(2):268–276.
- Kuper and Szymanski, (2022) Kuper, S. and Szymanski, S. (2022). Soccernomics (2022 World Cup Edition): Why France and Germany Win, Why England Is Starting to and Why The Rest of the World Loses. HarperCollins, 2022nd edition edition.
- Lepschy et al., (2020) Lepschy, H., Wäsche, H., and Woll, A. (2020). Success factors in football: an analysis of the German Bundesliga. International Journal of Performance Analysis in Sport, 20(2):150–164.
- Marchand, (2002) Marchand, É. (2002). On the comparison between standard and random knockout tournaments. Journal of the Royal Statistical Society: Series D (The Statistician), 51(2):169–178.
- Maurer, (1975) Maurer, W. (1975). On Most Effective Tournament Plans With Fewer Games than Competitors. The Annals of Statistics, 3(3).
- Mcgarry and Schutz, (1997) Mcgarry, T. and Schutz, R. W. (1997). Efficacy of traditional sport tournament structures. Journal of the Operational Research Society, 48(1):65–74.
- Narayana and Zidek, (1969) Narayana, T. V. and Zidek, J. (1969). Contributions to the Theory of Tournaments Part I: The Combinatorics of Knock-Out Tournaments. Cahiers du Bureau universitaire de recherche opérationnelle Série Recherche, 13:3–18. Publisher: Institut Henri Poincaré - Institut de Statistique de l’Université de Paris.
- Scarf et al., (2009) Scarf, P., Yusof, M. M., and Bilbao, M. (2009). A numerical study of designs for sporting contests. European Journal of Operational Research, 198(1):190–198.
- Scarf and Yusof, (2011) Scarf, P. A. and Yusof, M. M. (2011). A numerical study of tournament structure and seeding policy for the soccer World Cup Finals: Tournament design for the soccer World Cup Finals. Statistica Neerlandica, 65(1):43–57.
- Schauberger and Groll, (2018) Schauberger, G. and Groll, A. (2018). Predicting matches in international football tournaments with random forests. Statistical Modelling, 18(5-6):460–482.
- Schwenk, (2000) Schwenk, A. J. (2000). What Is the Correct Way to Seed a Knockout Tournament? The American Mathematical Monthly, 107(2):140–150.
- Schwertman et al., (1991) Schwertman, N. C., McCready, T. A., and Howard, L. (1991). Probability Models for the NCAA Regional Basketball Tournaments. The American Statistician, 45(1):35–38.
- Searls, (1963) Searls, D. T. (1963). On the Probability of Winning with Different Tournament Procedures. Journal of the American Statistical Association, 58(304):1064–1081.
- Szczecinski and Roatis, (2022) Szczecinski, L. and Roatis, I.-I. (2022). FIFA ranking: Evaluation and path forward. Journal of Sports Analytics, 8(4):231–250. Publisher: IOS Press.
- Sziklai et al., (2022) Sziklai, B. R., Biró, P., and Csató, L. (2022). The efficacy of tournament designs. Computers & Operations Research, 144:105821.
- Tsokos et al., (2019) Tsokos, A., Narayanan, S., Kosmidis, I., Baio, G., Cucuringu, M., Whitaker, G., and Király, F. (2019). Modeling outcomes of soccer matches. Machine Learning, 108(1):77–95.
- Winston et al., (2022) Winston, W. L., Nestler, S., and Pelechrinis, K. (2022). Mathletics: How Gamblers, Managers, and Fans Use Mathematics in Sports, Second Edition. Princeton University Press, Princeton, 2nd edition edition.
Appendix A Team Strengths in FIFA Rankings
Points in FIFA/Coca-Cola Rankings prior to tournament (rounded to nearest integer).
| Men’s (October 2022) | |
|---|---|
| Brazil | 1841 |
| Belgium | 1817 |
| Argentina | 1774 |
| France | 1760 |
| England | 1728 |
| Spain | 1715 |
| Netherlands | 1695 |
| Portugal | 1677 |
| Denmark | 1667 |
| Germany | 1650 |
| Croatia | 1646 |
| Mexico | 1645 |
| Uruguay | 1639 |
| Switzerland | 1636 |
| USA | 1627 |
| Senegal | 1584 |
| Wales | 1570 |
| IR Iran | 1565 |
| Serbia | 1564 |
| Morocco | 1564 |
| Japan | 1560 |
| Poland | 1549 |
| Ecuador | 1464 |
| Korea Republic | 1530 |
| Tunisia | 1508 |
| Costa Rica | 1504 |
| Australia | 1489 |
| Canada | 1475 |
| Cameroon | 1471 |
| Qatar | 1440 |
| Saudi Arabia | 1438 |
| Ghana | 1393 |
| Women’s (June 2023) | |
|---|---|
| USA | 2090 |
| Germany | 2062 |
| Sweden | 2050 |
| England | 2041 |
| France | 2027 |
| Spain | 2002 |
| Canada | 1996 |
| Brazil | 1995 |
| Netherlands | 1980 |
| Australia | 1920 |
| Japan | 1917 |
| Norway | 1908 |
| Denmark | 1866 |
| China PR | 1854 |
| Italy | 1847 |
| Korea Republic | 1840 |
| Switzerland | 1766 |
| Portugal | 1745 |
| Republic of Ireland | 1744 |
| Colombia | 1703 |
| New Zealand | 1700 |
| Argentina | 1682 |
| Vietnam | 1649 |
| Costa Rica | 1597 |
| Nigeria | 1555 |
| Jamaica | 1537 |
| Philippines | 1513 |
| Panama | 1483 |
| Haiti | 1475 |
| South Africa | 1472 |
| Morocco | 1334 |
| Zambia | 1298 |
Appendix B World Cup Groups
B.1 FIFA Men’s World Cup 2022
| A () | B () | C () | D () |
| Qatar | England | Argentina | France |
| Ecuador | IR Iran | Saudi Arabia | Australia |
| Senegal | USA | Mexico | Denmark |
| Netherlands | Wales | Poland | Tunisia |
| E () | F () | G () | H () |
| Spain | Belgium | Brazil | Portugal |
| Costa Rica | Canada | Serbia | Ghana |
| Germany | Morocco | Switzerland | Uruguay |
| Japan | Croatia | Cameroon | Korea Republic |
B.2 FIFA Women’s World Cup 2023
| A () | C () | E () | G () |
| New Zealand | Spain | USA | Sweden |
| Norway | Costa Rica | Vietnam | South Africa |
| Philippines | Zambia | Netherlands | Italy |
| Switzerland | Japan | Portugal | Argentina |
| B () | D () | F () | H () |
| Australia | England | France | Germany |
| Republic of Ireland | Haiti | Jamaica | Morocco |
| Nigeria | Denmark | Brazil | Colombia |
| Canada | China PR | Panama | Korea Republic |
Appendix C Group Ranking Table
to be added as supplementary information.
Appendix D Code
Implementation in R to be provided for use with any single-match model.