.tifpng.pngconvert #1 \OutputFile \AppendGraphicsExtensions.tif
Partially Saturated Granular Flow in a Rotating Drum: The Role of Cohesion
Abstract
Abstract
Partially saturated granular flows are common in various natural and industrial processes, such as landslides, mineral handling, and food processing. We conduct experiments and apply the Discrete Element Method (DEM) to study granular flows in rotating drums under partially saturated conditions. We focus on varying the strength of cohesion (surface tension) and rotation rate within the modes of rolling flow and cascading flow. With an increase in surface tension, a rolling mode can possess a steeper slope and correspondingly needs a higher rotation rate to transition to a cascading. The depth of the flowing region increases with increasing cohesion, while the sensitivity is reduced for cases of high cohesion. We propose a dimensionless number that captures the combined effects of rotation, gravity and cohesion on the dynamic angle of repose and flow depth. In addition, we extract statistical information on the formation of clusters within the flow. We find a power law relation between the cluster size distribution and its probability, which indicates that stronger cohesion can promote the formation of larger clusters, and we discuss how cohesion impact on flows manifested by cluster formation.
Highlights
-
•
Partially saturated granular flow is investigated using rotating drum experiments and the Discrete Element Method (DEM).
-
•
A dimensionless number () is proposed based on inertia, gravity, and cohesion to characterise the cohesive granular flow.
-
•
A transition from rolling to cascading flow is observed due to changes in cohesion and can be characterised by the morphology and depth of the flowing region.
-
•
The formation of clusters due to cohesion is analysed and its impacts on the depth of the flow is highlighted.
I Introduction
Granular materials are prevalent in all domains of human activity, from natural sands to industrial and mining operations Andreotti, Forterre, and Pouliquen (2013). When disturbed, these materials can transition from behaving as a solid to flowing like a liquid. The rheological properties of this flowing material have been studied under various conditions Komatsu et al. (2001); gdrmidi@ polytech. univ-mrs. fr http://www. lmgc. univ-montp2. fr/MIDI/ (2004); Forterre and Pouliquen (2008); Norouzi, Zarghami, and Mostoufi (2015); Espiritu et al. (2020). Individual grains in these flows can be characterised by properties such as their size, shape and mass. A granular flow, when described as a continuum, can alternatively be described by fields such as the density (or solid fraction), pressure and strain rate. To determine the relationships between the individual particle properties and their continuum equivalents, many apparatus and simulations with different geometries have been studied for granular media with and without the presence of inter-particle cohesion gdrmidi@ polytech. univ-mrs. fr http://www. lmgc. univ-montp2. fr/MIDI/ (2004); Rognon et al. (2008); Forterre and Pouliquen (2008); Orpe and Khakhar (2001); Komatsu et al. (2001); Wang et al. (2019); Mandal, Nicolas, and Pouliquen (2020); Bonamy et al. (2002a); Orpe and Khakhar (2007); Forterre and Pouliquen (2008); Cortet et al. (2009); Jarray, Magnanimo, and Luding (2019). However, there is still a lack of comprehensive understanding of the flow behaviour of cohesive granular materials.
A granular surface flow can occur due to the presence of gravity and a difference in height. A surface flow is characterised by a flowing layer of grains at the surface, with stationary grains underneath. Surface particles flowing along steeper slopes tend to possess higher velocities Pouliquen (2004). For slightly cohesive particles under the same conditions, surface particle velocity is observed to be reduced Jarray, Magnanimo, and Luding (2019). With the increase of cohesion, the surface flow can transition to a plug flow where a plug region can be found overlying a shear band Brewster et al. (2005); Rognon et al. (2008); Mandal, Nicolas, and Pouliquen (2020). The stratification of the flow region can be viewed as a transition from a collisional flow to a viscoplastic regime Da Cruz et al. (2005); Mandal, Nicolas, and Pouliquen (2020); Tegzes et al. (2002). The variation of the flowing layer depth, i.e., the distance between the flow surface and the flow-solid interface, may indicate the dissipation of the amount of gravitational energy that was previously stored by particles flowing on the top Chou and Hsiau (2011); Jarray, Magnanimo, and Luding (2019).
Since characteristic particle size plays a crucial role in affecting various aspects of granular flow, including inter-particle friction, packing and porosity, permeability and seepage, segregation and mixing Renouf et al. (2005); Ostoja-Starzewski (2006); Qu, Feng, and Wang (2021); Shaheen et al. (2021), a description of the cluster formation can be criticalBonamy et al. (2002a); Pouliquen (2004); Fullmer and Hrenya (2017). It is particularly useful to understand the flow mechanism of cohesive particlesTegzes et al. (2002); gdrmidi@ polytech. univ-mrs. fr http://www. lmgc. univ-montp2. fr/MIDI/ (2004); Pouliquen (2004); Rognon et al. (2008); Cao et al. (2018). Bonamy et al. (2002b) studied cluster formation in cohesionless particle surface flows based on velocity fluctuations, where a negative power law relation was identified between the cluster size (quantified by the number of particles within a cluster) and their corresponding probabilities. Cao et al. (2018) demonstrated that the inter-cluster plastic rearrangement between unstable tetrahedral clusters plays an essential role in the plasticity of sheared granular materials. Zou et al. (2022) presented how the particle shape (aspect ratio) can contribute to increasing the cluster formation in a dense granular flow. For cohesive particles, a viscoplastic flow accompanied by free surfaces that possess repetitive patterns due to the formed clusters can be observed Tegzes et al. (2002). The velocity of intra-cluster particles remains coherent, which can lead to a relatively low local granular temperature Jarray, Magnanimo, and Luding (2019). Rognon et al. (2008) mentioned that clusters can play a key role in the dilation effect of cohesive granular flows.
The rotating drum has been widely used in various applications and provides rich information on granular flow Bonamy et al. (2002a); Orpe and Khakhar (2007); Forterre and Pouliquen (2008); Cortet et al. (2009); Norouzi, Zarghami, and Mostoufi (2015); Jarray, Magnanimo, and Luding (2019). Particles in a rotating drum can be divided into two parts. Firstly, a passive, "solid-like", region is rotated along the tube before flowing down. Secondly, an active flow, "fluid-like", region forms a surface flow. As the rotation rate increases for a given granular medium, the flow can be characterised into six surface flow modes; slipping (no flow), slumping (intermittent avalanches), rolling (continuous flow with a tilted flat surface), cascading (continuous flow with a curved "" shape surface), cataracting (overturning tumbling) and centrifuging (all particles stuck to the tube walls) Henein, Brimacombe, and Watkinson (1983). It has been shown that the transition between these modes depends on a variety of parameters, e.g., the rotation rate, particle shape, particle-to-drum size ratio, filling rate, wall effects, and cohesion effects Nowak et al. (2005); Taberlet, Richard, and Hinch (2006); Arntz et al. (2008); Brewster, Grest, and Levine (2009); Liu, Yang, and Yu (2013); Jarray, Magnanimo, and Luding (2019). The dimensionless Froude number () is widely adopted to describe the mode transition,
| (1) |
where is the rotation rate, the drum radius, and the gravitational acceleration. The Froude number considers the competing effects of inertia and gravity Arntz et al. (2008); Jarray, Magnanimo, and Luding (2019). A low Froude number typically corresponds to slipping, and a Froude number greater than one represents centrifuging. In this work, unless stated otherwise, we focus on flow transition between rolling and cascading flow modes. Within the rolling and cascading modes, the dynamic angle of repose is a critical parameter for characterising the behaviour of the granular flow Henein, Brimacombe, and Watkinson (1983); Xu, Orpe, and Kudrolli (2007); Jarray, Magnanimo, and Luding (2019); Chen and Yan (2021). A relationship between and the dynamic angle of repose can be establishedRajchenbach (1990); Arntz et al. (2008) where an increase of can drive the transition gradually from slumping to rolling and then to cascading.
For cohesive particles in a rotating drum, two additional dimensionless numbers become relevant, namely, the Bond number (), which describes the relative importance of cohesion compared to the gravitational force, and the Weber number (), representing the ratio of inertia to cohesionNowak et al. (2005); Jarray, Magnanimo, and Luding (2019). These two dimensionless numbers are expressed as:
| (2) | ||||
| (3) |
where is the liquid surface tension, the multiphase contact angle, the material density, the average particle radius, and the rotation rate. Within relatively high cohesion, typically, the > 1, intermittent avalanches can be observed when the rotating rate is low Elekes and Parteli (2021). Whilst under the same condition, a continuous flow can be found for cohesionless particlesNowak et al. (2005). Within continuous flow modes, a nonlinear correlation can be found between and the dynamic angle of repose Jarray, Magnanimo, and Luding (2019).
Here, we investigate the behaviour of partially saturated granular media in a rotating drum through experimentally validated simulations with the Discrete Element Method. We focus on quantifying and analysing three key characteristic features; the dynamic angle of repose (), the flow depth (), and the formation of clusters, under various rotation rates () and surface tensions (). After the introduction, we first present the experimental setup and numerical method in Section II. In Section III, we discuss the effect of cohesion on these characteristic features to understand the relationship between cohesion energy (provided by ) and kinetic energy (by ). We propose a dimensionless number that takes gravity, inertia, and cohesion into account, and demonstrate its effectiveness in characterising cohesive granular flows in a rotating drum. Finally, we discuss the implications of our findings and conclude with potential research directions.
II Method
II.1 Rotating drum setup
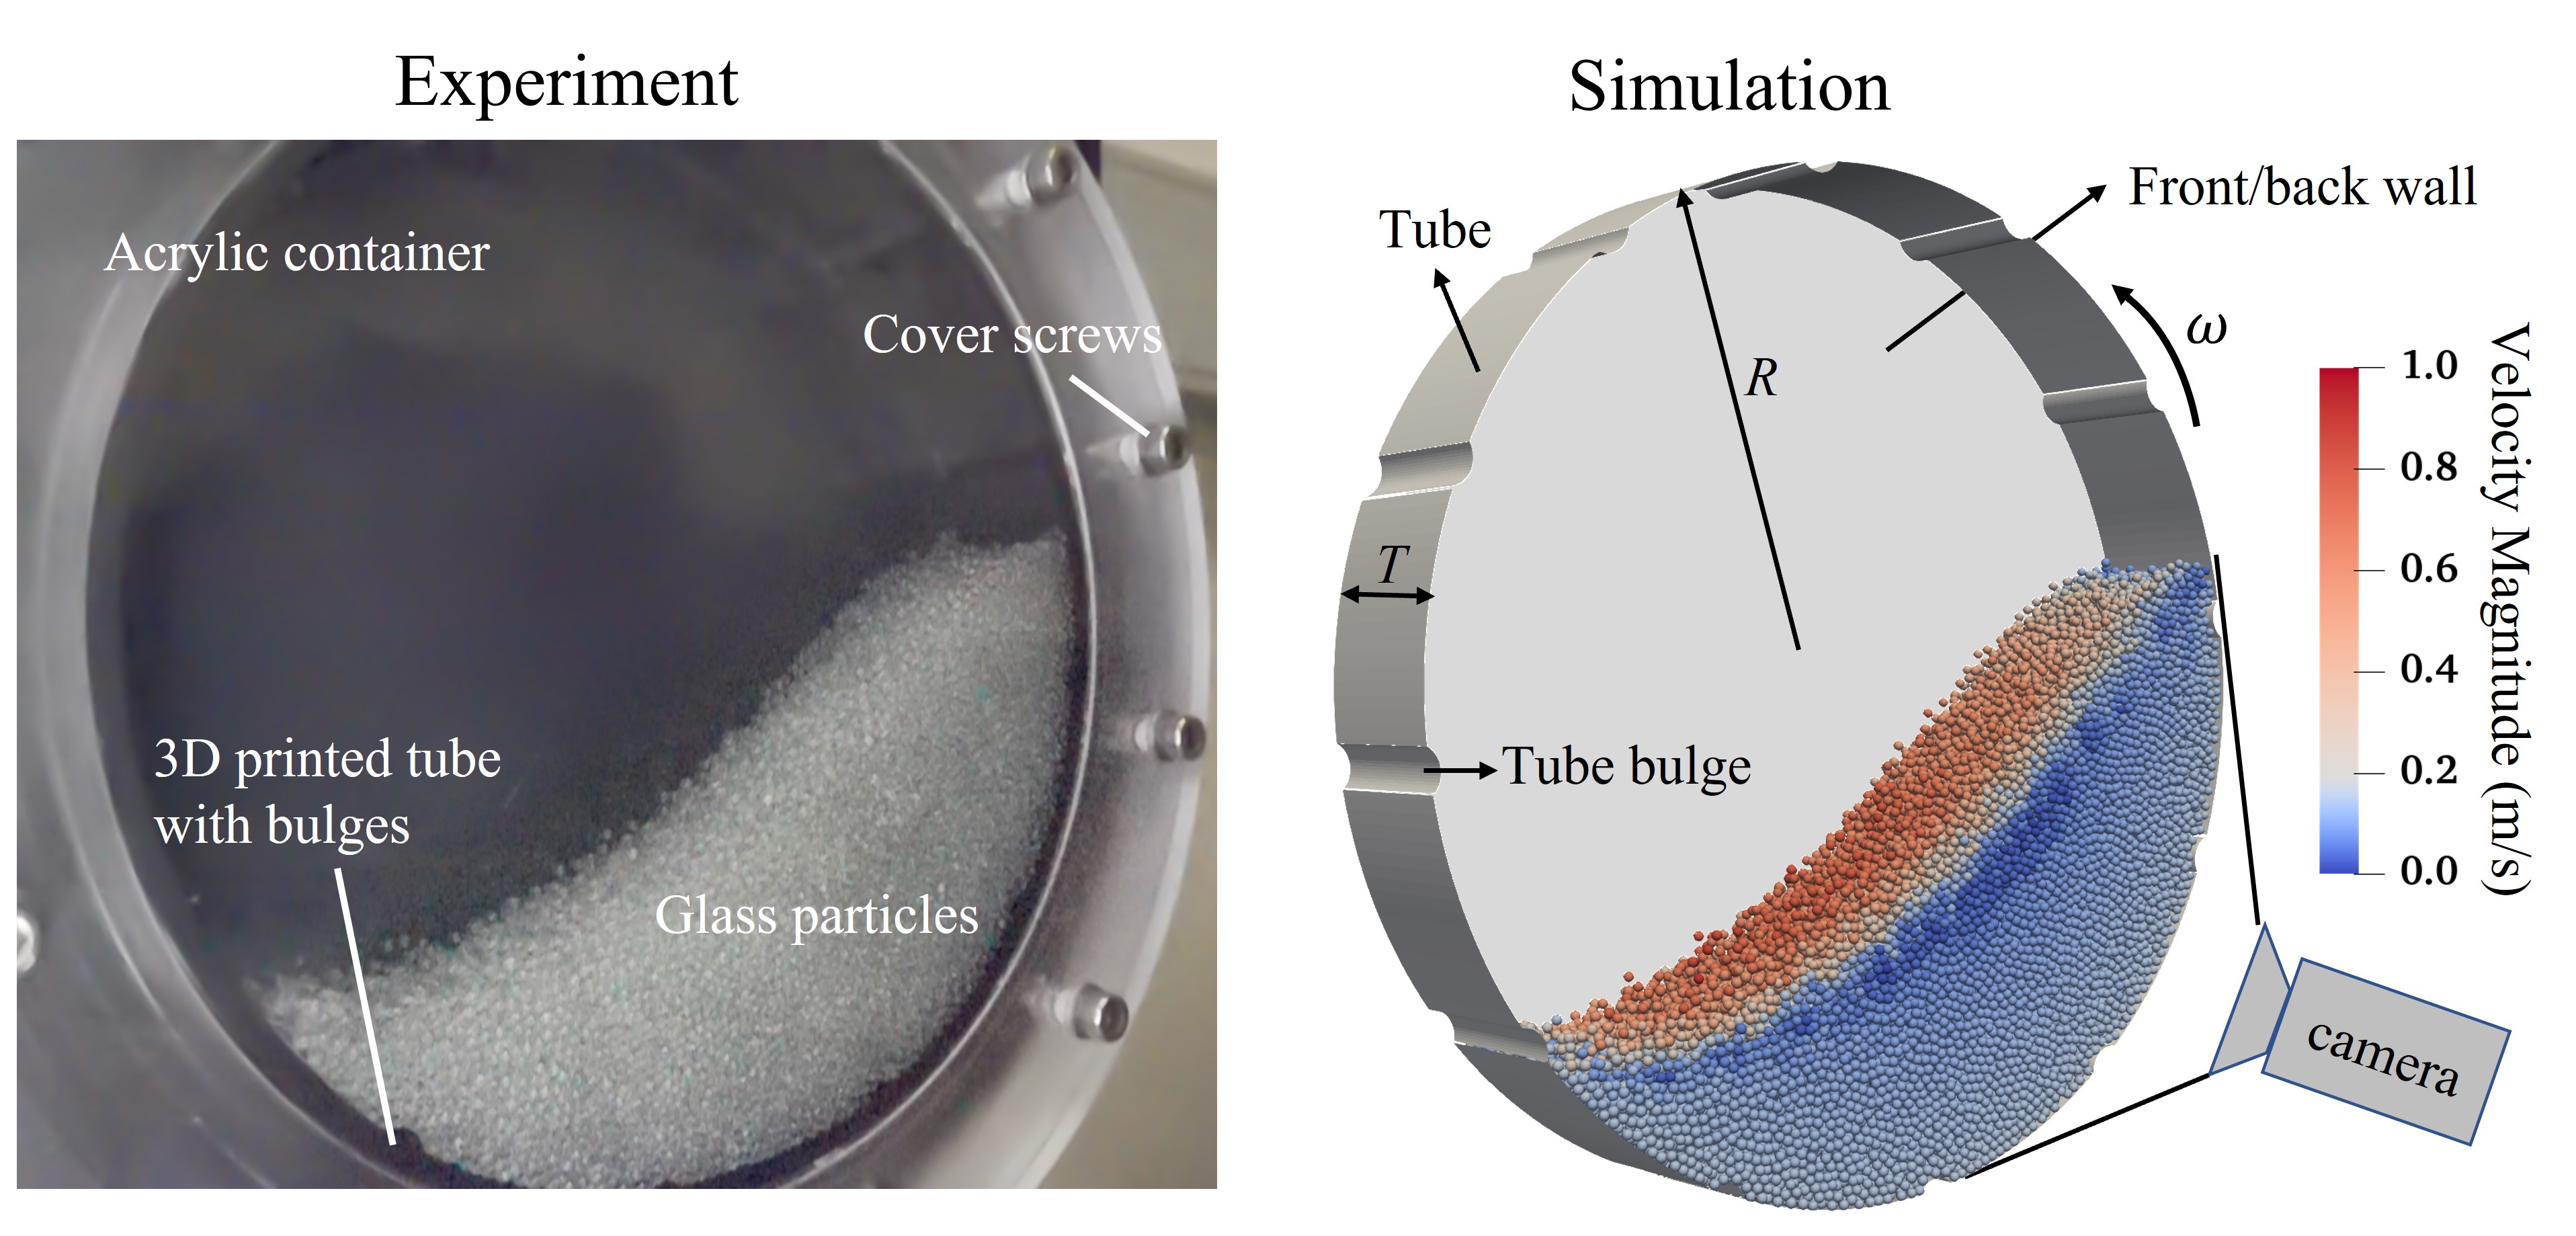
A photograph of the experimental apparatus is shown in Fig. 1. The sidewalls of the rotating drum are fabricated from clear acrylic. The drum body is 3D printed polylactic acid thermoplastic (density 1.24 g/cm3) using an Ultimaker3 3D printer. Twelve bulges are spaced evenly around the drum to prevent slip between particles and the drum. The bulges are cylindrical with diameter which ensures that their effect on the flow behaviour in bulk regions is negligible Sunkara et al. (2013); Zhang et al. (2018). The system is made watertight with a sealing strip between the drum and the sidewalls. Two non-stick and transparent FEP fluoropolymer films (with low surface energy leading to a contact angle of around ) are attached to the sidewalls to prevent wet particles from sticking to them. Glass beads with average radius are used. A high-speed camera shooting at a frame rate of with 19201080 pixels is used to capture the granular flow through the transparent sidewalls. A LED ring light directed at the drum is set to provide enough light for the camera, and a blackboard is attached to the back of the drum to act as a homogeneous contrasting background. At this zoom level, each particle is approximately pixels, which ensures precision of the experimental results.
The filling level of the drum is expressed as , where a total of 376.6 g of glass beads in the experiment is used. We study here low volumetric water content conditions, i.e. , where is the volume of liquid and is the volume of solids. In this state, the liquid exists mainly in the form of liquid bridges in the granular materials, which creates attractive inter-particle (capillary) forces and consequently impacts the behaviour of the granular medium Feng and Yu (1998); Scheel et al. (2008); Wang, Pereira, and Gan (2021). In this study, we consider the capillary force supplied by the liquid bridge as the primary source of this cohesion effect, which is the case for particles of size greater than ~100 µm where van der Waals force can be neglected Mutsers and Rietema (1977); Feng and Yu (1998). In the experiment, 3.1 mL of distilled water is added to make ~2% volumetric water content in the experiment to ensure a pendular state.
II.2 Discrete Element Method (DEM)
The Discrete Element Method (DEM) has been proven to be effective in investigating granular phenomena with abundant detail Cundall and Strack (1979); Walton (1993); Luding (2005); Gan and Kamlah (2010); gdrmidi@ polytech. univ-mrs. fr http://www. lmgc. univ-montp2. fr/MIDI/ (2004). Here, we use the open-source platform LIGGGHTS to simulate the granular system Kloss et al. (2012). The particle movement in DEM is described by the computation of Newton’s second law. The normal, tangential, and rolling inter-particle contact laws are respectively described as Brilliantov et al. (1996); Iwashita and Oda (1998); Ai et al. (2011):
| (4) | ||||
| (5) | ||||
| (6) |
where , , and represent the normal, tangential, and rolling directions, the superscript "Hertz" represents the Hertzian contact, the contact force, the contact stiffness, the rolling torque, the overlap distance between contacting particles, the relative rotation angle of contacting particles, the coefficient of damping, and and , respectively, denote the relative translational velocity and relative angular velocity for contacting neighbours. Here, is expressed as the nonlinear Heartzian law by , where is the Young’s modulus, the effective radius of contacting neighbours. The tangential friction force and rolling torque, and , are capped to satisfy a Coulomb style criteria defined by and where is the coefficient of sliding friction and is the coefficient of rolling friction Iwashita and Oda (1998). Notice that for glass beads can vary from 0.2 to 0.65 Parteli et al. (2014); Yang, Zou, and Yu (2000); Fuchs et al. (2014); Tang et al. (2019); Bhateja et al. (2016), we select in this study, a common value adopted in the literature Parteli et al. (2014); Yang, Zou, and Yu (2000). A value of is selected as the coefficient of restitution which is the same as the previous study by Bhateja et al. (2016). Computational stability Gan and Kamlah (2010); Cundall and Strack (1979) is guaranteed by checking the time step , where denotes the mass of the smallest particle, denotes the diameter of the smallest particles, and particle size in this study is set uniformly distributed as 2 . Table 1 lists key parameters adopted in this study.
The constitutive model of capillary force proposed by Soulie et al. (2006) is described by
| (7) |
where is the normal capillary force, and are the radius of two neighbouring particles linked by a liquid bridge with indicating the larger one, is the distance between the surfaces of each pair of neighbouring particles, , and are coefficients deduced from the liquid bridge volume (), and Soulie et al. (2006). Here, the liquid film is assumedWillett et al. (2000) to fully cover the surface of particles, which leads to . A liquid bridge can form when the surface gap distance reaches , which takes the liquid film thickness into consideration. The liquid bridge rupture distance is adopted, beyond which the liquid bridge breaks and no longer exists Lian, Thornton, and Adams (1993). Based on the assumption , the liquid volume on each particle is set as , where denotes the volume of the particle . The liquid bridge volume is calculated as , where the coefficient 0.05 ensures liquid volume conservation when contacting neighbours of each particle may reach twelve (face-centred-cubic topological structure), meaning a maximum of of the effective volumetric liquid content of one particle () forms liquid bridges. Note, the liquid weight plays a negligible role in the dynamics of particles since the mass ratio between liquid and particles is . The particle-wall contact force is assumed to be the same as the particle-particle contact, with the wall side possessing an infinite radius to mimic a plate Taberlet, Richard, and Hinch (2006); Jaggannagari et al. (2021). A detailed illustration and analysis of the formation and rupture of the liquid bridges under different surface tensions can be found in our previous workDong, Wang, and Gan (2022).
| Parameter | Value |
| Young’s modulus, (Pa) | 6 |
| Coefficient of sliding friction, (-) | 0.5 |
| Coefficient of rolling friction, (-) | 0.001 |
| Coefficient of restitution (-) | 0.9 |
| Surface tension, (N/m) | 0 - 0.146 |
| Contact angle, (∘) | 0 |
| Gravitational acceleration, (m/s2) | 9.81 |
| Liquid dynamic viscosity, (Pas) | |
| Particle diameter, (mm) | 2 |
| Particle density, (kg/m3) | 2460 |
| Drum radius / depth, R / T (-) | 48 / 15 |
| Volumetric liquid content, (-) |
III Results and discussion
In this section, we first present the result of macro-scale phenomena, i.e., mode transition and dynamic angle of repose, in a parametric study by varying and . Through this process, the simulation is validated. After that, characterisation indices of the meso-scale phenomena (flow depth) and the micro-scale phenomena (the size distribution of cohesion-induced clusters) are extracted. We propose a new dimensionless number to gain insight from these characteristic indices to discuss how cohesion affects the granular flow regime in the rotating drum.
III.1 Flow mode and dynamic angle of repose
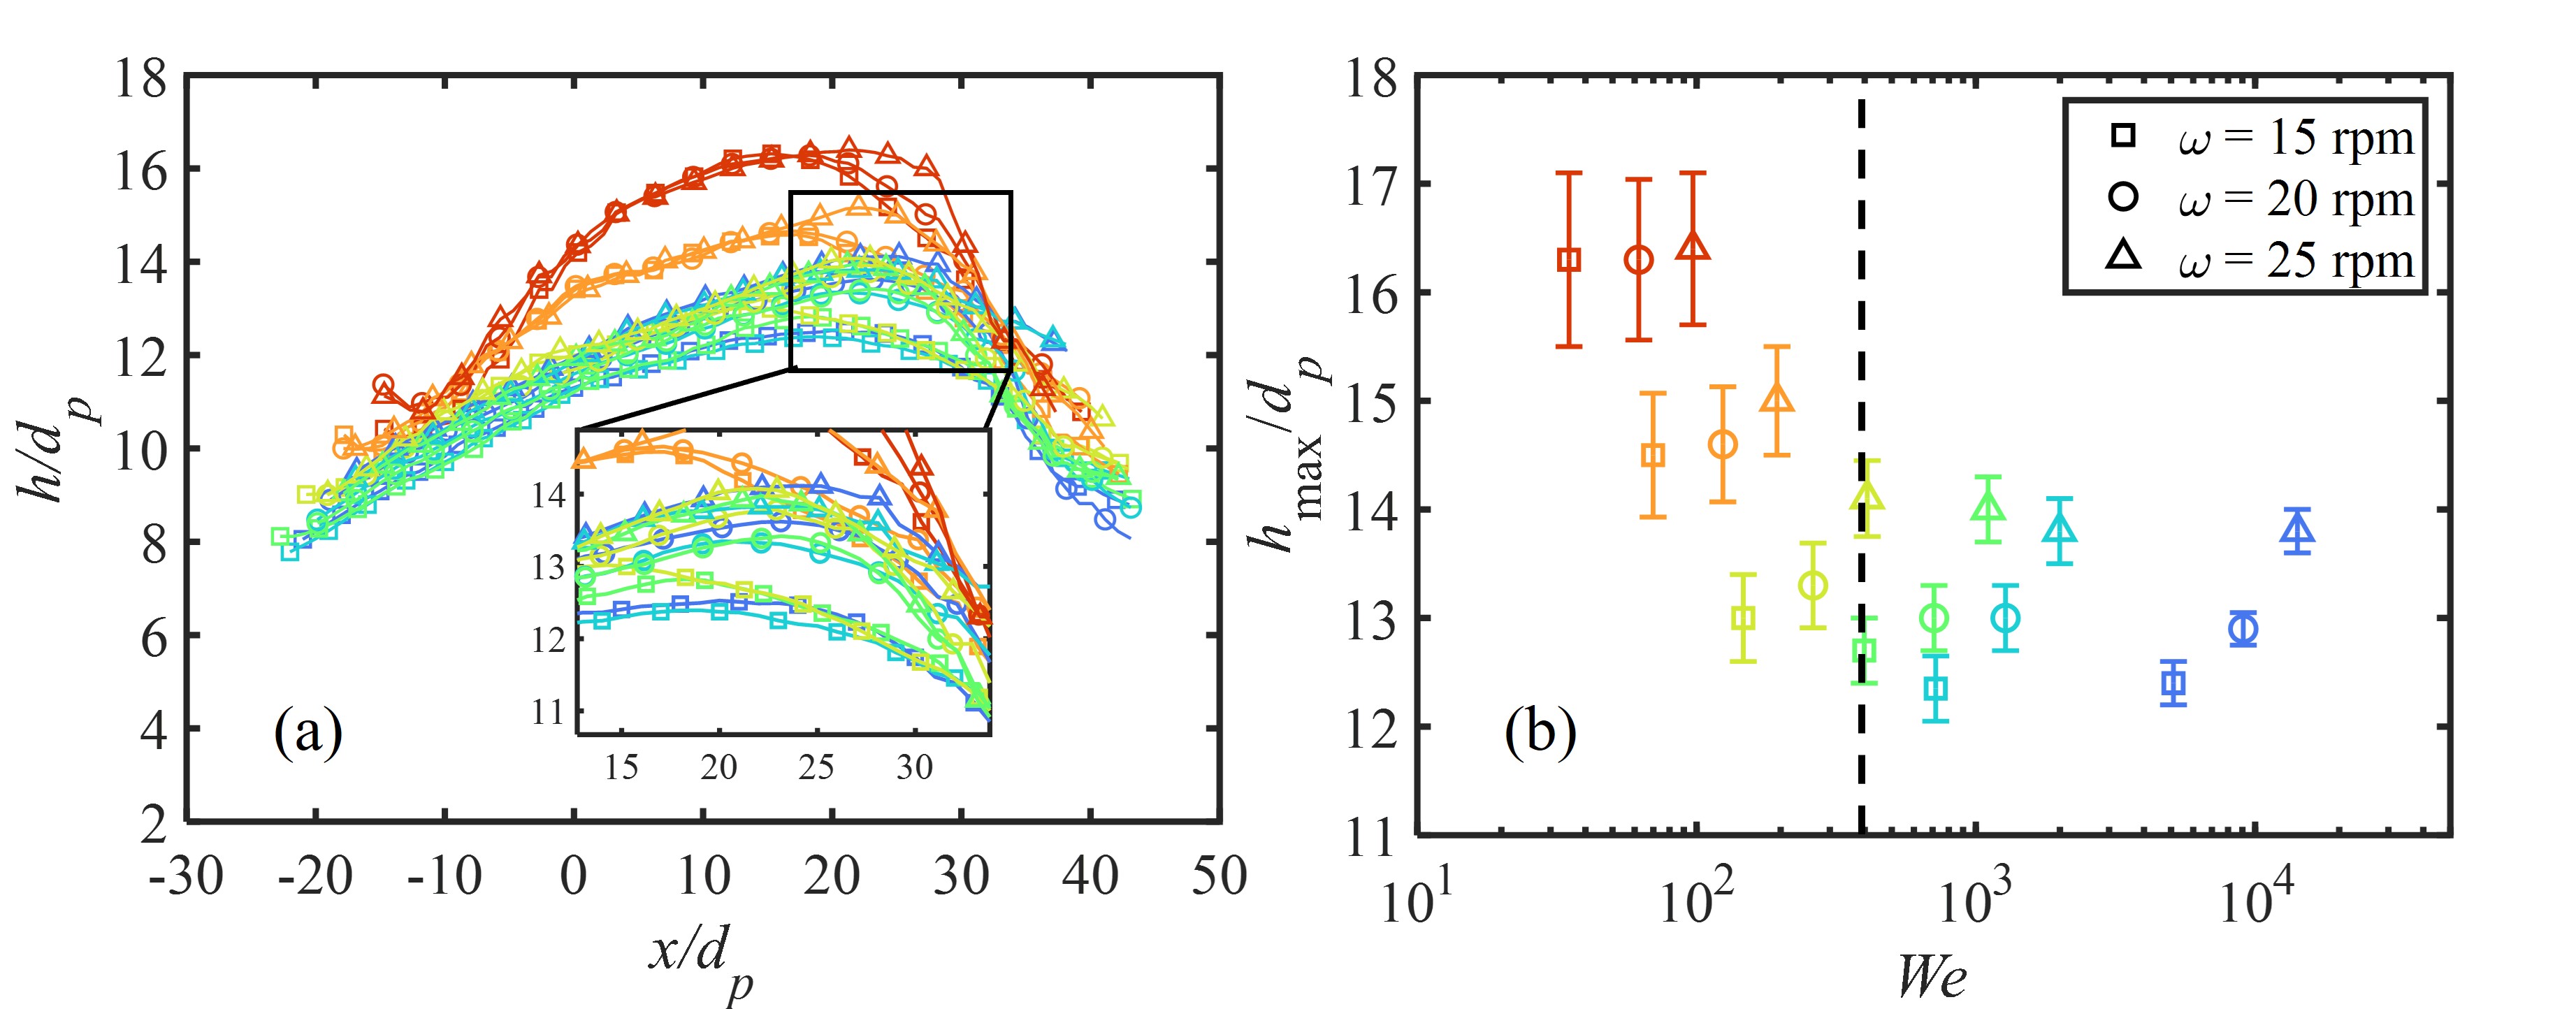
We investigate the flow regime during the mode transition between rolling and cascading. Note the transition is evaluated through visual observation results Norouzi, Zarghami, and Mostoufi (2015); He et al. (2019), and the curvature is not quantitatively examined. Both cohesionless (dry) and cohesive (wet) conditions under rotating speed = 15, 20 and 25 rpm are used to validate the simulation against the experiment. As shown in Fig. 2 (a), comparing each of the cohesionless and cohesive cases indicates that the addition of cohesion results in a less curved slope (Cyan dashed lines) with respect to the cohesionless cases (Cyan solid lines). This shows that as increases, the cohesive case presents a delayed transition from rolling to cascading. That is, one needs a relatively higher to enable a rolling-cascading transition for cohesive particles than that for dry particles. An uplifted slope toe of the cohesionless condition can be used to distinguish it from the cohesive case, which is highlighted by red circles in Fig. 2 (a). A further increase of cohesion can lead to a flattened profile which was observed in previous studies Liu, Yang, and Yu (2011); Jarray, Magnanimo, and Luding (2019); Jaggannagari et al. (2021) and will also be presented in Section III.2.
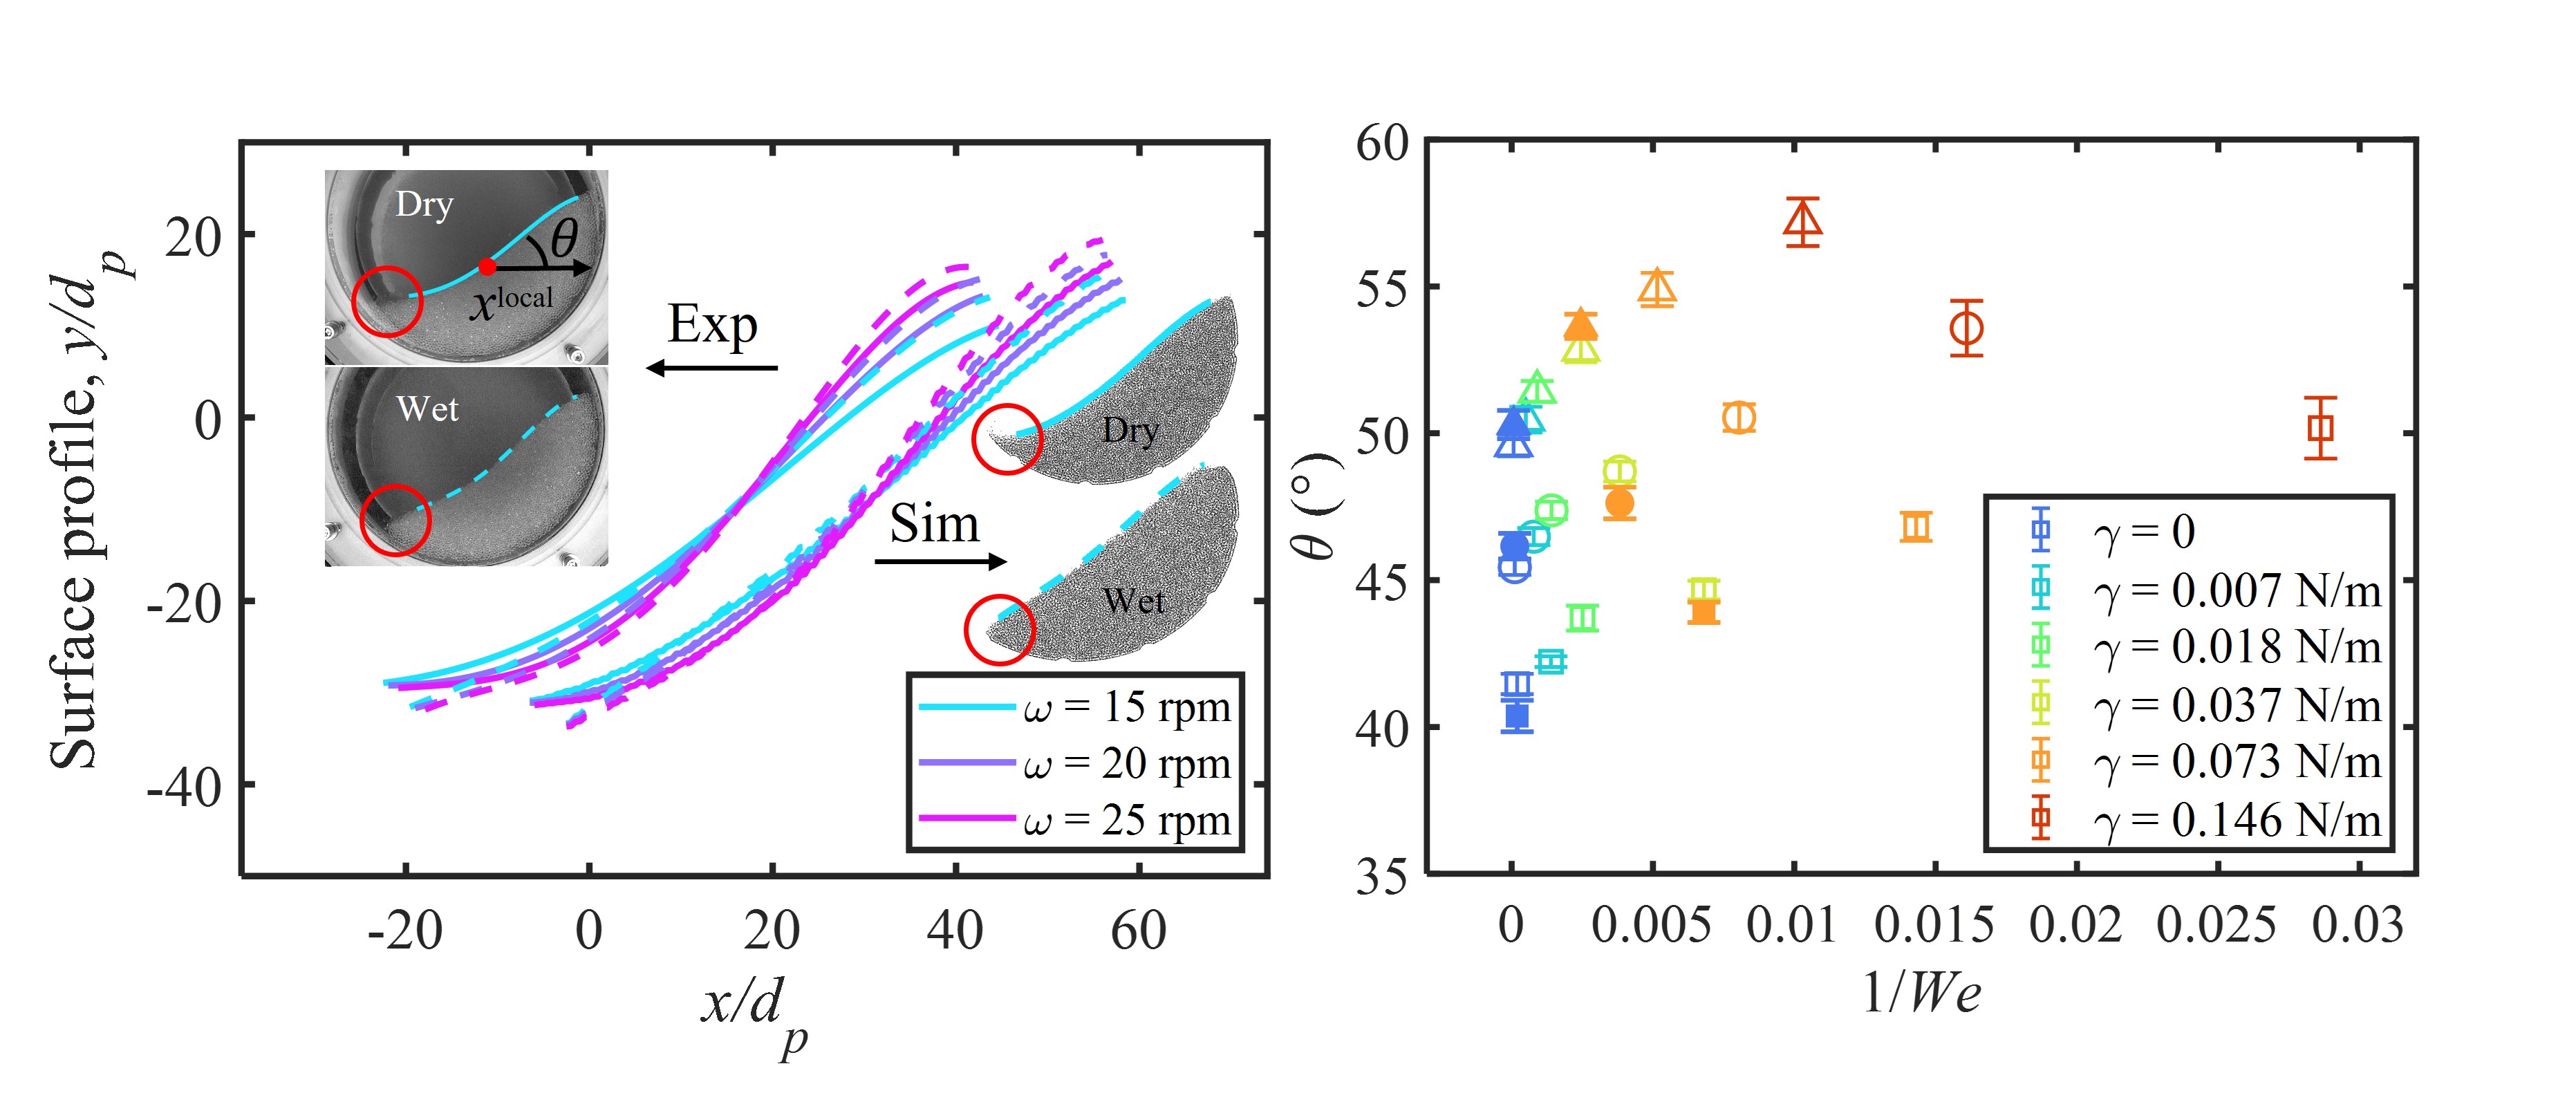
To quantitatively capture the differences in surface profiles under different cohesion and rotation rate, the dynamic angle of repose () is extracted. As illustrated in the top left inset of Fig. 2 (a), a coordinate can be constructed taking the red dot as the origin located on the surface with the axis points towards the right, and an angle between the slope and can be obtained. When the red dot moves along the slope from the toe to the top, a variation of can be found. Here, Unless stated otherwise, a maximum value of , representing the steepest point for the free surface slope, is defined as the dynamic angle of repose Rajchenbach (1990); Jarray, Magnanimo, and Luding (2019); Chen and Yan (2021). Note the definition of is the same in both experiments and simulations. The is plotted against the inverse of in Fig. 2 (b), and the is assumed in the experiment based on previous studies Klise et al. (2016); Wang, Pereira, and Gan (2021). The relation between and the inverse of shows a sharp increase at low cohesion cases followed by a near plateau at high cohesion, which is consistent with previous work Jarray, Magnanimo, and Luding (2019). Moreover, in Fig. 2 (b), we can see that either an increase in cohesion or rotation rate can lead to a higher .
To measure the impact of the cohesion and the rotation rate on , we discuss the influencing factor separately. Nowak et al. (2005) examined low rotation rate in the slumping mode with intermittent avalanches, where gravity and cohesion dominate the granular flow. Under these conditions, the maximum static angle of repose could be correlated to the cohesion strength through force balance, leading to the relationship Nowak et al. (2005):
| (8) |
where is the maximum static angle of repose which is not affected by the rotating speed, the minimum static angle of repose that can balance particles weight on a slope, the solid packing fraction, a constant coefficient, the particle radius, and a constant representing a characteristic system size. This equation describes a linear relationship between the maximum static angle of repose with surface tension under a cohesion-dominant condition. Given the definition of Bond number in Eq. (2), Eq. (8) can be further simplified to
| (9) |
implying a linear relationship between the increase in the static angle of repose and .
At higher relative rotation rates, when inertial effects become dominant, it has been observed that the flow becomes continuous and the can be adopted to evaluate the dynamic angle of reposeJarray, Magnanimo, and Luding (2019), which can be expressed as
| (10) |
where is a fitting parameter Jarray, Magnanimo, and Luding (2019). Here, Eq. (10) also indicates a linear relationship between the increase in the angle of repose and .
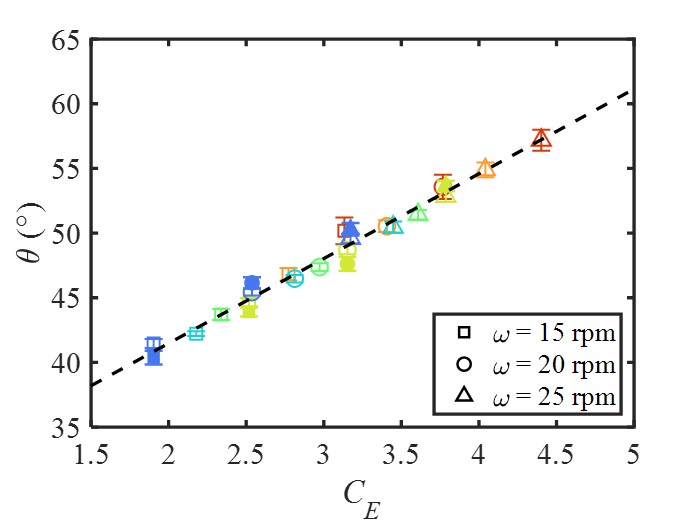
To attempt to take both the cohesion and inertial effects into account, based on Eqs. (8) and (10), we define a new non-dimensional parameter , where stands for "Combination" and "Energy Effect", is a constant independent of , , and . Using this definition, we obtain a new expression for the dynamic angle of repose for cohesive granular materials in the granular drum
| (11) |
Fig. 3 shows a collapse of of all our experimental and numerical results under different rotation rate and surface tensions, demonstrating the validity of the proposed dimensionless parameter in describing the granular flow. The optimal is fitted in Eq. 11 using linear regression to be 12 with a goodness of fit .
III.2 Flow depth
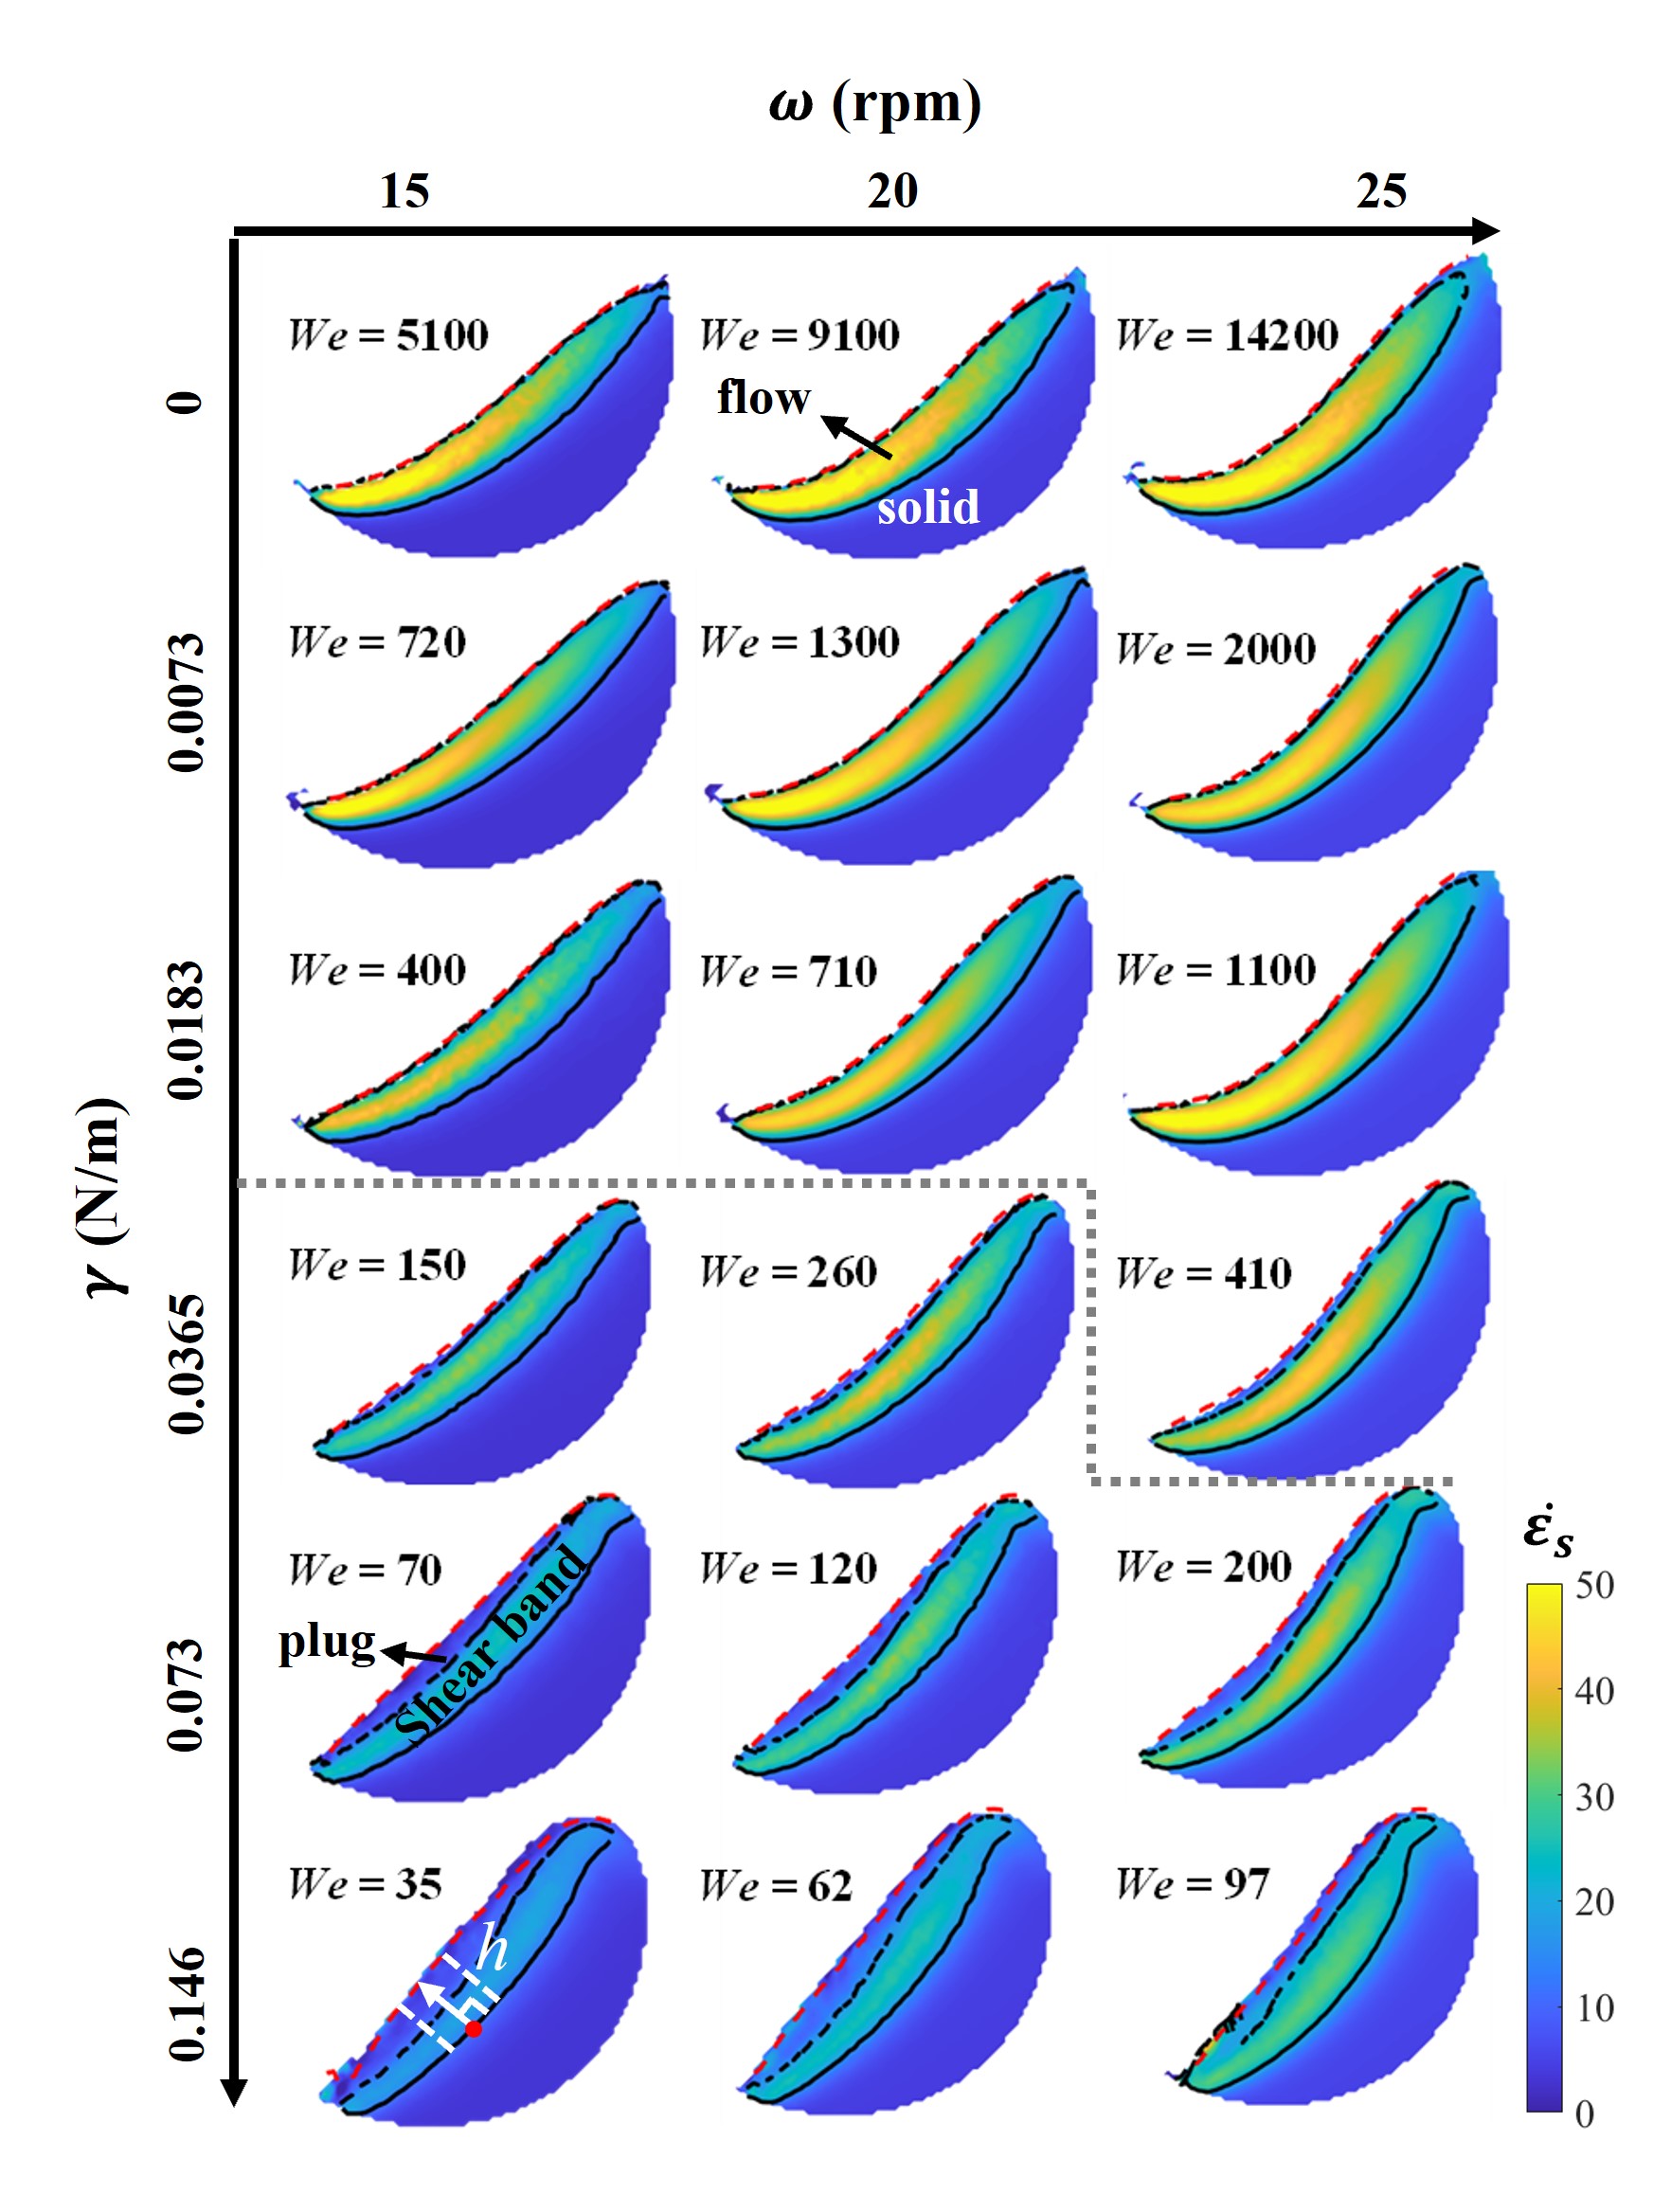
Underneath the surface, the particle assemblies can be divided into flow and solid regions based on the index that depicts the local flow (deformation) with respect to time, i.e., shear strain rate . Here is expressed as , where and are time-series averaged local velocities (mapped in mesh grids with a size 2) along the and axes, and is the differential operator. The shear strain rate for varying cohesion and rotation rate are shown as a phase diagram in Fig. 4. A critical value = 10 is applied to indicate the flow-solid interface, which is shown as black solid lines in the rendering of all cases in Fig. 4.
Within the flow region, a relatively high area in the lower part of the slope can be observed when cohesion is not dominant. As a comparison, a relatively high cohesion tends to split the flow region into a plug zone overlying a shear band Tegzes et al. (2002); Rognon et al. (2008); Mandal, Nicolas, and Pouliquen (2020) (Fig. 4, = 70). The variation of flow region can be attributed to the transition from a collisional regime to a visco-plastic regime due to the increase of cohesion. Within the collisional regime, particles possess relatively high velocities while moving downwards since little energy can be dissipated through collisions. Additionally, the flow region is eroded by the solid region because particles near the flow-solid interface are trapped in the solid region, which narrows the flow region near the toe. The combination of relatively high velocity and narrowed flow region leads to a higher temporal deformation, i.e., high , near the toe of slopes. In contrast, for the visco-plastic regime, relatively lower either in the plug zone or the localized shear band show that the temporal deformation of particles is constrained by the cohesion due to the stronger energy dissipation.
A flow depth can be extracted as the distance from the flow surface (red dashed lines) to the interface (solid lines) as illustrated in Fig. 4, case = 35. The flow depth () is plotted along the axis shown in Fig. 5 (a). The concave shape of depicts the inhomogeneity of the flow region observed in Fig. 4, which is an intrinsic feature of rotating drums Orpe and Khakhar (2001); gdrmidi@ polytech. univ-mrs. fr http://www. lmgc. univ-montp2. fr/MIDI/ (2004). The maximum flow depth , as a meso-scale index, is plotted against in Fig. 4 (b). Greater is observed when the Weber number is small, indicating the viscoplastic regime (cohesion-dominated regime), and it is insensitive to inertial effects, i.e., remains similar and has little effect. As increases, the flow then gradually enters the collisional regime (inertia-dominated regime), where becomes less relevant to the cohesion force.
Previously we have shown that the dimensionless number proposed in Section III.1 captures the interplay effect between gravity, cohesion, and inertia, and it is effective in describing the dynamic angle of repose. Here, we plot against in Fig. 6. It can be seen that for different rotation rate, as cohesion increases, in all cases experience a mild rise as increases before a sharp climb. The threshold of Weber number discussed previously again shows good prediction in the regime transition (black stars in Fig. 6).
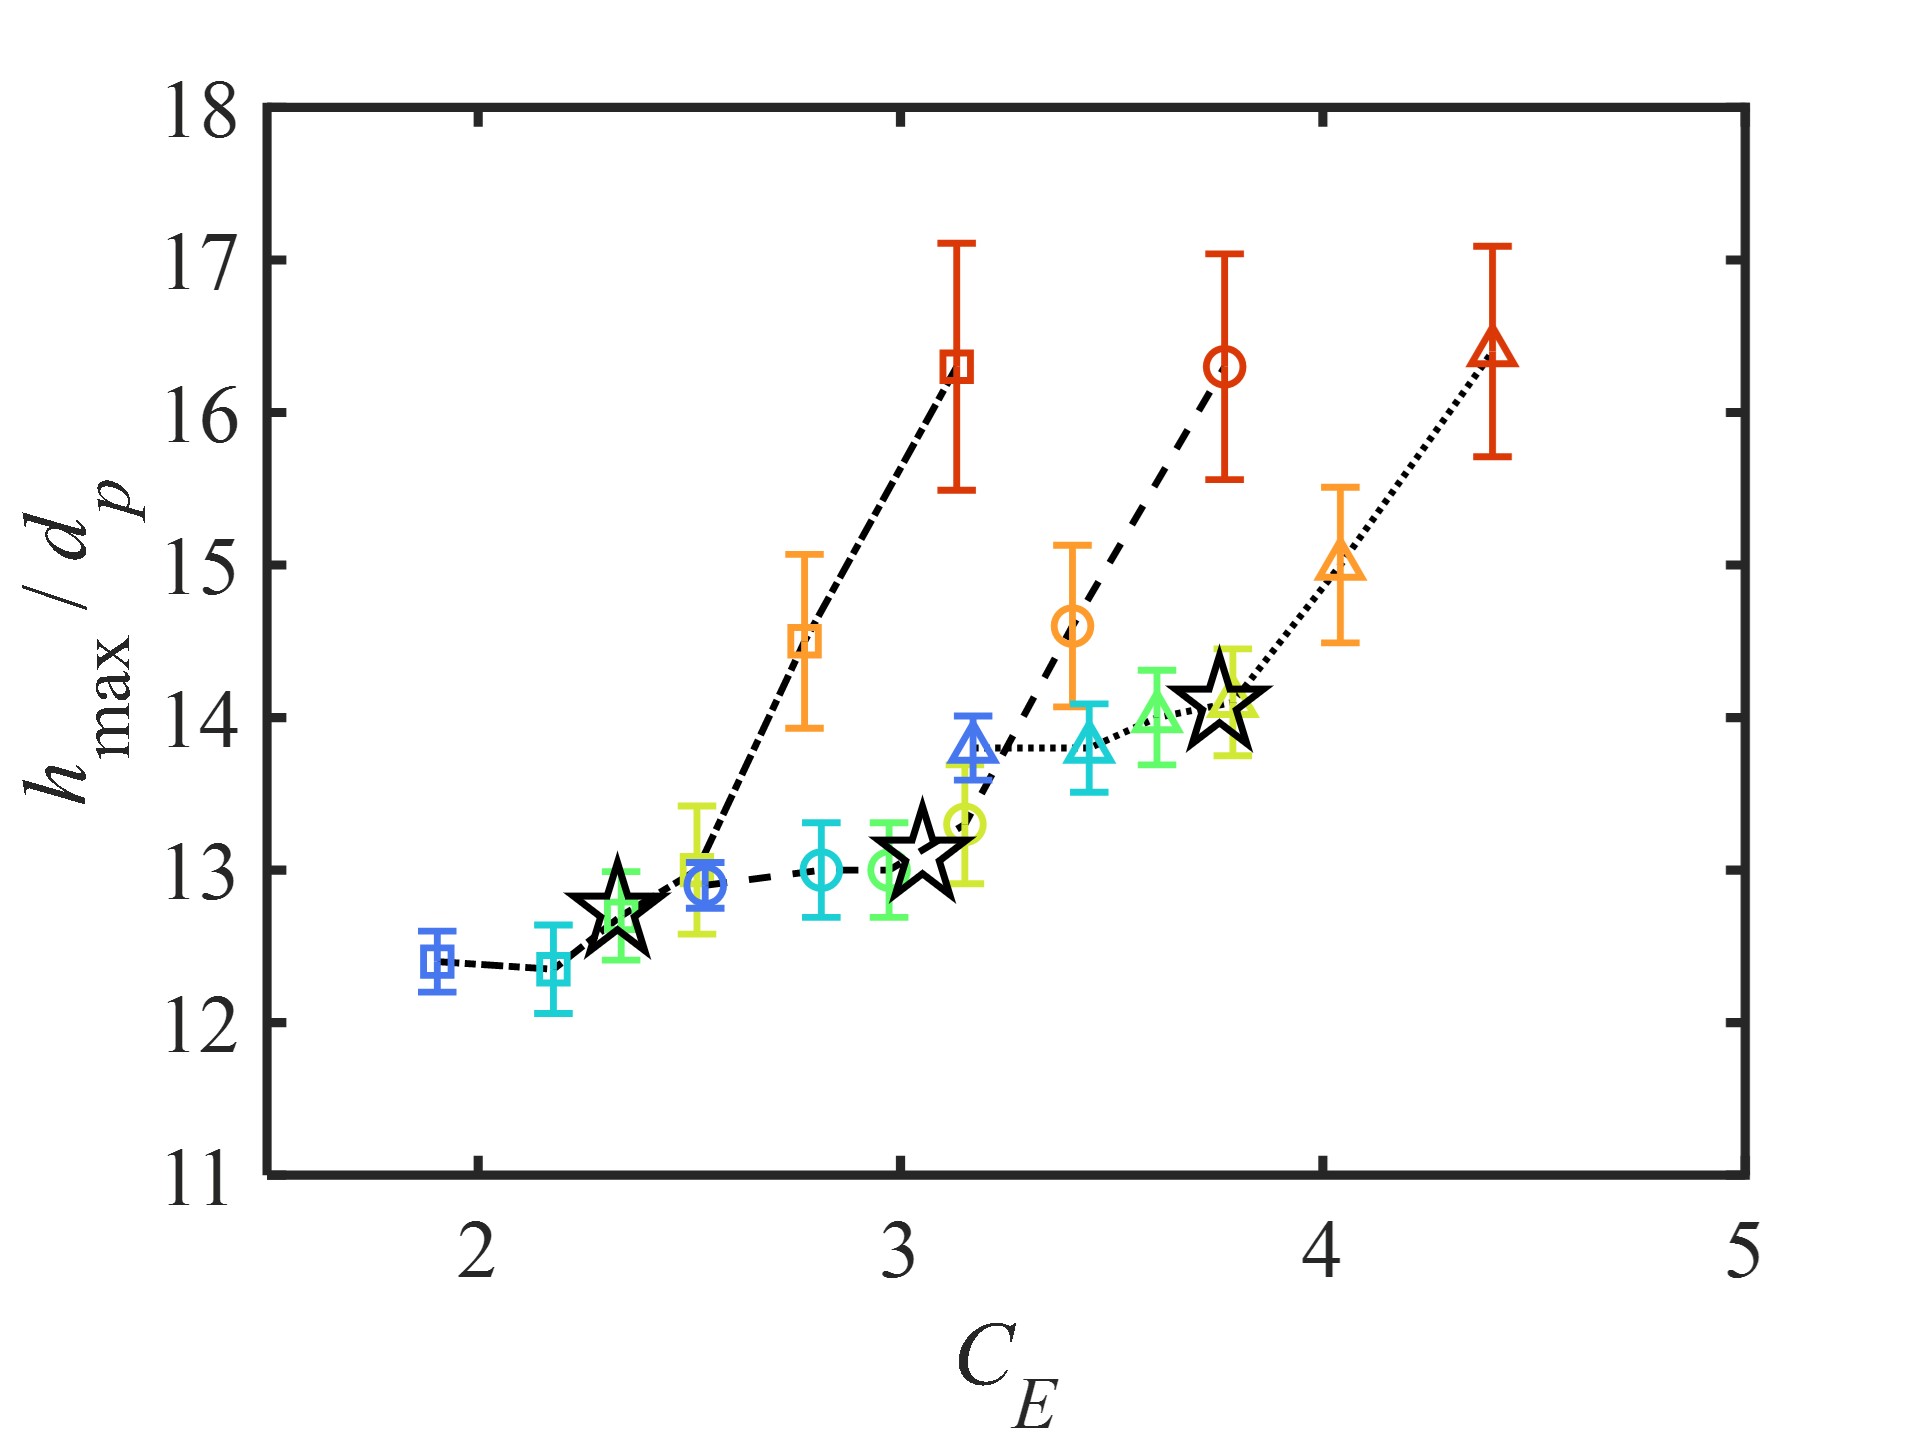
To understand the combined effects on described by , again, we discuss gravity, inertia and cohesion effects separately. Since the increased capillary force increases the cohesion, the solid region can possess higher strength and reach a higher peak, meaning higher gravitational potential is accumulated. Thus, when the solid region is sheared to fail and flow down, more energy needs to be dissipated compared to less cohesive cases. In Fig. 4, flow region with smaller due to the dominance of capillary force implies a less intensive deformation, meaning the increased inter-particle bonds can enhance energy dissipation in the flow region Kovalcinova et al. (2018). Therefore, is effective in describing the role that cohesion plays in increasing the potential energy (through maintaining the solid structure) in the solid regionTegzes et al. (2002) and a competing role in enhancing the energy dissipation in the flow region. In summary, a flow regime transition can be captured using the new proposed dimensionless number . The flow regime transition, i.e., from collision to the viscoplastic regime, is consistent with the flow mode transition, i.e., from cascading to rolling mode, when cohesion increases.
III.3 Cluster formation
The discrete nature of granular flow makes it complex and challenging to characterise Andreotti, Forterre, and Pouliquen (2013); Murray et al. (2012). Clusters can form in granular flows, which can make the energy dissipation in the flow region more complex Rognon et al. (2008); Cao et al. (2018). Here, we first introduce our cluster formation criteria modified based on previous research, followed by discussions on cluster spatial information, cluster size distribution and the relationship with flow mechanisms.
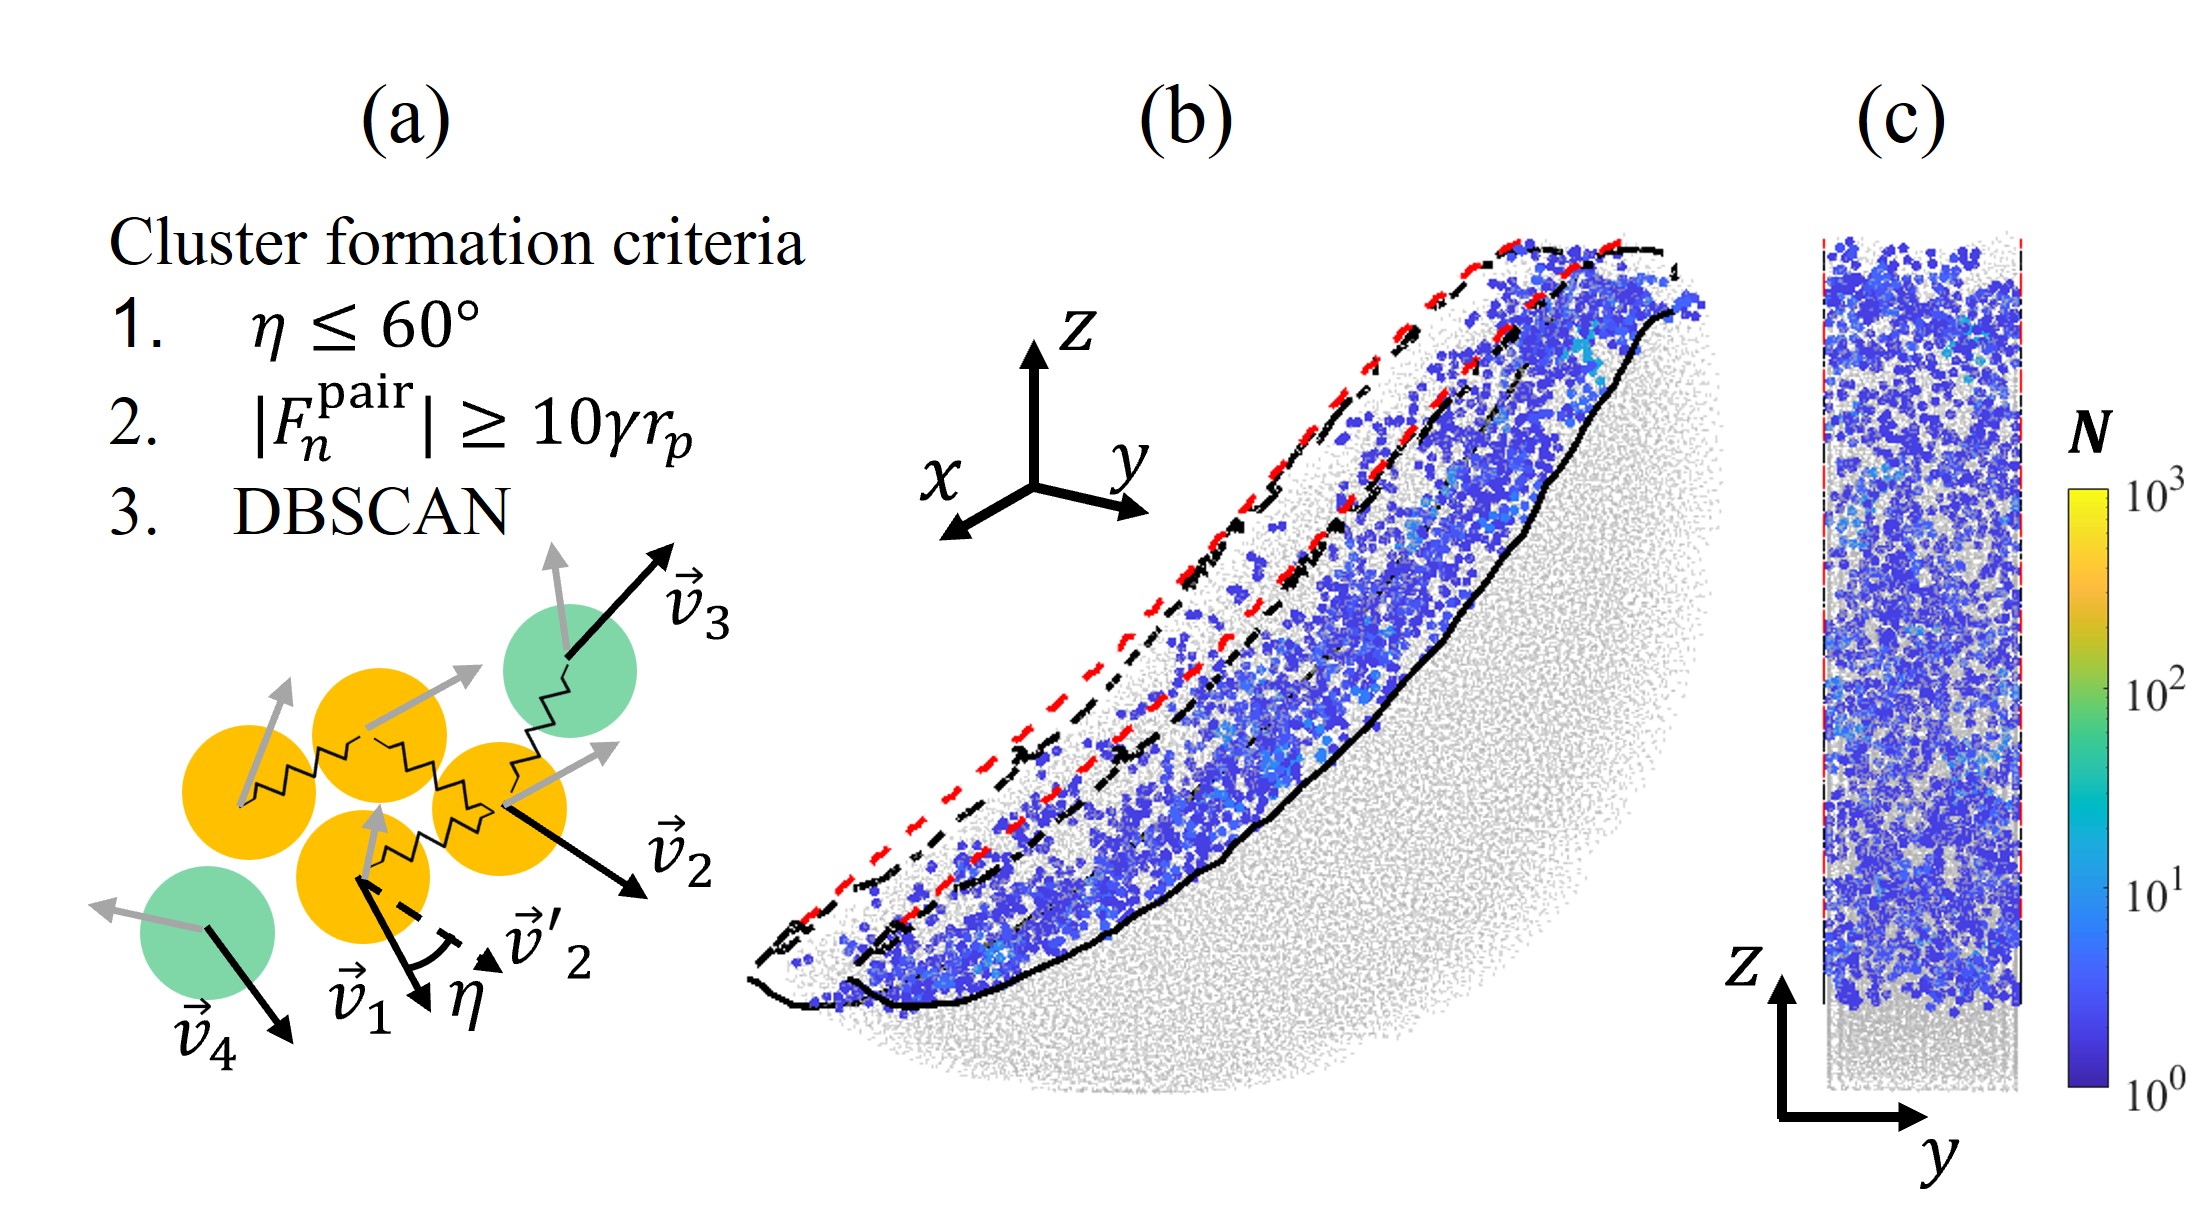
Based on the concept of velocity fluctuation, inter-particle contact and inter-particle displacement, several methods have been used to characterise cluster formation Bonamy et al. (2002a); Campbell (2011); Fullmer and Hrenya (2017); Zou et al. (2022). Given that cohesion is essential regarding inter-particle constraints, we adopt particle-level indices extracted from velocity fluctuation and inter-particle contact force to investigate cluster formation in the cohesive granular flow (see illustration in Fig. 7 (a)). By taking these two factors into consideration, we aim to extract particles that possess relatively higher normal interaction forces and similar moving directions, which guarantee a strong inter-particle bond and collective motion. To implement the method, normal contact forces that meet the criteria are classified as potential cluster participants. A large coefficient of can lead to most particles belonging to one cluster, while a smaller one can result in no clusters being identified. The coefficient is used to capture the variation of cluster size under different cohesion cases. To describe the spatial kinetic correlation among particles, the local velocity fluctuation is calculated for each particle as , where indicates the target particle and is the corresponding local mean velocity. The local mean velocity is averaged by taking all particles, through accumulating more than a hundred-time steps, that locate in a sampling mesh grid into consideration. An angle between each pair of and is calculated, and a critical angle is set to filter out non-correlated particlesBonamy et al. (2002b) (see Fig. 7 (a)). The DBSCAN algorithm is applied to construct clusters based on potential cluster participants screened by criteria and . The DBSCAN algorithm sequentially searches for neighbours of a target particle to form clusters until no outside-cluster neighbouring participants can be found, which can avoid relatively weak connections (single particle connection) among clusters Ester et al. (1996); Zou et al. (2022).
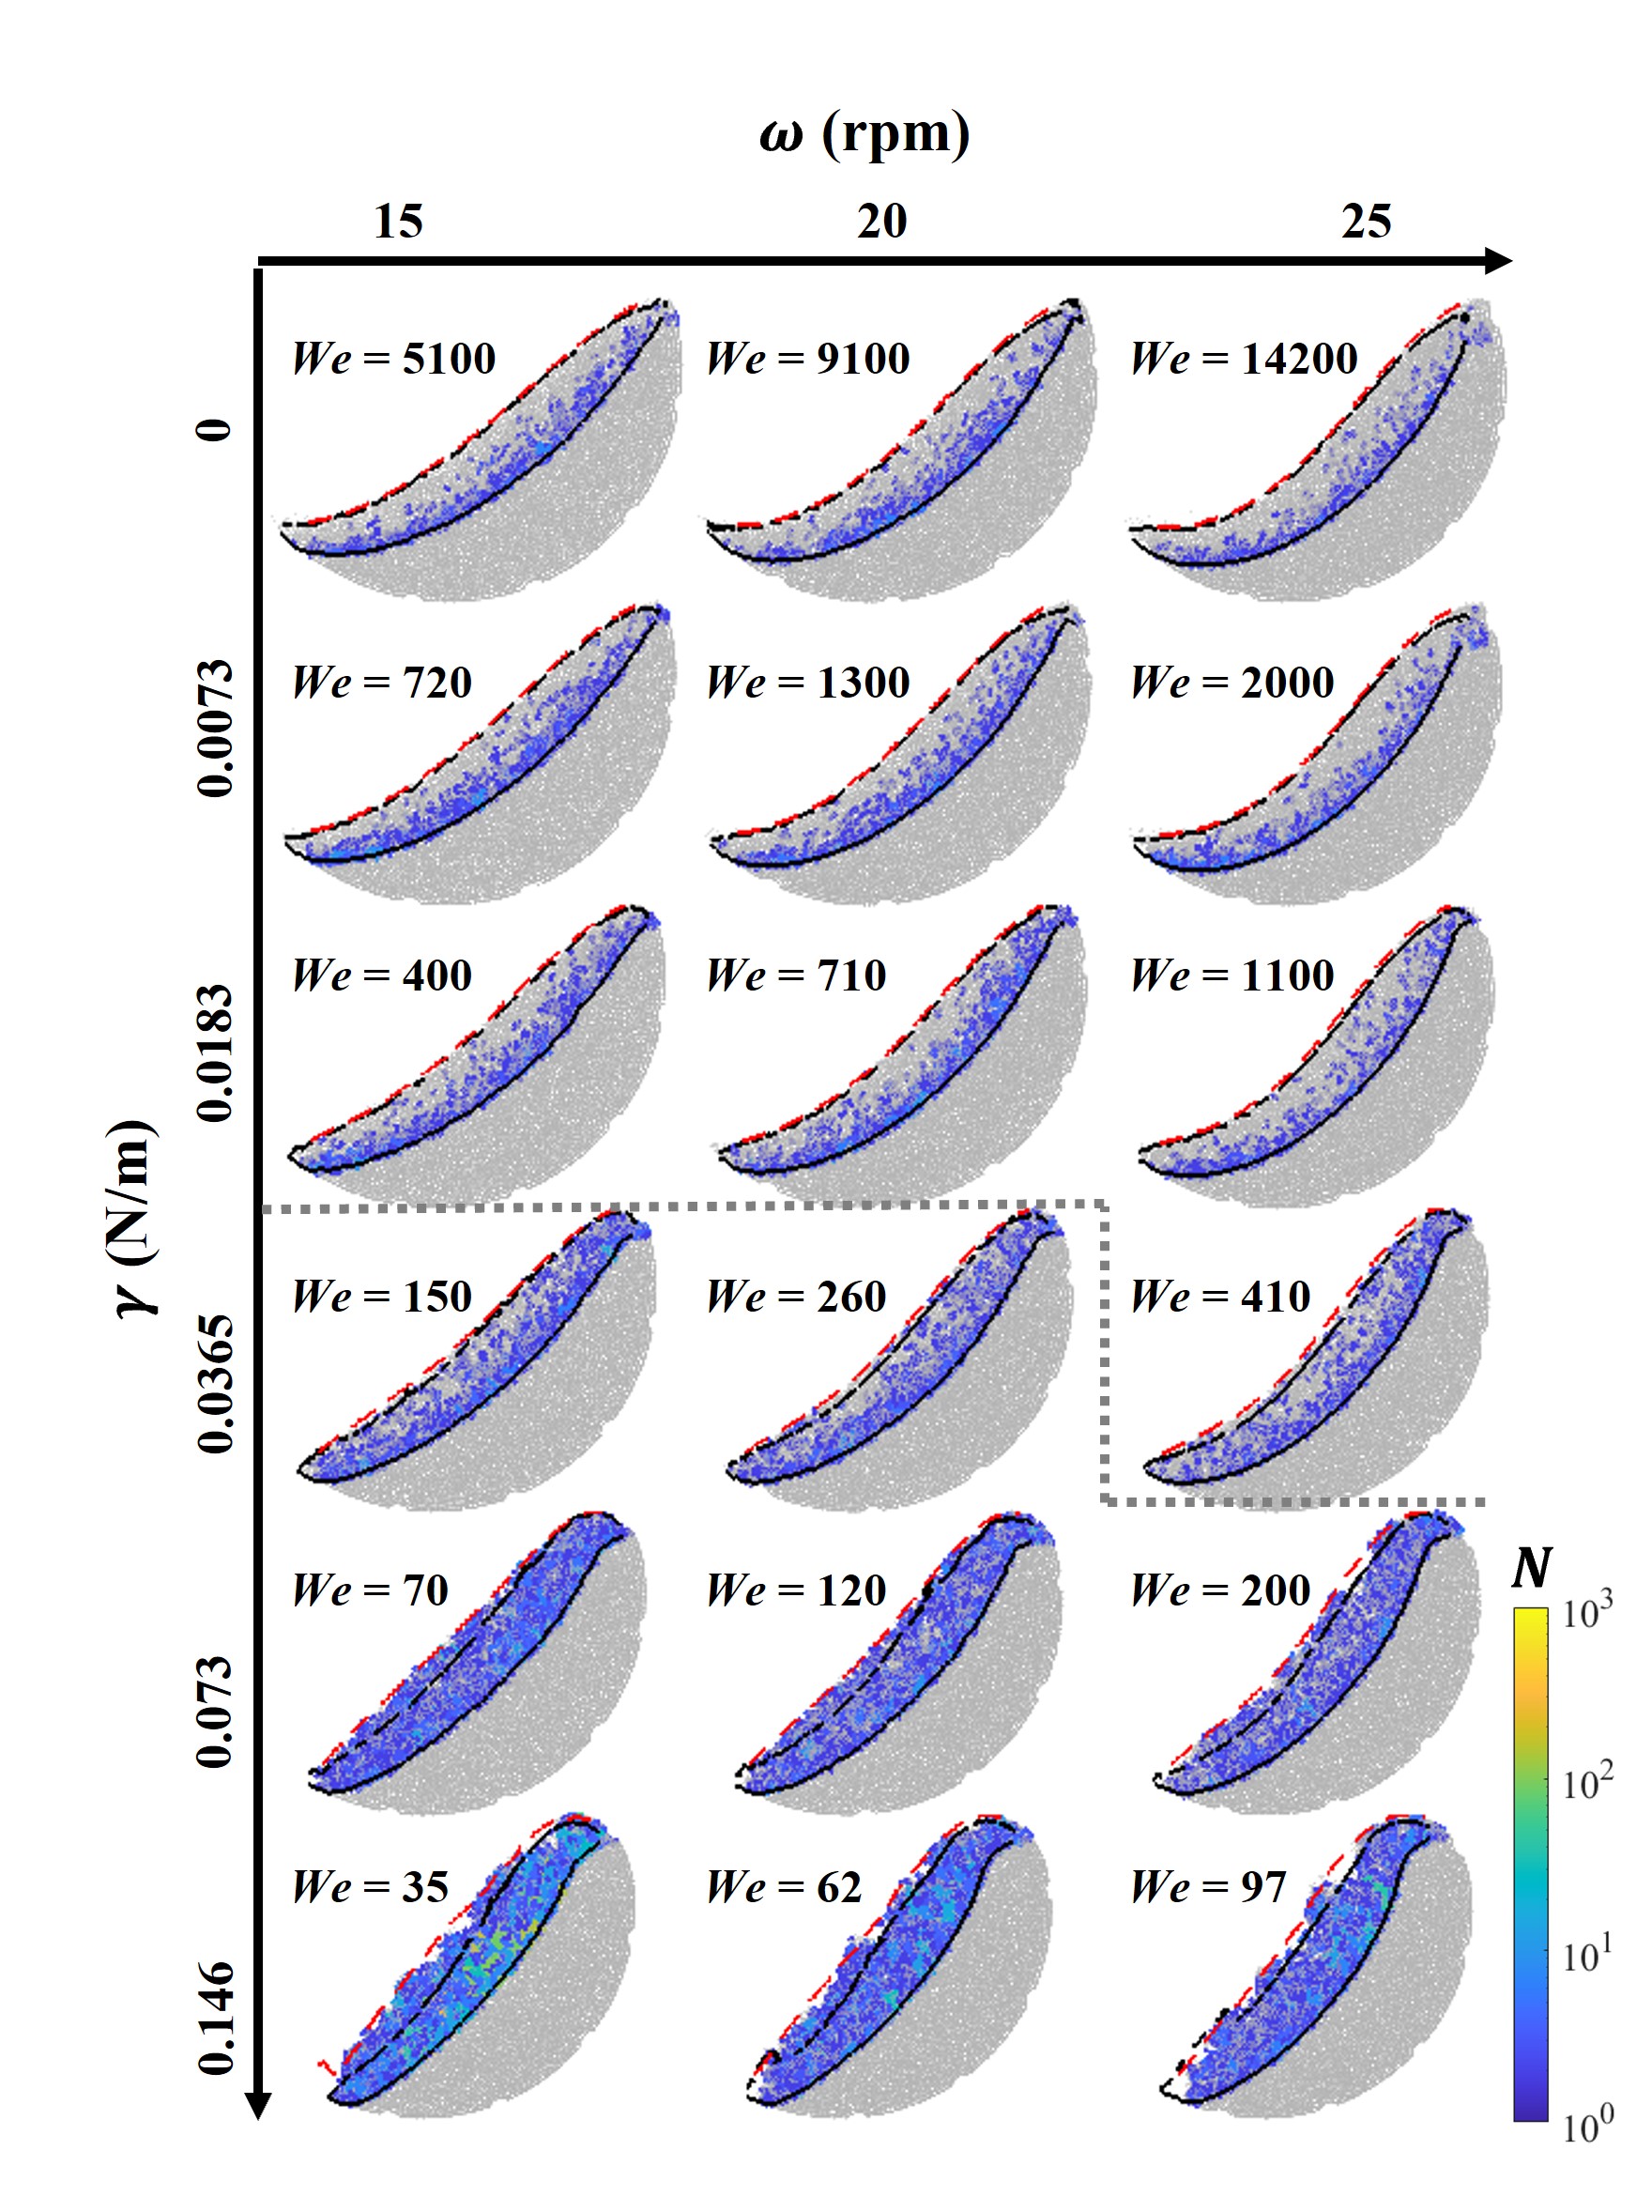
A cluster formation illustration is shown in Fig. 7 (a), where cluster particles are coloured yellow, and single particles are coloured green. A 3D view and a front view of an example where clusters forms in a simulation case ( and ) are shown in Fig. 7 (b) and (c), where clusters are formed in the flow region. The cluster formation under different cohesion and rotation rate is shown in Fig. 8, which illustrates that clusters occupy the region near the flow-solid interface in relatively fewer cohesive cases while spreading across the whole flow region in relatively strong cohesive cases. A reason for this can be that relatively weak cohesive contacts tend to develop near the surface region where no overburden pressure is applied. The weak contacts are easier to break, so clusters are rarely formed in that region. In strongly cohesive cases, it can be found that relatively large clusters appear mostly in the shear band (underneath the plug zone), which supports the view that the cluster formation in the shear band of cohesive granular materials is vital to resist shearRognon et al. (2008). The appearance of clusters near the flow surface indicates the reason for a repetitive fluctuating surface profile shown in the corresponding plots of cases in Fig. 8 and in work by Tegzes et al. (2002). Under this condition, an increase in rotation rate is found to have little effect on the cluster-occupied area and cluster sizes due to the cohesion-dominant mechanism.
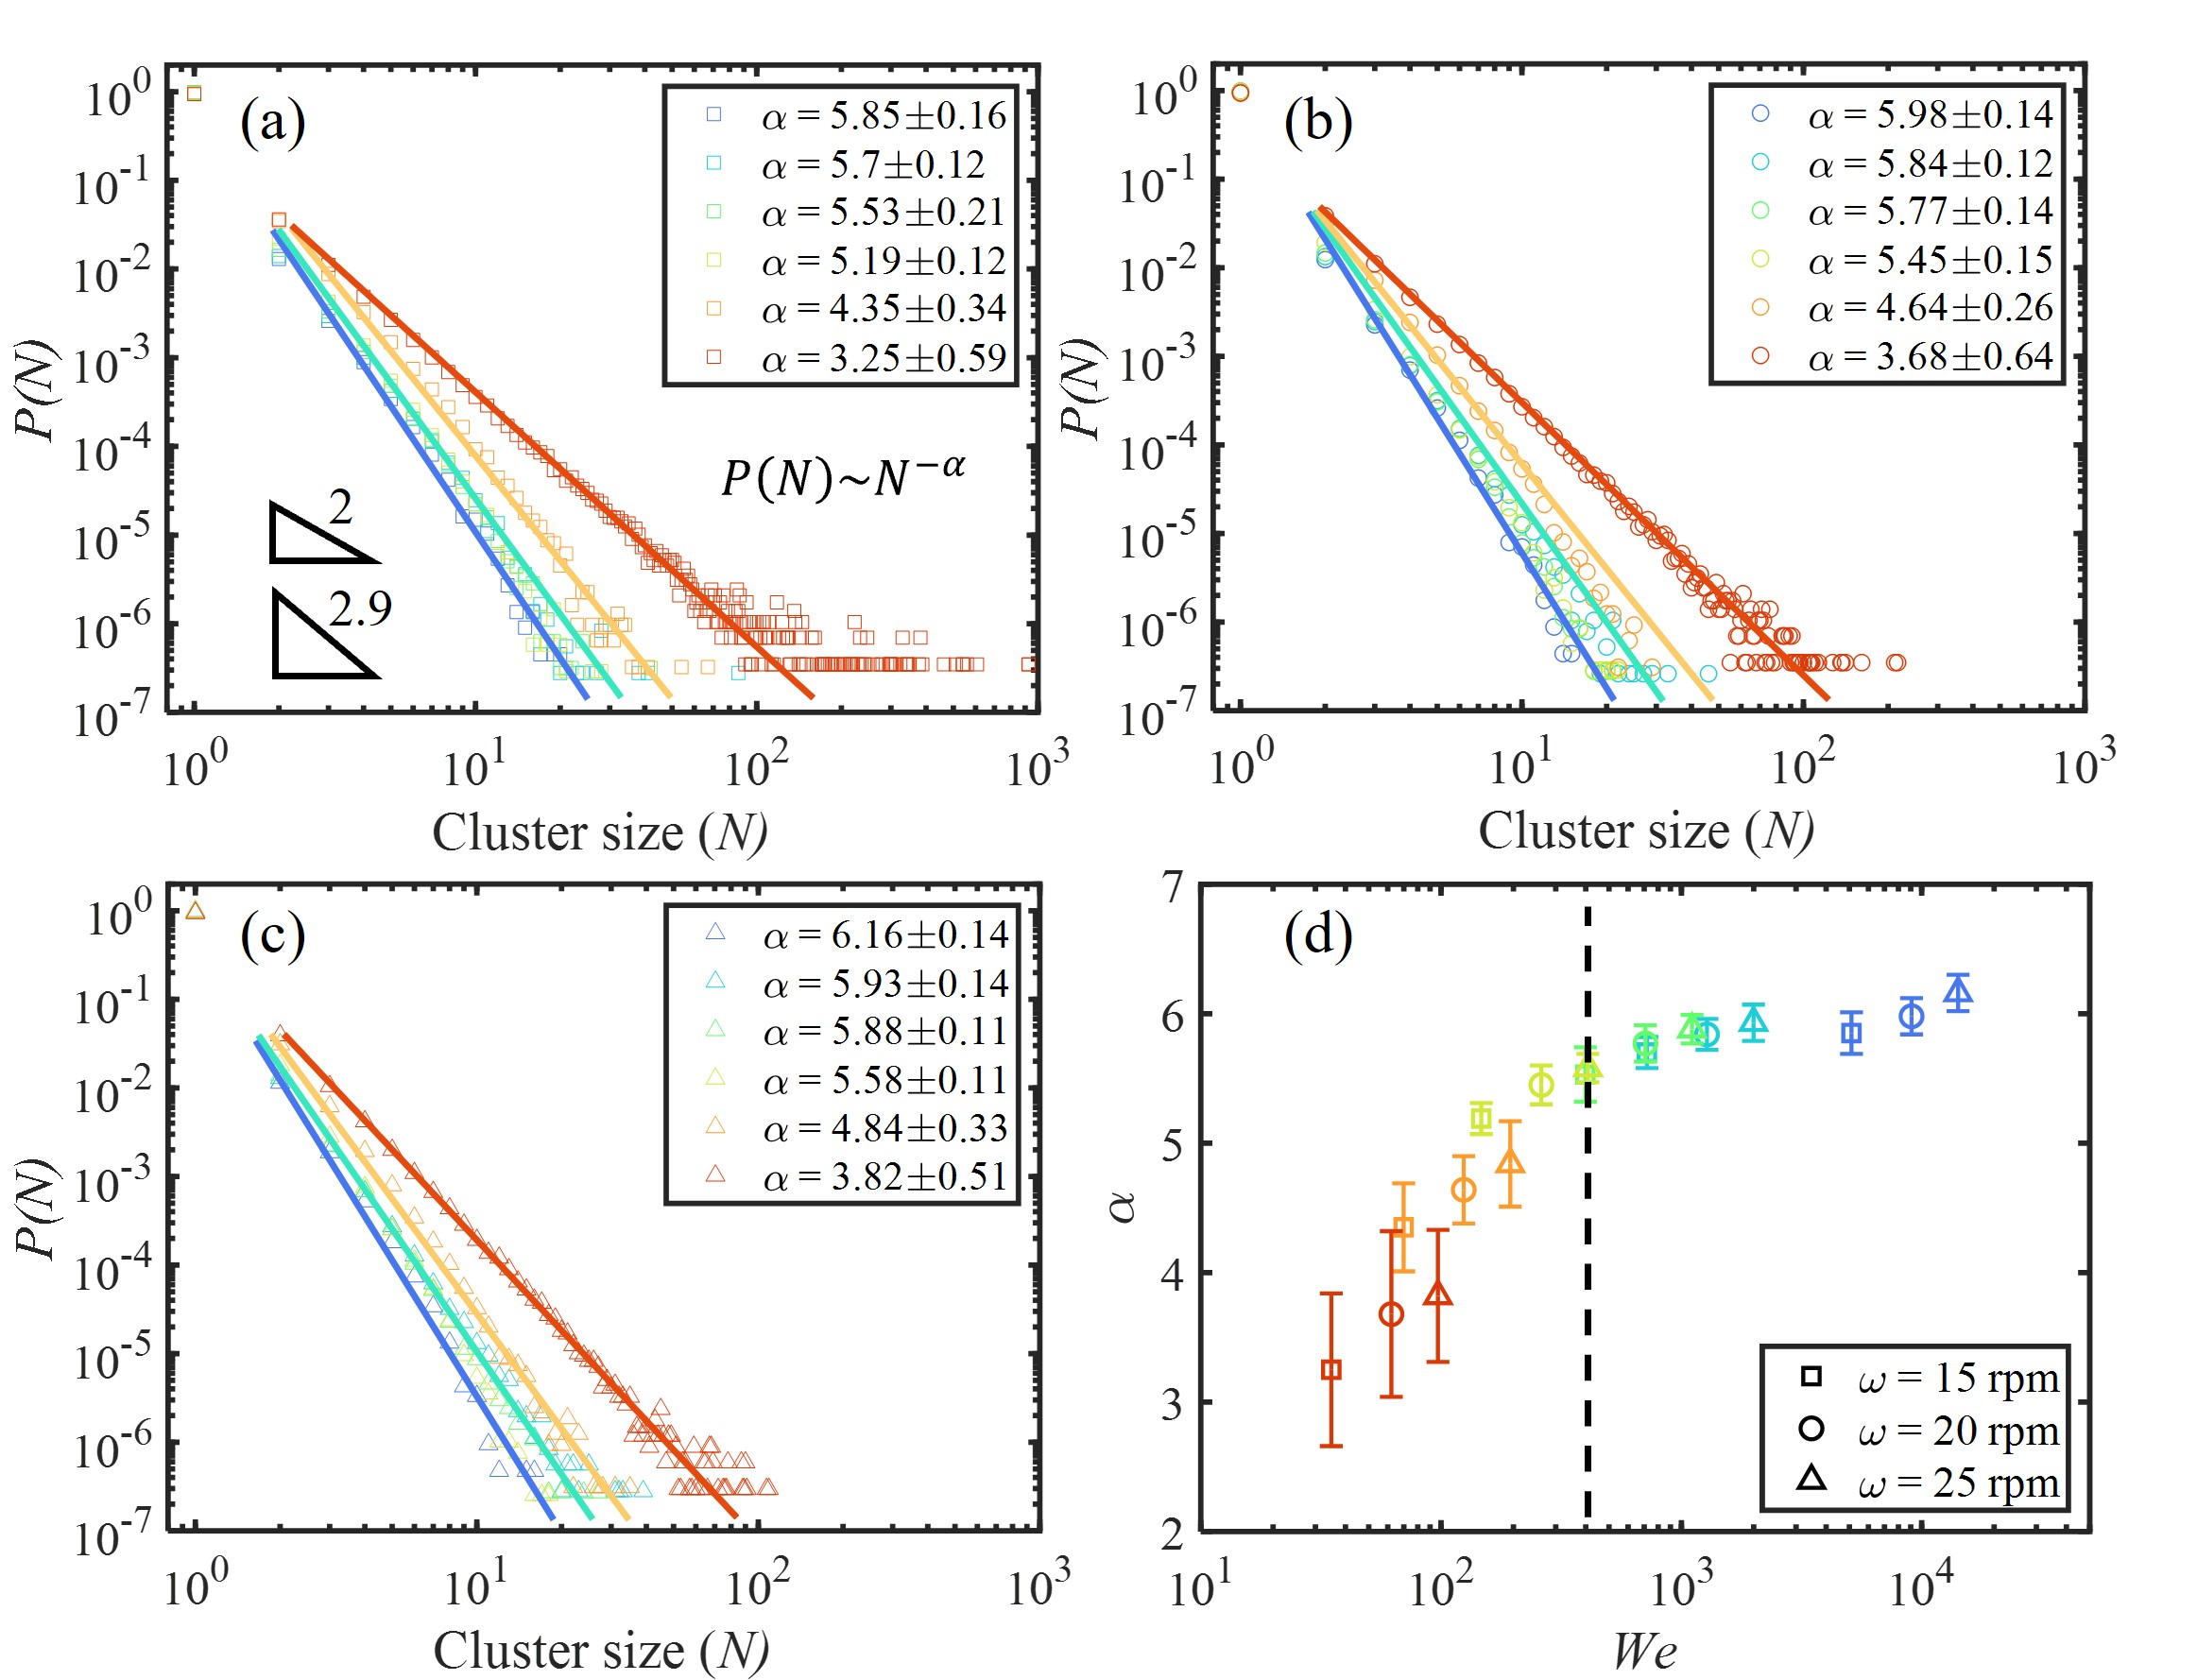
Corresponding to the phase diagram of cluster formation in Fig. 8, the cluster size distribution of each case is plotted in Fig. 9 (a)-(c). A power law decay of the probability of cluster size is found to be consistent with similar 2D and quasi-2D casesBonamy et al. (2002a) with , where a smaller value of indicates a greater chance of the formation of large clusters. For the cohesionless cases, the results by Bonamy et al. (2002a) together with our results show that a higher level of boundary constraints (from 3D to 2D) and a lower rotation rate (less kinetic energy) both make the flow tend to form larger clusters. This demonstrates that the velocity fluctuation can be constrained by more strict boundary confinement and lower inertia effects Pouliquen (2004); Fullmer and Hrenya (2017). As the cohesion rises, according to Fig. 9 (a)-(c), decreases, implying a general increase in the size of formed clusters. Finally, is plotted against to describe the competing effect between cohesion energy and kinetic energy when observing cluster formation. Same as Fig. 5 (b) and Fig. 6, the result shows that is a critical value above which the effects from cohesion on cluster size becomes negligible.
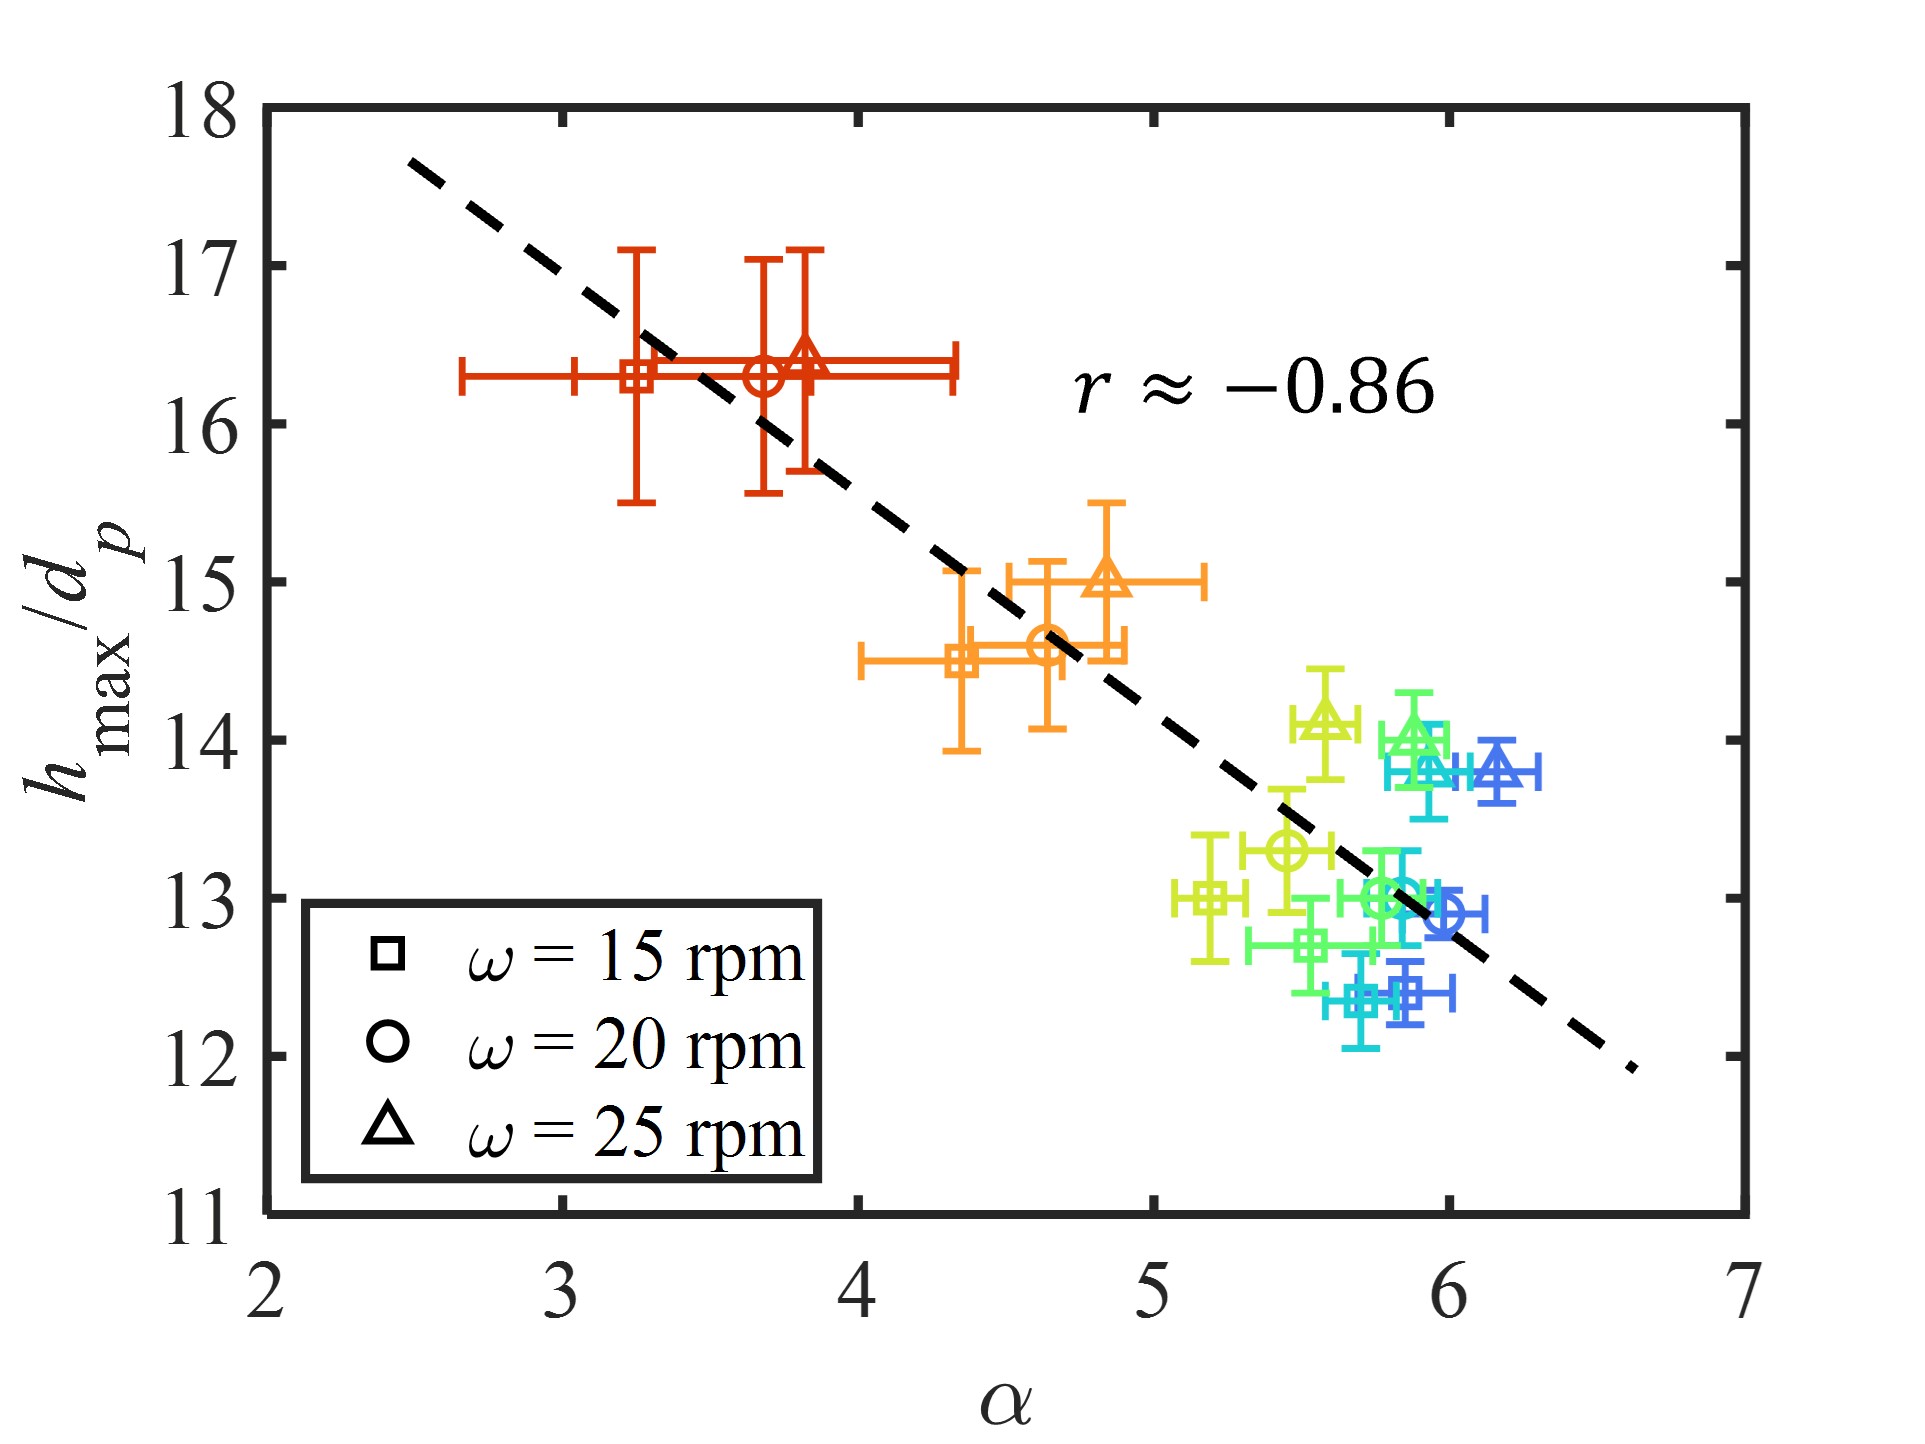
To clarify the relationship between cluster formation and granular flow regime, the maximum flow depth is plotted against shown in Fig. 10. The Pearson coefficient implies that the cluster size and flow depth are in a considerable positive correlation relationship. Since the clusters can possess a relatively irregular topology compared to single-sphere particles, higher resistance of inter-cluster contact (higher inter-cluster friction and rolling resistance) can be raised to hinder the relative inter-cluster movement Rognon et al. (2008); Campbell (2011). Moreover, Cao et al. (2018) also mentioned that the inter-cluster and intra-cluster plastic rearrangement can play key roles in dissipating energy in granular flows. In summary, an increase in cohesion is found to induce the granular flow to form relatively larger clusters which can be the key regime affecting the granular flow.
IV Conclusions
In this study, partially saturated granular flow in a rotating drum is studied experimentally and numerically. We first demonstrate that the experimentally observed rolling and cascading modes, controlled by the interparticle cohesion and drum rotation rate, are successfully captured in the numerical simulation using the Discrete Element Method.
With the combined effects of cohesion, inertia, and gravity, a dimensionless parameter, , is proposed to quantitatively describe the cohesive granular flow. For the first time, a collapse of data on the dynamic angle of repose under different rotation rate and cohesive forces are observed. This implies the capability and universality of the proposed in capturing the interplay among key mechanisms for cohesive granular flows.
At the mesoscale and particle level, the depth of flow region and the statistics of cluster formations in cohesive granular flow are examined. The transition from an inertia-dominated regime to a cohesion-dominated regime is highlighted. We further explored the correlation between the flow depth and cluster formation (with a correlation coefficient > 0.8), showing the effects of the cohesion manifested by the cluster formation.
Our results and analyses shed light on the multiscale connection across the particle-level mechanism, i.e., grain agglomeration, expansion of flow region (meso), and macroscopic observations characterised by the dynamic angle of repose. This study provides a new perspective on cohesive granular flows via revealing the dominating lower-scale features. This could benefit the development of various engineering applications, such as the food industry, mineral handling, and slope analysis under unsaturated conditions.
References
- Andreotti, Forterre, and Pouliquen (2013) B. Andreotti, Y. Forterre, and O. Pouliquen, Granular media: between fluid and solid (Cambridge University Press, 2013).
- Komatsu et al. (2001) T. S. Komatsu, S. Inagaki, N. Nakagawa, and S. Nasuno, “Creep motion in a granular pile exhibiting steady surface flow,” Physical review letters 86, 1757 (2001).
- gdrmidi@ polytech. univ-mrs. fr http://www. lmgc. univ-montp2. fr/MIDI/ (2004) G. M. gdrmidi@ polytech. univ-mrs. fr http://www. lmgc. univ-montp2. fr/MIDI/, “On dense granular flows,” The European Physical Journal E 14, 341–365 (2004).
- Forterre and Pouliquen (2008) Y. Forterre and O. Pouliquen, “Flows of dense granular media,” Annual Review of Fluid Mechanics 40, 1–24 (2008).
- Norouzi, Zarghami, and Mostoufi (2015) H. Norouzi, R. Zarghami, and N. Mostoufi, “Insights into the granular flow in rotating drums,” Chemical Engineering Research and Design 102, 12–25 (2015).
- Espiritu et al. (2020) E. Espiritu, A. Kumar, A. Nommeots-Nomm, J. M. Lerma, and M. Brochu, “Investigation of the rotating drum technique to characterise powder flow in controlled and low pressure environments,” Powder Technology 366, 925–937 (2020).
- Rognon et al. (2008) P. G. Rognon, J.-N. Roux, M. Naaim, and F. Chevoir, “Dense flows of cohesive granular materials,” Journal of Fluid Mechanics 596, 21–47 (2008).
- Orpe and Khakhar (2001) A. V. Orpe and D. Khakhar, “Scaling relations for granular flow in quasi-two-dimensional rotating cylinders,” Physical review E 64, 031302 (2001).
- Wang et al. (2019) N. Wang, H. Lu, J. Xu, X. Guo, and H. Liu, “Granular flows of binary mixtures down an inclined channel,” International Journal of Multiphase Flow 120, 103097 (2019).
- Mandal, Nicolas, and Pouliquen (2020) S. Mandal, M. Nicolas, and O. Pouliquen, “Insights into the rheology of cohesive granular media,” Proceedings of the National Academy of Sciences 117, 8366–8373 (2020).
- Bonamy et al. (2002a) D. Bonamy, F. Daviaud, L. Laurent, M. Bonetti, and J.-P. Bouchaud, “Multiscale clustering in granular surface flows,” Physical review letters 89, 034301 (2002a).
- Orpe and Khakhar (2007) A. V. Orpe and D. Khakhar, “Rheology of surface granular flows,” Journal of Fluid Mechanics 571, 1–32 (2007).
- Cortet et al. (2009) P.-P. Cortet, D. Bonamy, F. Daviaud, O. Dauchot, B. Dubrulle, and M. Renouf, “Relevance of visco-plastic theory in a multi-directional inhomogeneous granular flow,” EPL (Europhysics Letters) 88, 14001 (2009).
- Jarray, Magnanimo, and Luding (2019) A. Jarray, V. Magnanimo, and S. Luding, “Wet granular flow control through liquid induced cohesion,” Powder technology 341, 126–139 (2019).
- Pouliquen (2004) O. Pouliquen, “Velocity correlations in dense granular flows,” Physical review letters 93, 248001 (2004).
- Brewster et al. (2005) R. Brewster, G. S. Grest, J. W. Landry, and A. J. Levine, “Plug flow and the breakdown of bagnold scaling in cohesive granular flows,” Physical Review E 72, 061301 (2005).
- Da Cruz et al. (2005) F. Da Cruz, S. Emam, M. Prochnow, J.-N. Roux, and F. Chevoir, “Rheophysics of dense granular materials: Discrete simulation of plane shear flows,” Physical Review E 72, 021309 (2005).
- Tegzes et al. (2002) P. Tegzes, T. Vicsek, P. Schiffer, et al., “Avalanche dynamics in wet granular materials,” Physical review letters 89, 094301 (2002).
- Chou and Hsiau (2011) S. Chou and S. Hsiau, “Experimental analysis of the dynamic properties of wet granular matter in a rotating drum,” Powder technology 214, 491–499 (2011).
- Renouf et al. (2005) M. Renouf, D. Bonamy, F. Dubois, and P. Alart, “Numerical simulation of two-dimensional steady granular flows in rotating drum: On surface flow rheology,” Physics of fluids 17, 103303 (2005).
- Ostoja-Starzewski (2006) M. Ostoja-Starzewski, “Material spatial randomness: From statistical to representative volume element,” Probabilistic engineering mechanics 21, 112–132 (2006).
- Qu, Feng, and Wang (2021) T. Qu, Y. Feng, and M. Wang, “An adaptive granular representative volume element model with an evolutionary periodic boundary for hierarchical multiscale analysis,” International Journal for Numerical Methods in Engineering 122, 2239–2253 (2021).
- Shaheen et al. (2021) M. Y. Shaheen, A. R. Thornton, S. Luding, and T. Weinhart, “The influence of material and process parameters on powder spreading in additive manufacturing,” Powder Technology 383, 564–583 (2021).
- Fullmer and Hrenya (2017) W. D. Fullmer and C. M. Hrenya, “The clustering instability in rapid granular and gas-solid flows,” Annual Review of Fluid Mechanics 49, 485–510 (2017).
- Cao et al. (2018) Y. Cao, J. Li, B. Kou, C. Xia, Z. Li, R. Chen, H. Xie, T. Xiao, W. Kob, L. Hong, et al., “Structural and topological nature of plasticity in sheared granular materials,” Nature communications 9, 1–7 (2018).
- Bonamy et al. (2002b) D. Bonamy, F. Daviaud, L. Laurent, et al., “Experimental study of granular surface flows via a fast camera: a continuous description,” Physics of fluids 14, 1666–1673 (2002b).
- Zou et al. (2022) Y. Zou, G. Ma, J. Mei, J. Zhao, and W. Zhou, “Microscopic origin of shape-dependent shear strength of granular materials: a granular dynamics perspective,” Acta Geotechnica 17, 2697–2710 (2022).
- Henein, Brimacombe, and Watkinson (1983) H. Henein, J. Brimacombe, and A. Watkinson, “Experimental study of transverse bed motion in rotary kilns,” Metallurgical transactions B 14, 191–205 (1983).
- Nowak et al. (2005) S. Nowak, A. Samadani, A. Kudrolli, et al., “Maximum angle of stability of a wet granular pile,” Nature physics 1, 50–52 (2005).
- Taberlet, Richard, and Hinch (2006) N. Taberlet, P. Richard, and E. J. Hinch, “S shape of a granular pile in a rotating drum,” Physical Review E 73, 050301 (2006).
- Arntz et al. (2008) M. Arntz, W. K. den Otter, W. J. Briels, P. Bussmann, H. Beeftink, and R. Boom, “Granular mixing and segregation in a horizontal rotating drum: a simulation study on the impact of rotational speed and fill level,” AIChE journal 54, 3133–3146 (2008).
- Brewster, Grest, and Levine (2009) R. Brewster, G. S. Grest, and A. J. Levine, “Effects of cohesion on the surface angle and velocity profiles of granular material in a rotating drum,” Physical Review E 79, 011305 (2009).
- Liu, Yang, and Yu (2013) P. Liu, R. Yang, and A. Yu, “Self-diffusion of wet particles in rotating drums,” Physics of Fluids 25, 063301 (2013).
- Xu, Orpe, and Kudrolli (2007) Q. Xu, A. V. Orpe, and A. Kudrolli, “Lubrication effects on the flow of wet granular materials,” Physical Review E 76, 031302 (2007).
- Chen and Yan (2021) F. Chen and H. Yan, “Elastic–viscoplastic constitutive theory of dense granular flow and its three-dimensional numerical realization,” Physics of Fluids 33, 123310 (2021).
- Rajchenbach (1990) J. Rajchenbach, “Flow in powders: From discrete avalanches to continuous regime,” Physical Review Letters 65, 2221 (1990).
- Elekes and Parteli (2021) F. Elekes and E. J. Parteli, “An expression for the angle of repose of dry cohesive granular materials on earth and in planetary environments,” Proceedings of the National Academy of Sciences 118, e2107965118 (2021).
- Sunkara et al. (2013) K. R. Sunkara, F. Herz, E. Specht, and J. Mellmann, “Influence of flight design on the particle distribution of a flighted rotating drum,” Chemical Engineering Science 90, 101–109 (2013).
- Zhang et al. (2018) L. Zhang, F. Weigler, V. Idakiev, Z. Jiang, L. Mörl, J. Mellmann, and E. Tsotsas, “Experimental study of the particle motion in flighted rotating drums by means of magnetic particle tracking,” Powder technology 339, 817–826 (2018).
- Feng and Yu (1998) C. Feng and A. Yu, “Effect of liquid addition on the packing of mono-sized coarse spheres,” Powder technology 99, 22–28 (1998).
- Scheel et al. (2008) M. Scheel, R. Seemann, M. Brinkmann, M. Di Michiel, A. Sheppard, B. Breidenbach, and S. Herminghaus, “Morphological clues to wet granular pile stability,” Nature materials 7, 189–193 (2008).
- Wang, Pereira, and Gan (2021) Z. Wang, J.-M. Pereira, and Y. Gan, “Packing of wet monodisperse spheres,” Powder Technology 378, 60–64 (2021).
- Mutsers and Rietema (1977) S. Mutsers and K. Rietema, “The effect of interparticle forces on the expansion of a homogeneous gas-fluidized bed,” Powder Technology 18, 239–248 (1977).
- Cundall and Strack (1979) P. A. Cundall and O. D. Strack, “A discrete numerical model for granular assemblies,” geotechnique 29, 47–65 (1979).
- Walton (1993) O. R. Walton, “Numerical simulation of inclined chute flows of monodisperse, inelastic, frictional spheres,” Mechanics of materials 16, 239–247 (1993).
- Luding (2005) S. Luding, “Anisotropy in cohesive, frictional granular media,” Journal of Physics: Condensed Matter 17, S2623 (2005).
- Gan and Kamlah (2010) Y. Gan and M. Kamlah, “Discrete element modelling of pebble beds: with application to uniaxial compression tests of ceramic breeder pebble beds,” Journal of the Mechanics and Physics of Solids 58, 129–144 (2010).
- Kloss et al. (2012) C. Kloss, C. Goniva, A. Hager, S. Amberger, and S. Pirker, “Models, algorithms and validation for opensource dem and cfd–dem,” Progress in Computational Fluid Dynamics, an International Journal 12, 140–152 (2012).
- Brilliantov et al. (1996) N. V. Brilliantov, F. Spahn, J.-M. Hertzsch, and T. Pöschel, “Model for collisions in granular gases,” Physical review E 53, 5382 (1996).
- Iwashita and Oda (1998) K. Iwashita and M. Oda, “Rolling resistance at contacts in simulation of shear band development by dem,” Journal of engineering mechanics 124, 285–292 (1998).
- Ai et al. (2011) J. Ai, J.-F. Chen, J. M. Rotter, and J. Y. Ooi, “Assessment of rolling resistance models in discrete element simulations,” Powder Technology 206, 269–282 (2011).
- Parteli et al. (2014) E. J. Parteli, J. Schmidt, C. Blümel, K.-E. Wirth, W. Peukert, and T. Pöschel, “Attractive particle interaction forces and packing density of fine glass powders,” Scientific reports 4, 1–7 (2014).
- Yang, Zou, and Yu (2000) R. Yang, R. Zou, and A. Yu, “Computer simulation of the packing of fine particles,” Physical review E 62, 3900 (2000).
- Fuchs et al. (2014) R. Fuchs, T. Weinhart, J. Meyer, H. Zhuang, T. Staedler, X. Jiang, and S. Luding, “Rolling, sliding and torsion of micron-sized silica particles: experimental, numerical and theoretical analysis,” Granular matter 16, 281–297 (2014).
- Tang et al. (2019) H. Tang, R. Song, Y. Dong, and X. Song, “Measurement of restitution and friction coefficients for granular particles and discrete element simulation for the tests of glass beads,” Materials 12, 3170 (2019).
- Bhateja et al. (2016) A. Bhateja, I. Sharma, J. K. Singh, et al., “Scaling of granular temperature in vibro-fluidized grains,” Physics of Fluids 28, 043301 (2016).
- Soulie et al. (2006) F. Soulie, F. Cherblanc, M. S. El Youssoufi, and C. Saix, “Influence of liquid bridges on the mechanical behaviour of polydisperse granular materials,” International journal for numerical and analytical methods in geomechanics 30, 213–228 (2006).
- Willett et al. (2000) C. D. Willett, M. J. Adams, S. A. Johnson, and J. P. Seville, “Capillary bridges between two spherical bodies,” Langmuir 16, 9396–9405 (2000).
- Lian, Thornton, and Adams (1993) G. Lian, C. Thornton, and M. J. Adams, “A theoretical study of the liquid bridge forces between two rigid spherical bodies,” Journal of colloid and interface science 161, 138–147 (1993).
- Jaggannagari et al. (2021) S. R. Jaggannagari, R. K. Desu, J. Reimann, Y. Gan, M. Moscardini, and R. K. Annabattula, “Dem simulations of vibrated sphere packings in slender prismatic containers,” Powder Technology 393, 31–59 (2021).
- Dong, Wang, and Gan (2022) M. Dong, Z. Wang, and Y. Gan, “Wet mono-sized granular packing: effects of initial clusters and filling strategy,” Powder Technology 407, 117678 (2022).
- He et al. (2019) S. He, J. Gan, D. Pinson, A. Yu, and Z. Zhou, “Flow regimes of cohesionless ellipsoidal particles in a rotating drum,” Powder Technology 354, 174–187 (2019).
- Liu, Yang, and Yu (2011) P. Liu, R. Yang, and A. Yu, “Dynamics of wet particles in rotating drums: Effect of liquid surface tension,” Physics of fluids 23, 013304 (2011).
- Klise et al. (2016) K. A. Klise, D. Moriarty, H. Yoon, and Z. Karpyn, “Automated contact angle estimation for three-dimensional x-ray microtomography data,” Advances in water resources 95, 152–160 (2016).
- Kovalcinova et al. (2018) L. Kovalcinova, S. Karmakar, M. Schaber, A.-L. Schuhmacher, M. Scheel, M. DiMichiel, M. Brinkmann, R. Seemann, and L. Kondic, “Energy dissipation in sheared wet granular assemblies,” Physical Review E 98, 032905 (2018).
- Ester et al. (1996) M. Ester, H.-P. Kriegel, J. Sander, X. Xu, et al., “A density-based algorithm for discovering clusters in large spatial databases with noise.” in kdd, Vol. 96 (1996) pp. 226–231.
- Murray et al. (2012) J. Murray, S. Benyahia, P. Metzger, and C. Hrenya, “Continuum representation of a continuous size distribution of particles engaged in rapid granular flow,” Physics of Fluids 24, 083303 (2012).
- Campbell (2011) C. S. Campbell, “Clusters in dense-inertial granular flows,” Journal of fluid mechanics 687, 341–359 (2011).