Controlling the Temperature of the Spin–Reorientation Transition In HoFe1–xMnxO3 Orthoferrite Single Crystals
Abstract
HoFe1–xMnxO3 single crystals have been grown by the optical floating zone technique. A structural transition from the orthorhombic to hexagonal modification has been established in the crystals in the concentration range of , which has been confirmed by the X–ray diffraction data. For a series of the rhombic crystals, the room-temperature Mössbauer study and magnetic measurements in the temperature range of K have been carried out. It has been observed that, with an increase in the manganese content in the samples, the temperature of the spin-reorientation transition increases significantly: from 60 K in the HoFeO3 compound to room temperature in HoFe0.6Mn0.4O3. The magnetic measurements have shown that, upon substitution of manganese for iron, the magnetic orientational type transition changes from a second-order transition () to first-order one () with a weak ferromagnetic moment only in the b direction (for Pnma notation). The growth of the spin-reorientation transition temperature has been attributed to the change in the value of the indirect exchange in the iron subsystem under the action of manganese, which has been found when studying the Mössbauer effect in the HoFe1–xMnxO3 compound.
I Introduction
Oxide materials containing transition and rare-earth ions exhibit many intriguing effects caused by the complex interplay of two magnetic subsystems. Orthoferrites with the general formula RFeO3 [1, 2, 3, 4] that can be distinguished into a separate class of such materials have been explored for more than half a century. The RFeO3 crystal structure is described by the sp. gr. Pnma (#62). Although the magnetic properties of these compounds have been thoroughly investigated, interest in them has grown again due to the recent discovery of a number of attracting phenomena: multiferroism below the temperature of ordering of the rare-earth subsystem [5], laser-induced ultrafast magnetization switching in domain walls [6, 7, 8], formation of a soliton lattice in the TbFeO3 compound [9], and existence of quasi-one-dimensional Yb3+ spin chains in the YbFeO3 compound [10].
Rare-earth orthoferrites represent a family with the extraordinary magnetic phenomena. The unique magnetic properties of these materials result from the complex interplay of the moments of 3d and 4f electrons. It is known well [1] that the RFeO3 compounds are characterized by unusually high Néel temperatures ( K), below which the Fe moments are ordered antiferromagnetically with a weak sublattice canting, which induces weak ferromagnetism. As the temperature decreases, the role of the Fe–R interaction increases; as a result, orientational spin transitions occur at lower temperatures, which depend strongly on the rare-earth ion: K for HoFeO3 [11, 12], K for TmFeO3 [11, 13], and K when Tb is used as a rare-earth element [9, 14]. Of special interest is the SmFeO3 compound [15], in which the orientational transition is observed at K. The subsystem of rare-earth ions with a relatively weak R - R interaction at high temperatures is paramagnetic or weakly polarized by the molecular field of ordered Fe ions. The rare-earth magnetic sublattice becomes ordered below K (the temperature of ordering of the rare-earth subsystem). The observed magnetic properties of the system result from the multiplicity of different exchanges. In addition to the Fe–Fe, Fe–R, and R–R Heisenberg exchange couplings, an important role in determining the magnetic properties is played by the Dzyaloshinskii‒Moriya interaction [16, 17], which induces a weak ferromagnetic moment.
A way of controlling the temperature of the spin-reorientation transition is isovalent substitution in the RFe1–xMxO3 (M = Cr, Mn, Co, Ni) iron subsystem. In this case, it becomes possible to smoothly change the magnetic properties in such systems and set the desired temperature , for example, at the ultrafast magnetization switching in domain walls [6, 7, 8]. For example, in [18], the reversible spin-reorientation transition was observed in the TbFe0.75Mn0.25O3 single crystal at K, whereas in the pure TbFeO3 single crystal, the transition occurs at temperatures of 3 and 8 K. In [19], a SmFe0.75Mn0.25O3 single crystal was successfully grown; it was shown that, when a part of iron is replaced by manganese, the temperature decreases noticeably. In [20], the authors managed to grow a series of PrFe1–xMnxO3 () single crystals and demonstrated that, at a manganese content of 30%, the spin-reorientation transition shifts to room temperature. In [21], the synthesis of a series of GdFe1–xMnxO3 () single crystals was reported.
It should be noted that the majority of studies have been carried out on polycrystalline samples. Meanwhile, in terms of the potential of the discussed orthoferrites for microelectronic applications, it is desirable to explore their single-crystal samples. We can distinguish studies [22, 23, 24] aimed at the examination of dysprosium, terbium, and yttrium orthoferrites with partial substitution of manganese for iron; in these materials, a change in the temperature was also observed. In addition, in some works [25, 26, 27], substitution of other transition elements (chromium, nickel, and cobalt) into the iron subsystem was performed and a change in the value was reported.
Concerning the HoFe1–xMnxO3 compound, in [28] the polycrystalline HoFe1–xMnxO3 () samples were synthesized and their magnetic and structural features were reported. It was shown that, at a concentration of , the temperature for this compound reached room temperature. However, against the background of holmium paramagnetism, the spin-reorientation transition turns into just a minor anomaly in the magnetization curve. Therefore, to study the evolution of the magnetic properties in more detail, it is necessary to perform measurements on single-crystal samples.
The aim of this study was to grow and investigate single-crystal HoFe1–xMnxO3 samples with a manganese content of up to its maximum value at which this solid solution remains stable in the orthorhombic phase.
II Experimental details
At the first stage, to obtain the HoFe1–xMnxO3 ( and ) samples, the initial Ho2O3, Fe2O3, and MnO2 powders (99.9%, Alfa Aesar) were mixed in required proportions and subjected to annealing at a temperature of 925 °C for 18 h. The annealed powders were poured into a rubber mold and pressed in a hydrostatic press at a pressure of MPa. The resulting cylindrical samples were then annealed in a vertical furnace at 1400 °C for 16 h. After that, the synthesized polycrystalline HoFe1–xMnxO3 samples were placed in an FZ–T–4000–H–VIII–VPO–PC optical floating zone furnace (Crystal Systems Corp.) to grow single crystals. The crystal growth occurred in air at a normal pressure and a relative rod rotation speed of 30 rpm. The growth rates varied from 3 to 1 mm/h, depending on the ratio between iron and manganese in the HoFe1–xMnxO3 composition. It should be noted that we attempted to grow the HoFe1–xCoxO3, HoFe1–xCrxO3, and HoFe1–xNixO3 single crystals with ; however, substitution of even 5% of chromium or nickel for iron led to incongruent melting and did not allow us to obtain high-quality single crystals. The change in pressure (up to 10 atm) and a gaseous medium (O2, Ar–O2, or Ar–H2) did not improve the growth conditions in this case. It also seemed that the HoFe0.95Co0.05O3 single crystal was successfully grown, but the measured temperature dependences of the magnetization were found to be the same as for the HoFeO3 crystal, which showed that cobalt was not substituted for iron during the growth.
To solve the crystal structure and determine the phase purity of the HoFe1–xMnxO3 compound, a Bruker SMART APEX II single-crystal X–ray diffractometer was used. The measurements were performed at room temperature. The crystallographic orientations of all the single crystals were determined on a Photonic Science Laue Crystal Orientation System by the back reflection method. Mössbauer spectra for the investigated samples were obtained on an MS–1104Em spectrometer in the transmission geometry with a 57Co(Rh) radioactive source at a temperature of 300 K. Temperature and field dependences of the magnetization of the grown single crystals were obtained on a Quantum Design Physical Property Measurement System (PPMS–6000) in the temperature range of 4.2–350 K. The high-temperature (350–1000 K) magnetization measurements were performed on a Lake Shore Cryotronics VSM–8604 vibrating sample magnetometer. After temperature cycling up to 1000 K, the repeatability of the characteristic (Néel and spin-reorientation) temperatures and the magnetization values were checked. All the measurements were found to be fully repeatable.
III Results and analysis
III.1 Structure characterization
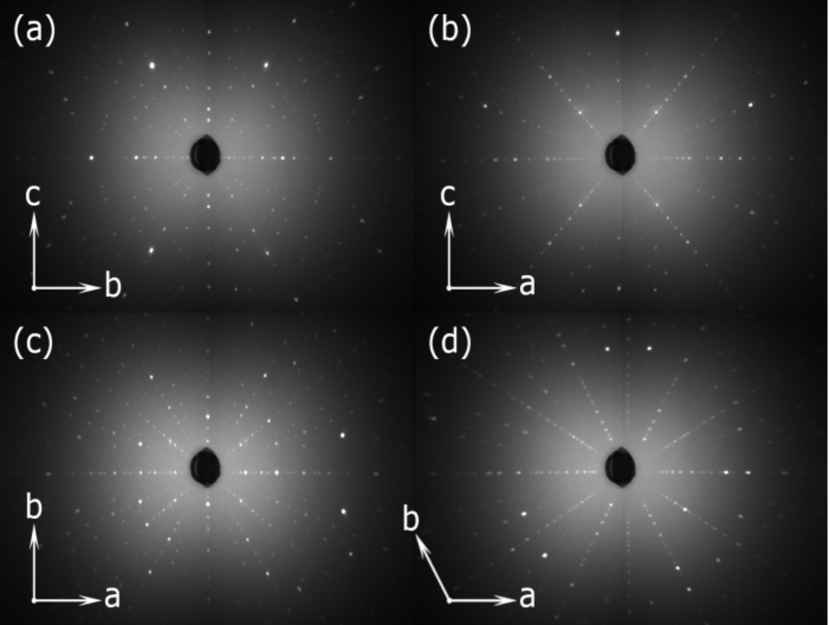
To check the quality of all the grown HoFe1–xMnxO3 single crystals and their orientations along the three crystallographic axes, the Laue method was used. As an example, Fig. III.1 presents Lauegrams of the sample with corresponds to the reflection planes with indices (100), (010), (001) (Figs. III.1 (a, b, c)) and the sample with (Fig. III.1d) for the reflection plane (0001). The observed sharp symmetric peaks and the absence of twinning are indicative of the high quality of the synthesized crystals. In addition, the reflections for the sample with correspond to the sp. gr. Pnma (#62), while the Lauegram of the sample with corresponds to the sp. gr. P63cm (#185). Thus, upon substitution of manganese for iron in the HoFe1–xMnxO3 () sample, the interface between the orthorhombic and hexagonal modifications in the HoFe1‒xMnxO3 solid solution is observed. We note that the single crystal with (pure HoMnO3) in the orthorhombic modification can be obtained by the solution‒melt method [29], which makes it possible to significantly lower the melt temperature, whereas the optical floating zone technique yields only the hexagonal HoMnO3 modification [30]. Based on the obtained data on the interface in HoFe1–xMnxO3, below we present the results of investigations of the orthorhombic HoFe1–xMnxO3() single crystals synthesized by zone melting under the same conditions.
It was established from the single-crystal X–ray diffraction data that the HoFe1–xMnxO3 () single crystals are orthorhombic with the sp. gr. Pnma. Their lattice parameters are given in Table III.1 and presented in Fig. III.1.
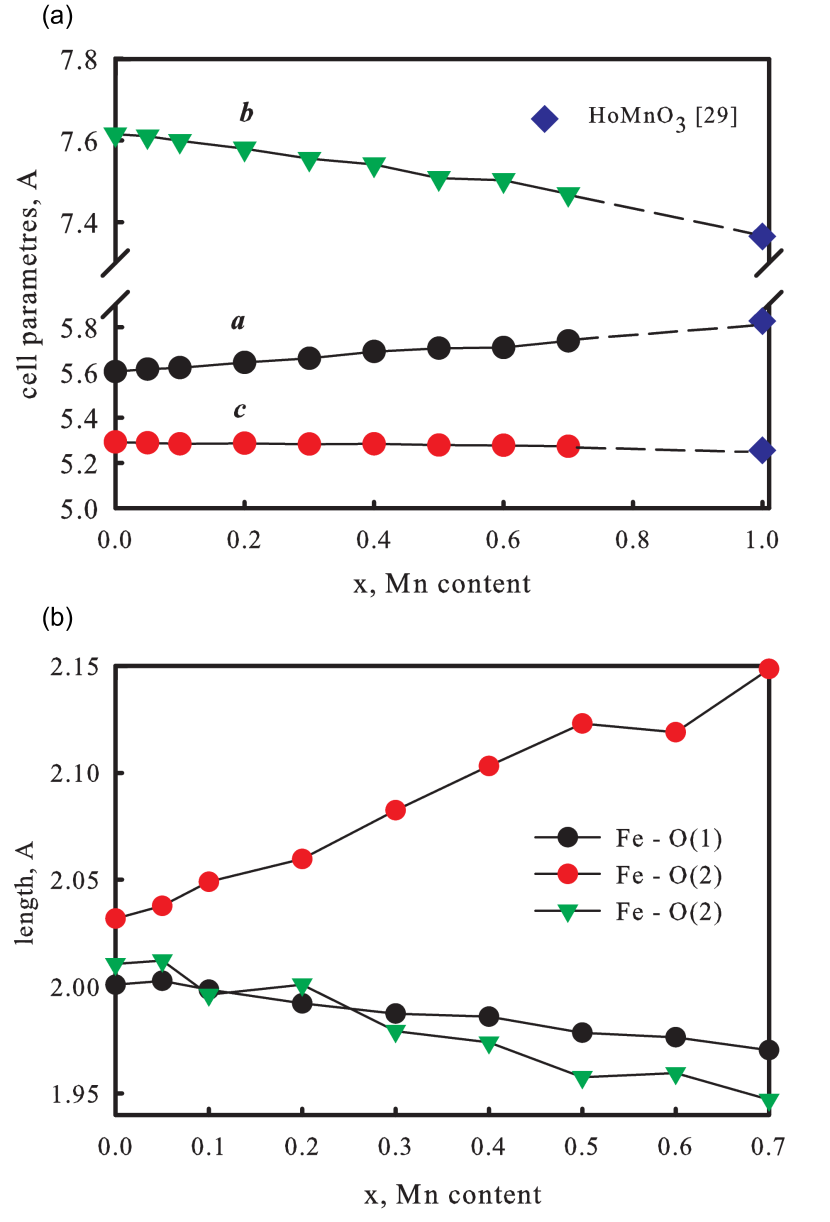
It can be seen from Table III.1 and Fig. III.1 that, under the isovalent substitution of manganese for iron in the HoFe1‒xMnxO3 () compound, the lattice parameters change linearly over the entire concentration range. In this case, parameter a increases linearly, parameter b decreases, and parameter c decreases insignificantly; the unit cell volume remains almost unchanged. Figure III.1 presents the concentration dependence of Fe–O(1) and Fe–O(2) bond lengths in the iron–oxygen octahedron. It can be seen that, as the value increases, the octahedron shrinks along the b direction and the greatest changes occur in the octahedron plane close to the ac plane, where the Fe–O(2) bond significantly elongates. Using the single–crystal X–ray diffraction data, we can determine the direction of the main component of the electric field gradient (EFG) tensor , which conventionally determines the principal axis direction in the octahedron. The can be determined from the X–ray diffraction data using the known bond lengths and angles in the octahedral environment of iron in the nearest neighbor approximation [31] as
| (1) |
Where is the EFG in the direction of the principal axis of the oxygen octahedron, is the angle between this axis and the direction to the neighboring oxygen ion, is the elementary charge, and is the metal–oxygen distance. In the calculation, all possible directions of the EFG axis in the local environment of the cation are checked, after which the main component of the EFG tensor is selected according to the condition.
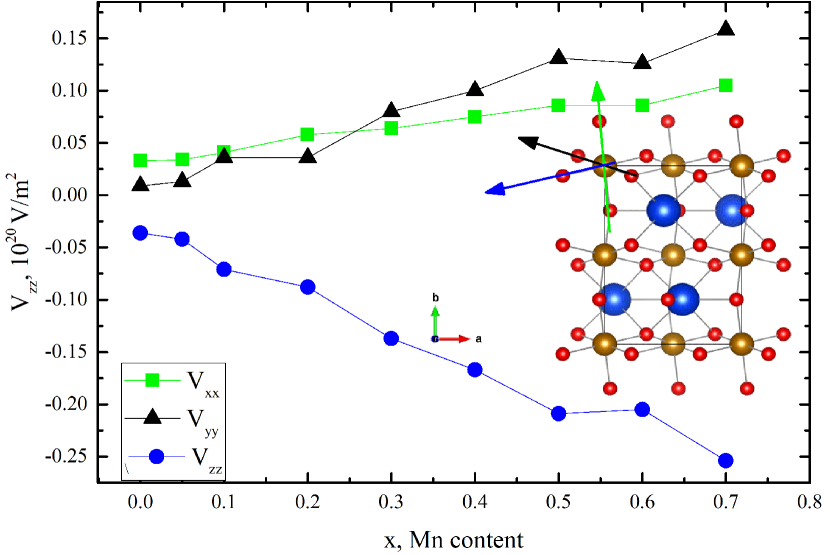
The results of the calculation in all possible directions for all the samples are given in Table III.1 and presented in Fig. III.2. Thus, we determine the direction of the main component of the EFG tensor relative to the crystallographic axes (shown in blue in the inset to Fig.III.2). The chemical bond length in this direction exceeds the lengths in the two other directions, so the oxygen octahedron is elongated.
III.2 Mössbauer Spectroscopy Study
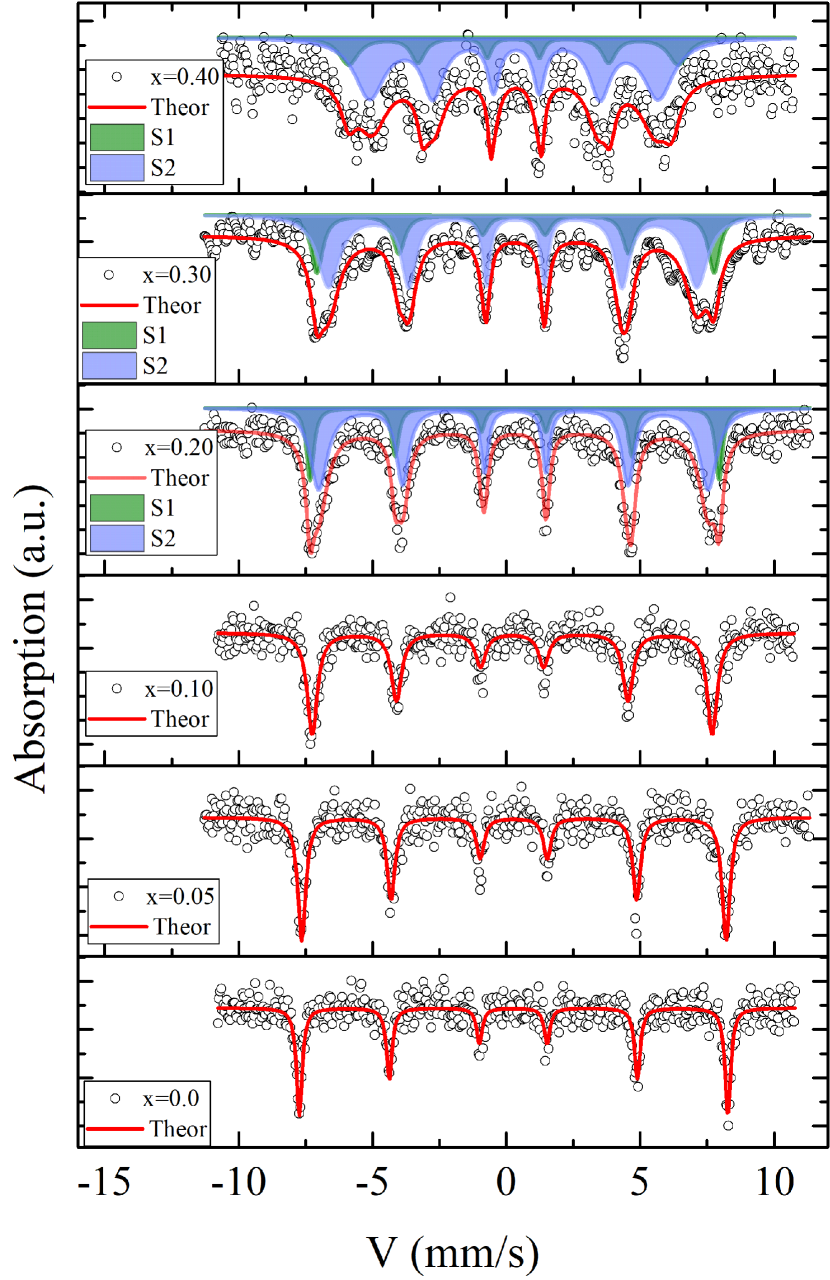
Samples for the Mössbauer spectroscopy study were prepared by grinding the HoFe1–xMnxO3 () single crystals to a powder. The powder sample with a weight of 5–10 g/cm2 according to the iron content was pressed in aluminum foil 20 mm in diameter. The processing occurred in two stages. At the first stage, possible nonequivalent positions of iron in the samples were determined by calculating the hyperfine field probability distributions. Basing on the results obtained, a preliminary model spectrum was formed. At the next stage, the model spectrum was fitted to the experimental spectrum by varying the entire set of hyperfine parameters using the least squares method in the linear approximation.
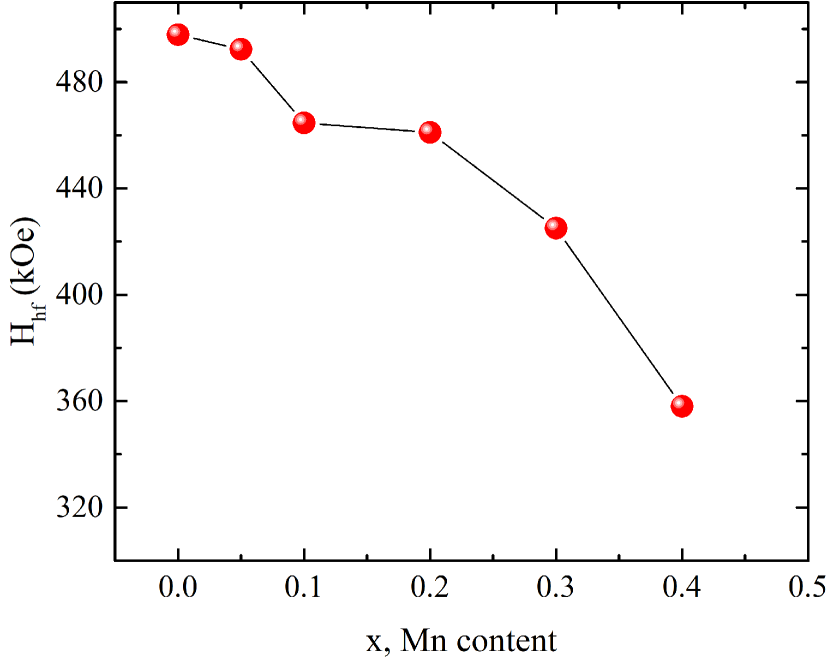
The spectra obtained are shown in Fig. III.2. These are fully resolved Zeeman sextets, the parameters of which are listed in Table III.2. The chemical shift for all the samples relative to –Fe indicates the charge state of high-spin iron cations in the octahedral environment, which is consistent with the crystal structure of orthoferrites and the previous Mössbauer data [32, 33]. Under the increasing substitution of Mn3+ cations up to , an additional iron site appears, which corresponds to a sextet with a strong hyperfine field. The fraction of this sextet increases stepwise and remains almost invariable in the concentration range of , which may indicate that manganese cations occupy certain positions in the lattice at these concentrations. This is indirectly confirmed by two characteristic segments in the concentration dependence of the average hyperfine field on iron nuclei, which remains monotonic (Fig. III.2).
| H | ||||||
|---|---|---|---|---|---|---|
| HoFeO3 | ||||||
Let us focus on the dependence of quadrupole shift of the main sextet on the manganese content in the HoFe1–xMnxO3 single crystal (Fig. III.3). We can see a monotonic decrease in the quadrupole shift with the increasing Mn content in the samples. Simultaneously, we note the change of the sign at a Mn content of for the sextet with a larger area. This can be explained by the effect of the single–ion anisotropy of manganese cations, which essentially contributes to the formation of the EFG tensor. As for the behavior of the second sextet quadrupole shift, its sign remains invariable over the entire concentration range and its value changes insignificantly with an increase in the degree of substitution.
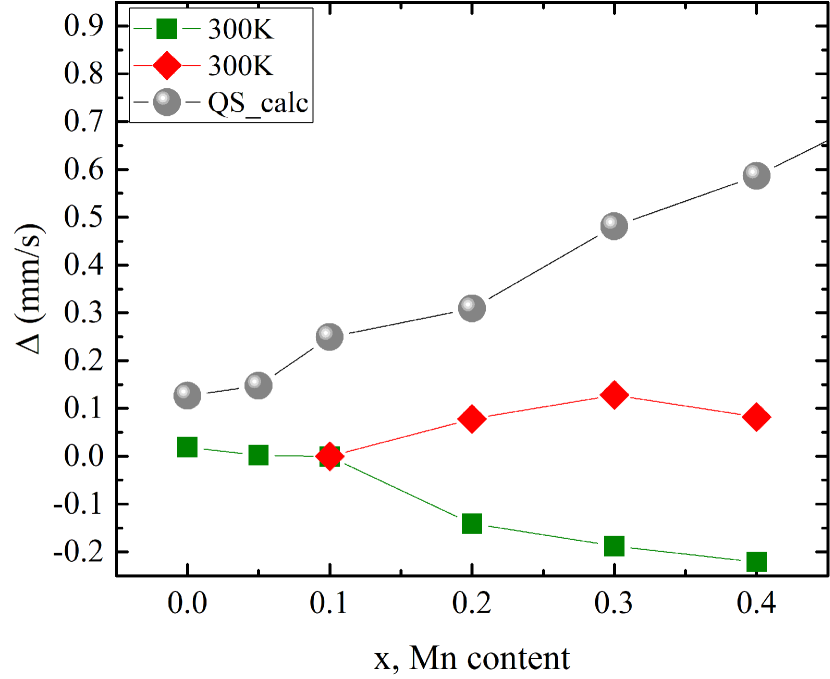
The quadrupole shift of the Mössbauer spectrum originates from (i) local distortions of the crystal lattice and (ii) the mutual direction of vectors and . The former determine the lattice contribution to the quadrupole splitting in the paramagnetic state, which can be found, with allowance for the Sternheimer antiscreening effect [34, 35] as
| (2) |
Here, is the Sternheimer antiscreening factor for a spherically symmetric Fe3+ cation [36] and is the a symmetry parameter, which describes the deviation from the axial symmetry.
In our case, the change in local distortions upon substitution is taken into account in the value calculated from the X–ray diffraction data. It should be noted that the approach used ignores the covalent contribution of chemical bond electrons to the quadrupole splitting. In our case, however, this contribution for the Fe3+ cation can be neglected. The calculated data are shown by spheres in Fig. III.3. For the HoFeO3 sample, the calculated value is 0.13 mm/s, while the experimental value in the paramagnetic state is 0.30 mm/s, as reported [32]. We attribute the obtained discrepancy with the experiment to the valence contribution.
III.3 Magnetic Measurements
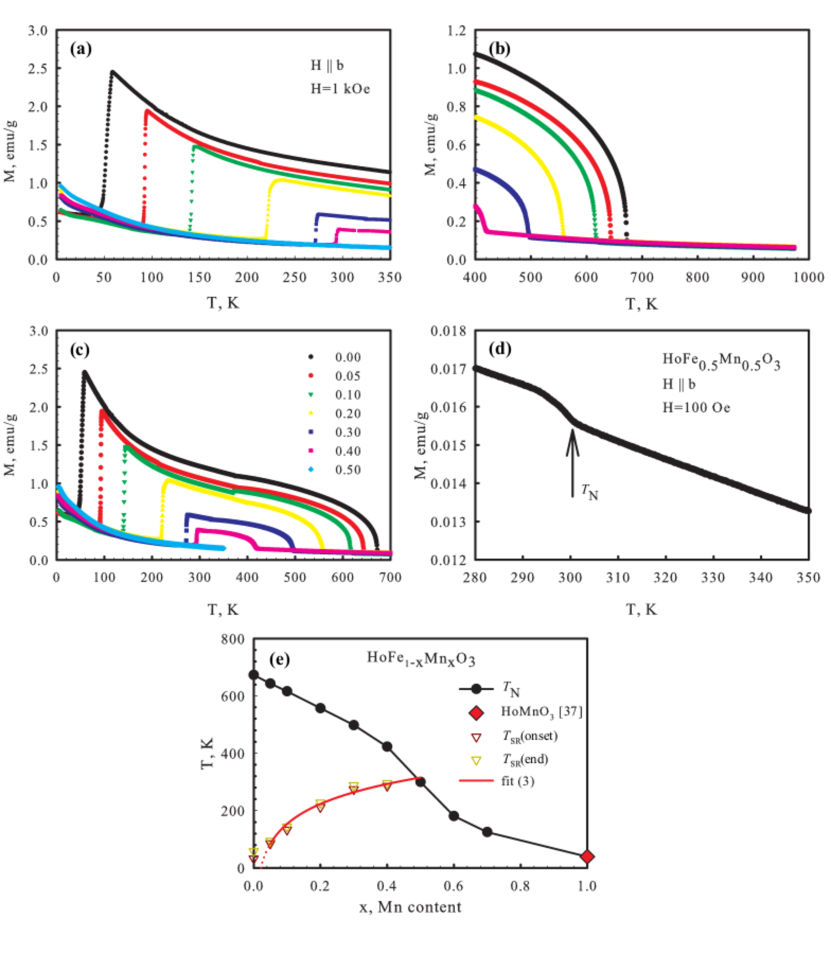
To elucidate the effect of manganese substitution on the magnetic properties of the HoFe1–xMnxO3 compounds, the temperature and field dependences of the magnetization M were measured. Figure 8 shows the dependences measured in the magnetic field . It can be seen that, as the manganese content increases, the temperature shifts monotonically to the high-temperature region. For the unsubstituted HoFeO3 sample, we have K, while for the sample with , K; i.e., the values lie in the room-temperature region. The value of magnetization (), which is determined by a weak ferromagnetic moment induced by canting of the iron antiferromagnetic sublattices, decreases gradually as the Mn content grows (Fig. III.3a).
In addition, with an increase in the manganese content, the HoFe1–xMnxO3 Néel temperature decreases monotonically from K for the HoFeO3 compound to K for the composition with (Figs. LABEL:fi7 (b, c, e). An example of determining the Néel temperature of the samples with and is presented in Fig. III.3d; in Fig. III.3d, at , the Néel temperature is K. The Néel temperatures of all the investigated HoFe1–xMnxO3 samples are shown in the phase diagram in Fig. III.3e. The value at (HoMnO3) was determined in [37]. It can be seen that, at concentrations of , the (x) dependence has an inflection, which is possibly related to a change in the dominant antiferromagnetic interaction from Fe–O–Fe to Mn–O–Mn. In addition, is the limiting concentration range, in which the spin-reorientation transition still occurs; with a further increase in the manganese content, becomes lower than , which corresponds to the paramagnet–to–antiferromagnet phase transition without successive orientational transitions. Figure III.3e shows also the dependence of the temperature on the Mn content (red solid line) calculated using the [38]
| (3) |
where is a positive constant related to the second–order anisotropy fields in the , , planes. characterizes a critical doping concentration from a hypothesis that at . In this study, the change in the second–order anisotropy constants responsible for the temperature of the spin–reorientation transition upon variation in the cobalt concentration in erbium, holmium, and dysprosium orthoferrites was investigated. In our opinion, this formalism [38] can be applied to describing the (x) change in the HoFe1–xMnxO3 compound. Previously, formula (3) was successfully used in [18, 19, 20].
It is known well that, during the spin–reorientation transition in the unsubstituted HoFeO3 compound, the weak ferromagnetic moment rotates spontaneously by 90° from the b to c direction in the crystal (Pnma) from the to phase (Fig. III.3); this is a second-order phase transition [3]. The temperature transition width for the HoFeO3 composition is K and no temperature hysteresis is observed. In the substituted samples, we have a completely different picture.
First, as can be seen from the dependences measured in the heating mode (Figs. III.3 (a and c)), the width of the spin-reorientation transition in the substituted samples is about K. Figure III.3 shows the dependences for the HoFe0.7Mn0.3O3 sample measured in external magnetic fields of different values and configurations. According to Fig. III.3a, the nature of the spin–reorientation transition in the substituted sample changed drastically: in the unsubstituted HoFeO3 compound, the phase transition from the to phase occurs with a change in the weak ferromagnetic moment direction, while in the HoFe0.7Mn0.3O3 compound, below the temperature, a compensated antiferromagnetic phase of the iron and manganese sublatticeis observed. In this case, the magnetization is only determined by the paramagnetic anisotropic contribution of holmium, which is reflected in the dependences (Fig. III.3a) measured along different crystallographic axes. In addition, it is noteworthy that, upon temperature cycling, the dependences measured along the b direction in different magnetic fields (Fig. III.3b) exhibit the hysteresis in the region of the transition (), the width of which amounts to K regardless of the applied magnetic field (up to 5 kOe). In addition, it can be seen in Fig. III.3b that the applied magnetic field affects weakly the temperature position; the onset of the transition shifts by 2 K toward lower temperatures in a field of kOe and the transition is not blurred. Exactly the same behavior is exhibited by all the substituted HoFe1–xMnxO3 samples, which only have different spin-reorientation transition temperature.
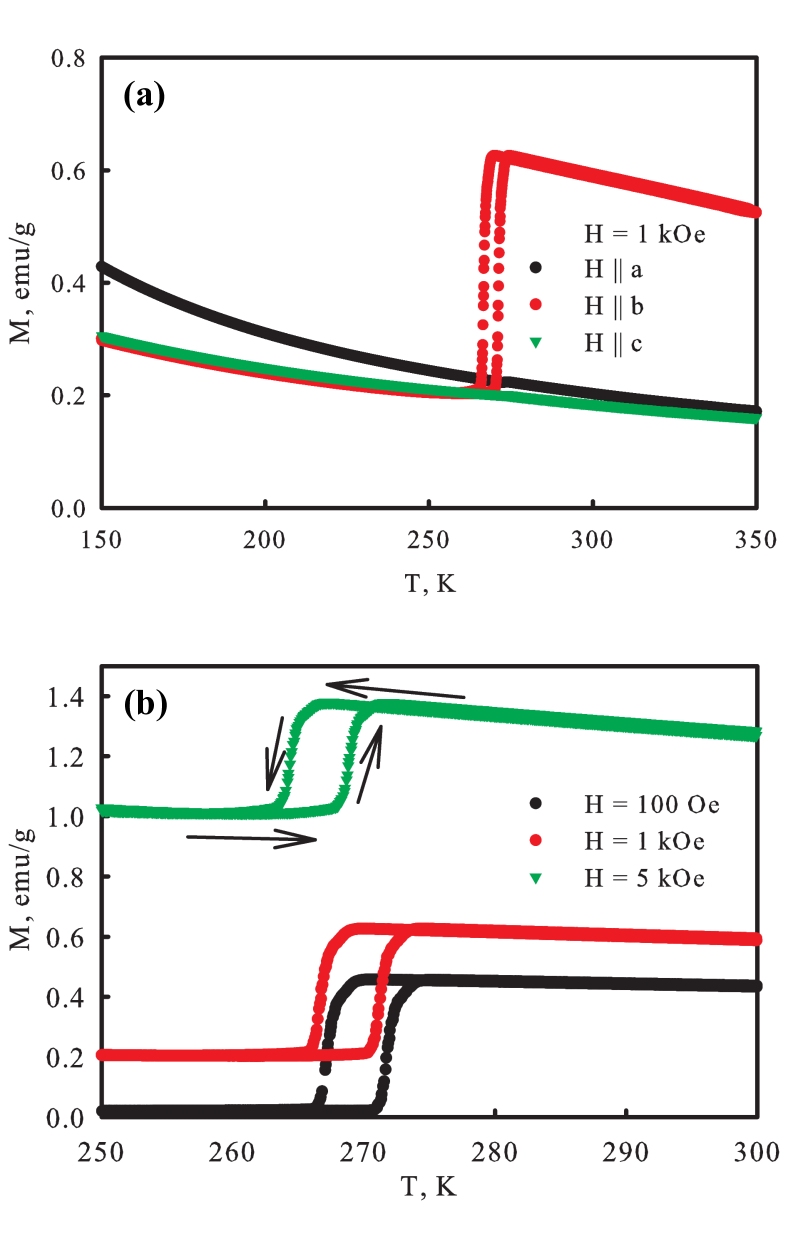
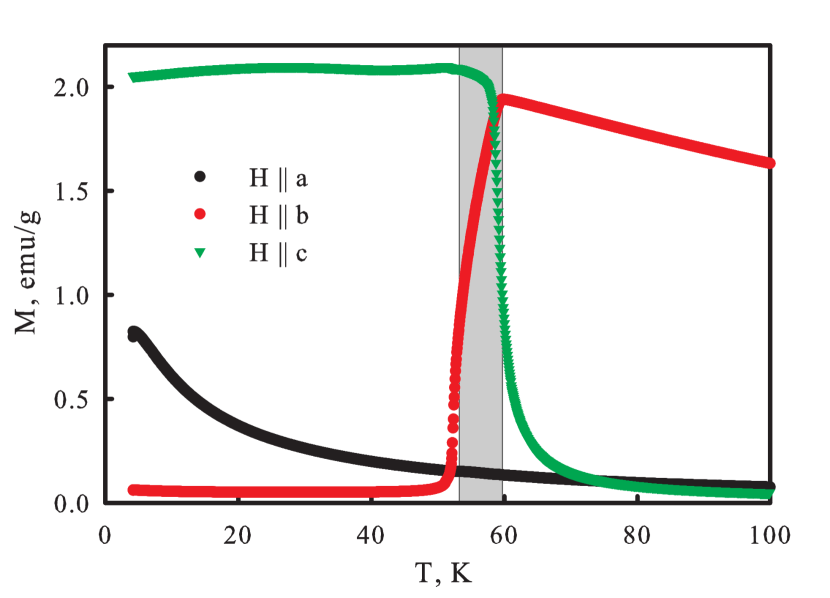
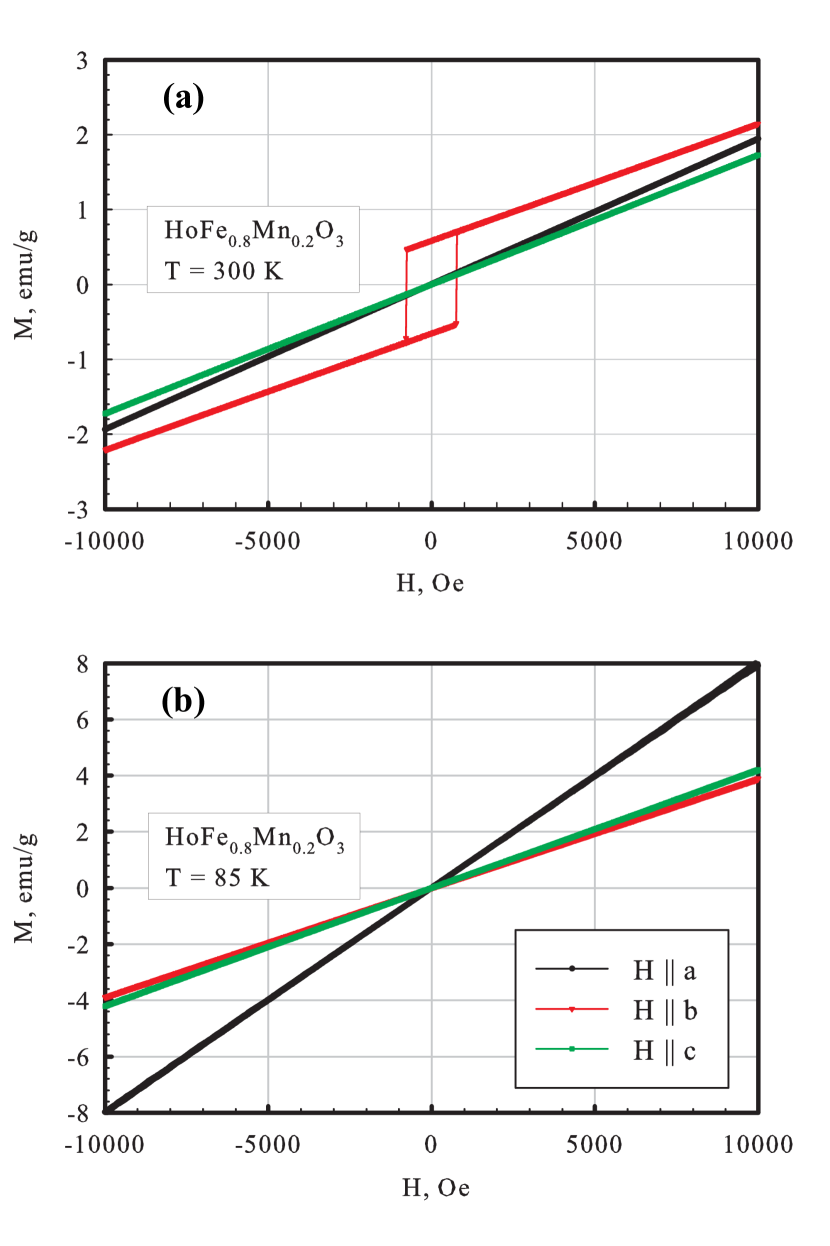
Figure III.3 shows the field dependences of magnetization of the HoFe0.8Mn0.2O3 sample at temperatures above and below the temperature of the spin–reorientation transition along three crystallographic axes. It can be seen that the ferromagnetic hysteresis is only observed along the b direction at , which corresponds to the magnetic phase (Fig. III.3a). At temperatures of , all the dependences are linear, which corresponds to the contribution of the collinear antiferromagnetic structure (the phase) without ferromagnetic component. The similar behavior was observed by us for all the substituted samples.
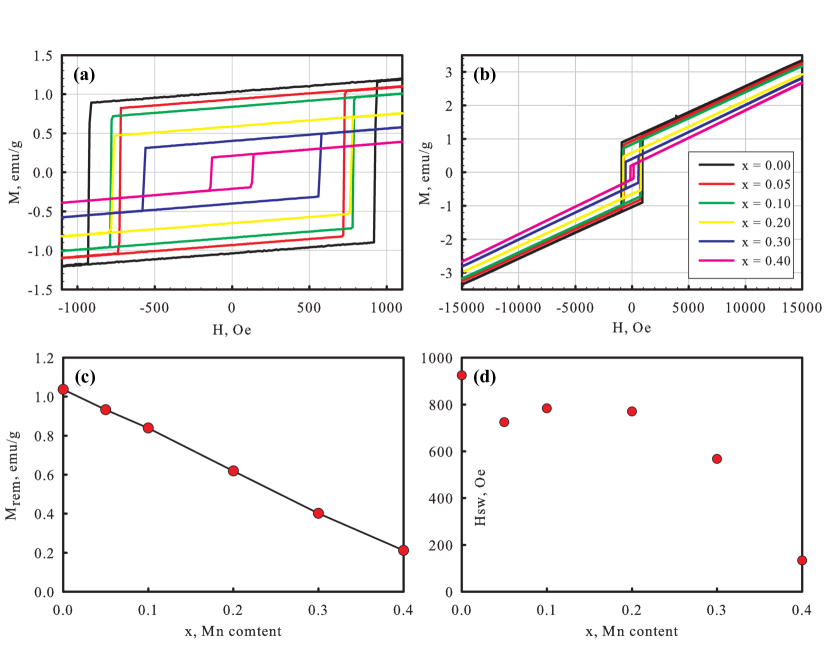
FigureIII.3 shows the dependences measured at K for all the HoFe1–xMnxO3 samples and the remanent magnetizations at Oe and coercivities (switching fields) Hsw. The magnetization switching from the lower to upper branch occurs in a negligibly narrow field range, which means that the sample includes a single magnetic domain. In all the substituted samples at K, the ferromagnetic magnetization component only exists along the b direction. Therefore, by changing the Mn content in the samples, one can smoothly change both the magnetization and coercivity value, which can be promising for use of this series of single crystals at room temperatures.
IV Discussion
It can be concluded from the analysis of the dependences that, in manganese–substituted holmium orthoferrites, the spin–reorientation transition is a first-order phase transition [3], which determines the change in the magnetic state from the weak ferromagnetism region (the phase, the magnetic moment along the b crystal direction) to the fully compensated antiferromagnetic region (the phase). Such a change in the nature of the phase transition in the HoFe1–xMnxO3 compound was observed in [28], where this conclusion was made on the basis of the neutron powder diffraction data. The change in the magnetic transition configuration from to (in Pnma notation) was observed in the TbFe1–xMnxO3 compound in [18], where the type of magnetic ordering was also determined by neutron diffraction. In this work, we obtained the similar results by the thorough analysis of the temperature and field dependences of the magnetization. Meanwhile, some questions about the magnetic behavior of the investigated system remain open.
Until now, no attention has been paid to the origin and mechanism of the significant growth of the temperature of the magnetic spin-reorientation transition in the HoFe1–xMnxO3 system. The reasons for this phenomenon can be analyzed using the Mössbauer spectroscopy data. Since the replacement of a part of iron cations results in a change in the orbital momentum at the sites, the substitution will also change the spin‒orbit coupling value. As a result, the magnetic moment direction will deviate from the quantization axis. This will lead to a change in the mutual orientation of the EFG () vector and the hyperfine field vector () on iron nuclei. In the case of the axial symmetry, this change is described by the dependence of the quadrupole shift [31, 39]
| (4) |
Here, is the quadrupole moment of a nucleus ( sm‒2), is the main component of the EFG tensor, is the angle between the EFG direction and the hyperfine field, and is the elementary charge. It is reliably demonstrated by the magnetic measurement data that the temperature of the spin-reorientation transition in the HoFe1–xMnxO3 compound depends strongly on the degree of substitution. Since the crystal structure is preserved in this case, it can be assumed that the quadrupole moment of a nucleus does not change. This allows us to estimate the concentration dependence of the angle upon substitution using the Mössbauer spectroscopy data and Eq. 3.
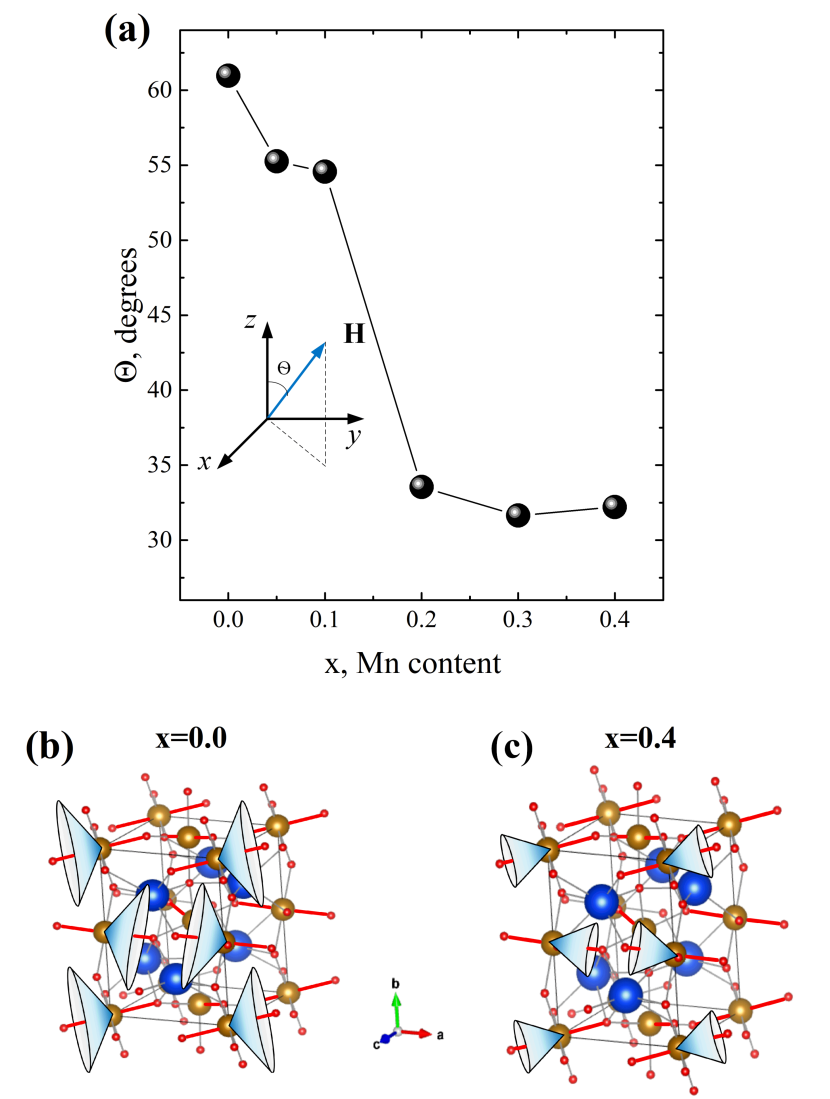
Thus, taking into account the values obtained by X–ray diffraction, we can estimate the change in the mutual orientation of the vectors and under the substitution (Fig. IV). It can be clearly seen that the angle changes sharply at a Mn content of . Taking into account the known direction of the vector from Fig. III.2, we can demonstrate that the magnetic moment direction (opposite to ) becomes closer to the ac crystal plane at the incorporation of manganese (Fig. III.3b). In [18], a similar substitution in the TbFe1–xMnxO3 samples was discussed. Analyzing the changes in the indirect exchange in this system, the authors noted that the Mn substitution changes the magnetic moment orbital component, which is responsible for the magnetic structure formation. According to the Mössbauer data obtained, we can conclude that the change in the mutual orientation of the vectors and upon substitution results from the Jahn–Teller effect. This leads to the rotation of the magnetic moment both on Mn cations and on Fe cations and to a decrease in the weak ferromagnetic moment along the b crystal direction. This rotation of the magnetic moments in the subsystem of 3d cations in the HoFe1–xMnxO3 system can explain the growth of the temperature of the spin-reorientation transition.
V Conclusion
In this study, a series of HoFe1–xMnxO3 single crystals over the entire substitute (Mn) concentration range was synthesized by the optical floating zone technique. It was found that, in the concentration range of , the HoFe1–xMnxO3 compound undergoes a structural transition from the rhombic () to hexagonal modification.
For the rhombic HoFe1–xMnxO3 modification, the magnetic measurements were performed, which showed that the spin-reorientation transition temperature increases significantly as the manganese content grows and, in the sample with , attains room temperature, which is important for application of the substituted orthoferrites.
It was found from the analysis of the magnetic measurement data that in all the substituted samples, the spin–reorientation transition is a first–order phase transition from the phase with decreasing temperature, whereas in the initial HoFeO3 sample, this is a second-order transition from the phase.
An increase in the temperature of the spin–reorientation transition was attributed to a decrease in the value of the indirect Fe–O–Fe exchange under substitution of manganese for iron, which was established in the Mössbauer spectroscopy experiments.
Acknowledgments
This study was supported by the Russian Science Foundation, project no. 23–22–10026, https://rscf.ru/project/23-22-10026/ and the Krasnoyarsk Territorial Foundation for Support of Scientific and R&D Activities. The investigation of magnetic measurements and structural properties were performed using equipment from the Center for Collective Use, Krasnoyarsk Scientific Center, Siberian Branch of the Russian Academy of Sciences.
References
- White [1969] R. White, Review of recent work on the magnetic and spectroscopic properties of the rare-earth orthoferrites, Journal of Applied Physics 40, 1061 (1969).
- Belov et al. [1974] K. Belov, A. Zvezdin, and A. Kadomtseva, New orientational transitions induced in orthoferrites by an external field, J. Exp. Theor. Phys 67 (1974).
- Belov et al. [1979a] K. Belov, A. Zvezdin, A. Kadomtseva, and R. Levitin, Orientational transitions in rare-earth magnets in russian (1979a).
- Belov et al. [1979b] K. Belov, A. Zvezdin, and A. Mukhin, Magnetic phase transitions in terbium orthoferrite, Sov. Phys. JETP 49, 557 (1979b).
- Tokunaga et al. [2009] Y. Tokunaga, N. Furukawa, H. Sakai, Y. Taguchi, T.-h. Arima, and Y. Tokura, Composite domain walls in a multiferroic perovskite ferrite, Nature materials 8, 558 (2009).
- Kimel et al. [2005] A. Kimel, A. Kirilyuk, P. Usachev, R. Pisarev, A. Balbashov, and T. Rasing, Ultrafast non-thermal control of magnetization by instantaneous photomagnetic pulses, Nature 435, 655 (2005).
- De Jong et al. [2011] J. De Jong, A. Kimel, R. Pisarev, A. Kirilyuk, and T. Rasing, Laser-induced ultrafast spin dynamics in , Physical Review B 84, 104421 (2011).
- Jiang et al. [2013] J. Jiang, Z. Jin, G. Song, X. Lin, G. Ma, and S. Cao, Dynamical spin reorientation transition in single crystal observed with polarized terahertz time domain spectroscopy, Applied Physics Letters 103 (2013).
- Artyukhin et al. [2012] S. Artyukhin, M. Mostovoy, N. P. Jensen, D. Le, K. Prokes, V. G. De Paula, H. N. Bordallo, A. Maljuk, S. Landsgesell, H. Ryll, et al., Solitonic lattice and ukawa forces in the rare-earth orthoferrite , Nature materials 11, 694 (2012).
- Nikitin et al. [2018] S. E. Nikitin, L. Wu, A. S. Sefat, K. A. Shaykhutdinov, Z. Lu, S. Meng, E. V. Pomjakushina, K. Conder, G. Ehlers, M. D. Lumsden, et al., Decoupled spin dynamics in the rare-earth orthoferrite : Evolution of magnetic excitations through the spin-reorientation transition, Physical Review B 98, 064424 (2018).
- Saito et al. [2001] K. Saito, A. Sato, A. Bhattacharjee, and M. Sorai, High-precision detection of the heat-capacity anomaly due to spin reorientation in and , Solid state communications 120, 129 (2001).
- Ovsianikov et al. [2022] A. Ovsianikov, O. Usmanov, I. Zobkalo, V. Hutanu, S. Barilo, N. Liubachko, K. Shaykhutdinov, K. Y. Terentjev, S. Semenov, T. Chatterji, et al., Magnetic phase diagram of by neutron diffraction, Journal of magnetism and magnetic materials 557, 169431 (2022).
- Leake et al. [1968] J. Leake, G. Shirane, and J. Remeika, The magnetic structure of thulium orthoferrite, , Solid State Communications 6, 15 (1968).
- Skorobogatov et al. [2022] S. Skorobogatov, K. Shaykhutdinov, D. Balaev, M. Pavlovskii, A. Krasikov, and K. Y. Terentjev, Spin dynamics and exchange interaction in orthoferrite with non-ramers rare-earth ion, Physical Review B 106, 184404 (2022).
- Cao et al. [2014] S. Cao, H. Zhao, B. Kang, J. Zhang, and W. Ren, Temperature induced spin switching in single crystal, Scientific reports 4, 5960 (2014).
- Dzyaloshinsky [1958] I. Dzyaloshinsky, A thermodynamic theory of “weak” ferromagnetism of antiferromagnetics, Journal of physics and chemistry of solids 4, 241 (1958).
- Moriya [1960] T. Moriya, Anisotropic superexchange interaction and weak ferromagnetism, Physical review 120, 91 (1960).
- Fang et al. [2016] Y. Fang, Y. Yang, X. Liu, J. Kang, L. Hao, X. Chen, L. Xie, G. Sun, V. Chandragiri, C.-W. Wang, et al., Observation of re-entrant spin reorientation in , Scientific reports 6, 33448 (2016).
- Kang et al. [2017] J. Kang, Y. Yang, X. Qian, K. Xu, X. Cui, Y. Fang, V. Chandragiri, B. Kang, B. Chen, A. Stroppa, et al., Spin-reorientation magnetic transitions in n-doped , IUCrJ 4, 598 (2017).
- Fan et al. [2022] W. Fan, H. Chen, G. Zhao, X. Ma, R. Chakaravarthy, B. Kang, W. Lu, W. Ren, J. Zhang, and S. Cao, Thermal control magnetic switching dominated by spin reorientation transition in -doped single crystals, Frontiers of Physics 17, 1 (2022).
- Su et al. [2019] L. Su, X.-Q. Zhang, Q.-Y. Dong, Y.-J. Ke, K.-Y. Hou, H.-t. Yang, and Z.-H. Cheng, Spin reorientation and magnetocaloric effect of () single crystals, Physica B: Condensed Matter 575, 411687 (2019).
- Chiang et al. [2011] F.-K. Chiang, M.-W. Chu, F. Chou, H. Jeng, H. Sheu, F. Chen, and C. Chen, Effect of ahn-eller distortion on magnetic ordering in perovskites, Physical Review B 83, 245105 (2011).
- Vilarinho et al. [2018] R. Vilarinho, D. Passos, E. Queirós, P. Tavares, A. Almeida, M. Weber, M. Guennou, J. Kreisel, and J. A. Moreira, Suppression of the cooperative ahn-eller distortion and its effect on the aman octahedra-rotation modes of , Physical Review B 97, 144110 (2018).
- Mandal et al. [2011] P. Mandal, V. S. Bhadram, Y. Sundarayya, C. Narayana, A. Sundaresan, and C. Rao, Spin-reorientation, ferroelectricity, and magnetodielectric effect in (), Physical review letters 107, 137202 (2011).
- Song et al. [2020] G. Song, J. Su, S. Fang, J. Tong, X. Xu, H. Yang, and N. Zhang, Modified crystal structure, dielectric and magnetic properties of cr doped ceramic, Physica B: Condensed Matter 589, 412185 (2020).
- Habib et al. [2017] Z. Habib, M. Ikram, K. Sultan, Abida, S. A. Mir, K. Majid, and K. Asokan, Electronic excitation-induced structural, optical, and magnetic properties of -doped thin films, Applied Physics A 123, 1 (2017).
- Somvanshi et al. [2021] A. Somvanshi, S. Husain, S. Manzoor, N. Zarrin, N. Ahmad, B. Want, and W. Khan, Tuning of magnetic properties and multiferroic nature: case study of cobalt-doped , Applied Physics A 127, 1 (2021).
- Prakash et al. [2019] P. Prakash, V. Sathe, C. Prajapat, A. Nigam, P. Krishna, and A. Das, Spin phonon coupling in doped compounds exhibiting spin reorientation behaviour, Journal of Physics: Condensed Matter 32, 095801 (2019).
- Lee et al. [2011] N. Lee, Y. Choi, M. Ramazanoglu, I. W Ratcliff, V. Kiryukhin, and S.-W. Cheong, Mechanism of exchange striction of ferroelectricity in multiferroic orthorhombic single crystals, Physical Review B 84, 020101 (2011).
- Dubrovskiy et al. [2017] A. Dubrovskiy, N. Pavlovskiy, S. Semenov, K. Y. Terentjev, and K. Shaykhutdinov, The magnetostriction of the hexagonal single crystals, Journal of Magnetism and Magnetic Materials 440, 44 (2017).
- Gütlich et al. [2010] P. Gütlich, E. Bill, and A. X. Trautwein, Mössbauer spectroscopy and transition metal chemistry: fundamentals and applications (Springer Science & Business Media, 2010).
- Angadi et al. [2020] V. J. Angadi, K. Manjunatha, S. Kubrin, A. Kozakov, A. Kochur, A. Nikolskii, I. Petrov, S. Shevtsova, and N. Ayachit, Crystal structure, valence state of ions and magnetic properties of and nanoparticles from -ray diffraction, -ray photoelectron, and össbauer spectroscopy data, Journal of Alloys and Compounds 842, 155805 (2020).
- Piña et al. [2008] P. Piña, R. Buentello, H. Arriola, and E. Nava, Mössbauer spectroscopy of lanthanum and holmium ferrites, Hyperfine Interactions 185, 173 (2008).
- Sternheimer [1950] R. Sternheimer, On nuclear quadrupole moments, Physical Review 80, 102 (1950).
- Sternheimer [1951] R. Sternheimer, On nuclear quadrupole moments, Physical Review 84, 244 (1951).
- Marathe, and Trautwein [1979] L. S. V. R. Marathe, and A. Trautwein, Sternheimer shielding using various approximations, Physical Review A 19, 1852 (1979).
- Brinks et al. [2001] H. Brinks, J. Rodríguez-Carvajal, H. Fjellvåg, A. Kjekshus, and B. Hauback, Crystal and magnetic structure of orthorhombic , Physical Review B 63, 094411 (2001).
- Holmes et al. [1971] L. Holmes, L. Van Uitert, and R. Hecker, Effect of co on magnetic properties of , , and , Journal of Applied Physics 42, 657 (1971).
- Lyubutin et al. [2011] I. Lyubutin, P. Naumov, B. Mill, K. Frolov, and E. Demikhov, Structural and magnetic properties of the iron-containing langasite family () observed by össbauer spectroscopy, Physical Review B 84, 214425 (2011).