mO Haohui[#1]
HeroLT: Benchmarking Heterogeneous Long-Tailed Learning
Abstract
Long-tailed data distributions are prevalent in a variety of domains, including finance, e-commerce, biomedical science, and cyber security. In such scenarios, the performance of machine learning models is often dominated by the head categories, while the learning of tail categories is significantly inadequate. Given abundant studies conducted to alleviate the issue, this work aims to provide a systematic view of long-tailed learning with regard to three pivotal angles: (A1) the characterization of data long-tailedness, (A2) the data complexity of various domains, and (A3) the heterogeneity of emerging tasks. To achieve this, we develop the most comprehensive (to the best of our knowledge) long-tailed learning benchmark named HeroLT, which integrates 13 state-of-the-art algorithms and 6 evaluation metrics on 14 real-world benchmark datasets across 4 tasks from 3 domains. HeroLT with novel angles and extensive experiments (264 in total) enables researchers and practitioners to effectively and fairly evaluate newly proposed methods compared with existing baselines on varying types of datasets. Finally, we conclude by highlighting the significant applications of long-tailed learning and identifying several promising future directions. For accessibility and reproducibility, we open-source our benchmark HeroLT and corresponding results at https://github.com/SSSKJ/HeroLT.
1 Introduction
In the era of big data, many high-impact domains, such as finance [1, 2], e-commerce [3, 4, 5], biomedical science [6, 7], and cyber security [8, 9], naturally exhibit complex and long-tailed data distributions, where a few head categories111Long-tailed problems occur in labels or input data (like degrees of nodes), collectively named as category. are well-studied with abundant data, while the massive tail categories are under-explored with scarce data. To name a few, in financial transaction networks, the majority of transactions fall into a few head classes that are considered normal, like wire transfers and credit card payments. However, there are a large number of tail classes that correspond to a variety of fraudulent transaction types, such as synthetic identity transactions and money laundering. Although fraudulent transactions rarely occur, detecting them is essential for preventing unexpected financial loss [10, 11]. Another example is antibiotic resistance genes, which can be classified based on the antibiotic class they confer to and their transferable ability. Genes with mobility and strong human pathogenicity may not be detected frequently and can be viewed as tail classes, but these resistance genes have the potential to be transmitted from the environment to bacteria in humans, thereby posing an increasing global threat to human health and the treatment of critical diseases [12, 13].
To address long-tailed problems, massive long-tailed learning studies have been conducted in recent years. Lin et al. [14] propose focal loss, a cost-sensitive learning method, to effectively address the data imbalance by reshaping the standard cross-entropy loss. Zhao et al. [15] tackle the problem by interpolating tail node embeddings and generating new edges to augment the original graph. The advancements in tackling long-tailed problems drove the publication of several studies on the survey of long-tailed problems [16, 17, 18, 19, 20], which generally categorize the existing works with respect to the different types of learning algorithms (e.g., re-sampling [21, 22], cost-sensitive learning [23, 24], transfer learning [25, 26], decoupled training [27, 28], and meta learning [29, 30, 31]).
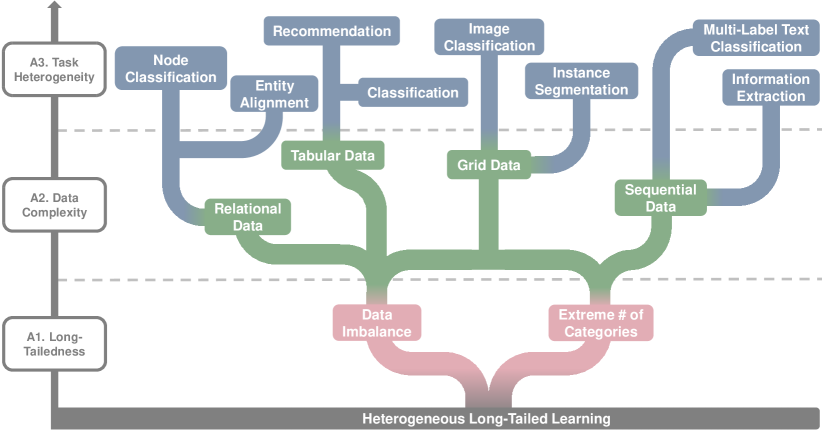
Despite tremendous progress, some pivotal questions largely remain unresolved, e.g., how can we characterize the extent of long-tailedness of given data? how do long-tailed algorithms perform with regard to different tasks on different domains? To fill the gap, this work aims to provide a systematic view of long-tailed learning with regard to three pivotal angles in Fig. 1: (A1) the characterization of data long-tailedness: long-tailed data exhibits a highly skewed data distribution and an extensive number of categories; (A2) the data complexity of various domains: a wide range of complex domains may naturally encounter long-tailed distribution, e.g., tabular data, sequential data, grid data, and relational data; and (A3) the heterogeneity of emerging tasks: it highlights the need to consider the applicability and limitations of existing methods on heterogeneous tasks. With three major angles in long-tailed learning, we design extensive experiments that conduct 13 state-of-the-art algorithms and 6 evaluation metrics on 14 real-world benchmark datasets across 4 tasks from 3 domains.
Key Takeaways: Through extensive experiments (see Sec. 3), we find (1) most works mainly focus on data imbalance while paying less attention to the extreme number of categories in the long-tailed distribution; (2) surprisingly none of the algorithms statistically outperforms others across all tasks and domains, emphasizing the importance of algorithm selection in terms of scenarios.
In general, we summarize the main contributions of HeroLT as below:
-
Comprehensive Benchmark. We conduct a comprehensive review and examine long-tailed learning concerning three pivotal angles: (A1) the characterization of data long-tailedness, (A2) the data complexity of various domains, and (A3) the heterogeneity of emerging tasks.
-
Novel Metric. We investigate previous quantitative metrics of long-tailedness (LT) and introduce Pareto-LT Ratio as a new metric for better measuring datasets.
-
Insights and Future Directions. With comprehensive results, our study highlights the importance of characterizing the extent of long-tailedness and algorithm selection while identifying open problems and opportunities to facilitate future research.
-
The Open-Sourced Toolbox. We provide a fair and accessible performance evaluation of 13 state-of-the-art methods on multiple benchmark datasets using accuracy-based and ranking-based evaluation metrics at https://github.com/SSSKJ/HeroLT.
2 HeroLT: Benchmarking Heterogeneous Long-Tailed Learning
2.1 Preliminaries and Problem Definition
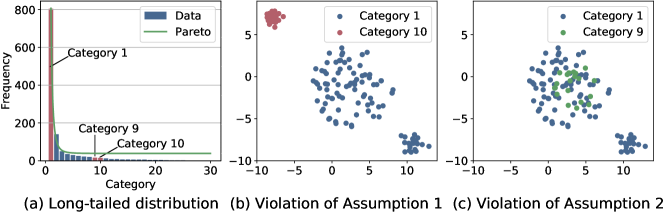
Here we provide a general definition of long-tailed learning as follows. Given a long-tailed dataset of samples from categories, let denote the label set of category, where a sample may belong to one or more categories. For example, in image classification, one sample belongs to one category; in document classification, one document is often associated with multiple categories (i.e., topics). For simplicity, we represent , where , denotes the subset of samples belong to category , and the size of each category following a descending order. As an instantiation, a synthetic long-tailed dataset is given in Fig. 2(a). Categories with massive samples refer to head categories (e.g., Category 1), while categories with only a few samples refer to tail categories (e.g., Category 9, 10). Without the loss of generality, we make the following assumptions in long-tailed learning regarding the support region of head and tail categories.
Assumption 1 (Smoothness Assumption for Head Category).
Given a long-tailed dataset, the distribution of the support region of each head category is sufficiently smooth.
Assumption 2 (Compactness Assumption for Tail Category).
Given a long-tailed dataset, the tail category samples can be represented as a compact cluster in the feature space.
These assumptions ensure that tail categories are identifiable and meaningful. If Assumption 1 of smoothness is violated, then it is challenging to identify the head category clearly. For example in Fig. 2(b), Category 1 consists of multiple clusters, and the cluster at the right bottom corner may be misclassified as a tail category. Similarly, if Assumption 2 of compactness is violated, as seen in Fig. 2(c), Category 9 is uniformly distributed in feature space, then no method can outperform random sampling. Based on the above assumptions, we give the definition of long-tailed learning.
Problem 1.
Long-Tailed Learning.
Given a training set of samples from distinct categories following long-tailed distribution, and the label set of category . In certain scenarios, each sample is associated with one category, while in other scenarios, samples can be associated with multiple categories.
Find a function that gives accurate label predictions on both head and tail categories.
2.2 Benchmark Angles in HeroLT
Angle 1: Long-Tailedness in Terms of Data Imbalance and Extreme Number of Categories.
While extensive public datasets and numerous algorithms are available for benchmarking, these datasets or algorithms often exhibit varying extents of long-tailedness or focus on solving specific characteristics of long-tailed problems, making it challenging to select appropriate datasets and baselines for evaluating new long-tailed algorithms. Two key properties of long-tail distributed data lie in highly skewed data distribution and an extreme number of categories. The former introduces a significant difference in sample sizes between head and tail categories, resulting in a bias towards the head categories[19], while the latter poses challenges in learning classification boundaries due to the increasing number of categories [72, 73].
| Metric name | Computation | Description |
| Imbalance Factor [74] | Ratio to the size of largest and smallest categories. | |
| Gini Coefficient [20] | Relative mean absolute differences between category sizes. | |
| Pareto-LT Ratio | The number of categories of the last 20% samples to the number of categories of the rest 80% samples. |
To measure the long-tailedness of a dataset, we introduce three metrics in Table 1. Firstly, a commonly used metric is imbalance factor (IF) [74], and a value closer to 1 means a more balanced dataset. Secondly, Yang et al. [20] propose using Gini coefficient as a metric to quantify long-tailedness. It ranges from 0 to 1, where a smaller value indicates a more balanced dataset. IF quantifies data imbalance between the most majority and the most minority categories, while Gini coefficient measures overall imbalance, unaffected by extreme samples or absolute data size. However, the two metrics pay more attention to data imbalance and may not reflect the number of categories. Therefore, we propose using Pareto-LT Ratio to jointly evaluate the two aspects of the data long-tailedness. Intuitively, the higher the skewness of the data distribution, the higher Pareto-LT Ratio will be; the more number of categories, the higher the value of Pareto-LT Ratio.
In light of three long-tailedness metrics, we gain a better understanding of which datasets and baselines to consider when evaluating a newly proposed algorithm.
-
When all three metrics (Imbalance factor, Gini coefficient, Pareto-LT Ratio) have large values, it indicates a dataset with a severe long-tailed distribution, necessitating an algorithm that addresses both data imbalance and the extreme number of categories.
-
If Gini coefficient and IF are relatively small, but Pareto-LT Ratio is large, the dataset may have the extreme number of categories, yet relatively balanced samples in head and tail categories. In such cases, methods as extreme classification [75, 76] and meta learning [29, 30, 31] would be preferred.
-
If all three metrics are small, the extent of the long-tailedness of the dataset may be small, and ordinary machine learning methods may achieve decent performance.
We show the long-tailedness of benchmark datasets (Table 2), analyze whether long-tailed algorithms are specifically designed to address data imbalance and an extreme number of categories (Appx.B.2), and provide a comprehensive experimental analysis (Sec.3).
Angle 2: Data Complexity with 14 Datasets across 3 Domains.
Most existing long-tailed learning benchmarks predominantly focus on long-tailed image datasets [16, 17, 18, 19, 20]. However, in real-world applications, various types of data including tabular data, grid data, sequential data, and relational data, may face long-tailed problems. To fill this gap, we consider data complexity based on the types of data with long-tailed distribution.
-
Tabular data comprises samples (rows) with the same set of features (columns) and is used in practical applications (e.g., medicine, finance, and e-commerce). Specifically, MovieLens [59], BookCrossing [60], MovieTweetings [61] and Yelp [62] are long-tailed tabular datasets, where the item or user behavior may follow the long-tailed distribution, that is, the majority of items or user behaviors only have limited observations.
-
Sequential data denotes that data points in the dataset are dependent on the other points. A common example is a time series such as S&P 500 Daily Changes [40], where the input (price over date) shows a long-tailed distribution. Another example of sequential data is text composed of manuscripts, messages, and reviews, such as Wikipedia [69] containing Wikipedia articles with the long-tailed distribution of Wikipedia categories.
-
Grid data records regularly spaced samples over an area. For example, images can be viewed as grid data by mapping grid cells onto pixels one for one. The labels of images often exhibit long-tailed distribution, as observed in commonly used datasets like ImageNet [42], iNatural [63], and LVIS [64]. Furthermore, HOI categories in HICO-DET [67] and V_COCO [68], which are designed for human-object interaction detection in images, follow the long-tailed distribution. Videos can be regarded as a combination of sequential and grid data. In INSVIDEO dataset[65] for micro-video, hashtags exhibit long-tailed distribution. While the NYU-Depth dataset [66], which is composed of video sequences as recorded by depth cameras, exhibits a long-tailed per-pixel depth.
-
Relational data organizes data points with defined relationships. One specific type of relational data is represented by graphs, which consist of nodes connected by edges. Therefore, in addition to long-tailed distributions in node classes, node degrees, referring to the number of edges connected to a node, may exhibit a long-tailed distribution [33]. It is frequently observed that the majority of nodes have only a few connected edges, while only a small number of nodes have a large number of connected edges, as seen in datasets like Cora [54], CiteSeer [55], and Amazon [56]. Moreover, in knowledge graphs like YAGO [57] and DBpedia [58], the distribution of entities may exhibit long-tailed distribution, with only a few entities densely connected to others.
In HeroLT, we collect 14 datasets of various types (sequential, grid, and relational data) across 3 domains (natural language processing, computer vision, and graph mining) as discussed in Appx. B.3. Table 2 shows data statistics (e.g., size, #categories) and long-tailedness of these datasets.
| Data Statistics | Long-Tailedness | ||||||
| Dataset | Data | # of Categories | Size | # of Edges | IF | Gini | Pareto |
| EURLEX-4K [69] | Sequential | 3,956 | 15,499 | - | 1,024 | 0.342 | 3.968 |
| AMAZONCat-13K [69] | Sequential | 13,330 | 1,186,239 | - | 355,211 | 0.327 | 20.000 |
| Wiki10-31K [69] | Sequential | 30,938 | 14,146 | - | 11,411 | 0.312 | 4.115 |
| ImageNet-LT [42] | Grid | 1,000 | 115,846 | - | 256 | 0.517 | 1.339 |
| Places-LT [42] | Grid | 365 | 62,500 | - | 996 | 0.610 | 2.387 |
| iNatural 2018 [63] | Grid | 8,142 | 437,513 | - | 500 | 0.647 | 1.658 |
| CIFAR 10-LT (100) [74] | Grid | 10 | 12,406 | - | 100 | 0.617 | 1.751 |
| CIFAR 10-LT (50) [74] | Grid | 10 | 13,996 | - | 50 | 0.593 | 1.751 |
| CIFAR 10-LT (10) [74] | Grid | 10 | 20,431 | - | 10 | 0.520 | 0.833 |
| CIFAR 100-LT (100) [74] | Grid | 100 | 10,847 | - | 100 | 0.498 | 1.972 |
| CIFAR 100-LT (50) [74] | Grid | 100 | 12,608 | - | 50 | 0.488 | 1.590 |
| CIFAR 100-LT (10) [74] | Grid | 100 | 19,573 | - | 10 | 0.447 | 0.836 |
| LVIS v0.5 [64] | Grid | 1,231 | 693,958 | - | 26,148 | 0.381 | 6.250 |
| Cora-Full [54] | Relational | 70 | 19,793 | 146,635 | 62 | 0.321 | 0.919 |
| Wiki [77] | Relational | 17 | 2,405 | 25,597 | 45 | 0.414 | 1.000 |
| Email [78] | Relational | 42 | 1,005 | 25,934 | 109 | 0.413 | 1.263 |
| Amazon-Clothing [56] | Relational | 77 | 24,919 | 208,279 | 10 | 0.343 | 0.814 |
| Amazon-Electronics [56] | Relational | 167 | 42,318 | 129,430 | 9 | 0.329 | 0.600 |
Angle 3: Task Heterogeneity with 13 Algorithms on 4 Tasks.
Visual recognition has long been recognized as a significant aspect of the study of long-tailed problems. Beyond that, however, real-world applications require different tasks with unique learning objectives, presenting unique challenges for long-tailed algorithms. Despite its importance, this crucial angle has not been well explored in existing benchmarks. To fill this gap, we aim to benchmark long-tailed algorithms based on various tasks they are designed to solve.
-
Multi-label text classification task [50, 51, 52, 79] involves assigning the most relevant subset of class labels from an extremely large label set to each document. However, the extremely large label space often leads to significant data scarcity, particularly for rare labels in the tail. Consequently, many long-tailed algorithms are specifically designed to address the long-tailed problem in this task. Additionally, tasks such as sentence-level few-shot relation classification [80] and information extraction (containing three sub-tasks named relation extraction, entity recognition, and event detection) [53] are also frequently addressed by long-tailed algorithms.
-
Image classification [28, 41, 42, 43, 44, 45, 46], which involves assigning a label to an entire image, is a widely studied task in long-tailed learning that received extensive research attention. Furthermore, there are some long-tailed algorithms focusing on similar tasks, including out-of-distribution detection [81, 82], image retrieval [83, 84], image generation [85, 86], visual relationship recognition [87, 88] and video classification [65, 89].
-
Instance segmentation [47, 48] is a common and crucial task that gained significant attention in the development of long-tailed algorithms aimed at enhancing the performance of tail classes. It involves the identification and separation of individual objects within an image, including the detection of object boundaries and the assignment of a unique label to each object. Object detection [90, 91] is a similar task for which algorithms are proposed to address long-tailed problems.
-
Node classification task [15, 32, 33, 34] involves assigning labels to nodes in a graph based on node features and connections between them. The emergence of long-tailed algorithms for this task is relatively recent, but the development is flourishing. Additionally, there are some long-tailed learning studies addressing entity alignment tasks [35, 36] in knowledge graphs.
In HeroLT, we have a comprehensive collection of algorithms for multi-label text classification, image classification, instance segmentation, and node classification tasks, as shown in Table 3. We discuss what technologies the algorithms use and how they solve long-tailed problems in Appx. B.2.
| Algorithm | Venue | Long-tailedness | Task |
| X-Transformer [50] | 20KDD | Data imbalance, extreme # of categories | Multi-label text classification |
| XR-Transformer [51] | 21NeurIPS | Data imbalance, extreme # of categories | Multi-label text classification |
| XR-Linear [52] | 22KDD | Data imbalance, extreme # of categories | Multi-label text classification |
| BBN [41] | 20CVPR | Data imbalance | Image classification |
| BALMS [47] | 20NeurIPS | Data imbalance | Image classification, Instance segmentation |
| OLTR [42] | 19CVPR | Data imbalance, extreme # of categories | Image classification |
| TDE [43] | 20NeurIPS | Data imbalance, extreme # of categories | Image classification |
| MiSLAS [44] | 21CVPR | Data imbalance | Image classification |
| Decoupling [28] | 20ICLR | Data imbalance | Image classification |
| GraphSMOTE [15] | 21WSDM | Data imbalance | Node classification |
| ImGAGN [32] | 21KDD | Data imbalance | Node classification |
| TailGNN [33] | 21KDD | Data imbalance, extreme # of categories | Node classification |
| LTE4G [34] | 22CIKM | Data imbalance, extreme # of categories | Node classification |
3 Experiment Results and Analyses
We conduct extensive experiments to further answer the question: how do long-tailed learning algorithms perform with regard to different tasks on different domains? In the following subsections, we present the performance of 13 state-of-the-art algorithms on 4 typical long-tailed learning tasks across natural language processing, computer vision, and graph mining.
3.1 Experiment Setting
Hyperparameter Settings. For all the 13 algorithms in HeroLT, we use their default hyperparameter settings in the original paper for a fair comparison. Refer to the Appx. C.1 for more information. Evaluation Metrics. We evaluate different long-tailed algorithms by several basic metrics, which are divided into accuracy-based metrics, including accuracy (Acc) [92], precision [93], recall [93], and balanced accuracy (bAcc) [93]; ranking-based metrics like mean average precision (MAP) [94]; and running time for quantifying the performance of long-tailed datasets. The computation formula and description of the metrics are outlined in Table 8 in Appx. C.2.
3.2 Algorithm Performance on Multi-Label Text Classification
| Dataset | Method | Acc | Precision | Recall | MAP | Time (s) | ||||||||
| @1 | @3 | @5 | @1 | @3 | @5 | @1 | @3 | @5 | @1 | @3 | @5 | |||
| Eurlex- 4K | XR-Transformer | 88.2 | 75.8 | 62.8 | 88.2 | 75.8 | 62.8 | 17.9 | 45.2 | 61.1 | 88.2 | 82.0 | 75.6 | 66.9 |
| X-Transformer | 87.0 | 75.2 | 62.9 | 87.0 | 75.2 | 62.9 | 17.7 | 44.8 | 61.2 | 87.0 | 81.1 | 75.1 | 433.9 | |
| XR-Linear | 82.1 | 69.6 | 58.2 | 82.1 | 69.6 | 58.2 | 16.6 | 41.4 | 56.6 | 82.1 | 75.9 | 69.9 | 0.2 | |
| AmazonCat- 13K | XR-Transformer | 96.7 | 83.6 | 67.9 | 96.7 | 83.6 | 67.9 | 27.7 | 63.3 | 79.0 | 96.7 | 90.5 | 83.1 | 78.3 |
| X-Transformer | 96.7 | 83.9 | 68.6 | 96.7 | 83.9 | 68.6 | 27.6 | 63.4 | 79.7 | 96.7 | 90.6 | 83.4 | 428.6 | |
| XR-Linear | 93.0 | 78.9 | 64.3 | 93.0 | 78.9 | 64.3 | 26.3 | 59.7 | 75.2 | 93.0 | 86.1 | 78.9 | 0.3 | |
| Wiki10- 31K | XR-Transformer | 88.0 | 79.5 | 69.7 | 88.0 | 79.5 | 69.7 | 5.3 | 14.0 | 20.1 | 88.0 | 83.9 | 79.2 | 117.3 |
| X-Transformer | 88.5 | 78.5 | 69.1 | 88.5 | 78.5 | 69.1 | 5.3 | 13.8 | 19.8 | 88.5 | 83.6 | 78.7 | 433.2 | |
| XR-Linear | 84.6 | 73.0 | 64.3 | 84.6 | 73.0 | 64.3 | 5.0 | 12.7 | 18.4 | 84.6 | 78.7 | 73.7 | 1.1 | |
In Table 4, we provide a performance comparison of three methods for multi-label text classification tasks on sequential datasets. We find: (1) Among these methods, XR-Transformer and X-Transformer demonstrate comparably superior performance on multiple metrics. On Eurlex-4K, XR-Transformer achieves a 1.37% improvement in ACC@1 compared to the second-best method. On AmazonCat-13K, X-Transformer exhibits a 1.03% improvement in Acc@5 than the suboptimal method. (2) Conversely, XR-Linear consistently exhibits the poorest performance across all three datasets, which verifies the effectiveness of recursive learning of transformer encoders than linear methods. However, XR-Linear is more than 100x faster than XR-Transformer, making it suitable for scenarios with large dataset sizes and strict requirements on time-consuming. (3) Notably, all methods exhibit a limitation in effectively recognizing certain classes, as indicated by the observed low recalls across all datasets.
3.3 Algorithm Performance on Image Classification and Instance Segmentation
| Dataset | Task | Method | Acc | Precision | Recall | MAP | Time (s) | |||
| Many | Medium | Few | Overall | (bAcc) | ||||||
| ImageNet-LT | Image classification | BBN | 59.4 | 45.4 | 16.3 | 46.6 | 47.5 | 46.6 | 24.9 | 43.0 |
| BALMS | 50.1 | 39.6 | 25.3 | 41.6 | 41.2 | 41.6 | 20.6 | 29.0 | ||
| OLTR | 46.0 | 36.9 | 18.4 | 37.8 | 37.2 | 7.8 | 16.9 | 36.9 | ||
| TDE | 61.6 | 47.2 | 30.5 | 50.5 | 50.5 | 50.8 | 29.0 | 30.9 | ||
| MiSLAS | 60.9 | 46.8 | 32.5 | 50.0 | 39.0 | 38.0 | 21.0 | 18.9 | ||
| Decoupling | 58.4 | 43.7 | 28.2 | 47.4 | 35.2 | 36.1 | 19.4 | 21.8 | ||
| Places-LT | Image classification | BBN | 34.8 | 32.0 | 5.8 | 27.5 | 30.7 | 27.5 | 9.4 | 15.4 |
| BALMS | 41.0 | 39.9 | 30.2 | 38.3 | 38.1 | 38.3 | 17.1 | 29.0 | ||
| OLTR | 44.0 | 40.6 | 28.5 | 39.3 | 39.5 | 39.3 | 17.9 | 30.6 | ||
| TDE | 33.9 | 27.8 | 19.3 | 28.4 | 28.4 | 29.7 | 10.4 | 18.6 | ||
| MiSLAS | 42.4 | 41.8 | 34.7 | 40.5 | 41.0 | 40.5 | 19.2 | 16.2 | ||
| Decoupling | 40.6 | 39.1 | 28.6 | 37.6 | 37.6 | 38.2 | 16.7 | 28.9 | ||
| iNatural 2018 | Image classification | BBN | 61.8 | 73.5 | 67.7 | 69.7 | 72.8 | 69.7 | 55.9 | 29.3 |
| BALMS | 61.8 | 64.6 | 66.4 | 65.1 | 68.1 | 65.1 | 50.2 | 24.1 | ||
| OLTR | 67.9 | 50.7 | 37.8 | 46.8 | 51.4 | 46.8 | 33.2 | 32.5 | ||
| TDE | 67.8 | 63.9 | 55.2 | 60.9 | 60.9 | 63.2 | 45.4 | 24.8 | ||
| MiSLAS | 72.3 | 72.3 | 70.7 | 71.6 | 74.6 | 71.6 | 58.0 | 19.6 | ||
| Decoupling | 74.3 | 72.4 | 71.2 | 72.1 | 72.1 | 75.4 | 58.9 | 23.9 | ||
| LVIS v0.5 | Instance segmentation | BALMS | 62.9 | 34.7 | 16.1 | 60.0 | 37.1 | 46.8 | 37.1 | 1436.1 |
Among the considered algorithms, BBN and MisLAS employ mixup techniques; BALMS and OLTR utilize meta-learning; TDE uses causal inference; and MisLAS, Decoupling, and BALMS decouple the learning process. We have the following observations from the results in Table 5: (1) No single technique (e.g., meta-learning, decoupled training, or mixup) can consistently perform the best across all tasks and datasets, and there are limited algorithms that consider both classification and segmentation tasks. Therefore, in contrast to taxonomy based on techniques in methods, the three novel angles we propose may be more suitable for benchmarking. (2) MisLAS consistently performs top two best in accuracy on four natural long-tailed datasets. In particular, MisLAS exhibits a remarkable overall accuracy of 40.5% on Places-LT dataset, surpassing the suboptimal method by 4.65%. The superiority of MisLAS is further evident in the tail category, where its few-shot accuracy surpasses other methods by 9.81% on Places-LT. (3) The few-shot accuracy is often lower than the many-shot accuracy for all methods. For example, on Image-LT and Places-LT, BBN exhibits particularly poor performance in terms of few-shot accuracy, with a decrease of 72.56% and 83.33% respectively compared to many-shot accuracy. But on iNatural 2018, BALMS achieves a few-shot accuracy of 66.4%, surpassing many-shot accuracy of 61.7% and medium-shot accuracy of 64.8%.
| Dataset | Method | Acc | Precision | Recall (bAcc) | MAP | Time (s) | ||||||||
| 100 | 50 | 10 | 100 | 50 | 10 | 100 | 50 | 10 | 100 | 50 | 10 | |||
| CIFAR-10-LT | BBN | 80.7 | 83.4 | 88.7 | 81.0 | 84.0 | 88.8 | 80.7 | 83.4 | 88.7 | 67.5 | 71.8 | 80.0 | 5.2 |
| BALMS | 84.2 | 86.7 | 91.5 | 84.3 | 86.7 | 91.5 | 84.2 | 86.7 | 91.5 | 72.8 | 76.9 | 84.8 | 1.7 | |
| OLTR | 88.7 | 90.8 | 93.3 | 90.3 | 91.6 | 93.5 | 88.7 | 90.8 | 93.3 | 80.6 | 83.8 | 87.8 | 9.3 | |
| TDE | 80.9 | 82.9 | 88.3 | 80.9 | 82.9 | 88.3 | 81.4 | 83 | 88.2 | 68.0 | 70.7 | 79.2 | 1.8 | |
| MiSLAS | 82.5 | 85.7 | 90.0 | 83.4 | 86.1 | 90.1 | 82.5 | 85.7 | 90.1 | 70.5 | 75.2 | 82.3 | 8.2 | |
| Decoupling | 53.5 | 61.2 | 73.4 | 53.5 | 61.2 | 73.4 | 55.4 | 62.3 | 73.5 | 34.0 | 42.0 | 57.3 | 1.8 | |
| CIFAR-100-LT | BBN | 40.9 | 46.7 | 59.7 | 43.3 | 48.0 | 59.9 | 40.9 | 46.7 | 59.7 | 19.9 | 24.5 | 38.2 | 4.3 |
| BALMS | 51.0 | 56.2 | 55.2 | 50.0 | 56.0 | 54.8 | 51.0 | 56.2 | 55.2 | 29.5 | 34.9 | 33.6 | 2.2 | |
| OLTR | 67.6 | 72.0 | 77.2 | 74.0 | 77.2 | 79.0 | 67.6 | 72.0 | 77.2 | 49.8 | 55.2 | 61.6 | 9.3 | |
| TDE | 43.5 | 48.9 | 58.9 | 43.5 | 48.9 | 58.9 | 42.8 | 49.3 | 59.7 | 21.0 | 26.0 | 36.8 | 1.7 | |
| MiSLAS | 47.0 | 52.3 | 63.3 | 46.5 | 52.5 | 63.4 | 47.0 | 52.3 | 63.2 | 25.4 | 30.5 | 42.3 | 7.2 | |
| Decoupling | 34.0 | 36.4 | 51.5 | 33.9 | 36.4 | 51.5 | 32.2 | 35.7 | 51.4 | 14.0 | 15.8 | 29.2 | 1.8 | |
Similarly, from the results on semi-synthetic long-tailed datasets (Table 6), we find: (1) OLTR greatly outperforms the other methods with different imbalance factors on all datasets. In particular, when IF is set to 10 on CIFAR-100-LT, OLTR achieves an accuracy of 77.2%, surpassing the suboptimal MisLAS by 21.96%. (2) BALMS, another decoupled learning-based method, shows the second-best accuracy performance on the synthetic CIFAR-10-LT and CIFAR-100-LT with varying degrees of IF, suggesting that decoupled learning may have potential in handling long-tailed problems. (3) Moreover, the performance of nearly all methods exhibits a decline as IF increases (more severe imbalance). On CIFAR-10-LT, the largest performance decrease is for the decoupling method, resulting in a 27.11% decrease in accuracy from 73.4% to 53.5%. Conversely, OLTR shows the smallest performance decrease, with a mere 4.93% decrease in accuracy. Similarly, on CIFAR-100-LT, Decoupling shows the largest decline in performance with a decrease in accuracy of 33.98%. (4) CIFAR-100-LT dataset appears more affected than CIFAR-10-LT under the different settings of imbalance factor, possibly because it has a larger number of categories and thus has a more severe long-tailed phenomenon.
3.4 Algorithm Performance on Node Classification
From the experimental results of various long-tailed algorithms for node classification on relational datasets (Table 7), we have: (1) No method consistently outperforms all others across all datasets. Even on the same dataset, the performance of different runs may have large variances, e.g., LTE4G on Wiki. (2) Tail-GNN exhibits superior performance on Cora-full and Amazon_clothing datasets. Especially on Cora-full, Tail-GNN achieves a 4.93% higher accuracy than the second-best method. However, the scalability of Tail-GNN shows limitations. It faces out-of-memory problems on Amazon_Eletronics with 42,318 nodes and 129,430 edges. (3) It is worth noting that simple augmentation methods also exhibit promising performance on graphs. For instance, GraphSmote achieves a 3.77% accuracy improvement over suboptimal methods on Wiki dataset. (4) Conversely, the performance of ImGAGN is relatively weak since it considers only one class as the tail class by default. This limitation becomes apparent in datasets with a large number of classes. Nonetheless, ImGAGN shows a performance improvement by adjusting the number of classes considered as tail (here we still show the results based on the default setting for a fair comparison). In addition, ImGAGN is less time-consuming and is 5x faster than LTE4G on the largest Amazon_Eletronics dataset.
| Dataset | Method | Acc | Precision | Recall (bAcc) | mAP | Time (s) |
| Cora-Full | GraphSmote | 60.50.8 | 60.20.8 | 51.90.6 | 54.90.4 | 718.8 |
| ImGAGN | 4.20.8 | 0.20.1 | 1.50.1 | 2.70.1 | 69.6 | |
| Tail-GNN | 63.80.3 | 63.80.4 | 54.60.6 | 66.80.6 | 906.2 | |
| LTE4G | 60.80.5 | 61.50.6 | 54.60.5 | 51.10.9 | 281.6 | |
| Wiki | GraphSmote | 66.00.9 | 66.31.1 | 51.12.0 | 64.41.9 | 52.3 |
| ImGAGN | 45.46.7 | 44.85.0 | 24.54.1 | 64.16.2 | 14.3 | |
| Tail-GNN | 63.60.7 | 64.01.4 | 47.71.1 | 65.02.1 | 22.5 | |
| LTE4G | 58.218.5 | 60.220.1 | 48.912.5 | 59.316.5 | 53.1 | |
| GraphSmote | 58.31.2 | 54.42.0 | 34.21.4 | 44.62.4 | 126.2 | |
| ImGAGN | 42.71.9 | 38.42.5 | 23.01.4 | 35.72.2 | 19.7 | |
| Tail-GNN | 56.51.7 | 55.60.4 | 34.51.6 | 58.03.0 | 8.6 | |
| LTE4G | 58.72.0 | 54.12.5 | 34.32.1 | 47.02.1 | 72.1 | |
| Amazon_Clothing | GraphSmote | 66.30.4 | 64.90.3 | 63.20.4 | 57.60.9 | 919.1 |
| ImGAGN | 30.31.1 | 23.31.2 | 12.80.7 | 32.00.7 | 89.6 | |
| Tail-GNN | 69.20.6 | 67.70.5 | 65.90.5 | 68.70.1 | 768.7 | |
| LTE4G | 65.60.6 | 64.80.5 | 64.20.6 | 54.32.7 | 349.7 | |
| Amazon_Eletronics | GraphSmote | 56.20.5 | 55.60.4 | 51.70.5 | 36.21.9 | 3406.2 |
| ImGAGN | 17.11.1 | 12.30.7 | 7.40.6 | 16.80.7 | 218.5 | |
| Tail-GNN | OOM | OOM | OOM | OOM | OOM | |
| LTE4G | 55.80.4 | 56.10.3 | 53.00.5 | 32.72.2 | 1112.8 |
4 Related Work
Recently, several papers that review long-tailed problems have been published. One of the earliest works [18] aims to improve the performance of long-tailed algorithms through a reasonable combination of existing tricks. Following this work, [20] conducts a survey on long-tailed visual recognition and shows a detailed taxonomy of existing methods. Similarly, [17] divides long-tailed methods into three categories, namely, training stage, fine-tuning stage, and inference stage. [16] groups methods based on balanced data, balanced feature representation, balanced loss, and balanced prediction. [19] categorizes them into class re-balancing, information augmentation, and module improvement. Although these papers summarize studies on long-tailed visual recognition, they pay less attention to the extent of long-tailedness and fail to consider data complexity and task heterogeneity.
Next, we discuss the similarities and differences of long-tailed learning with some related areas, such as imbalanced learning and few-shot learning. Imbalanced Learning addresses the problem of learning from imbalanced data, where minority classes contain significantly fewer training instances than majority classes. In imbalance learning, the class numbers may be small, while the number of minority samples is not necessarily small. But for long-tailed learning, the number of classes is larger and samples in tail classes are often very scarce. Few-shot Learning aims to train well-performing models from limited samples with supervised information. Long-tailed datasets, like few-shot learning datasets, have limited labeled samples in tail classes but with an imbalanced distribution. In contrast, few-shot learning datasets tend to be more balanced.
5 Conclusions and Future Work
In this paper, we introduce HeroLT, the most comprehensive heterogeneous long-tailed learning benchmark with 13 state-of-the-art algorithms and 6 evaluation metrics on 14 real-world benchmark datasets across 4 tasks from 3 domains. Based on the analyses of three pivotal angles, we gain valuable insights into the characterization of data long-tailedness, the data complexity of various domains, and the heterogeneity of emerging tasks. We release our benchmark and evaluations at https://github.com/SSSKJ/HeroLT.
On top of them, we suggest intellectual challenges and promising research directions in long-tailed learning: (C1) Theoretic Challenge: Current work lacks sufficient theoretical tools for analyzing long-tailed models, such as their generalization performance. (C2) Algorithmic Challenge: Existing research typically focuses on one task in one domain, while there is a trend to consider multiple forms of input data (e.g., text and images) by multi-modal learning [95, 96, 97], or to solve multiple learning tasks (e.g., segmentation and classification) by multi-task learning [98, 99]. (C3) Application Challenge: In open environments, many datasets exhibit long-tailed distributions. However, long-tailed problems in domains like antibiotic resistance genes [12, 13] receive insufficient attention.
References
- [1] William J Reed. The pareto, zipf and other power laws. Economics letters, 74(1):15–19, 2001.
- [2] Daixin Wang, Jianbin Lin, Peng Cui, Quanhui Jia, Zhen Wang, Yanming Fang, Quan Yu, Jun Zhou, Shuang Yang, and Yuan Qi. A semi-supervised graph attentive network for financial fraud detection. In 2019 IEEE International Conference on Data Mining (ICDM), pages 598–607. IEEE, 2019.
- [3] Yoon-Joo Park and Alexander Tuzhilin. The long tail of recommender systems and how to leverage it. In Proceedings of the 2008 ACM conference on Recommender systems, pages 11–18, 2008.
- [4] Yin Zhang, Derek Zhiyuan Cheng, Tiansheng Yao, Xinyang Yi, Lichan Hong, and Ed H Chi. A model of two tales: Dual transfer learning framework for improved long-tail item recommendation. In Proceedings of the web conference 2021, pages 2220–2231, 2021.
- [5] Shanfeng Wang, Maoguo Gong, Haoliang Li, and Junwei Yang. Multi-objective optimization for long tail recommendation. Knowledge-Based Systems, 104:145–155, 2016.
- [6] Dingwen Zhang, Guohai Huang, Qiang Zhang, Jungong Han, Junwei Han, and Yizhou Yu. Cross-modality deep feature learning for brain tumor segmentation. Pattern Recognition, 110:107562, 2021.
- [7] Lie Ju, Xin Wang, Lin Wang, Tongliang Liu, Xin Zhao, Tom Drummond, Dwarikanath Mahapatra, and Zongyuan Ge. Relational subsets knowledge distillation for long-tailed retinal diseases recognition. In Medical Image Computing and Computer Assisted Intervention–MICCAI 2021: 24th International Conference, Strasbourg, France, September 27–October 1, 2021, Proceedings, Part VIII 24, pages 3–12. Springer, 2021.
- [8] Marshall A Kuypers, Thomas Maillart, and Elisabeth Paté-Cornell. An empirical analysis of cyber security incidents at a large organization. Department of Management Science and Engineering, Stanford University, School of Information, 30, 2016.
- [9] Jiali Wang, Martin Neil, and Norman Fenton. A bayesian network approach for cybersecurity risk assessment implementing and extending the fair model. Computers & Security, 89:101659, 2020.
- [10] Tommie W Singleton and Aaron J Singleton. Fraud auditing and forensic accounting, volume 11. John Wiley and Sons, 2010.
- [11] Leman Akoglu, Hanghang Tong, and Danai Koutra. Graph based anomaly detection and description: a survey. Data mining and knowledge discovery, 29(3):626–688, 2015.
- [12] Gustavo Arango-Argoty, Emily Garner, Amy Pruden, Lenwood S Heath, Peter Vikesland, and Liqing Zhang. Deeparg: a deep learning approach for predicting antibiotic resistance genes from metagenomic data. Microbiome, 6:1–15, 2018.
- [13] Yu Li, Zeling Xu, Wenkai Han, Huiluo Cao, Ramzan Umarov, Aixin Yan, Ming Fan, Huan Chen, Carlos M Duarte, Lihua Li, et al. Hmd-arg: hierarchical multi-task deep learning for annotating antibiotic resistance genes. Microbiome, 9:1–12, 2021.
- [14] Tsung-Yi Lin, Priya Goyal, Ross Girshick, Kaiming He, and Piotr Dollár. Focal loss for dense object detection. In Proceedings of the IEEE international conference on computer vision, pages 2980–2988, 2017.
- [15] Tianxiang Zhao, Xiang Zhang, and Suhang Wang. Graphsmote: Imbalanced node classification on graphs with graph neural networks. In Proceedings of the 14th ACM international conference on web search and data mining, pages 833–841, 2021.
- [16] Chaowei Fang, Dingwen Zhang, Wen Zheng, Xue Li, Le Yang, Lechao Cheng, and Junwei Han. Revisiting long-tailed image classification: Survey and benchmarks with new evaluation metrics. arXiv preprint arXiv:2302.01507, 2023.
- [17] Yu Fu, Liuyu Xiang, Yumna Zahid, Guiguang Ding, Tao Mei, Qiang Shen, and Jungong Han. Long-tailed visual recognition with deep models: A methodological survey and evaluation. Neurocomputing, 509:290–309, 2022.
- [18] Yongshun Zhang, Xiu-Shen Wei, Boyan Zhou, and Jianxin Wu. Bag of tricks for long-tailed visual recognition with deep convolutional neural networks. In Proceedings of the AAAI conference on artificial intelligence, volume 35, pages 3447–3455, 2021.
- [19] Yifan Zhang, Bingyi Kang, Bryan Hooi, Shuicheng Yan, and Jiashi Feng. Deep long-tailed learning: A survey. IEEE Transactions on Pattern Analysis and Machine Intelligence, 2023.
- [20] Lu Yang, He Jiang, Qing Song, and Jun Guo. A survey on long-tailed visual recognition. International Journal of Computer Vision, 130(7):1837–1872, 2022.
- [21] Nitesh V Chawla, Kevin W Bowyer, Lawrence O Hall, and W Philip Kegelmeyer. Smote: synthetic minority over-sampling technique. Journal of artificial intelligence research, 16:321–357, 2002.
- [22] Xu-Ying Liu, Jianxin Wu, and Zhi-Hua Zhou. Exploratory undersampling for class-imbalance learning. IEEE Transactions on Systems, Man, and Cybernetics, Part B (Cybernetics), 39(2):539–550, 2009.
- [23] Kaidi Cao, Colin Wei, Adrien Gaidon, Nikos Arechiga, and Tengyu Ma. Learning imbalanced datasets with label-distribution-aware margin loss. Advances in neural information processing systems, 32, 2019.
- [24] Jiaqi Wang, Wenwei Zhang, Yuhang Zang, Yuhang Cao, Jiangmiao Pang, Tao Gong, Kai Chen, Ziwei Liu, Chen Change Loy, and Dahua Lin. Seesaw loss for long-tailed instance segmentation. In Proceedings of the IEEE/CVF conference on computer vision and pattern recognition, pages 9695–9704, 2021.
- [25] Bo Liu, Haoxiang Li, Hao Kang, Gang Hua, and Nuno Vasconcelos. Gistnet: a geometric structure transfer network for long-tailed recognition. In Proceedings of the IEEE/CVF International Conference on Computer Vision, pages 8209–8218, 2021.
- [26] Tianhao Li, Limin Wang, and Gangshan Wu. Self supervision to distillation for long-tailed visual recognition. In Proceedings of the IEEE/CVF international conference on computer vision, pages 630–639, 2021.
- [27] Songyang Zhang, Zeming Li, Shipeng Yan, Xuming He, and Jian Sun. Distribution alignment: A unified framework for long-tail visual recognition. In Proceedings of the IEEE/CVF conference on computer vision and pattern recognition, pages 2361–2370, 2021.
- [28] Bingyi Kang, Saining Xie, Marcus Rohrbach, Zhicheng Yan, Albert Gordo, Jiashi Feng, and Yannis Kalantidis. Decoupling representation and classifier for long-tailed recognition. In International Conference on Learning Representations, 2020.
- [29] Muhammad Abdullah Jamal, Matthew Brown, Ming-Hsuan Yang, Liqiang Wang, and Boqing Gong. Rethinking class-balanced methods for long-tailed visual recognition from a domain adaptation perspective. In Proceedings of the IEEE/CVF Conference on Computer Vision and Pattern Recognition, pages 7610–7619, 2020.
- [30] Yu-Xiong Wang, Deva Ramanan, and Martial Hebert. Learning to model the tail. In I. Guyon, U. Von Luxburg, S. Bengio, H. Wallach, R. Fergus, S. Vishwanathan, and R. Garnett, editors, Advances in Neural Information Processing Systems, volume 30. Curran Associates, Inc., 2017.
- [31] Jun Shu, Qi Xie, Lixuan Yi, Qian Zhao, Sanping Zhou, Zongben Xu, and Deyu Meng. Meta-weight-net: Learning an explicit mapping for sample weighting. Advances in neural information processing systems, 32, 2019.
- [32] Liang Qu, Huaisheng Zhu, Ruiqi Zheng, Yuhui Shi, and Hongzhi Yin. Imgagn: Imbalanced network embedding via generative adversarial graph networks. In Proceedings of the 27th ACM SIGKDD Conference on Knowledge Discovery and Data Mining, pages 1390–1398, 2021.
- [33] Zemin Liu, Trung-Kien Nguyen, and Yuan Fang. Tail-gnn: Tail-node graph neural networks. In Proceedings of the 27th ACM SIGKDD Conference on Knowledge Discovery and Data Mining, pages 1109–1119, 2021.
- [34] Sukwon Yun, Kibum Kim, Kanghoon Yoon, and Chanyoung Park. Lte4g: Long-tail experts for graph neural networks. In Proceedings of the 31st ACM International Conference on Information and Knowledge Management, pages 2434–2443, 2022.
- [35] Weixin Zeng, Xiang Zhao, Wei Wang, Jiuyang Tang, and Zhen Tan. Degree-aware alignment for entities in tail. In Proceedings of the 43rd International ACM SIGIR Conference on Research and Development in Information Retrieval, pages 811–820, 2020.
- [36] Ermei Cao, Difeng Wang, Jiacheng Huang, and Wei Hu. Open knowledge enrichment for long-tail entities. In Proceedings of The Web Conference 2020, pages 384–394, 2020.
- [37] Xichuan Niu, Bofang Li, Chenliang Li, Rong Xiao, Haochuan Sun, Hongbo Deng, and Zhenzhong Chen. A dual heterogeneous graph attention network to improve long-tail performance for shop search in e-commerce. In Proceedings of the 26th ACM SIGKDD International Conference on Knowledge Discovery and Data Mining, page 3405–3415, New York, NY, USA, 2020.
- [38] Zhihong Chen, Rong Xiao, Chenliang Li, Gangfeng Ye, Haochuan Sun, and Hongbo Deng. Esam: Discriminative domain adaptation with non-displayed items to improve long-tail performance. In Proceedings of the 43rd International ACM SIGIR Conference on Research and Development in Information Retrieval, pages 579–588, 2020.
- [39] Jianwen Yin, Chenghao Liu, Weiqing Wang, Jianling Sun, and Steven CH Hoi. Learning transferrable parameters for long-tailed sequential user behavior modeling. In Proceedings of the 26th ACM SIGKDD International Conference on Knowledge Discovery and Data Mining, pages 359–367, 2020.
- [40] Todd Huster, Jeremy Cohen, Zinan Lin, Kevin Chan, Charles Kamhoua, Nandi O Leslie, Cho-Yu Jason Chiang, and Vyas Sekar. Pareto gan: Extending the representational power of gans to heavy-tailed distributions. In International Conference on Machine Learning, pages 4523–4532. PMLR, 2021.
- [41] Boyan Zhou, Quan Cui, Xiu-Shen Wei, and Zhao-Min Chen. Bbn: Bilateral-branch network with cumulative learning for long-tailed visual recognition. In Proceedings of the IEEE/CVF conference on computer vision and pattern recognition, pages 9719–9728, 2020.
- [42] Ziwei Liu, Zhongqi Miao, Xiaohang Zhan, Jiayun Wang, Boqing Gong, and Stella X Yu. Large-scale long-tailed recognition in an open world. In Proceedings of the IEEE/CVF conference on computer vision and pattern recognition, pages 2537–2546, 2019.
- [43] Kaihua Tang, Jianqiang Huang, and Hanwang Zhang. Long-tailed classification by keeping the good and removing the bad momentum causal effect. Advances in Neural Information Processing Systems, 33:1513–1524, 2020.
- [44] Zhisheng Zhong, Jiequan Cui, Shu Liu, and Jiaya Jia. Improving calibration for long-tailed recognition. In Proceedings of the IEEE/CVF conference on computer vision and pattern recognition, pages 16489–16498, 2021.
- [45] Dong Cao, Xiangyu Zhu, Xingyu Huang, Jianzhu Guo, and Zhen Lei. Domain balancing: Face recognition on long-tailed domains. In Proceedings of the IEEE/CVF Conference on Computer Vision and Pattern Recognition, pages 5671–5679, 2020.
- [46] Yaoyao Zhong, Weihong Deng, Mei Wang, Jiani Hu, Jianteng Peng, Xunqiang Tao, and Yaohai Huang. Unequal-training for deep face recognition with long-tailed noisy data. In Proceedings of the IEEE/CVF conference on computer vision and pattern recognition, pages 7812–7821, 2019.
- [47] Jiawei Ren, Cunjun Yu, Xiao Ma, Haiyu Zhao, Shuai Yi, et al. Balanced meta-softmax for long-tailed visual recognition. Advances in neural information processing systems, 33:4175–4186, 2020.
- [48] Jingru Tan, Changbao Wang, Buyu Li, Quanquan Li, Wanli Ouyang, Changqing Yin, and Junjie Yan. Equalization loss for long-tailed object recognition. In Proceedings of the IEEE/CVF conference on computer vision and pattern recognition, pages 11662–11671, 2020.
- [49] Tao Wang, Yu Li, Bingyi Kang, Junnan Li, Junhao Liew, Sheng Tang, Steven Hoi, and Jiashi Feng. The devil is in classification: A simple framework for long-tail instance segmentation. In Computer Vision–ECCV 2020: 16th European Conference, Glasgow, UK, August 23–28, 2020, Proceedings, Part XIV 16, pages 728–744. Springer, 2020.
- [50] Wei-Cheng Chang, Hsiang-Fu Yu, Kai Zhong, Yiming Yang, and Inderjit S Dhillon. Taming pretrained transformers for extreme multi-label text classification. In Proceedings of the 26th ACM SIGKDD international conference on knowledge discovery and data mining, pages 3163–3171, 2020.
- [51] Jiong Zhang, Wei-Cheng Chang, Hsiang-Fu Yu, and Inderjit Dhillon. Fast multi-resolution transformer fine-tuning for extreme multi-label text classification. Advances in Neural Information Processing Systems, 34:7267–7280, 2021.
- [52] Hsiang-Fu Yu, Jiong Zhang, Wei-Cheng Chang, Jyun-Yu Jiang, Wei Li, and Cho-Jui Hsieh. Pecos: Prediction for enormous and correlated output spaces. In Proceedings of the 28th ACM SIGKDD Conference on Knowledge Discovery and Data Mining, pages 4848–4849, 2022.
- [53] Guoshun Nan, Jiaqi Zeng, Rui Qiao, Zhijiang Guo, and Wei Lu. Uncovering main causalities for long-tailed information extraction. In Proceedings of the 2021 Conference on Empirical Methods in Natural Language Processing, pages 9683–9695, Online and Punta Cana, Dominican Republic, November 2021. Association for Computational Linguistics.
- [54] Aleksandar Bojchevski and Stephan Günnemann. Deep gaussian embedding of graphs: Unsupervised inductive learning via ranking. In International Conference on Learning Representations, 2018.
- [55] C Lee Giles, Kurt D Bollacker, and Steve Lawrence. Citeseer: An automatic citation indexing system. In Proceedings of the third ACM conference on Digital libraries, pages 89–98, 1998.
- [56] Julian McAuley, Rahul Pandey, and Jure Leskovec. Inferring networks of substitutable and complementary products. In Proceedings of the 21th ACM SIGKDD international conference on knowledge discovery and data mining, pages 785–794, 2015.
- [57] Fabian M. Suchanek, Gjergji Kasneci, and Gerhard Weikum. Yago: A core of semantic knowledge. In Proceedings of the 16th International Conference on World Wide Web, WWW ’07, page 697–706, New York, NY, USA, 2007. Association for Computing Machinery.
- [58] Sören Auer, Christian Bizer, Georgi Kobilarov, Jens Lehmann, Richard Cyganiak, and Zachary Ives. Dbpedia: A nucleus for a web of open data. In Proceedings of the 6th International The Semantic Web and 2nd Asian Conference on Asian Semantic Web Conference, ISWC’07/ASWC’07, page 722–735, Berlin, Heidelberg, 2007. Springer-Verlag.
- [59] F Maxwell Harper and Joseph A Konstan. The movielens datasets: History and context. Acm transactions on interactive intelligent systems (tiis), 5(4):1–19, 2015.
- [60] Cai-Nicolas Ziegler, Sean M McNee, Joseph A Konstan, and Georg Lausen. Improving recommendation lists through topic diversification. In Proceedings of the 14th international conference on World Wide Web, pages 22–32, 2005.
- [61] Simon Dooms, Toon De Pessemier, and Luc Martens. Movietweetings: a movie rating dataset collected from twitter. In Workshop on Crowdsourcing and human computation for recommender systems, CrowdRec at RecSys, volume 2013, page 43, 2013.
- [62] Xiao Yu, Xiang Ren, Yizhou Sun, Quanquan Gu, Bradley Sturt, Urvashi Khandelwal, Brandon Norick, and Jiawei Han. Personalized entity recommendation: A heterogeneous information network approach. In Proceedings of the 7th ACM International Conference on Web Search and Data Mining, WSDM ’14, page 283–292, New York, NY, USA, 2014. Association for Computing Machinery.
- [63] Grant Van Horn, Oisin Mac Aodha, Yang Song, Yin Cui, Chen Sun, Alex Shepard, Hartwig Adam, Pietro Perona, and Serge Belongie. The inaturalist species classification and detection dataset. In Proceedings of the IEEE conference on computer vision and pattern recognition, pages 8769–8778, 2018.
- [64] Agrim Gupta, Piotr Dollar, and Ross Girshick. Lvis: A dataset for large vocabulary instance segmentation. In Proceedings of the IEEE/CVF conference on computer vision and pattern recognition, pages 5356–5364, 2019.
- [65] Mengmeng Li, Tian Gan, Meng Liu, Zhiyong Cheng, Jianhua Yin, and Liqiang Nie. Long-tail hashtag recommendation for micro-videos with graph convolutional network. In Proceedings of the 28th ACM International Conference on Information and Knowledge Management, CIKM ’19, page 509–518, New York, NY, USA, 2019. Association for Computing Machinery.
- [66] Nathan Silberman, Derek Hoiem, Pushmeet Kohli, and Rob Fergus. Indoor segmentation and support inference from rgbd images. In European Conference on Computer Vision, 2012.
- [67] Yu-Wei Chao, Zhan Wang, Yugeng He, Jiaxuan Wang, and Jia Deng. HICO: A benchmark for recognizing human-object interactions in images. In Proceedings of the IEEE International Conference on Computer Vision, 2015.
- [68] Saurabh Gupta and Jitendra Malik. Visual semantic role labeling. arXiv preprint arXiv:1505.04474, 2015.
- [69] Ronghui You, Zihan Zhang, Ziye Wang, Suyang Dai, Hiroshi Mamitsuka, and Shanfeng Zhu. Attentionxml: Label tree-based attention-aware deep model for high-performance extreme multi-label text classification. Advances in Neural Information Processing Systems, 32, 2019.
- [70] Lin Xiao, Xiangliang Zhang, Liping Jing, Chi Huang, and Mingyang Song. Does head label help for long-tailed multi-label text classification. In Proceedings of the AAAI Conference on Artificial Intelligence, volume 35, pages 14103–14111, 2021.
- [71] Laurens Van der Maaten and Geoffrey Hinton. Visualizing data using t-sne. Journal of machine learning research, 9(11), 2008.
- [72] Anshul Mittal, Kunal Dahiya, Sheshansh Agrawal, Deepak Saini, Sumeet Agarwal, Purushottam Kar, and Manik Varma. Decaf: Deep extreme classification with label features. In Proceedings of the 14th ACM International Conference on Web Search and Data Mining, pages 49–57, 2021.
- [73] Min-Ling Zhang and Zhi-Hua Zhou. A review on multi-label learning algorithms. IEEE transactions on knowledge and data engineering, 26(8):1819–1837, 2013.
- [74] Yin Cui, Menglin Jia, Tsung-Yi Lin, Yang Song, and Serge Belongie. Class-balanced loss based on effective number of samples. In Proceedings of the IEEE/CVF conference on computer vision and pattern recognition, pages 9268–9277, 2019.
- [75] Deepak Saini, Arnav Kumar Jain, Kushal Dave, Jian Jiao, Amit Singh, Ruofei Zhang, and Manik Varma. Galaxc: Graph neural networks with labelwise attention for extreme classification. In Proceedings of the Web Conference 2021, pages 3733–3744, 2021.
- [76] Kush Bhatia, Himanshu Jain, Purushottam Kar, Manik Varma, and Prateek Jain. Sparse local embeddings for extreme multi-label classification. Advances in neural information processing systems, 28, 2015.
- [77] Péter Mernyei and Cătălina Cangea. Wiki-cs: A wikipedia-based benchmark for graph neural networks. arXiv preprint arXiv:2007.02901, 2020.
- [78] Hao Yin, Austin R. Benson, Jure Leskovec, and David F. Gleich. Local higher-order graph clustering. In Proceedings of the 23rd ACM SIGKDD International Conference on Knowledge Discovery and Data Mining, KDD ’17, page 555–564, New York, NY, USA, 2017. Association for Computing Machinery.
- [79] Jingzhou Liu, Wei-Cheng Chang, Yuexin Wu, and Yiming Yang. Deep learning for extreme multi-label text classification. In Proceedings of the 40th international ACM SIGIR conference on research and development in information retrieval, pages 115–124, 2017.
- [80] Miao Fan, Yeqi Bai, Mingming Sun, and Ping Li. Large margin prototypical network for few-shot relation classification with fine-grained features. In Proceedings of the 28th ACM International Conference on Information and Knowledge Management, CIKM ’19, page 2353–2356, New York, NY, USA, 2019. Association for Computing Machinery.
- [81] Haotao Wang, Aston Zhang, Yi Zhu, Shuai Zheng, Mu Li, Alex J Smola, and Zhangyang Wang. Partial and asymmetric contrastive learning for out-of-distribution detection in long-tailed recognition. In International Conference on Machine Learning, pages 23446–23458. PMLR, 2022.
- [82] Jianhong Bai, Zuozhu Liu, Hualiang Wang, Jin Hao, YANG FENG, Huanpeng Chu, and Haoji Hu. On the effectiveness of out-of-distribution data in self-supervised long-tail learning. In The Eleventh International Conference on Learning Representations, 2023.
- [83] Alexander Long, Wei Yin, Thalaiyasingam Ajanthan, Vu Nguyen, Pulak Purkait, Ravi Garg, Alan Blair, Chunhua Shen, and Anton van den Hengel. Retrieval augmented classification for long-tail visual recognition. In Proceedings of the IEEE/CVF Conference on Computer Vision and Pattern Recognition, pages 6959–6969, 2022.
- [84] Xuan Kou, Chenghao Xu, Xu Yang, and Cheng Deng. Attention-guided contrastive hashing for long-tailed image retrieval. In Lud De Raedt, editor, Proceedings of the Thirty-First International Joint Conference on Artificial Intelligence, IJCAI-22, pages 1017–1023. International Joint Conferences on Artificial Intelligence Organization, 7 2022. Main Track.
- [85] Tao He, Lianli Gao, Jingkuan Song, Jianfei Cai, and Yuan-Fang Li. Learning from the scene and borrowing from the rich: Tackling the long tail in scene graph generation. In Christian Bessiere, editor, Proceedings of the Twenty-Ninth International Joint Conference on Artificial Intelligence, pages 587–593. International Joint Conferences on Artificial Intelligence Organization, 7 2020. Main track.
- [86] Harsh Rangwani, Naman Jaswani, Tejan Karmali, Varun Jampani, and R Venkatesh Babu. Improving gans for long-tailed data through group spectral regularization. In Computer Vision–ECCV 2022: 17th European Conference, Tel Aviv, Israel, October 23–27, 2022, Proceedings, Part XV, pages 426–442. Springer, 2022.
- [87] Weitao Wang, Meng Wang, Sen Wang, Guodong Long, Lina Yao, Guilin Qi, and Yang Chen. One-shot learning for long-tail visual relation detection. In Proceedings of the AAAI Conference on Artificial Intelligence, volume 34, pages 12225–12232, 2020.
- [88] Sherif Abdelkarim, Aniket Agarwal, Panos Achlioptas, Jun Chen, Jiaji Huang, Boyang Li, Kenneth Church, and Mohamed Elhoseiny. Exploring long tail visual relationship recognition with large vocabulary. In Proceedings of the IEEE/CVF International Conference on Computer Vision, pages 15921–15930, 2021.
- [89] Xing Zhang, Zuxuan Wu, Zejia Weng, Huazhu Fu, Jingjing Chen, Yu-Gang Jiang, and Larry S Davis. Videolt: large-scale long-tailed video recognition. In Proceedings of the IEEE/CVF International Conference on Computer Vision, pages 7960–7969, 2021.
- [90] Tai-Yu Pan, Cheng Zhang, Yandong Li, Hexiang Hu, Dong Xuan, Soravit Changpinyo, Boqing Gong, and Wei-Lun Chao. On model calibration for long-tailed object detection and instance segmentation. Advances in Neural Information Processing Systems, 34:2529–2542, 2021.
- [91] Tong Wang, Yousong Zhu, Chaoyang Zhao, Wei Zeng, Jinqiao Wang, and Ming Tang. Adaptive class suppression loss for long-tail object detection. In Proceedings of the IEEE/CVF conference on computer vision and pattern recognition, pages 3103–3112, 2021.
- [92] Mohammad S Sorower. A literature survey on algorithms for multi-label learning. Oregon State University, Corvallis, 18(1):25, 2010.
- [93] Margherita Grandini, Enrico Bagli, and Giorgio Visani. Metrics for multi-class classification: an overview. ArXiv, abs/2008.05756, 2020.
- [94] Hamid Rezatofighi, Nathan Tsoi, JunYoung Gwak, Amir Sadeghian, Ian Reid, and Silvio Savarese. Generalized intersection over union: A metric and a loss for bounding box regression. In Proceedings of the IEEE/CVF conference on computer vision and pattern recognition, pages 658–666, 2019.
- [95] Wenzhong Guo, Jianwen Wang, and Shiping Wang. Deep multimodal representation learning: A survey. IEEE Access, 7:63373–63394, 2019.
- [96] Tadas Baltrušaitis, Chaitanya Ahuja, and Louis-Philippe Morency. Multimodal machine learning: A survey and taxonomy. IEEE transactions on pattern analysis and machine intelligence, 41(2):423–443, 2018.
- [97] Chao Zhang, Zichao Yang, Xiaodong He, and Li Deng. Multimodal intelligence: Representation learning, information fusion, and applications. IEEE Journal of Selected Topics in Signal Processing, 14(3):478–493, 2020.
- [98] Sebastian Ruder. An overview of multi-task learning in deep neural networks. arXiv preprint arXiv:1706.05098, 2017.
- [99] Michael Crawshaw. Multi-task learning with deep neural networks: A survey. arXiv preprint arXiv:2009.09796, 2020.
Appendix A Long-Tailed Data Distributions
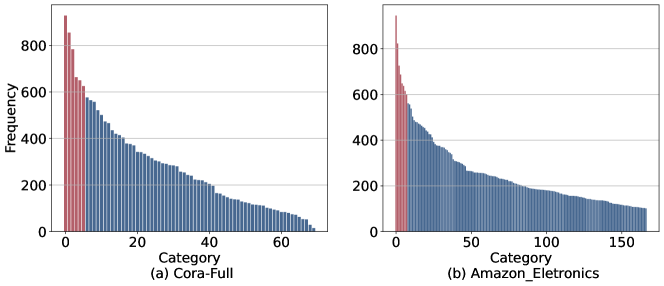
In this section, we will give some real-world examples with long-tailed distributions. Cora-Full dataset consists of 19,793 scientific publications classified into one of seventy categories [54]. As shown in Fig. 3(a), this dataset exhibits a prominent long-tailed distribution, wherein the number of instances belonging to the head categories far surpasses that of the tail categories. Similarly, Amazon_Eletronics dataset [56] also exhibits long-tailed distribution (see Fig. 3(b)), where each product is considered as a node belonging to a product category in "Electronics." Despite the emergence of machine learning methods aimed at facilitating accurate classification, further solutions are called due to the challenges of long-tailed distribution.
Appendix B More Details on HeroLT
B.1 Long-tailedness Metrics
To measure the long-tailedness of a dataset, a commonly used metric is the imbalance factor, and [20] propose using Gini coefficient as a measurement. In this section, we analyze the strengths and weaknesses of each metric and suggest using Pareto-LT Ratio to evaluate the long-tailedness of a dataset.
Imbalance Factor. To measure the skewness of long-tailed distribution, [74] first introduces the imbalance factor as the size of the largest majority class to the size of the smallest minority class:
| (1) |
where , represents the size of each category following descending order. The range of imbalance factor is . Intuitively, the larger the value of IF indicates a more imbalanced dataset.
Gini Coefficient. Gini coefficient is a measure of income inequality used to quantify the extent to which the distribution of income among a population deviates from perfect equality. [20] propose to use Gini coefficient as a long-tailedness metric since long-tailedness is similar to inequality between each category.
| (2) |
Gini coefficient ranges from 0 to 1, where a larger value indicates that the dataset is more imbalanced.
Pareto-LT Ratio. We propose a new metric named Pareto-LT Ratio to measure the long-tailedness. The design of this metric is inspired by the Pareto distribution, which is defined as:
| (3) |
where is the quantile function of order for . The numerator represents the number of categories to which the last 20% instances belongs, and the denominator represents the number of categories to which the other 80% instances belongs in the dataset. Intuitively, the higher the skewness of the data distribution, the larger the ratio will be; the more classes, the larger the long-tailedness ratio.
Imbalance factor is intuitive and easy to calculate, but it only considers the imbalance between the largest and smallest classes. Gini coefficient indicates the overall degree of category imbalance, unaffected by extreme samples or absolute data size. However, the two metrics pay more attention to data imbalance and may not reflect the number of categories. Our proposed Pareto-LT Ratio characterizes two properties of long-tailed datasets: (1) data imbalance and (2) extreme # of categories.
B.2 HeroLT Algorithm List
In this section, we introduce 13 popular and recent methods for solving long-tailed problems in our benchmark according to whether they can solve the problems of data imbalance and an extreme number of categories. In addition, our toolbox is still being updated, and we will include more algorithms in the future.
X-Transformer [50] consists of three components: semantic label indexing, deep neural matching, and ensemble ranking. Semantic label indexing decomposes extreme multi-label classification (XMC) problems into a feasible set of subproblems with much smaller output space by label clustering; deep neural matching fine-tunes a Transformer model for each subproblem; ensemble ranking is conditionally trained based on the instance-cluster assignment and embeddings from the Transformer and is used to aggregate scores from subproblems. X-Transformer solves data imbalance and an extreme number of categories.
XR-Transformer [51] is a transformer-based XMC framework that fine-tunes pre-trained transformers recursively leveraging multi-resolution objectives and cost-sensitive learning. The embedding generated at the previous task is used to bootstrap the non pre-trained part for the current task. XR-Transformer solves data imbalance and an extreme number of categories.
XR-Linear [52] is designed for XMC problem. It consists of recursive linear models that traverse an input from the root of a hierarchical label tree to a few leaf node clusters and return top-k relevant labels within the clusters as predictions. XR-Linear solves data imbalance and an extreme number of categories.
BBN [41] consists of two branches: the conventional learning branch with a uniform sampler for learning universal patterns for recognition and the re-balancing branch with a reversed sampler for modeling the tail data. Then the predicted outputs of these bilateral branches are aggregated in the cumulative learning part using an adaptive trade-off parameter, which first learns the universal features from the original distribution and then gradually pays attention to the tail data. By different data samplers (such as mixup which is popular for solving long-tailed problems) and cumulative learning strategy, BBN can address data imbalance.
BALMS [47] presents Balanced Softmax, an unbiased extension of Softmax, to accommodate the label distribution shift between training and testing. In addition, it applies a Meta Sampler to learn the optimal class re-sample rate by meta learning. Therefore, BALMS can address data imbalance.
OLTR [42] learns from natural long-tailed open-end distributed data. It consists of two main modules: dynamic meta embedding and modulated attention. The former combines a direct image feature and an associated memory feature to transfer knowledge between head and tail classes, and the latter maintains discrimination between them. Therefore, OLTR solves the challenges of data imbalance and an extreme number of categories.
TDE [43] is a framework for considering long-tailed problems using causal inference. It constructs a casual graph with four variables: momentum, object feature, projection of head direction, and model prediction, using casual intervention in training and counterfactual reasoning in inference to preserve "good" feature while cut off "bad" confounding effect. TDE solves data imbalance and an extreme number of categories.
MiSLAS [44] decouples representation learning and classifier learning. It uses mixup and designs label-aware smoothing to handle different degrees of over-confidence for classes and improve classifier learning. It also uses shift learning on the batch normalization layer to reduce dataset bias in the decoupling framework. MiSLAS can solve data imbalance.
Decoupling [28] decouples the learning procedure into representation learning and classification. The authors find that instance-balance sampling gives more generalizable representations and can achieve state-of-art performance after properly adjusting the classifiers. Decoupling can address the challenge of data imbalance.
GraphSMOTE [15] is the first work considering node class imbalance on graphs proposed in 2021. It first uses a GNN-based feature extractor to learn node representations and then applies SMOTE to generate synthetic nodes for the minority classes. Then an edge generator pre-trained on the original graph is introduced to model the existence of edges among nodes. The augmented graph is used for classification with a GNN classifier. By generating nodes for minority classes, GraphSMOTE increases the number of labeled samples for these classes, thus addressing the data imbalance.
ImGAGN [32] is an adversarial learning-based approach. It uses a generator to generate a set of synthetic minority nodes and topological structures, then uses a discriminator to discriminate between real and fake (i.e., generated) nodes and between minority and majority nodes, which can solve the challenges of data imbalance. However, ImGAGN sets the smallest class as the minority class and the residual classes as the majority class, which fails when the dataset contains the large number of categories.
Tail-GNN [33] Due to the specificity of rational data, the long-tailed problem on graphs includes the long-tailed of category and the long-tailed of node degree. Tail-GNN [33] focuses on solving the long-tailed problem of degree by introducing transferable neighborhood translation to capture the relational tie between a node and its neighboring nodes. Then it complements missing information of the tail nodes for neighborhood aggregation. Tail-GNN learns robust node embeddings by narrowing the gap between head and tail nodes in terms of degree and addresses the challenges of data imbalance and an extreme number of categories in degree level.
LTE4G [34] splits the nodes into four balanced subsets considering class and degree long-tailed distributions. Then, it trains an expert for each balanced subset and employs knowledge distillation to obtain the head student and tail student for further classification. Lastly, LTE4G devises a class prototype-based inference. Because LTE4G uses knowledge distillation across the head and tail and considers the tail classes together, it can solve data imbalance and an extreme number of categories.
B.3 HeroLT Dataset List
long-tailed challenges exist for various real-world data, such as tabular data, sequential data, grid data, and rational data. In this section, we briefly describe the collection of datasets selected for the initial version of our benchmark. In addition, we will show more datasets in past long-tailed studies on our toolbox page, including the statistics information (e.g.., size, #categories) and the long-tailedness (e.g.., imbalance factor, Gini coefficient, and Pareto-LT Ratio).
EURLEX-4K [69] consists of legal documents from the European Union, and the number of instances in the training and test sets are 15,499 and 3,865.
AMAZONCat-13K [69] contains product descriptions from Amazon, and the number of instances in the training and test sets are 1,186,239 and 306,782.
Wiki10-31K [69] is a collection of Wikipedia articles, and the number of instances in the training and test sets are 14,146 and 6,616.
ImageNet-LT [42] is a long-tailed version sampled from the original ImageNet-2012, which is a large-scale image dataset constructed based on the WorldNet structure. The train set has 115,846 images from 1000 categories with maximally 1280 images per class and minimally 5 images per class. The test and valid sets have 50,000 and 20,000 samples and are balanced.
Places-LT [42] is a long-tailed version of scene classification dataset Places-2. The train set contains 62,500 images from 365 categories with maximally 4980 images per class and minimally 5 images per class. The test and valid sets are balanced with 100 and 20 images per class accordingly.
iNatural 2018 [63] is a species classification dataset with a train set with 437,513 images for 8142 classes. The class frequencies follow a natural power law distribution with a maximum number of 4,980 images per class and a minimum number of 5 images per class. The test and valid sets contain 149,394 and 24,426 images, respectively.
CIFAR 10-LT and CIFAR 100-LT [74]. The original CIFAR dataset has two versions: CIFAR 10 and CIFAR 100, where the former has 10 classes, 6,000 images in every class, while the latter has 100 classes with 600 samples in each class. CIFAR 10-LT and CIFAR 100-LT are two long-tailed versions of CIFAR dataset, where the number of samples in each class is determined by a controllable imbalance factor. The commonly used imbalance factors are 10, 50, 100. The test set remains unchanged with even distribution.
LVIS v0.5 [64] is a large vocabulary instance segmentation dataset with 1231 classes. It contains a 693,958 train set, and a relatively balanced test/ valid set.
Cora-Full [54] is a citation network dataset. Each node represents a paper with a sparse bag-of-words vector as the node attribute. The edge represents the citation relationships between two corresponding papers, and the node category represents the research topic.
Email [78] is a network constructed from email exchanges in a research institution, where each node represents a member, and each edge represents the email communication between institution members.
Wiki [77] is a network dataset of Wikipedia pages, with each node representing a page and each edge denoting the hyperlink between pages.
Amazon-Clothing [56] is a product network that contains products in "Clothing, Shoes and Jewelry" on Amazon, where each node represents a product and is labeled with low-level product categories. The node attributes are constructed based on the product’s description, and the edges are established based on their substitutable relationship ("also viewed").
Amazon-Electronics [56] is another product network constructed from products in "Electronics". The edges are created with the complementary relationship ("bought together") between products.
Appendix C Details on Experiment Setting
C.1 Hyperparameter Settings
Here we provide the details of parameter settings. For a fair comparison, we use the default hyperparameter settings for all methods on all datasets. For the ImageNet dataset, Decoupling method uses ResNeXt-50 for 90 epochs training as the backbone, Stochastic Gradient Descent (SGD) optimizer with momentum 0.9, the batch size is 512, and learnable weight scaling (LWS) retrain 10epochs; TDE method uses ResNeXt-50 for 90 epochs training as backbone, the hyperparameter of SGD is set to 0.9, the batch size is 512; MiSLAS method uses ResNet50 and cosine learning rate schedule. For iNaturalist dataset, Decoupling method uses ResNet-152 for 200 epochs training as backbone, SGD optimizer with momentum 0.9, the batch size is 512, LWS retrain 10epochs; TDE method uses ResNeXt-50 for 90 epochs training, SGD optimizer with momentum 0.9, the batch size is 512; MiSLAS method uses ResNet50 and cosine learning rate schedule. For Place365 dataset, Decoupling method uses ResNet-152 for 200 epochs as backbone, SGD optimizer with momentum 0.9, the batch size is set to 512, learnable weight scaling retrain 10epochs; TDE method utilizes ResNeXt-50 for 90epochs, SGD optimizer with momentum 0.9, the batch size is 512; MiSLAS method uses ResNet-152 and cosine learning rate schedule. For Cifar 10-LT and Cifar 100-LT datasets, Decoupling uses ResNet-32 as backbone for 200 epochs training; TDE method uses ResNet-32 for 200 epochs; MiSLAS uses ResNet-32 for 200epoch. For GraphSMOTE, we set the weight of edge reconstruction loss to as in the original paper. For LTE4G, we adopt the best hyperparameter settings reported in the paper. For Tail-GNN, we set the degree threshold to 5 (i.e.., nodes having a degree of no more than 5 are regarded as tail nodes), which is the default value in.
C.2 Evaluation Metrics
Considering the long-tailed distribution, accuracy, precision, recall, balanced accuracy, and mean average precision are used as the evaluation metrics.
| Metric name | Computation | Description |
| Acc [92] | Correct predictions of the algorithm on the dataset. | |
| Precision [93] | Fraction of correctly predicted positive instances against total positively predicted instances. | |
| Recall [93] | Fraction of correctly predicted positive instances against total positively classified instances. | |
| bAcc [93] | Arithmetic mean of the recalls for all classes. | |
| MAP [94] | Average over s for all classes. | |
| Time | - | Time (training time/inference time) of the algorithm. |
Accuracy (Acc) provides an overall measure of the model’s correctness in predicting the entire test set. Acc favours the majority class as each instance has the same weight and contributes equally to the value of accuracy. In image classification and instance segmentation tasks, besides the overall accuracy across all classes, we follow previous work to comprehensively assess the performance of each method. We calculate the accuracy of three distinct subsets: many-shot classes (classes with over 100 training samples), medium-shot classes (classes with 20 to 100 training samples), and few-shot classes (classes with under 20 training samples). In the task of multi-label learning, each instance can be assigned to multiple classes, making predictions fully correct, partially correct, or fully incorrect. To capture the quality of these predictions, we utilize as evaluation metrics, which measure the top- accuracy.
Precision measures the number of correctly predicted positive instances against all the instances that were predicted as positive. In this paper, we use macro-precision, which is calculated by averaging the precision scores for each predicted class. The Macro approach considers all the classes equally, regardless of their size, ensuring the effect of majority classes is considered as important as that of minority classes.
Recall is a metric that measures the proportion of true positive instances out of all the positive instances. In our evaluation, we utilize macro-recall, which is calculated by averaging recall for each actual class. Notably, recall equals accuracy when the test set is balanced.
Balanced accuracy (bAcc) is the arithmetic mean of recall values calculated for each individual class. It is insensitive to imbalanced class distribution, as it treats every class with equal weight and importance and ensures minority classes have a more than proportional influence.
Mean average precision (MAP) is a ranking-based metric that is the average of Average Precision (AP) over different classes, where AP is the area under the precision-recall curve.