HRHD-HK: A Benchmark Dataset of High-Rise and High-Density Urban Scenes for 3D Semantic Segmentation of Photogrammetric Point Clouds
Abstract
Many existing 3D semantic segmentation methods, deep learning in computer vision notably, claimed to achieve desired results on urban point clouds. Thus, it is significant to assess these methods quantitatively in diversified real-world urban scenes, encompassing high-rise, low-rise, high-density, and low-density urban areas. However, existing public benchmark datasets primarily represent low-rise scenes from European cities and cannot assess the methods comprehensively. This paper presents a benchmark dataset of high-rise urban point clouds, namely High-Rise, High-Density urban scenes of Hong Kong (HRHD-HK). HRHD-HK arranged in 150 tiles contains 273 million colorful photogrammetric 3D points from diverse urban settings. The semantic labels of HRHD-HK include building, vegetation, road, waterbody, facility, terrain, and vehicle. To our best knowledge, HRHD-HK is the first photogrammetric dataset that focuses on HRHD urban areas. This paper also comprehensively evaluates eight popular semantic segmentation methods on the HRHD-HK dataset. Experimental results confirmed plenty of room for enhancing the current 3D semantic segmentation of point clouds, especially for city objects with small volumes. Our dataset is publicly available at https://doi.org/10.25442/hku.23701866.v2.
Keywords Benchmark dataset photogrammetric point clouds 3D semantic segmentation high-rise high-density city deep learning
1 Introduction
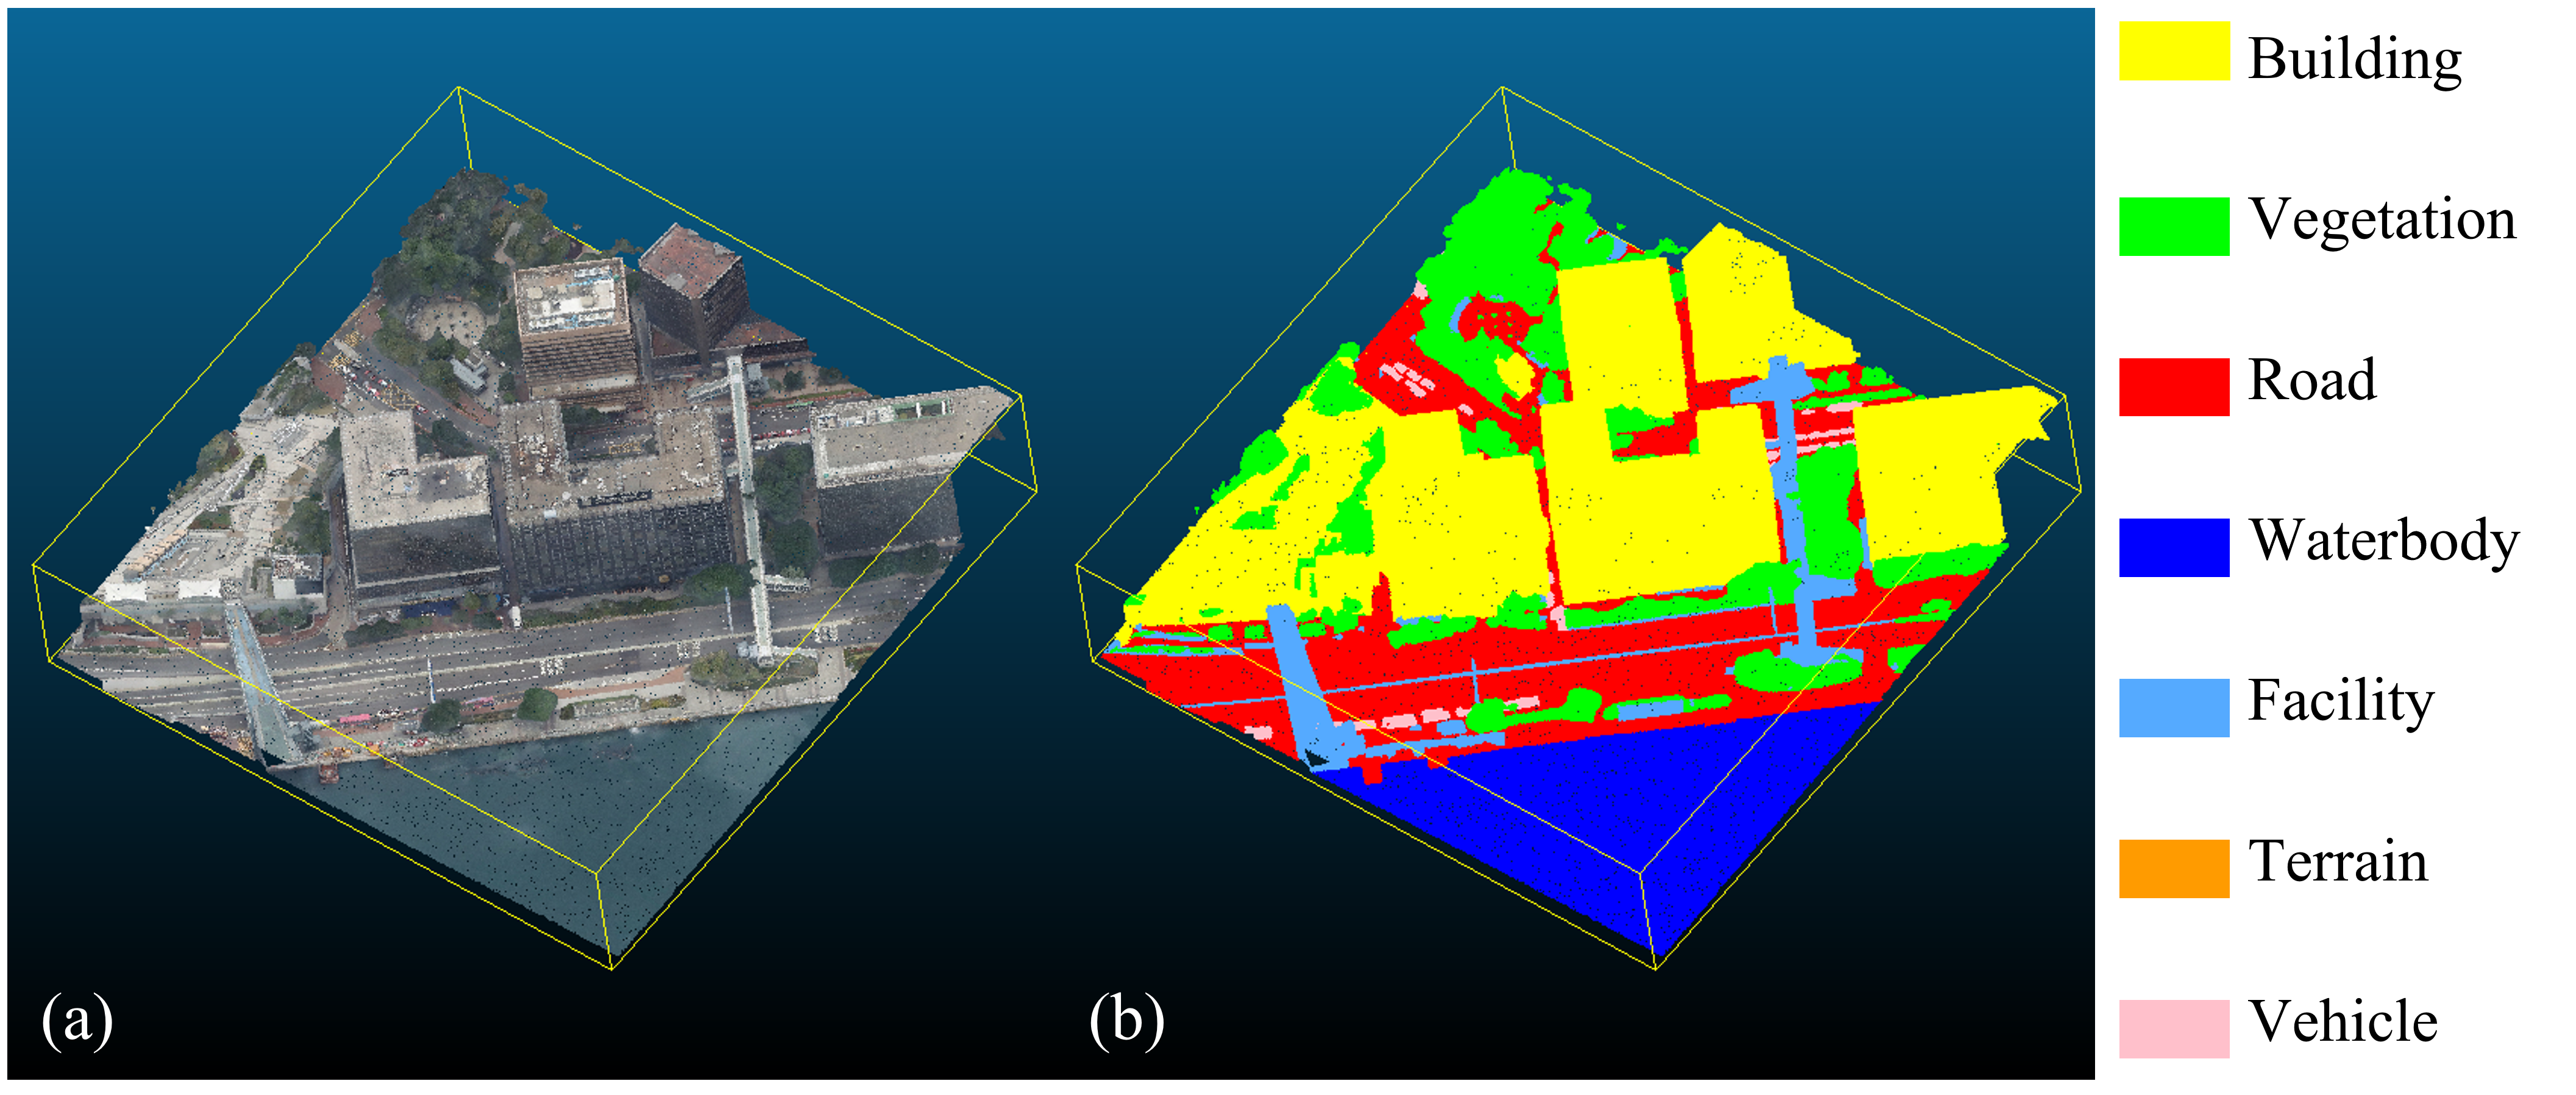
Fully semantic-enriched 3D point clouds play a significant role in smart city applications, such as robotics, autonomous driving and navigation, and urban analytics Guo et al. (2020); Li et al. (2023). 3D semantic segmentation of point clouds is the process that assigns each point a semantic label, such as building, vegetation, road, and waterbody, as shown in Figure 1, in order to enable vehicles and robots to comprehend city objects’ functions and morphology. A variety of 3D semantic segmentation methods, deep learning notably, have been popularized in computer vision, photogrammetry, and remote sensing fields Guo et al. (2020). Semantic enrichment of point clouds highly relies on these automatic methods, because the sheer size and diversity of the represented city objects make the manual judgment high-cost and inefficient.
Assessing the 3D semantic segmentation methods quantitatively in real-world urban scenes is important. Generally, methods should be evaluated comprehensively on worldwide datasets of diverse urban settings, including high-rise, low-rise, high-density, and low-density urban scenes. However, as listed in Table 1, existing public benchmark datasets, such as Swiss3DCities Can et al. (2021) and DublinCity Zolanvari et al. (2019), primarily represent low-rise scenes from European cities. In contrast, benchmark datasets of high-rise, high-density (HRHD) urban scenes, e.g., in Hong Kong (HK), New York, and Tokyo, are absent. Consequently, the absence of datasets of HRHD urban scenes fundamentally undermines the comprehensiveness and accuracy of the assessment of 3D semantic segmentation methods. E.g., the same 3D semantic segmentation model can show inconsistent performances on different urban morphological point clouds Hu et al. (2022).
| By | Dataset | Location | Avg. bldg. | Avg. bldg. | Area | Points | No. of | Color? | HRHD? | Source |
| height (m) | cov. ratio | (km2) | (Mil.) | classes | ||||||
| Nederland (2019) | AHN3 | Netherland | 15.66† | 0.44† | 41,543 | 4E+5‡ | 4 | No | No | LiDAR |
| Zolanvari et al. (2019) | Dublin City | Ireland | 22.56 | 0.64 | 2 | 260 | 13 | No | No | LiDAR |
| Varney et al. (2020) | DALES | Canada | 8.83 | 0.39 | 10 | 505 | 8 | No | No | LiDAR |
| Li et al. (2020) | Campus3D | Singapore | 23.63 | 0.26 | 1.58 | 937 | 24 | Yes | No | Photogrammetry |
| Can et al. (2021) | Swiss3DCities | Switzerland | 14.85 | 0.39 | 2.70 | 226 | 5 | Yes | No | Photogrammetry |
| Kölle et al. (2021) | Hessigheim3D | Germany | 4.86 | 0.30 | 0.19 | 126 | 11 | Yes | No | LiDAR |
| Hu et al. (2022) | SensatUrban | United Kingdom | 7.67 | 0.33 | 7.64 | 2,847 | 13 | Yes | No | Photogrammetry |
| Our HRHD-HK | Hong Kong | 38.50 | 0.67† | 9.38 | 273 | 7 | Yes | Yes | Photogrammetry | |
| indicates computed values in urban central areas; denotes an estimated total number of points. | ||||||||||
This paper presents HRHD-HK, a benchmark dataset of HRHD urban scenes for 3D semantic segmentation of photogrammetric point clouds. The semantic labels of HRHD-HK include building, vegetation, road, waterbody, facility, terrain, and vehicle. Point clouds of HRHD-HK were collected in HK with two features, i.e., color and coordinates. HRHD-HK arranged in 150 tiles, contains approximately 273 million points, covering 9.375 km2. HRHD-HK aims to supplement the existing benchmark datasets by incorporating Asian HRHD urban scenes as well as subtropical natural landscapes, such as sea, vegetation, and mountains.
The contribution of this paper is two-fold. First, it presents the first public benchmark dataset of HRHD urban scenes for 3D semantic segmentation of photogrammetric point clouds. The HRHD urban morphologies of the HRHD-HK dataset supplement the current benchmark datasets. Secondly, we provide a comprehensive evaluation of eight popular 3D semantic segmentation methods on HRHD-HK. Experimental results confirmed plenty of room for enhancing the current 3D semantic segmentation of point clouds in HRHD urban areas.
2 HRHD-HK: Building high-rise high-density photogrammetry dataset with urban semantics
HK is a city with typical HRHD morphologies across the world. E.g., there exist 2,522 buildings over 100 m with 309 skyscrapers above 150 m. The maximum building coverage ratio of blocks exceeds 0.70. Compared to existing benchmark datasets with low-rise building blocks as shown in Table 1, the average height of buildings of HRHD-HK is 38.50 m, where 163 buildings are higher than 100 m. The average building coverage ratio of blocks in downtown areas reaches up to 0.67. Specifically, we created the HRHD-HK dataset through four steps.
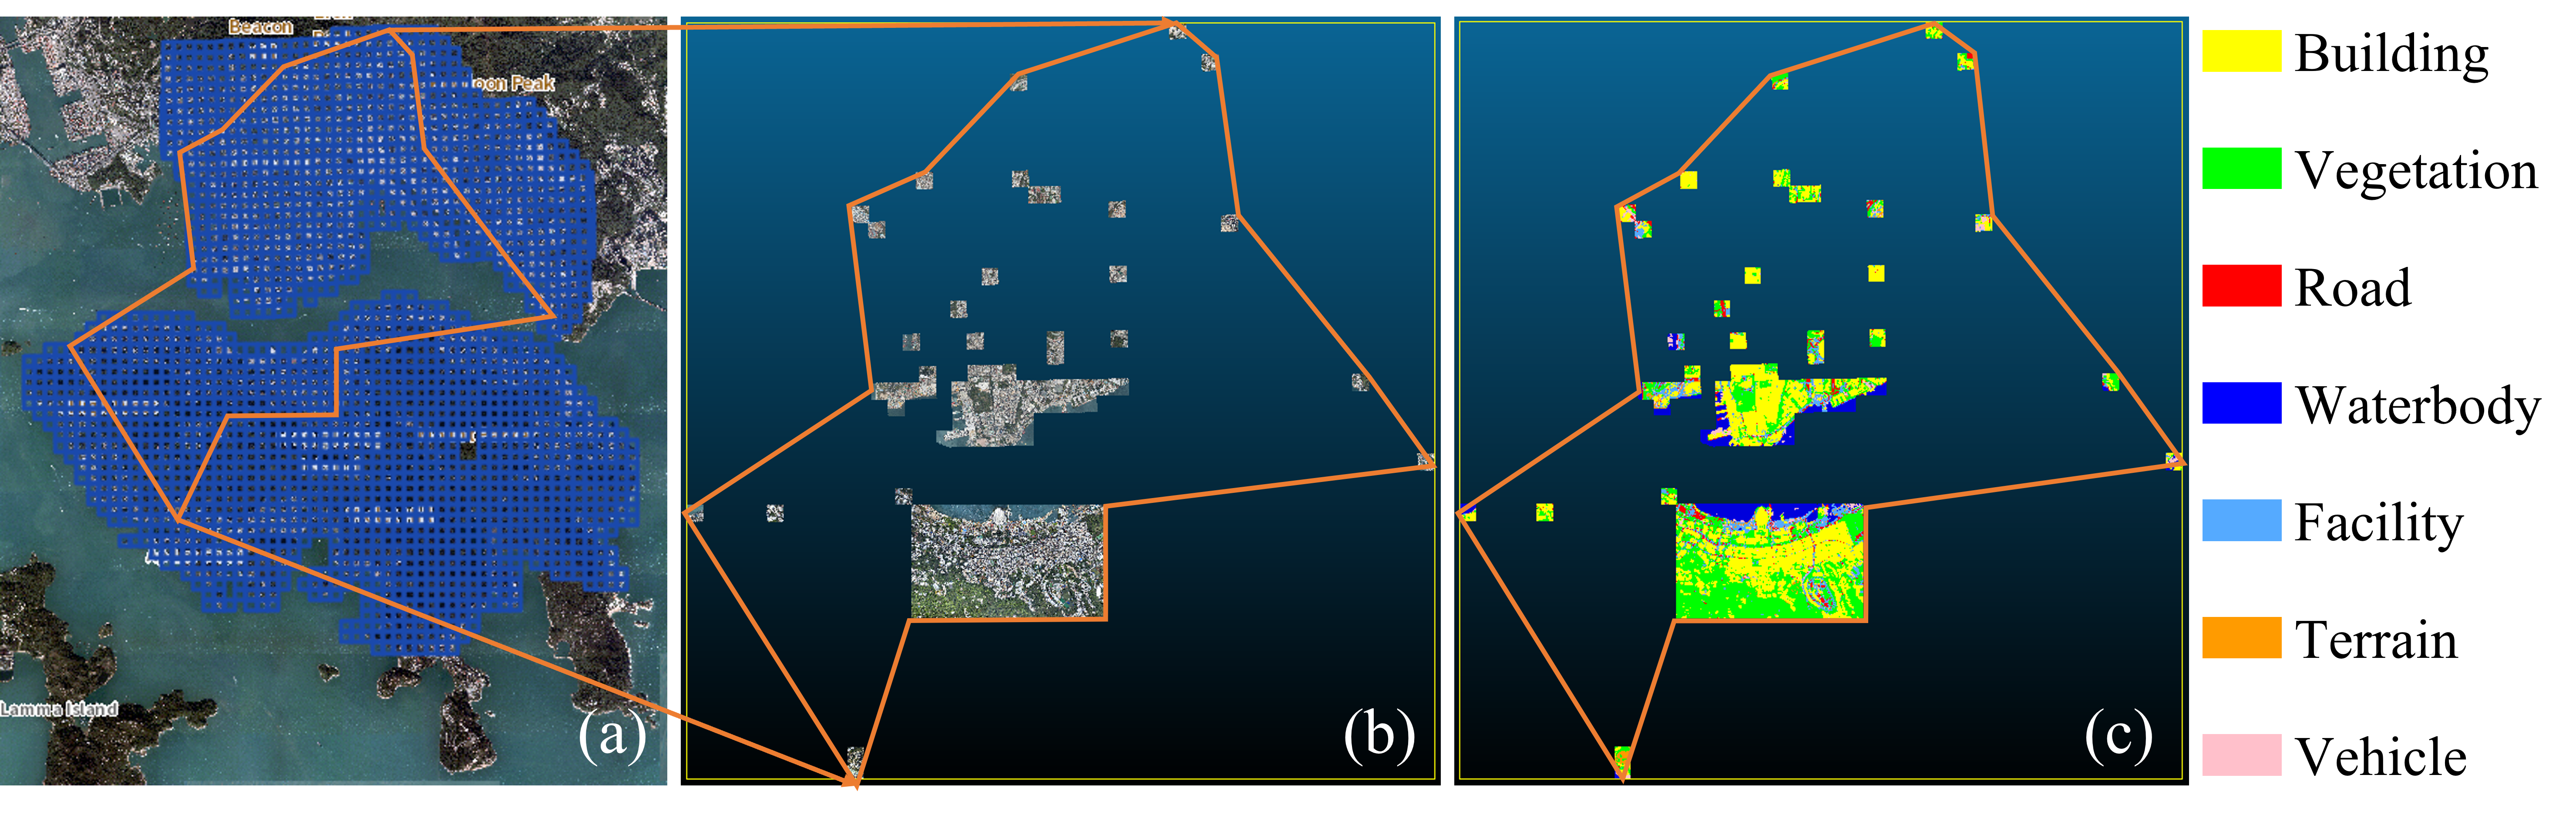
Step 1: Data acquisition. The point cloud dataset was generated from the photo-realistic mesh models HKPlanD (2019) provided by the HK Planning Department. Figure 2a shows the original photo-realistic mesh models arranged in 2,150 tiles, covering nearly the whole HK Island and the main urban area of Kowloon Peninsula. Figure 2b shows the selected 150 square tiles (9.375 km2 in total) of photo-realistic mesh models from concentrated and separated urban areas. Specifically, one of the most densely developed downtown areas on both sides of Victoria Harbor of HK was selected to completely represent the HRHD urban morphologies. Figure 3a shows typical HRHD building blocks in HK. Thereafter, separated tiles were also selected to incorporate more other morphologies in HK, such as clusters of low-rise flats and green hills as shown in Figures 3c and 3d.
Step 2: Data curation. We first manually removed the incorrectly reconstructed triangle faces from the photo-realistic mesh models. E.g., trivial triangle faces separated from the main body of the tile were removed as outliers. At the sampling density of 10 points per square meter, the 150 tiles of point clouds sampled from mesh models contain about 273 million points. Last, we geo-registered all points in the HK 1980 Grid (EPSG:2326), where the unit of coordinates xyz is meter.
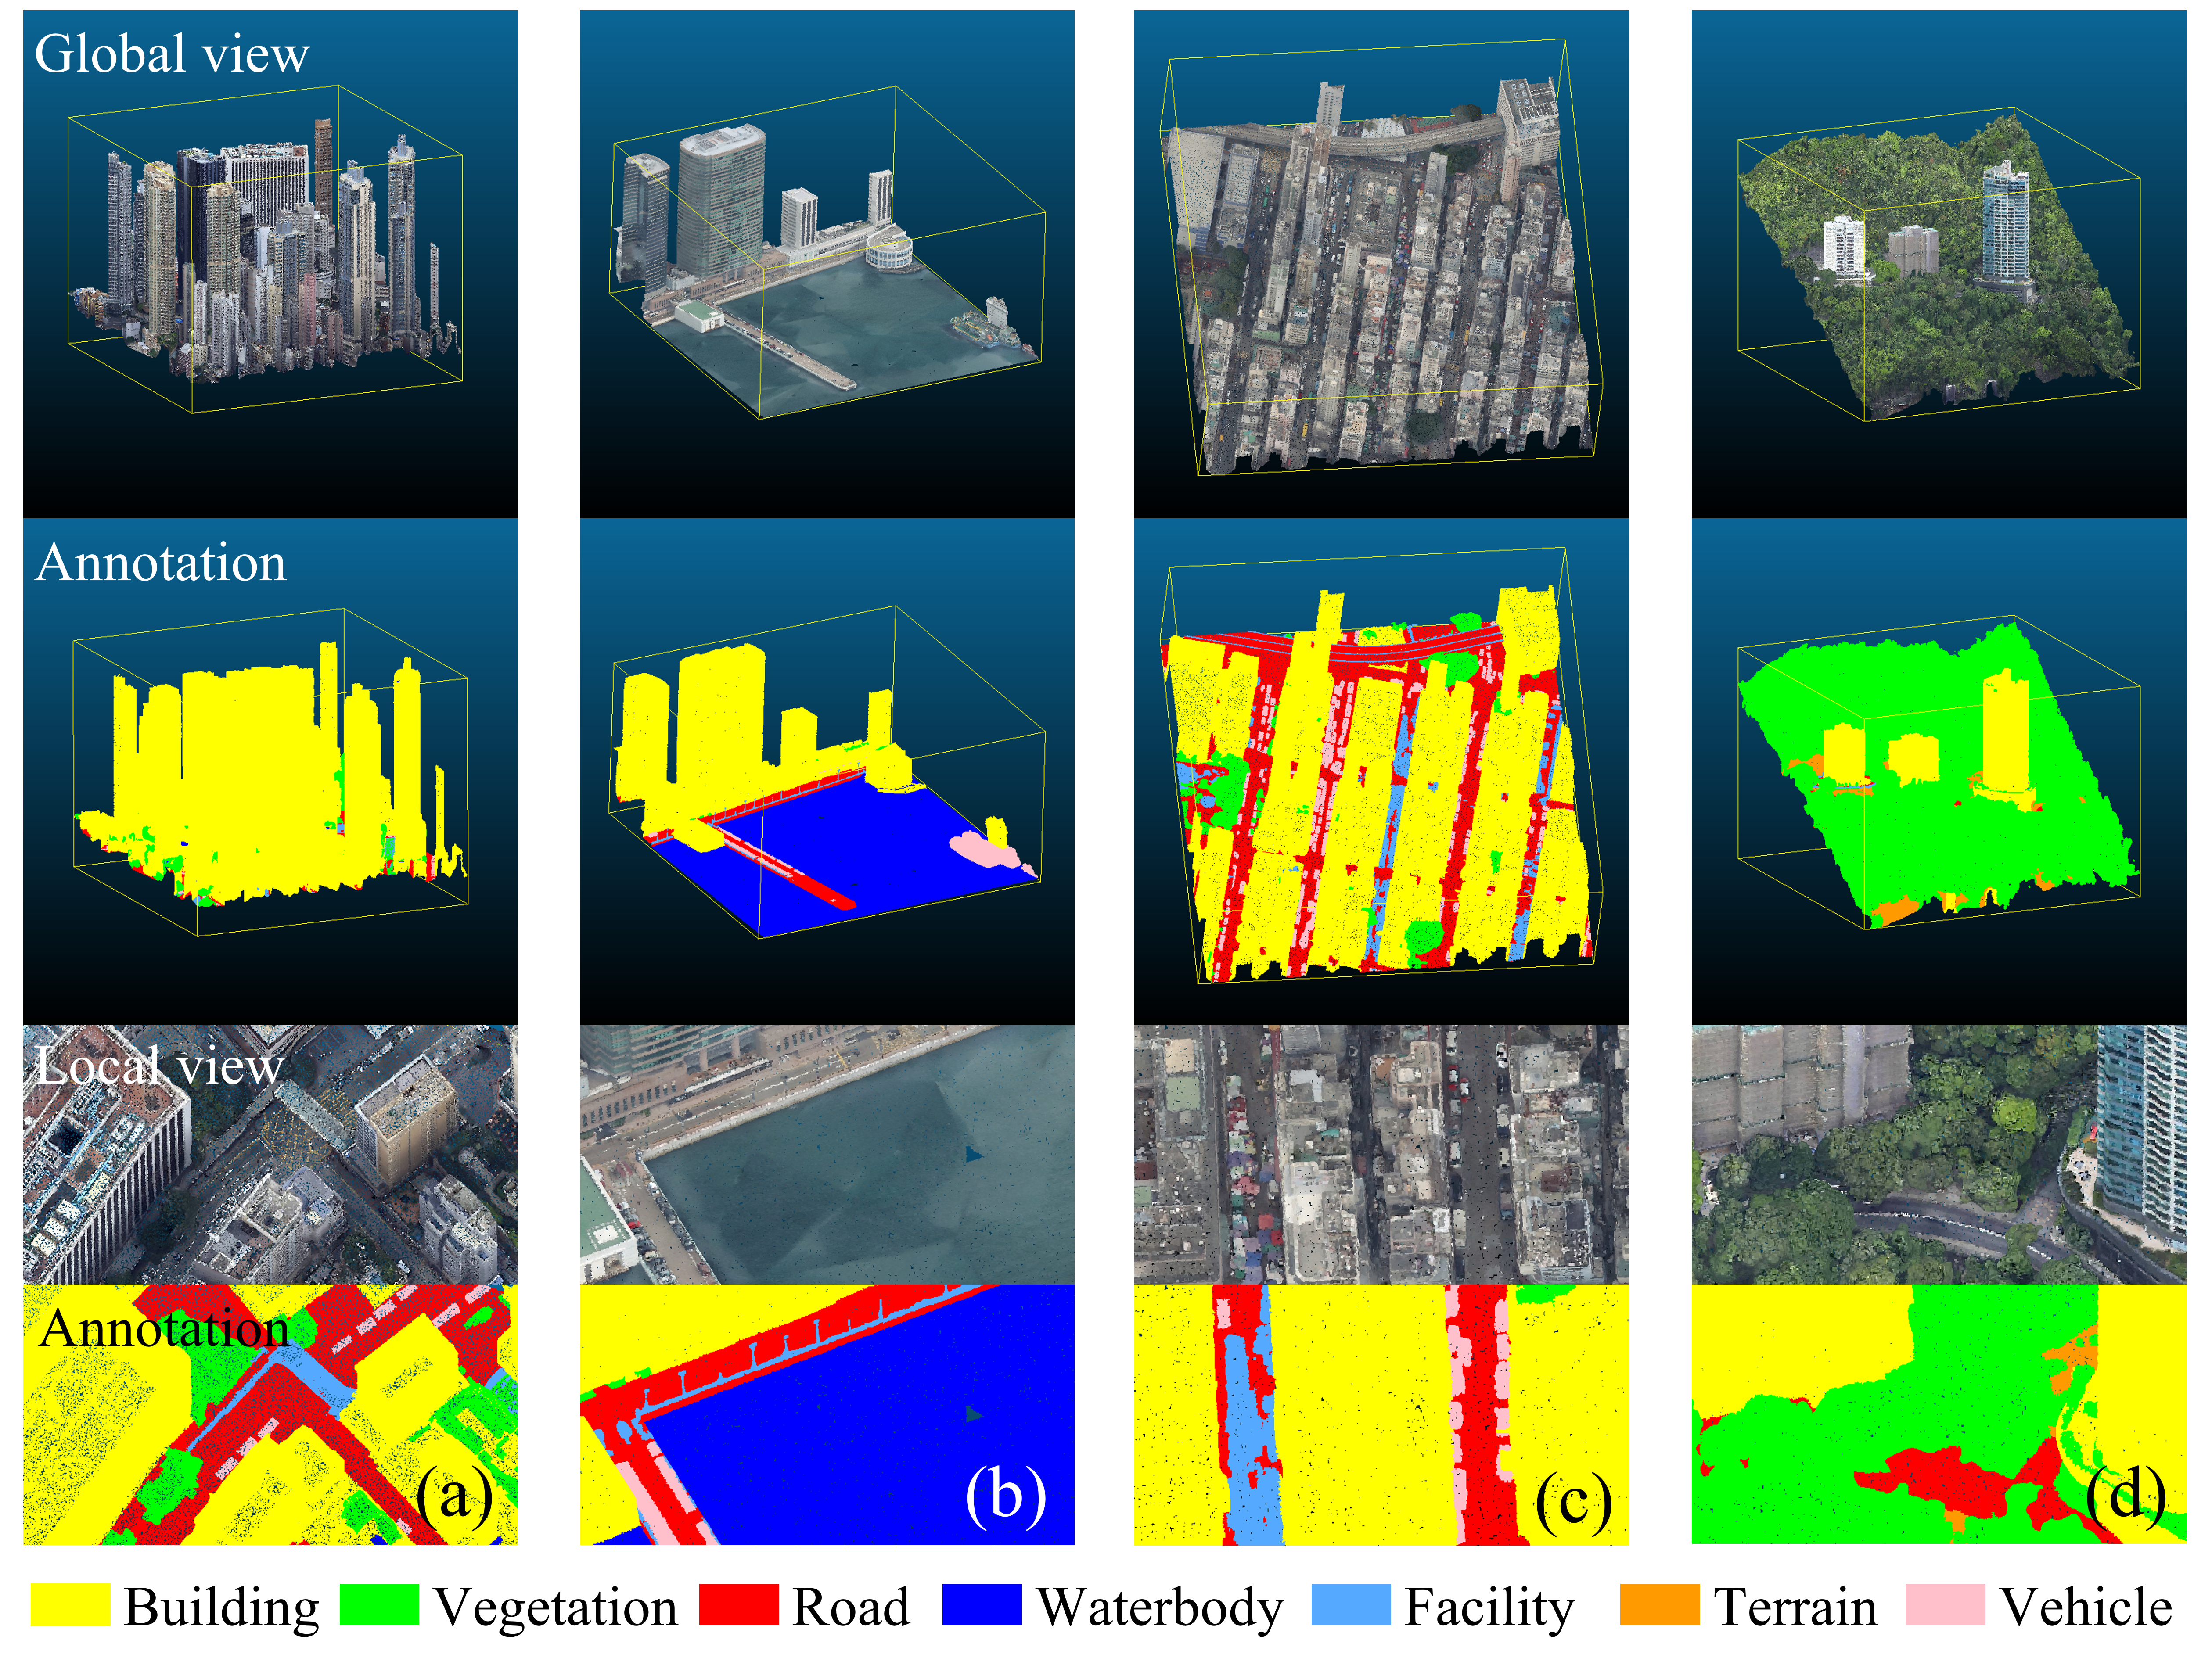
Step 3: Semantic annotation. Given the HRHD-HK dataset with more than 273 million points and the crowded spatial distribution of landscape elements, we outsourced the annotation task to professional annotators for high-quality ground truth. To ensure the annotation quality, we manually checked each tile of HRHD-HK. Point clouds with incorrect annotations were returned for modification until there existed no observable errors. Point clouds of HRHD-HK were annotated into seven semantic categories, as shown in Figure 2c and Table 2. The seven semantic labels are building, vegetation, road, waterbody, facility, terrain, and vehicle, which represent the most common city objects in HK. E.g., building denotes constructions with both walls and roofs in HRHD-HK, and points representing non-building objects, e.g., fences, canopies, containers, footbridges, and billboards were labeled as facility. Figure 3 shows example tiles of point clouds with diverse urban morphologies, i.e., HRHD building blocks, harbor, high-density but low-rise flats, and green hills.
| No | Label | Description |
|---|---|---|
| 1 | Building | Construction with walls and a roof. |
| 2 | Vegetation | Tree, bush, grass, etc. |
| 3 | Road | All types of uncovered constructed path, e.g., road, |
| street, walkway, and flyover. | ||
| 4 | Waterbody | Sea, lake, swimming pool, etc. |
| 5 | Facility | Fence, canopy, container, footbridge, billboard, etc. |
| 6 | Terrain | Unconstructed land surface, e.g., bare earth and |
| constructed slope made of concrete. | ||
| 7 | Vehicle | Car, ship, vessel, etc. |
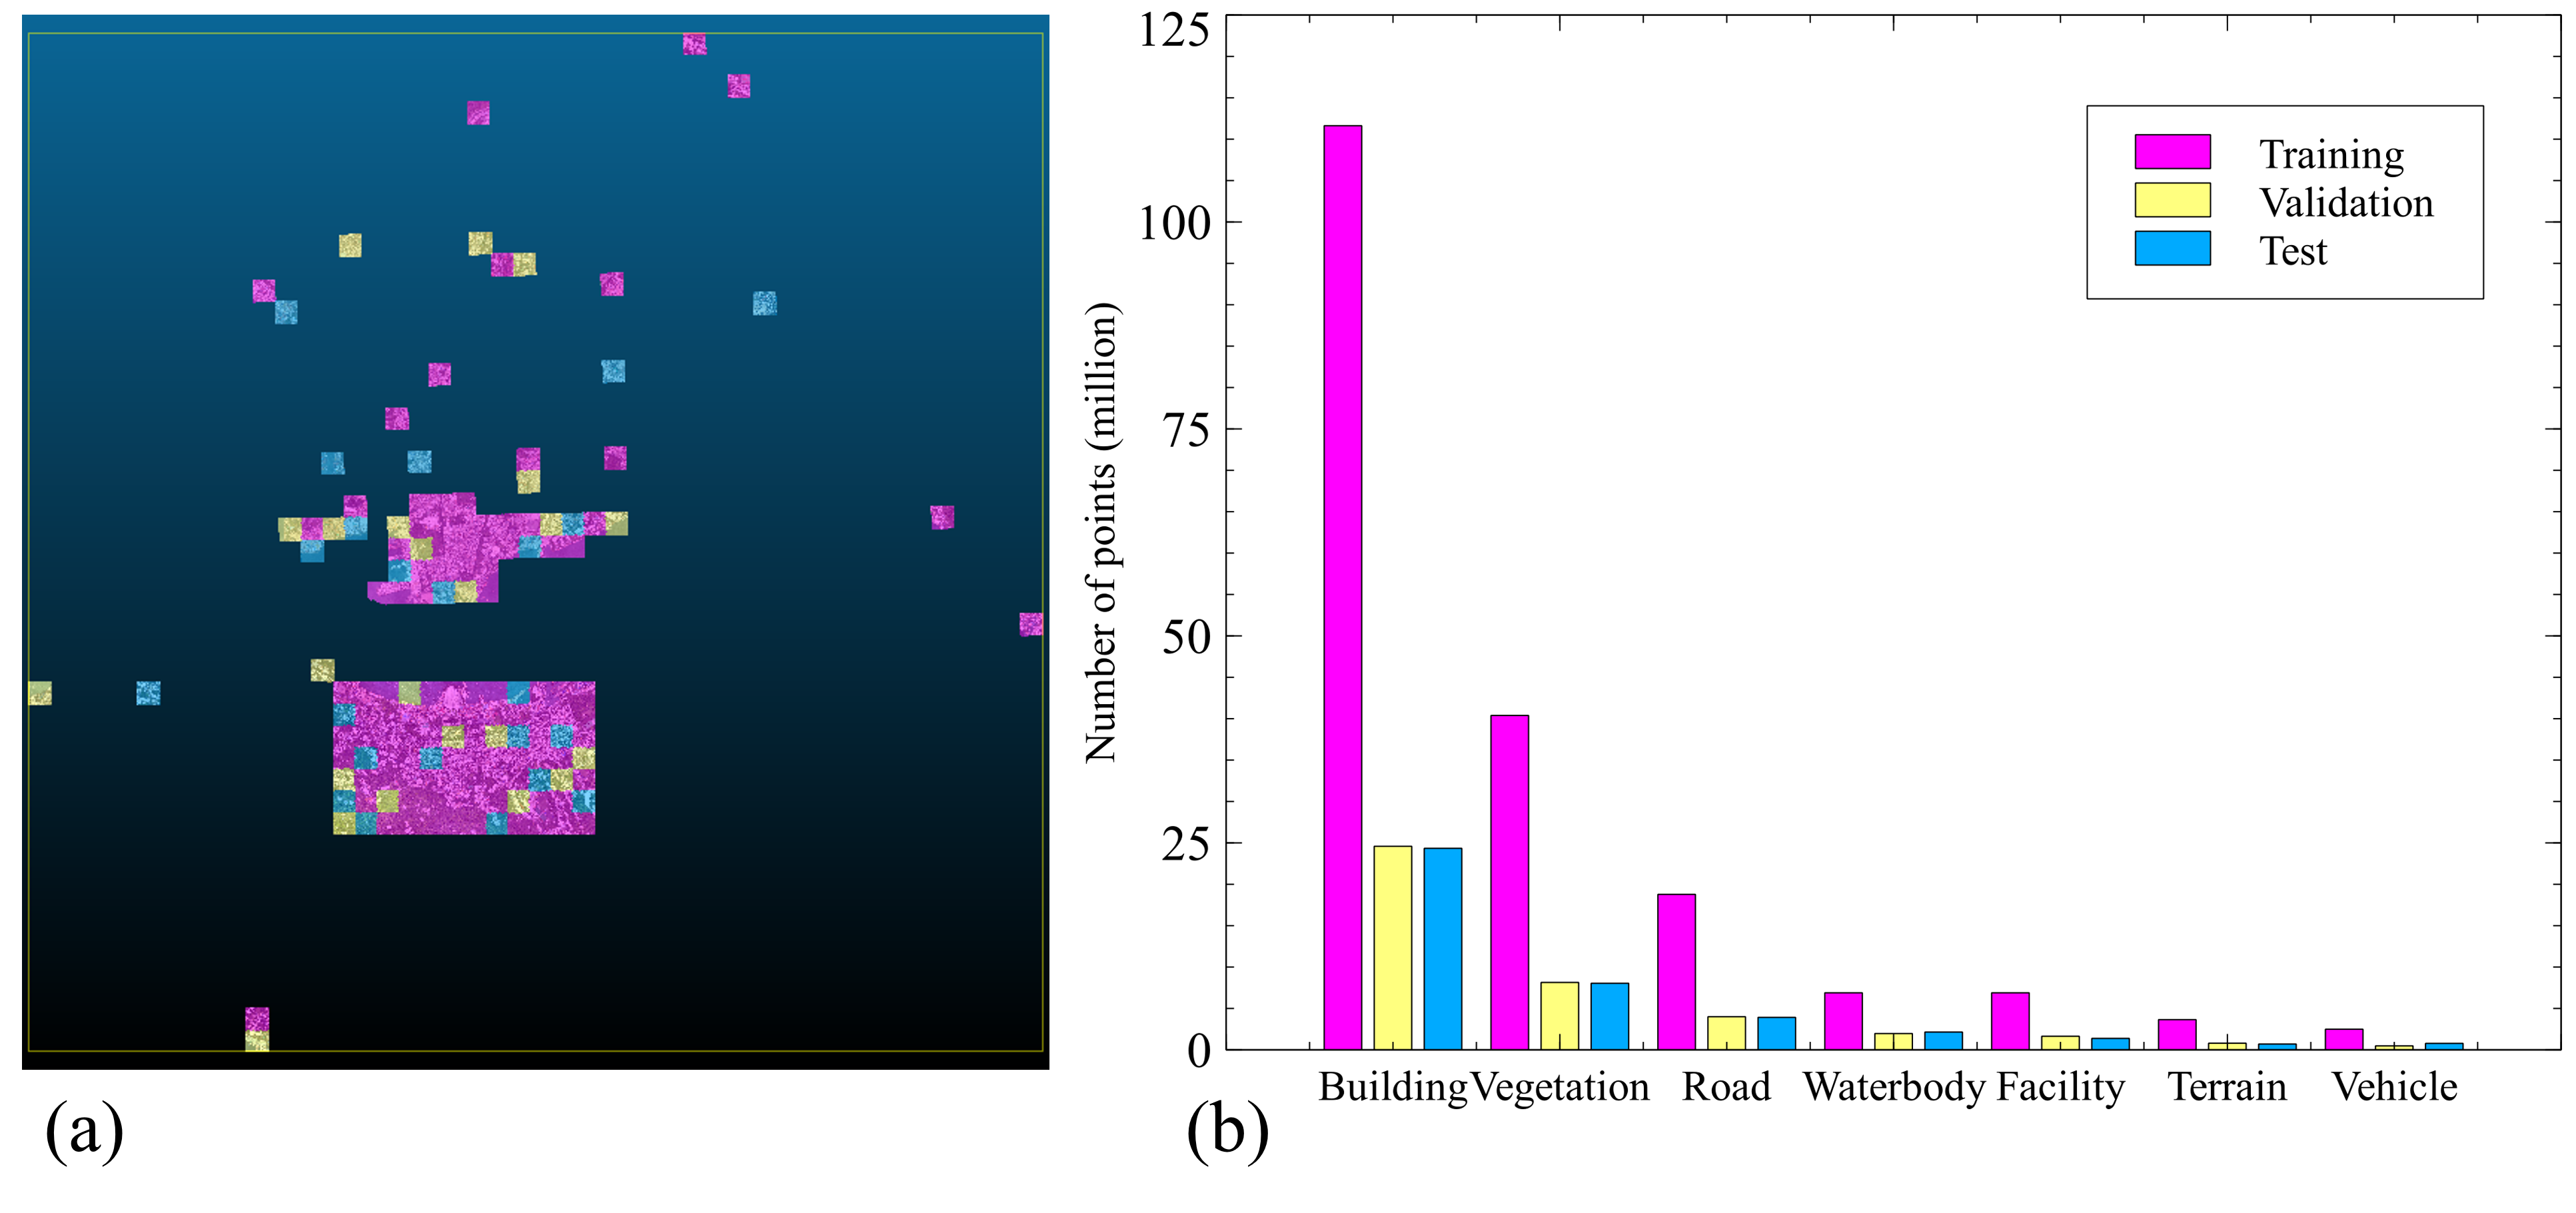
Step 4: Training-validation-test split. We selected 104 tiles of HRHD-HK as the training set, another 23 tiles of HRHD-HK as the validation set, and the last 23 tiles as the test set. Due to the imbalanced spatial distribution of city objects, we manually arranged the training, validation, and test sets (see Figure 4a) to balance the quantity distribution of different landscape elements, especially for city objects represented by small numbers of points (e.g., waterbody, facility, terrain, and vehicle) in validation and test sets. Figure 4b shows the numbers of points representing seven landscape elements for validation and test sets were all non-zero and almost equal.
3 Evaluation of 3D semantic segmentation methods on HRHD-HK
Segmentation methods. We evaluated eight typical 3D semantic segmentation methods from projection-based, voxel-based, and point-wise semantic segmentation architectures on HRHD-HK. Specifically, the eight methods were a 3D voxel convolution network SparseConvUnet Graham et al. (2018), a 2D projection method BEV-Seg3D-Net Zou and Li (2021), a graph method SPGraph Landrieu and Simonovsky (2018), a Kernel point convolution method KPConv Thomas et al. (2019), three multi-layer perceptron methods including PointNet Qi et al. (2017a), PointNet++ Qi et al. (2017b), and RandLA-Net Hu et al. (2020), and a transformer named StratifiedTransformer Lai et al. (2022).
Evaluation metrics. Three commonly used indicators including Overall Accuracy (OA), mean class Accuracy (mAcc), and mean Intersection over Union (mIoU) were applied to evaluate the performance of the eight selected methods on HRHD-HK. OA reports the percentage of total points which are correctly classified, whereas mAcc represents the average percentage of points that are correctly classified in each class. mIoU is the average of the IoUs, which indicates the average magnitude of the detection confusion of each semantic label.
Training environment. The training environment was set up as follows. The experiments were implemented on a high-performance computing cluster with 7 servers, each of which owns dual Intel Xeon 6226R (16 core) CPUs, 384GB RAM, 4 NVIDIA V100 (32GB) SXM2 GPUs, and a CentOS 8 system. Each deep learning model was trained on assigned 16-core CPUs, 64GB RAM, and one NVIDIA V100 (32GB) SXM2 GPU card. All eight models were trained with the environment of PyTorch (ver. 1.8) and Python (ver. 3.7). We universally used 0.15-meter downsampling to preprocess the point clouds. Hypermeters of eight semantic segmentation methods were fine-tuned to achieve the best results we could acquire.
| Group | DL method | Overall metric (%) | Per-class IoU (%) | ||||||||
|---|---|---|---|---|---|---|---|---|---|---|---|
| OA | mAcc | mIoU | Building | Vegetation | Road | Waterbody | Faility | Terrain | Vehicle | ||
| Voxel | SparseConvUnet Graham et al. (2018) | 88.71 | 70.24 | 58.46 | 90.71 | 88.31 | 57.99 | 93.15 | 24.60 | 25.09 | 29.38 |
| 2D proj. | BEV-Seg3D-Net Zou and Li (2021) | 89.18 | 73.25 | 61.14 | 90.75 | 88.34 | 54.88 | 94.53 | 25.17 | 31.12 | 43.20 |
| Graph | SPGraph Landrieu and Simonovsky (2018) | 85.32 | 58.53 | 49.86 | 86.65 | 78.19 | 50.28 | 91.93 | 14.20 | 14.71 | 13.08 |
| Kernel | KPConv Thomas et al. (2019) | 91.23 | 71.53 | 63.81 | 92.39 | 88.56 | 62.89 | 91.96 | 27.19 | 34.33 | 49.38 |
| MLP | PointNet Qi et al. (2017a) | 77.49 | 61.98 | 47.50 | 81.09 | 58.39 | 51.07 | 92.34 | 11.84 | 19.74 | 18.07 |
| PointNet++ Qi et al. (2017b) | 79.85 | 66.95 | 52.52 | 77.43 | 58.55 | 58.52 | 95.16 | 21.40 | 29.88 | 26.98 | |
| RandLA-Net Hu et al. (2020) | 90.39 | 78.81 | 64.76 | 91.29 | 90.39 | 63.59 | 94.21 | 32.24 | 36.45 | 45.13 | |
| Trans. | StratifiedTransformer Lai et al. (2022) | 92.30 | 76.99 | 68.08 | 93.17 | 91.99 | 67.35 | 95.61 | 35.31 | 38.19 | 54.91 |
Results. Table 3 lists the evaluation results of the eight methods. Because of the multi-scale receptive size and the attention mechanism, the most up-to-date method, StratifiedTransformer published last year achieved the best performance of OA and mIoU at 92.30% and 68.08%, respectively, whereas RandLA-Net achieved the highest value of mAcc at 78.81%. By contrast, PointNet received the lowest OA and mIoU. Although the detection of city objects such as buildings, vegetation, and waterbody achieved relatively high-level performance with the highest per-class IoUs above 91.99%, city objects such as roads, terrain, vehicles, and facilities were still poorly segmented. E.g., the highest IoUs of road, vehicle, terrain, and facility were 67.35%, 54.91%, 38.19%, and 35.31%, respectively.
Discussion. Figure 5 shows typical confusions through the inference results of StratifiedTransformer and RandLA-Net as examples. First, the large sizes of certain parts of city objects lead to incorrect detections. E.g., large flat surfaces such as building roofs were incorrectly detected into roads as shown in Figure 5a, because large building roofs are similar to pavement and roads.

Thereafter, small city objects with similar appearances are difficult to be distinguished. E.g., Figure 5b shows facilities like containers at the dock could be easily detected as buildings. Figure 5c shows terrain like bare earth on the ground level was confused with constructed roads. There exist difficulties in distinguishing narrow roads from adjacent building podiums in the mountainous and multilevel urban environment as shown in Figure 5d.
Last, the extremely high size ratio between large city objects such as building blocks and greenery, and small city objects such as vehicles and facilities poses challenges to balancing detection performance. Figure 5e shows most greenery and buildings were detected whereas the boundaries of vehicles were difficult to be distinguished from the roads and building roofs, especially for RandLA-Net.
Overall, there still exists room for selected 3D semantic segmentation methods to achieve satisfactory performance in HRHD-HK, especially for city objects with small volumes such as roads, vehicles, terrain, and facilities in the HRHD urban context.
4 Conclusion
A variety of urban point cloud benchmark datasets is significant in training, examining, and advancing 3D semantic segmentation methods for diversified urban scenes across the world. However, current benchmark datasets of photogrammetric point clouds primarily represent low-rise urban morphologies, especially in European cities. This paper presents the first high-rise, high-density (HRHD) urban benchmark dataset, HRHD urban scenes of Hong Kong (HRHD-HK) to supplement the current benchmark dataset hub.
The proposed HRHD-HK covers 9.375 km2 of urban areas of HK with 273 million color points. HRHD-HK includes seven semantic labels, i.e., building, vegetation, road, waterbody, facility, terrain, and vehicle. We tested eight 3D semantic segmentation methods, all of which had mIoUs less than 68.08%. Particularly, there exists room for improvement in detecting city objects with small volumes such as roads, vehicles, terrain, and facilities in the HRHD urban context. We make HRHD-HK publicly available for researchers to benchmark deep learning methods and advance their generalization in HRHD cities. Our future work includes embedding publicly available geospatial information to extend the dimension of model training for more accurate 3D semantic segmentation.
Acknowledgement
This study was supported in part by the Hong Kong Research Grant Council (RGC) (27200520) and Department of Science and Technology of Guangdong Province (GDST) (2020B1212030009, 2023A1515010757).
References
- Guo et al. [2020] Yulan Guo, Hanyun Wang, Qingyong Hu, Hao Liu, Li Liu, and Mohammed Bennamoun. Deep learning for 3d point clouds: A survey. IEEE Transactions on Pattern Analysis and Machine Intelligence, 43(12):4338–4364, 2020.
- Li et al. [2023] Maosu Li, Fan Xue, and Anthony GO Yeh. Bi-objective analytics of 3d visual-physical nature exposures in high-rise high-density cities for landscape and urban planning. Landscape and Urban Planning, 233:104714, 2023.
- Can et al. [2021] Gülcan Can, Dario Mantegazza, Gabriele Abbate, Sébastien Chappuis, and Alessandro Giusti. Semantic segmentation on swiss3dcities: A benchmark study on aerial photogrammetric 3d pointcloud dataset. Pattern Recognition Letters, 150:108–114, 2021.
- Zolanvari et al. [2019] SM Zolanvari, Susana Ruano, Aakanksha Rana, Alan Cummins, Rogerio Eduardo da Silva, Morteza Rahbar, and Aljosa Smolic. Dublincity: Annotated lidar point cloud and its applications. In Proceedings of the British Machine Vision Conference (BMVC), pages 127.1–127.13, Durham, UK, 2019. BMVA Press. https://bmvc2019.org/wp-content/uploads/papers/0644-paper.pdf.
- Hu et al. [2022] Qingyong Hu, Bo Yang, Sheikh Khalid, Wen Xiao, Niki Trigoni, and Andrew Markham. Sensaturban: Learning semantics from urban-scale photogrammetric point clouds. International Journal of Computer Vision, 130(2):316–343, 2022.
- Nederland [2019] Actueel Hoogtebestand Nederland. Dataset: Actueel hoogtebestand nederland (AHN3), 2019. https://www.pdok.nl/introductie/-/article/actueel-hoogtebestand-nederland-ahn3-.
- Varney et al. [2020] Nina Varney, Vijayan K Asari, and Quinn Graehling. DALES: A large-scale aerial LiDAR data set for semantic segmentation. In Proceedings of the IEEE/CVF Conference on Computer Vision and Pattern Recognition Workshops, pages 186–187, 2020.
- Li et al. [2020] Xinke Li, Chongshou Li, Zekun Tong, Andrew Lim, Junsong Yuan, Yuwei Wu, Jing Tang, and Raymond Huang. Campus3D: A photogrammetry point cloud benchmark for hierarchical understanding of outdoor scene. In Proceedings of the 28th ACM International Conference on Multimedia, pages 238–246, 2020.
- Kölle et al. [2021] Michael Kölle, Dominik Laupheimer, Stefan Schmohl, Norbert Haala, Franz Rottensteiner, Jan Dirk Wegner, and Hugo Ledoux. The hessigheim 3D (H3D) benchmark on semantic segmentation of high-resolution 3d point clouds and textured meshes from UAV LiDAR and multi-view-stereo. ISPRS Open Journal of Photogrammetry and Remote Sensing, 1:100001, 2021.
- HKPlanD [2019] HKPlanD. 3d photo-realistic model. Hong Kong: Planning Department, Goverment of Hong Kong SAR. Retrieved from https://www.pland.gov.hk/pland_en/info_serv/3D_models/download.htm, 2019.
- Graham et al. [2018] Benjamin Graham, Martin Engelcke, and Laurens Van Der Maaten. 3d semantic segmentation with submanifold sparse convolutional networks. In Proceedings of the IEEE Conference on Computer Vision and Pattern Recognition, pages 9224–9232, 2018.
- Zou and Li [2021] Zhenhong Zou and Yizhe Li. Efficient urban-scale point clouds segmentation with bev projection. arXiv preprint arXiv:2109.09074, 2021.
- Landrieu and Simonovsky [2018] Loic Landrieu and Martin Simonovsky. Large-scale point cloud semantic segmentation with superpoint graphs. In Proceedings of the IEEE Conference on Computer Vision and Pattern Recognition, pages 4558–4567, 2018.
- Thomas et al. [2019] Hugues Thomas, Charles R Qi, Jean-Emmanuel Deschaud, Beatriz Marcotegui, François Goulette, and Leonidas J Guibas. Kpconv: Flexible and deformable convolution for point clouds. In Proceedings of the IEEE/CVF International Conference on Computer Vision, pages 6411–6420, 2019.
- Qi et al. [2017a] Charles R Qi, Hao Su, Kaichun Mo, and Leonidas J Guibas. Pointnet: Deep learning on point sets for 3d classification and segmentation. In Proceedings of the IEEE Conference on Computer Vision and Pattern Recognition, pages 652–660, 2017a.
- Qi et al. [2017b] Charles Ruizhongtai Qi, Li Yi, Hao Su, and Leonidas J Guibas. Pointnet++: Deep hierarchical feature learning on point sets in a metric space. Advances in Neural Information Processing Systems, 30, 2017b.
- Hu et al. [2020] Qingyong Hu, Bo Yang, Linhai Xie, Stefano Rosa, Yulan Guo, Zhihua Wang, Niki Trigoni, and Andrew Markham. Randla-net: Efficient semantic segmentation of large-scale point clouds. In Proceedings of the IEEE/CVF Conference on Computer Vision and Pattern Recognition, pages 11108–11117, 2020.
- Lai et al. [2022] Xin Lai, Jianhui Liu, Li Jiang, Liwei Wang, Hengshuang Zhao, Shu Liu, Xiaojuan Qi, and Jiaya Jia. Stratified transformer for 3d point cloud segmentation. In Proceedings of the IEEE/CVF Conference on Computer Vision and Pattern Recognition, pages 8500–8509, 2022.