Panoramic Voltage-Sensitive Optical Mapping of Contracting Hearts using Cooperative Multi-View Motion Tracking with 12 to 24 Cameras
Abstract
Action potential waves triggering the heart’s contractions can be imaged at high spatial and temporal resolutions across the heart surface using voltage-sensitive optical mapping. However, for over three decades, optical mapping has been performed with non-moving, contraction-inhibited hearts. While it was recently demonstrated that action potential waves can be imaged on parts of the three-dimensional deforming ventricular surface using multi-camera optical mapping, panoramic measurements of action potential waves across the entire surface of the beating heart remained elusive. Here, we introduce a high-resolution multi-camera optical mapping system consisting of up to high-speed, low-cost cameras with which it is possible to image action potential waves at high resolutions on the entire, strongly deforming ventricular surface of the heart. We imaged isolated hearts inside a custom-designed soccerball-shaped imaging chamber with 24 windows, which facilitates imaging and even illumination with excitation light from all sides in a panoramic fashion. We found that it is possible to image the entire ventricular surface using 12 cameras with 0.5-1.0 megapixels combined resolution (about per pixel). The calibrated cameras generate gigabytes of video data per second at imaging speeds of , which we process and combine using various computer vision techniques, including three-dimensional cooperative multi-view motion tracking, to generate three-dimensional dynamic reconstructions of the deforming heart surface with corresponding high-resolution voltage-sensitive optical measurements. With our setup, we measured action potential waves at unprecedented resolutions on the contracting three-dimensional surface of rabbit hearts during sinus rhythm, paced rhythm, as well as ventricular fibrillation. Our imaging setup defines a new state-of-the-art in the field and can be used to study the heart’s electromechanical dynamics during health and disease.
- Keywords
-
Voltage-sensitive Optical Mapping, Fluorescence Imaging, Multi-Camera Imaging, Action Potential Waves, Cardiac Electrophysiology, Ventricular Mechanics, Cardiovascular Research
I Introduction
Imaging action potential waves in contracting beating hearts is a long-standing technical challenge in cardiovascular research [1, 2, 3, 4, 5, 6, 7, 8]. The action potential waves can be measured optically across the surface of isolated hearts using optical mapping, which employs voltage-sensitive fluorescent indicators, high-speed cameras and optical filters. Nevertheless, the optical signals which propagate rapidly across the heart muscle are very small and in order to be able to measure action potential waves it is necessary to combine sensitive optical equipment with precise numerical post-processing [5, 7]. Electrical mapping techniques, such as catheter-based electrode mapping or multi-electrode arrays [9], are a viable option to map electrical impulse phenomena in the heart, but they require physical contact with the tissue, do not allow simultaneous mechanical measurements of tissue strain, and do not achieve the same high spatial resolutions as optical mapping. Optical mapping of action potential waves is routinely done with pharmacologically contraction-inhibited hearts [10, 11, 12] and was even performed on the entire non-moving heart surface using panoramic multi-camera optical mapping [13, 14, 15, 16]. However, optical mapping of action potential waves on the contracting heart surface is much more challenging than in non-contracting hearts. It has been demonstrated in only a small number of studies [2, 3, 4, 5, 6, 7] and in even fewer studies when the measurements were performed on the deforming three-dimensional heart surface using multi-camera optical mapping [2, 3].
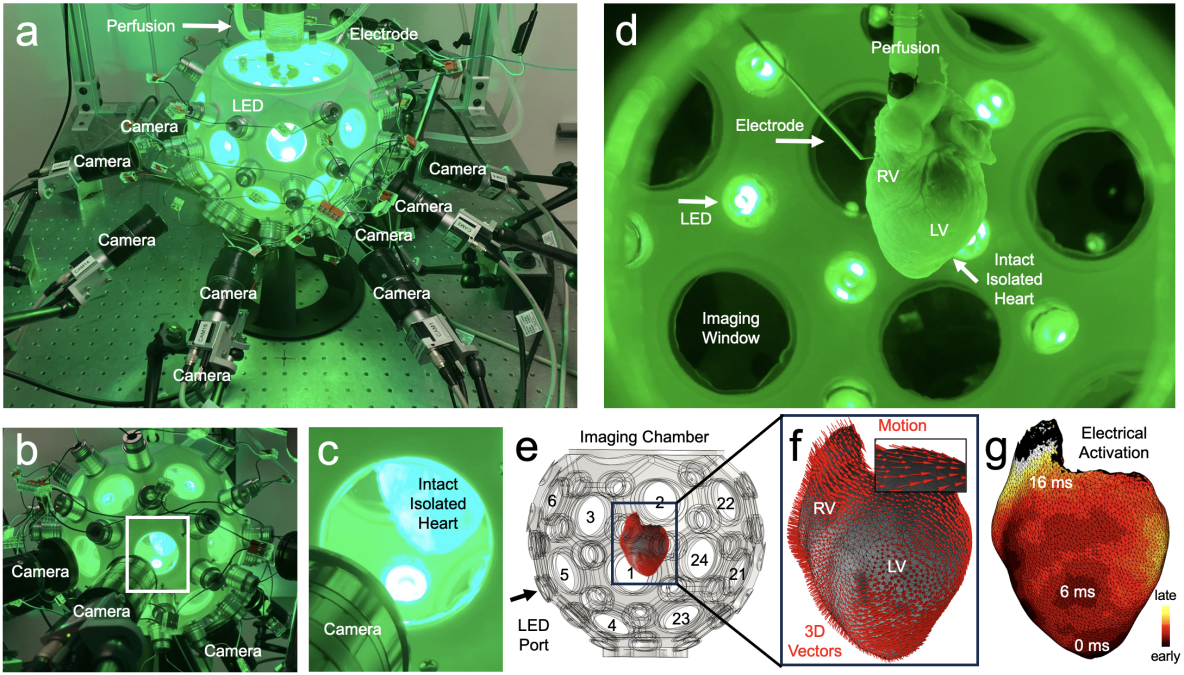
In this study, we present a panoramic multi-camera optical mapping system with which we image action potential waves, for the first time, across the entire ventricular surface of a fully contracting, strongly deforming heart, see Fig. 1. Our system comprises a custom-designed soccerball-shaped imaging chamber, with which it is possible to position up to 24 high-speed cameras around the heart and simultaneously evenly illuminate the tissue surface with up to 48 light-emitting diodes (LEDs). Using 12 cameras, we imaged action potential waves propagating across the entire contracting ventricular surface of isolated intact rabbit hearts during sinus rhythm, paced rhythms, and ventricular fibrillation. We mapped the electrical activation and measured epicardial deformation and tissue strain at high spatial (0.5-1.0 million pixels, 150 per pixel) and temporal (2ms) resolutions. Our imaging system is not only the first fully panoramic electromechanical optical mapping system covering the entire heart surface, but it also provides unprecedented spatial resolutions and has several key improvements and practical advantages over previously reported three-dimensional electromechanical optical mapping systems [2, 3].
I.1 Technical Background
Optical mapping is a highly sensitive measurement, which involves measuring small fractional changes in fluorescence exhibited by fluorescent dyes or genetic indicators in response to a physiological change, such as a change in the transmembrane potential during an action potential. Motion in optical mapping studies is typically associated with so-called motion artifacts, which arise quickly even with the slightest motion [17, 18, 5]. With the normal motion of the heart, and without numerical motion correction, motion artifacts completely compromise the measurements as they override the fractional change in fluorescence, and prohibit further analysis of the data. Numerical motion tracking can effectively suppress motion artifacts [2, 3, 4, 5, 6, 7, 19, 20], and is particularly effective when further combined with ratiometric imaging [2, 6]. Nevertheless, eliminating motion artifacts and measuring artifact-free action potential waves on the contracting heart surface is a non-trivial task and yet a challenge that needs to be solved.
Numerical motion tracking and three-dimensional reconstructions of objects are routine tasks in the field of computer vision. However, computer vision techniques are still not extensively utilized in the field of cardiac optical mapping, likely because they require particular technical expert knowledge and are challenging to adopt by cardiovascular researchers. Moreover, three-dimensional optical mapping of contracting hearts is a more challenging problem than most other computer vision tasks, which may have also hindered computer vision experts from entering the field. The technical challenges include: The tissue needs to be tracked precisely, with sub-pixel precision, to be able to measure the optical signals accurately per material coordinate over time and even slight tracking errors can lead to motion artifacts [5]. The optical signals are small and the spatial resolution of the videos is low, typically ranging in the order of to pixels. The fluorescence changes rapidly over time as it reports physiological function, which can introduce tracking artifacts [5, 7]. Noise, inhomogeneous illumination and other factors can cause further tracking and measurement artifacts. Overall, the video data comprises very particular image features largely determined by the properties of the involved fluorescent indicators and filters. Lastly, the heart’s motion and deformation is large, with the heart potentially moving out of the field of view. Together, these factors make optical mapping of contracting tissues a uniquely challenging problem. By default and without further customization, stereoscopic imaging or photogrammetry techniques, which are frequently used for shape reconstruction, lack the precision required for physiological measurements. Accordingly, attempts to reconstruct and optically map the three-dimensional surface of beating hearts were demonstrated in only two studies thus far [2, 3].
Zhang et al. [2] demonstrated for the first time that action potential waves can be imaged on the contracting three-dimensional left ventricular surface using multi-camera optical mapping. The imaging, motion tracking and three-dimensional surface reconstruction was performed with cameras and required fiducial markers glued to the epicardial surface, which were manually identified and then tracked through the video images in a semi-automatic fashion, as described in [21]. Subsequently, the reconstructed three-dimensional heart surface consisted of a low-resolution polygon surface comprising about - polygons with vertices defined by the fiducial markers used for tracking. Action potential measurements were averaged within each of the polygons without exploiting the full pixel resolution of the video images. The cameras were positioned at an angle of to allow sufficient overlap between their fields of view.
Christoph and Schröder-Schetelig et al. [3] demonstrated that action potential waves can be imaged on the contracting three-dimensional left ventricular surface at higher spatial resolutions and without markers attached to the heart surface. The imaging and three-dimensional reconstruction was also performed with cameras at , but the heart’s motion was tracked automatically in every pixel in each of the 4 videos, subsequently yielding a high-resolution polygon surface (4,000-5,000 polygons) with a spatial resolution comparable to the resolution of the video images ( pixels). With the cameras, it was possible to reconstruct nearly one half of the ventricular surface of the beating heart. However, one major drawback was that the approach required a static shape reconstruction of the pharmacologically uncoupled contraction-inhibited heart following each experiment. After the optical mapping of the contracting heart was completed, the heart was uncoupled with Blebbistatin. Once the heart was completely quiescent (15-30 minutes), it was rotated once around its long axis using a stepping motor while 72 images of its silhouette were taken every throughout the rotation. The silhouettes were then used to reconstruct the three-dimensional geometry of the quiescent heart using a shape-from-contour algorithm. Finally, the three-dimensional mesh showing the static heart was deformed using the two-dimensional motion tracking data obtained with each of the video cameras showing the beating heart. While this approach provided three-dimensional reconstructions of the shape of the deforming heart over time, it did not provide these reconstructions immediately during imaging. The required additional experimental part at the end with Blebbistatin was difficult to execute, and added post-processing steps and potential complications to each experiment that could prohibit further analysis. Most critically, the time available for imaging the beating heart was limited to a few minutes.
In this study, we address the previous shortcomings by introducing a stereoscopic multi-camera optical mapping approach, which uses multi-view imaging and three-dimensional cooperative motion tracking of the heart surface with many low-cost cameras. Our approach neither requires fiducial markers as in [2], nor a complicated static shape reconstruction obtained with Blebbistatin as in [3], is fully automatic, can be used to immediately reconstruct the heart surface and image action potential waves at high resolutions.
II Methods
II.1 Soccerball-shaped Imaging Chamber
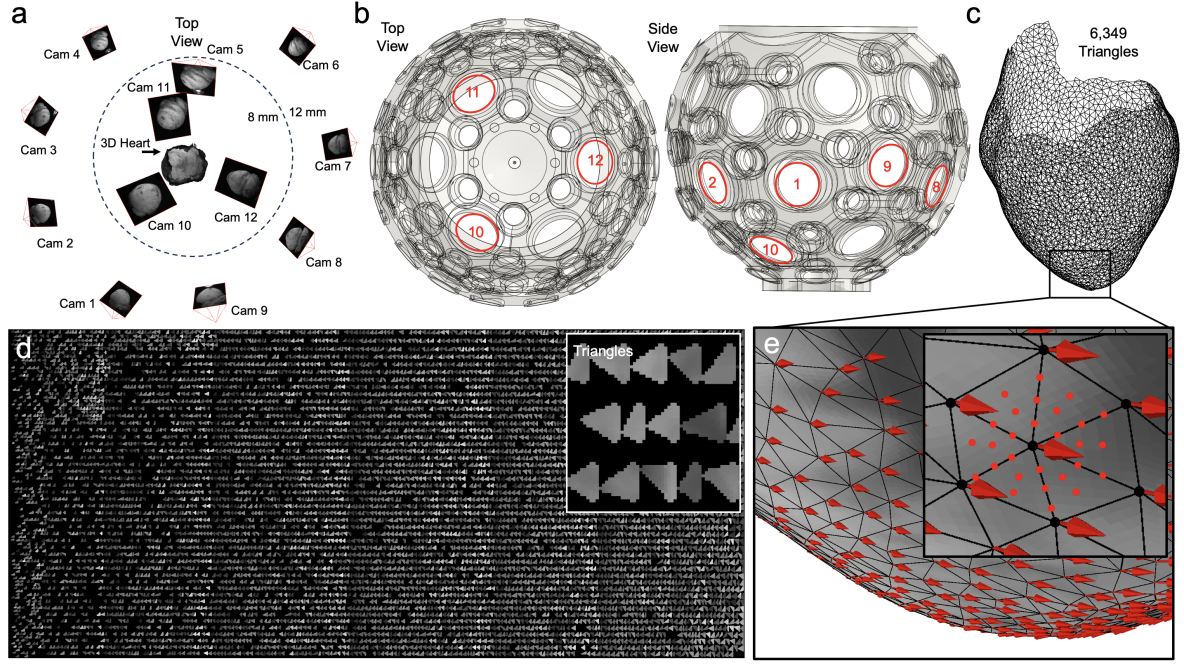
We designed a soccerball-shaped imaging chamber, which facilitates panoramic optical mapping of contracting hearts with up to cameras simultaneously. The chamber allows a dense coverage of the heart with overlapping fields of views, while also providing an evenly distributed, unobstructed illumination of the heart with up to 48 light-emitting diodes (LEDs), see Fig. 1. The chamber’s geometry is based on a truncated icosahedron or soccerball geometry. The soccerball is open at the top, has 24 penta- or hexagonal surfaces and an outflow at the bottom. Imaging can be performed through round windows in each of the 24 surfaces. The angle of the optical axes between two adjacent windows is or , respectively. Illumination can be provided through 48 small round windows (LED-ports) located at the vertices between the penta- or hexagonal surfaces. The volume of the chamber is about liters. The size of the chamber is determined by the working distance of the cameras and lenses, the size of the heart and the size of the windows through which imaging is performed. Hearts were positioned at the center of the imaging chamber, such that they can be seen through all windows without any obstructions. The chamber was 3D-printed (3D printer: Creality CR-10 V2, material: white PLA+ by Overture). The plexiglas windows were glued into the window openings using silicone.
II.2 Langendorff-Perfusion of isolated Hearts
New Zealand White rabbits () were anaesthesized and hearts were quickly excised and transferred into ice-cold cardioplegic solution. All procedures were in accordance with animal welfare law and were approved by the Instutitional Animal Care and Use Committe (IACUC) at the University of California, San Francisco. Hearts were prepared and subsequently placed inside the imaging chamber filled with warm, oxygenated Tyrode solution () and attached to retrograde Langendorff-perfusion within - minutes after excision. Hearts were perfused in constant-pressure mode. The Langendorff-perfusion system comprised a water-jacketed reservoir (Radnoti, model no. 120142-5, USA) that was positioned about - above the heart and connected via tubing to a heating coil with integrated bubble trap (Radnoti, model no. 158840, 10ml, USA) positioned directly above the heart. The perfusion pressure was regulated by adjusting the height of the water reservoir to create perfusion pressures of . Perfusion pressure was monitored using a digital manometer (Hti-Xintai Instrument, HT-1890, China). The Tyrode was oxygenated and its pH-level was kept constant at by bubbling Carbogen into the reservoir throughout the experiment. The pH-level was monitored using a digital pH meter (Extech PH220, Taiwan). An immersion circulator-heater (Polystat, Cole-Palmer, USA) was used to pre-heat water to , which was then pumped through the water-jacketed reservoir and heating coil to pre-heat the Tyrode solution. The resulting temperature of the Tyrode flowing out of the heating coil into the heart was . Hearts were stained with two bolus injections of voltage-sensitive dye (Di-4-ANEPPS, Biotium, Germany) into the bubble trap. The second bolus was injected minutes after the first bolus and imaging was started after about - minutes after the first injection. In this study, all hearts were imaged without pharmacological uncoupling agents, such as Blebbistatin.
II.3 Voltage-sensitive Multi-Camera Optical Mapping
Optical mapping was performed using up to high-speed CMOS cameras (acA720-520um, Basler, Germany), which were positioned around the imaging chamber on an optical table (TMC, USA). The cameras were aligned and fixed in place using articulator arms (Noga, Japan). The average angle between neighboring cameras was approx. , as shown in Figs. 1-3. The cameras produce 12-bit (dynamic range: -) greyscale video images with a maximal spatial resolution of pixels. Imaging was performed at speeds of with a spatial resolution of pixels. The cameras were triggered using a signal generator (FY8300, FeelElec, China) to synchronize the video acquisition. Emission light was collected through machine vision lenses (3x CF8ZA-1s from below, 9x CF12ZA-1s horizontal, Fujinon, Japan) mounted onto each of the cameras together with long-pass emission filters (Dark Red #29, Heliopan, Germany), which block green excitation light and transmit red and near-infrared fluorescent light. With the magnification of the lenses, the video images covered a field of view of about at working distances of about 10-15cm, see Fig. 1a). Green excitation light was provided by up to 40 high-power light-emitting diodes (Cree XLamp XP-E2 High Power LED Star Single 1 Up, 530nm center wavelength, USA), which were directed at the heart through the small LED-ports between the imaging windows of the imaging chamber, see Fig. 1a,e). The videos from the cameras were streamed via USB onto a computer (AMD Ryzen Threadripper 3960X CPU, 2TB SSD working memory, Gigabyte Technology Co. TRX40 mainboard) using the 9 integrated USB ports and additional external USB hubs (10 Gbps, USB 3.2 Gen 2).
II.4 Rhythm Control and Other Data Acquisition
Paced rhythms were induced using a custom-made micro-electrode (FHC Inc., USA), see Fig. 1d), which was connected to an isolated pulse stimulator (A-M Systems, model 2100, USA), which was externally triggered using custom-made software. Regular ventricular pacing was induced using 8ms long biphasic pulses applied at 3-8 Hz. Ventricular fibrillation was induced using burst pacing at frequencies ranging from 15-50 Hz and terminated using a custom-made defibrillator. Camera triggers and stimulation pulses were recorded during the experiment using an analog-to-digital data acquisition system (PowerLab 16/35, ADInstruments, Australia).
II.5 Camera Calibration
Camera calibration refers to the process of determining extrinsic and intrinsic camera parameters with the goal of undistorting the cameras and establishing the relative positioning and alignment of the cameras with respect to each other, see Fig. 2. Camera calibration was performed after each imaging experiment using an ChArUco calibration target with a 4 mm checkerboard pattern and ArUco fiducial markers in each of the black squares [22]. We manually positioned and rotated the calibration target within the imaging chamber and took a full set of images per pose of the target with all cameras simultaneously. The target was typically observable by at least 2-3 cameras. The calibration procedure required typically 30-100 of image sets in total, while at least 2-3 sets needed to be taken for each camera. With both the extrinsic and intrinsic camera parameters, we are able to transform a 3D world coordinate to an image coordinate, but for the transformation to be accurate we must account for camera distortion. In addition to the camera’s inherent distortion, the refraction from the light passing from water to glass to air introduces significant additional distortion. Kwon et al. showed that the refraction error can be accounted for using standard camera distortion calibration [23]. We used multical to perform the camera calibrations [24].
II.6 Three-Dimensional Motion Tracking and Surface Reconstruction using Cooperative Multi-View Tracking
Using the camera calibration, we used COLMAP [25] to produce raw, static 3D reconstructions of the heart for each frame over time. A frame corresponds to a set of video images acquired at the same time by the different cameras. The static reconstructions were performed independently from each other frame-by-frame over the sequence of frames, producing a sequence of unique, uncorrelated raw meshes with different numbers of vertices and topologies. Visually, these meshes reflect the motion of the heart when texturized, but they cannot be used to measure action potential waves or strain.
To compute a single moving mesh that represents a dynamic reconstruction of the moving heart surface, we used a three-dimensional mesh tracking technique by Klaudiny et al. [26]. This cooperative patch-based mesh tracking technique produces a single moving mesh with fixed topology and the same number of vertices over time from the individual meshes from the static reconstructions. It does so by tracking the vertices of a template mesh, searching for the corresponding tissue segments in both the other already pre-computed raw meshes and in the different camera images. In our case, the template mesh corresponds to one of the raw meshes obtained during the static reconstructions used as a reference frame. The reference frame shows either the heart shortly before the depolarization of the ventricles during sinus rhythm, or is an arbitrary frame in case of arrhythmias. To produce the next mesh in the sequence of frames, the algorithm uses first the reference mesh and then each previous mesh as a starting point and then computes and minimizes an error function for each vertex using a patch-match inspired approach [27]. This results in a new time-varying mesh with vertices moving in a manner such that its positions have moved in accordance with the video data from the different cameras.
In more detail, the vertex error function is comprised of an image-based component and a mesh-based component. For the image component, we created a set of sample points surrounding the vertex on the mesh’s surface, as shown in Fig. 1 in [26] and Fig. 3e). This is done for the vertex in the previous mesh and vertex in the new mesh, which is initially a replication of the previous mesh. These sample points are projected into the camera images in which they are visible in. The pixel values of the previous mesh’s vertex sample points are compared with the new mesh’s vertex sample points using a normalized cross-correlation similiarity measure. This ensures that the area around the vertex in the new mesh is similar to the corresponding vertex in the previous mesh. For the mesh component, it computes the distance of the vertex from the surface of the raw, static mesh. This distance is passed through the Tukey biweight function to reduce the effect of outliers. The image error and mesh error components are summed with a weighting term for the mesh error: . The mesh error reduces the search space and drift over time. We optimized the vertex error using a cooperative optimization algorithm that optimizes all vertices together [27]. It begins by randomly translating each vertex multiple times and then keeping track of the displacement that produces the lowest error. In the next step, each vertex applies their neighboring vertices best displacements to itself and checks if it improves the error. The random search and neighbor searching stages are repeated in successsion 4-5 times to find the vertex positions for the new mesh that minimize the error. Subsequently, we take the displacements of the new mesh’s vertices with respect to the previous mesh and apply a weighted smoothing to the displacements based on the vertex error. This results in a completed mesh tracking step for one frame, which is then repeated sequentially for all frames to produce the time-varying mesh over the entire sequence of frames.
II.7 Post-Processing
The vertices of the time-varying mesh describe the motion of the heart surface. With that information, signal analysis can be performed in a co-moving frame of reference. Accordingly, we warped the video images using the two-dimensional projections of the movements of the three-dimensional mesh in the camera images to be able to further process the data in an image-based co-moving frame of reference, see section II.7. This step significantly reduced motion artifacts, see Fig. 8a,b). However, because the resolution of the mesh is lower than the resolution of the video images, we further performed optical flow-based motion tracking as described in Lebert et al. [7] using a GPU-accelerated version of the Farnebäck algorithm [28] on the already warped video images and warped them further with respect to the reference video images. This last step significantly reduced residual motion and motion artifacts in the triangles between the vertices and is included in all motion-compensated optical maps shown throughout this study. Otherwise, we texture-mapped the raw grayscale video images showing the moving heart onto the moving mesh to produce texturized meshes as shown in Fig. 4a), 5b,d), 7c) and 8c). Similarly, we projected the warped, processed and then unwarped videos onto the moving mesh. Projections were performed using a weighted average based on the angle between the mesh’s surface normal and the camera’s direction. The texture data was saved in 8-bit format as a PNG file, so the textures could be processed by general mesh viewing tools. Each camera had 2-4 neighboring cameras at a time depending on their overlap. The average angle between cameras used for depth-map creation was , which includes nearest-neighbouring cameras as well as second-nearest cameras and cameras further away.
All post-processing of the video data was performed in a co-moving frame of reference as well as in an image-based fashion in the individual warped video images. The three-dimensional post-processed (e.g. normalized) optical maps are the average of multiple post-processed videos and are combined using a weighted average with the weights being the angle between the triangle normals and camera’s view direction. To visualize action potential waves, we normalized the optical signals representing action potentials in the video data per pixel over time. We used a pixelwise normalization with a temporal sliding window (30 - 50 frames lenth), or a framewise difference computation with subsequent temporal normalization to amplify the optical signal, see sections III.1-III.3 and Figs. 4-9. Spatial or temporal smoothing was not applied throughout this study.
II.8 Phase Maps and Phase Singularity Calculation
Phase maps were computed from the motion-stabilized and pixel-wise normalized optical mapping videos in each camera individually. The phase angle was computed for each time-series using the Hilbert transform. The resulting phase maps were smoothed using a complex order parameter filter as described in [29]. The smoothed phase maps were then projected onto the three-dimensional mesh and averaged from multiple camera perspectives if the respective pixels overlapped. Phase singularities were computed on the three-dimensional mesh surface by computing the circular integral of the gradient of the phase, as described in [30].
III Results
We performed fully panoramic voltage-sensitive optical mapping with contracting isolated hearts, imaging action potential waves across the entire three-dimensional deforming ventricular surface during sinus rhythm, ventricular pacing and ventricular fibrillation, see Figs. 4-10 and Supplementary Videos 1-4. The videos as well as interactive 3D renderings are available at: https://cardiacvision.ucsf.edu/videos/3d-optical-mapping/.
III.1 Sinus Rhythm
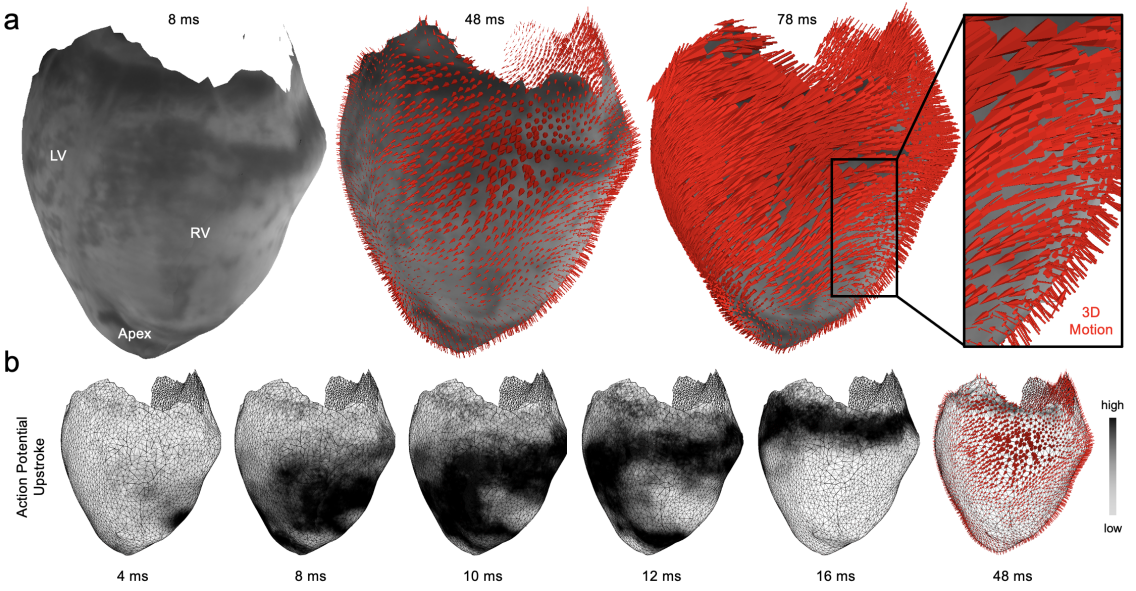
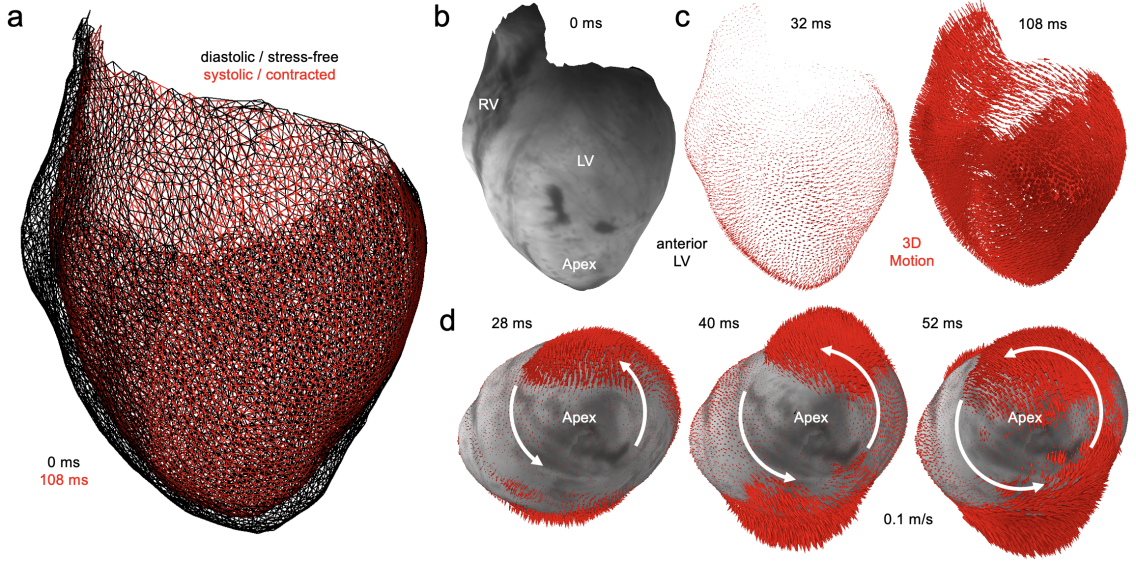
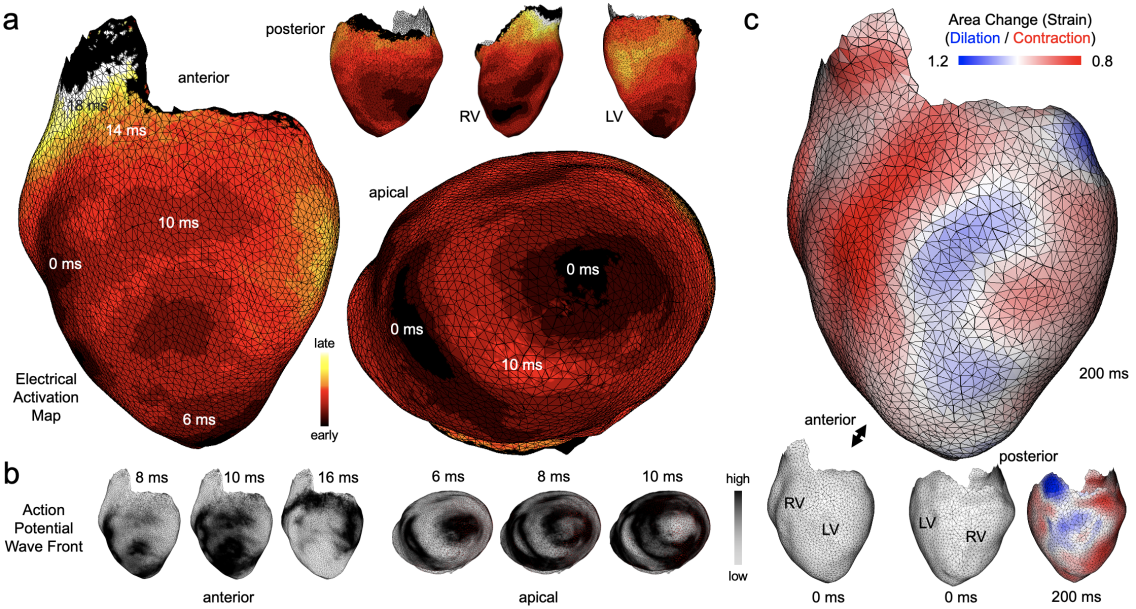
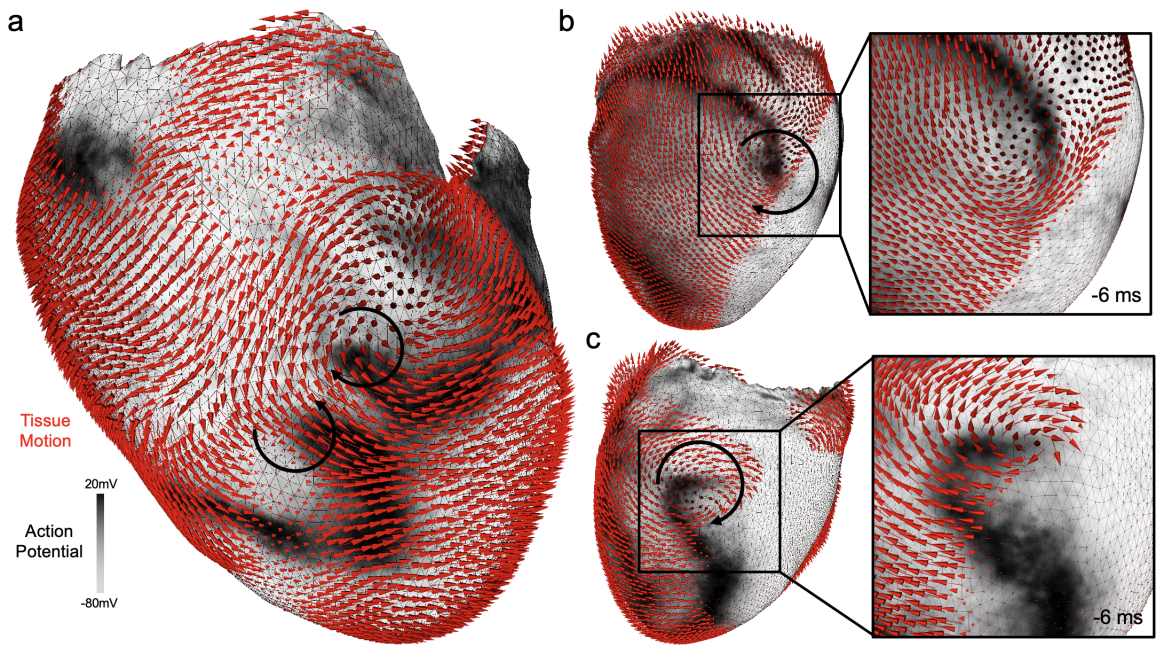
Sinus rhythm poses the most challenging imaging condition when imaging contracting hearts in optical mapping studies. During sinus rhythm, the heart contracts and deforms much stronger than during most paced rhythms or during arrhythmias. Accordingly, it is more challenging to track the tissue, as it is likely to move out of the field of view or deform so strongly that optical flow algorithms cannot correlate two video images when imaging with a single camera. Likewise, motion artifacts can become very strong during sinus rhythm. Figs. 4, 5 and 6 as well as Supplementary Video 1 show that, using our multi-view cooperative tracking approach, we can track the strongly deforming ventricles during sinus rhythm and subsequently map action potential wave fronts propagating across the entire three-dimensional ventricular surface at unprecedented resolutions. Figs. 4a) and 5b-d) show the reconstructed three-dimensional ventricular surface together with displacement vectors (red, size of arrows scales with length) indicating the motion and deformation of the heart as it contracts in response to the depolarization of the ventricles. The vectors in Figs. 4a) and 5c) indicate displacements of the epicardial surface with respect to its stress-free unloaded mechanical configuration during diastole just before the onset of the depolarization (at 0 ms), while the vectors in Fig. 5d) indicate instantaneous displacements between subsequent frames with respect to the previous frame acquired 2 ms earlier. The instantaneous displacements therefore correlate with contractile speed. The mechanical measurements allow us to analyze the intensity fluctuations across the heart surface in a co-moving frame of reference and compensate motion artifacts. Correspondingly, Figs. 4b) and 6b) shows the action potential wave that triggers the contraction as it propagates across the left and right ventricles (LV, RV). The black wave corresponds to the action potential wave front or upstroke, which was computed as the difference between pixel intensities in subsequent frames in the co-moving frame. The high negative rate of change in intensity (negative ) is associated with Di-4-ANEPPS reporting the rapid depolarization and change in transmembrane voltage. The action potential wave originates in several locations in the apical and septal regions in both the left and right ventricles and propagates upwards towards the base of the heart, activating the entire ventricular muscle within less than 20 ms, as also depicted by the electrical activation map shown Fig. 6a). The ventricles begin to contract and deform shortly thereafter, see Figs. 4 and 5c,d). However, noticeable contraction sets in only about 30 ms after the onset of the depolarization of the ventricles. The ventricles exhibit maximal contraction velocities of about 0.1 m/s about 40-50 ms after the onset of the depolarization with peak velocities at 48 ms, see Fig. 5d). These high contraction speeds then lead to the large deformations depicted by the wireframe mesh in Fig. 5a) and the corresponding displacements shown in Fig. 5c). Our data shows that the depolarization phase of the action potential and the onset of contraction are clearly separated in time. Overall, the heart exhibits an intricate and large deformation including torsional motion around the apex, see Fig. 5d). It moves upwards as it contracts, while its base remains roughly in its vertical position, see Fig. 5a). The epicardial surface experiences mostly contractile strain with a local area decrease of about 10-20%, however, some regions experience tensile strain with a local area increase of about 5-15%, see Fig. 6c).
Our data demonstrates that we can measure both the electrical and mechanical dynamics of the heart during sinus rhythm simultaneously at very high spatial and temporal resolutions. In this example, both the wireframe mesh and the vectorfield consist of vertices or displacement vectors, respectively, the vertices forming polygon triangles. The average distance between two neighbouring vertices is and the average area of a polygon triangle is about (at 0ms). The entire ventricular surface is resolved by 668,793 pixels, where each polygon triangle consists on average of about 100 pixels, see Fig. 3d). The spatial resolution of the texture map is so high that it is possible to identify individual small vessels and other fine-scaled structures across the ventricular surface, see Figs. 4a) and 5b). Per pixel, the spatial resolution is about 150 . The horizontal (short-axis) diameters of the heart are and along the shorter and longer axes of the elliptical shape of the heart, respectively. Figs. 4-6 and Supplementary Video 1 show the same heart.
III.2 Paced Rhythms
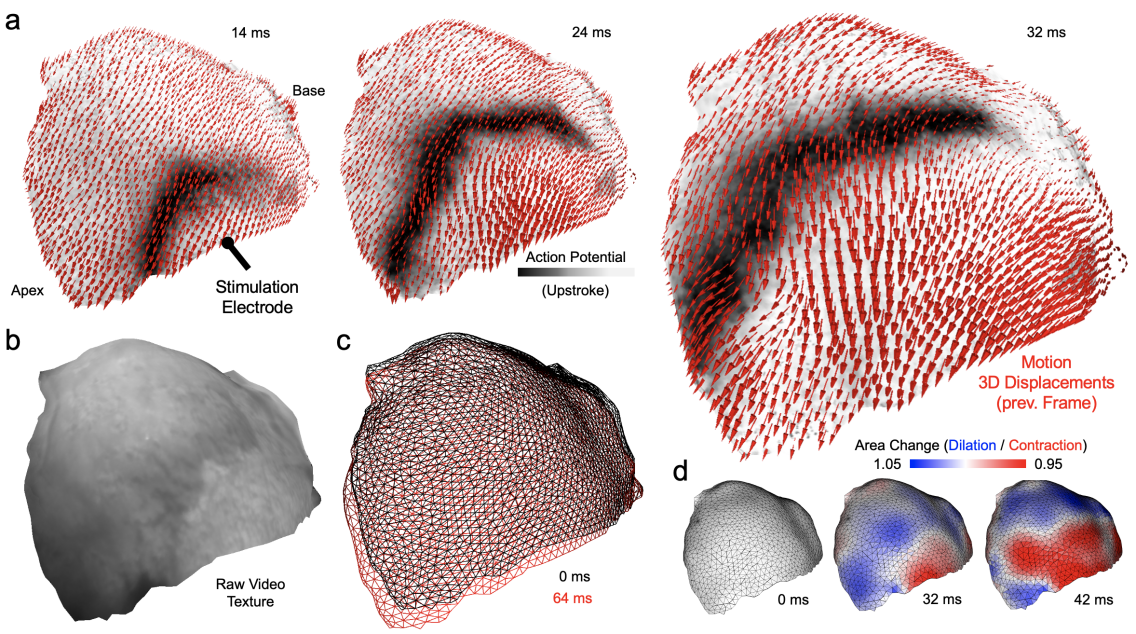
To investigate the relationship between electrical waves and mechanical deformation in more detail, we imaged a planar action potential wave as it propagates across and deforms the left ventricle (LV) during pacing, see Fig. 7 and Supplementary Video 2. Pacing stimuli were applied using the micro-electrode shown in Fig. 1d). Fig. 7a) shows an action potential wave front (black) originating from the stimulation site (bottom) and propagating upwards across the deforming left ventricle. As in Figs. 4b) and 6b), the wave corresponds to the action potential wave front or upstroke (normalized temporal derivative of intensity with dark regions emphasizing a high negative rate of change in intensity). The motion and deformation of the epicardial surface is indicated by three-dimensional displacement vectors (red), which indicate shifts with respect to the previous frame acquired 4 ms earlier. The tissue moves down, see also panel c), and towards the approaching wave and then contracts noticeably and more quickly when the action potential wave front has passed. Accordingly, the area change across the epicardial surface shown in panel d) indicates dilated areas (blue) before the action potential wave front approaches and contracting areas (red) within the action potential wave, which is further experimental evidence for electromechanical waves consisting of closely correlated electrical and mechanical wave phenomena, as described in [4, 31]. The data was generated using 5 cameras, which were positioned on one side of the heart, using the top, center and bottom windows. Imaging was performed with 8 cameras, but camera data that was partially obstructed by the pacing electrode was discarded. The imaged area corresponds to the anterior LV.
III.3 Ventricular Fibrillation
Hearts contract only minimally during ventricular fibrillation. However, the residual contractile motion during fibrillation is strong enough to produce considerable motion artifacts in optical mapping studies. In this study, we discuss two episodes of ventricular fibrillation (VF): one with very little to almost no motion (VF1), shown in Fig. 8 and Supplementary Video 3, and one with finite, moderate contractile motion (VF2), shown in Figs. 9 and 10 and Supplementary Video 4. The different contractile strengths between the two VF episodes can be associated with a much shorter action potential duration, which leads to accelerated fibrillatory dynamics (20 Hz activation frequencies) and very minimal motion in episode VF1, versus a longer action potential duration which leads to slower fibrillatory dynamics (10 Hz activation frequencies) and moderate contractile motion in episode VF2, see Fig. 8d,e). While episode VF1 is an interesting example to discuss motion artifacts, in episode VF2 we can correlate electrical wave patterns with mechanical deformation patterns. Both episodes were recorded in the same heart.
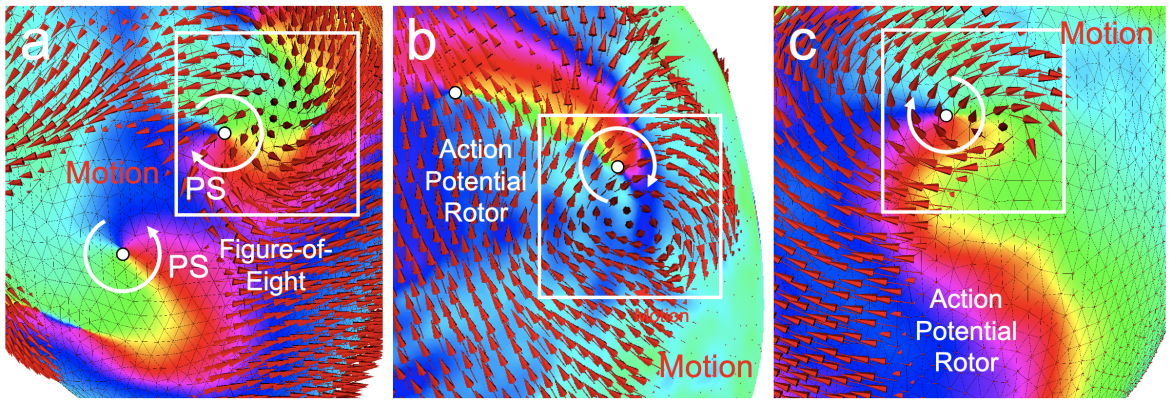
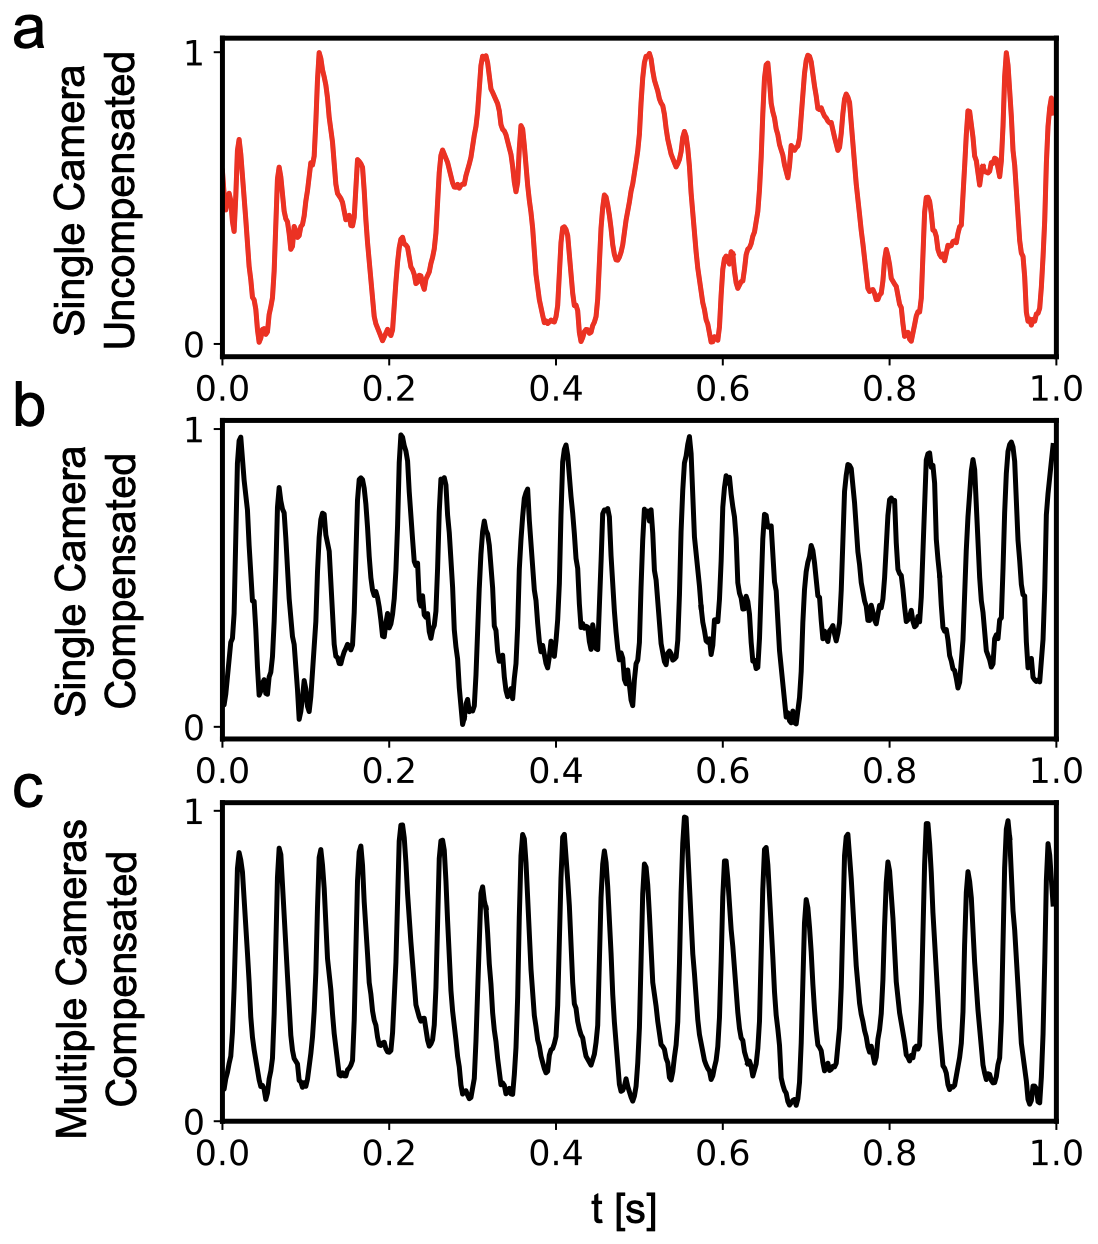
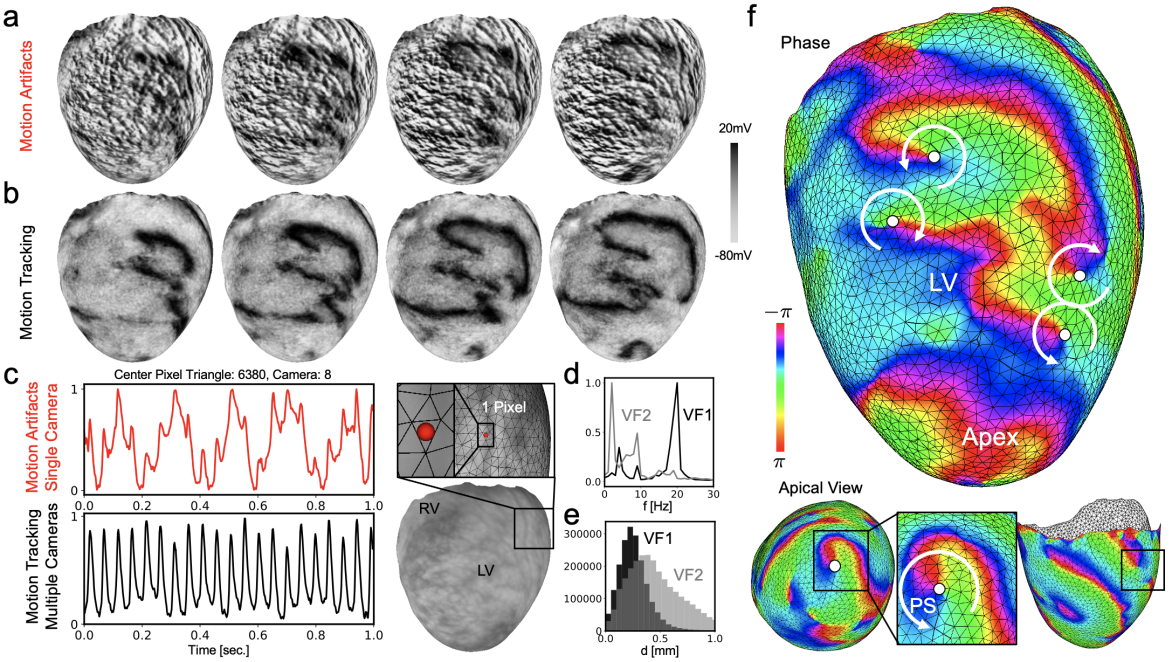
Fig. 8a,b) shows that even with very little to almost no motion the tissue needs to be tracked, because otherwise motion artifacts become so strong that they prohibit further analysis of the data. Panel a) shows pixel-wise normalized optical maps, which were not tracked and subsequently not analyzed in a co-moving frame. Motion artifacts manifest as the high-frequency dark-bright pattern, which superimposes the action potential waves, see [5] for an in-depth characterization and explanation of their origin. By contrast, panel b) shows that the pixel-wise normalized optical maps that were computed in the co-moving frame after motion tracking do not exhibit any significant motion artifacts, but instead show multiple reentrant vortex-like action potential wave patterns. Note that here and in Fig. 9, we display the action potential wave and not the action potential wave front as in Figs. 4-7. The dark area corresponds to depolarized tissue, the bright area to repolarized tissue (normalized units [0,1]). In this episode VF1, the action potential duration is extremely short in the order of 30-40 ms and the wavelength is in the order of 1-3 mm, respectively. In both Figs. 8a,b) and 9, we amplified intensity fluctuations numerically using pixel-wise normalization with a sliding window (with a length of 50 frames). The tissue only moves on average by about 0.2-0.3 mm, see Fig. 8e). The fact that the strong motion artifacts in Fig. 8a) occur at all with this little motion highlight the necessity to track the tissue and analyze the video data in a co-moving frame of reference more generally. All other examples in this study, particularly the sinus and pacing data, exhibit much stronger motion and it is therefore absolutely required to employ motion tracking and motion artifact compensation in general with moving tissue preparations. Fig. 8c) shows optical traces before and after motion tracking with and without motion artifacts, respectively. The top trace shows a measurement without tracking obtained from a single pixel of one of the cameras (red dot, the pixel is located at the center of the respective polygon triangle). The time-series shows an unrecognizable, distorted sequence of action potential waves superimposed by strong intensity modulations, which are likely caused by the back and forth movement of the darker nearby vessel through the area. The bottom trace shows the corresponding measurement obtained in a co-moving frame, again from a single pixel. As the measurement was obtained from the same area of the tissue (the center pixel of the polygon triangle) due to the tracking, the motion artifacts from above are largely compensated and the trace shows instead a sequence of action potentials. The residual baseline modulations are residual illumination-related motion artifacts likely caused by relative motion between the tissue and the LEDs. As this relative motion cannot be removed by motion tracking per se, see also [6, 7] and Discussion, it would be required to employ ratiometric imaging [2, 6] or numerical light-field correction methods [3] to suppress these residual motion artifacts. However, we found that the tracking as well as the averaging of data from multiple cameras significantly enhances the imaging quality, see also Supplementary Figure 11b,c).
Lastly, Fig. 8f) displays phase maps, which we computed from the motion-stabilized optical maps and traces shown in Fig. 8a-c). The phase maps emphasize the vortex-like structure and topological organization of the action potential wave pattern, and indicate the rotational centers of the electrical vortex waves as phase singular points (PS, white dots), see also Supplementary Video 3. In this example, there are several rotating vortices including a figure-of-eight pattern in the anterior left ventricle (LV) and a persistent rotating vortex close to the apex. The phase singularities allow us to automatically track electrical vortex waves across the moving three-dimensional ventricular surface.
With the larger contractions in episode VF2, we can now investigate the relationship between reentrant action potential vortex waves and the three-dimensional deformation of the epicardial ventricular surface, see Figs. 9 and 10 and Supplementary Video 4. Fig. 9a-c) shows three examples of reentrant action potential waves (black: depolarized tissue, light gray: repolarized tissue, normalized units [0,1]): panel a) shows a figure-of-eight pattern and panels b,c) show two clockwise rotating action potential waves in the left and right ventricle, respectively. In this slower episode, the action potential waves induce noticeable contractions, which lead to macroscopic deformations of the ventricles in response to the electrical activations. The dominant frequency of the action potential vortex wave dynamics is about 10Hz, see Fig. 8d). At these slower activation frequencies, the contractions are much stronger than at the higher frequencies in episode VF1 in Fig. 8, which is an observation that was also made in [4]. The tissue moves on average by at least about 0.5-1.0 mm and in many instances even stronger than that, see Fig. 8e). The larger deformations produce smoothly varying vector fields in space and time and it is possible to identify curls in these deformation patterns. Note that the displacement vectors are scaled differently than in Figs. 4-7 and 9. Here they display only the direction of the movements of the vertices and not the magnitude of these movements. We chose this visualization to highlight vortices or curls in the displacement vectorfields, which emerge repeatedly close to electrical phase singularities (PS). Displacement vectors which point into the heart muscle are not visible in Figs. 9-10. Fig. 10 shows the corresponding phase maps and the mechanical curls in the vicinity of electrical PS. Our data confirms a strong correlation between action potential waves and tissue deformation during ventricular fibrillation, and hints at topological abnormalities in the form of mechanical vortices/curls that emerge in the deformation of the heart wall during ventricular fibrillation. The strong correlation was first described in [4] analyzing single-camera optical mapping data. Here, we present, for the first time, three-dimensional measurements of reentrant action potential waves and co-localized vortex-like tissue deformation across the ventricular surface.
IV Discussion
In this study, we demonstrated that it is possible to image action potential waves at high resolutions across the entire deforming ventricular surface of contracting isolated hearts using voltage-sensitive multi-camera optical mapping and three-dimensional numerical motion tracking. With our setup, we are able to measure electrical and mechanical phenomena in the heart at very high spatial and temporal resolutions, and measure typical quantities, such as electrical activation times and tissue strain, simultaneously in three dimensions across the moving and deforming heart surface. The measurement data is invaluable as it can be used to study the heart’s electromechanics in unprecedented detail and to inform and calibrate electromechanical computer models. While we used 12 cameras in the present study, our imaging chamber fits up to 24 cameras and in the future we aim to image the whole heart including the atria with more cameras. We anticipate that we will use 2 sets of up to 12 cameras to image action potential and calcium waves simultaneously across the entire surface of the contracting heart to study the three main physiological players underlying the heartbeat: voltage, calcium and contraction.
IV.1 Practical Considerations
Our overall approach and design of the imaging setup utilizes the recent availability of industrial-grade low-cost cameras [32]. These cameras produce lower quality video images, but we found that averaging the overlapping video images across the three-dimensional surface produces high signal qualities. The lower costs enabled us to integrate far more cameras into our setup than previously possible with more expensive scientific cameras. This enabled us to pursue a more robust panoramic optical mapping approach. In the past, multi-camera optical mapping systems consisted of up to 4 scientific cameras [2, 3], the main limiting factor being cost. While 3-4 cameras are sufficient for mapping the entire surface of non-moving hearts [13, 14, 15, 16], and low-cost cameras were already used for that purpose [32], it was estimated in [3] that at least 8 cameras would be necessary to image the entire ventricular surface of a contracting heart.
In this study, we showed that operating 12 or more cameras is technically and practically feasible. We streamed the video data from 12 cameras onto a single computer using USB, and we did not experience major issues with camera failures, the high data rates, or calibrating the cameras. Nevertheless, the high data rates and large amounts of data that need to be captured, stored and processed during and after each experiment do pose a challenge. With 24 cameras and video image resolutions of pixels, we would obtain data rates of 3 gigabytes per second. Accordingly, a 10 second long recording with 24 cameras would create 30 gigabytes of data. In our case with 12 cameras, a single experiment with 25-50 recordings produced on average about 0.5-1.0 terabytes of data. While we crop the video images and discard unnecessary data during the experiment to save storage space, further work is needed to compress the raw data into a suitable format for long-term storage.
Despite the many cameras, our imaging setup is cost-effective with an overall approximate cost of $20,000 for 24 cameras ($400 each) including the respective lenses ($500-800 each). By comparison, a single scientific camera costs $10,000-$50,000 (e.g. Brainvision Scimedia MiCAM Ultima / N256, Teledyne Photometrics Evolve 128, Oxford Instruments Andor) and a setup of 4-10 scientific cameras would correspondingly cost $100,000-$500,000, which is prohibitively expensive for most laboratories. Adopting our low-cost design with industrial-grade cameras could enable more researchers to venture into the world of panoramic three-dimensional optical mapping.
IV.2 Advantages
The main advantage of our approach is that it does not rely on fiducial markers [2] or any additional shape reconstruction methods [3]. As already mentioned in the introduction, the method described in Zhang et al. [2] required fiducial markers, which impose lower spatial resolutions and may affect the tissue’s mechanics. In Christoph and Schröder-Schetelig et al. [3] it was necessary to perform a static shape reconstruction with the excitation-contraction uncoupling agent Blebbistatin. This additional step limited the time that was available for optical mapping to 5-15 minutes, because swelling of the heart, photo-bleaching or wash-out of the fluorescent dye would compromise the motion tracking and shape reconstructions. With our approach, there are no such constraints. We can perform measurements over 1-2 hours, then calibrate the cameras, track the tissue in the recorded data and generate three-dimensional dynamic reconstructions in a fully automatic fashion post-acquisition. Currently, the only manual step during post-processing comprises selecting a region of interest in the raw reconstructions and cleaning the mesh before continuing with the dynamic reconstructions.
Another advantage is that the soccerball-shaped imaging chamber allows us to image and illuminate the heart from as many as 24 and 48 pre-defined locations, respectively, which are evenly spaced and distributed around the heart. This circumvents several issues with regard to inhomogeneous illumination, space restrictions and other complications that arose with previous experimental setups. A crucial element in optical mapping studies with contracting hearts is to illuminate the heart as homogeneously as possible. The homogeneous illumination minimizes illumination-related motion artifacts, which are caused by relative motion between the tissue and the light sources, see limitations section in the discussion in [7]. Even though it is impossible to illuminate the heart perfectly homogeneously, our illumination scheme produces smaller illumination gradients than if illumination occured from fewer sites. For instance, in octagonal baths with 8 glass walls, which were used in [3] and [4], the fewer windows restrict the positioning of the cameras, which need to image perpendicularly through the windows, and require careful positioning of the light sources to avoid back-reflections from the glass surfaces in the camera images or shadows on the heart surface. We circumvented these issues with our chamber design, which allows the unobstructed illumination and imaging of the heart. A similar approach was described for an optical fiber-based imaging setup reported in [33].
Lastly, we achieved very high spatial resolutions thanks to the many cameras and the Sony IMX287 CMOS sensor, which produces images in the order of pixels at 500 fps. We measured electrical wave phenomena on the entire ventricular surface with about 0.5-1 million pixels (about per pixel). At these resolutions, we can identify single small vessels across the ventricular surface. Thus far, optical mapping was performed only on parts of the contracting ventricular surface, with video images in the order pixels. The Sony sensor comprises a lower dynamic range and smaller pixels () and is associated with lower light-efficiency and signal-to-noise ratio (than e.g. Teledyne Photometrics Evolve 128), see also [32]. However, we demonstrated that the signal quality is excellent in a multi-camera setting with the averaging of the signals from multiple cameras. Previously, we already determined that the video data resulting from these cameras can be tracked [7].
IV.3 Limitations
The main limitation in our current study is that we cannot fully compensate residual illumination-related motion artifacts, see also section 4.1 in [7]. The physical motion between the tissue and the light sources persists even though the motion of the heart is apparently non-existent in the co-moving frame of reference after motion tracking. Regardless of the tracking, in physical space the tissue moves from slightly brighter to darker areas and vice versa, which leads to modulations of the baseline of the optical signals, see Supplementary Fig. 1. While we can compensate these baseline modulations during post-processing, in the future, we intend to integrate ratiometric imaging and numerical methods to compensate illumination-related motion artifacts more thoroughly. Currently, we discard data in which the heart surface is occluded (e.g. by the micro-electrode) and further work is needed to be able to include such data. Another challenging technical aspect during the experiments is associated with the low dynamic range of the cameras (12-bit: 4,096 counts): we had to manually adjust the apertures of each of the cameras throughout the experiment to ensure that the brightnesses of the video images would match and that the full dynamic range of the sensor was utilized. These adjustments could only be made after staining and eventually needed to be repeated with each restaining for each camera individually. Even though we used GPU-accelerated motion tracking [7] in the 2D part of our hybrid 3D/2D tracking approach, the 3D part is implemented on the CPU and it takes several hours to track a few hundred frames. Further work is needed to implement fully GPU-accelerated tracking to increase processing speeds. Lastly, we do not have a direct method to validate our reconstructions and further work is required to cross-register and compare the heart shape with the heart shape generated with a different imaging modality, such as ultrasound or computerized tomography. However, the minimal amount of residual dissociation-related motion artifacts, as described in [5], and the minimal blurring of the averaged video images projected onto the reconstructed heart surface, are indirect measures and indicators for the high precision and accuracy of our approach.
V Conclusions
For over 30 years, optical mapping of action potential or calcium waves has been performed in contraction-inhibited hearts. As a result, studying the interplay of cardiac bioelectricity and biomechanics, two of the main players involved in the heartbeat, has been limited. Here, we demonstrated, for the first time, panoramic optical mapping of action potential waves across the entire, three-dimensional deforming ventricular surface of beating hearts. Our optical mapping system provides high-resolution imaging data, which can be used to study both the electrical and mechanical heart muscle physiology in unprecedented detail, and could allow new insights into the mechanisms of mechano-electric feedback.
Funding
This research was funded by the University of California, San Francisco, the National Institutes of Health (DP2HL168071), and the Sandler Program for Breakthrough Biomedical Research, which is partially funded by the Sandler Foundation (to J.C.). This research was also supported through the Academic Hardware Grant program by the NVIDIA Corporation (to J.L. and J.C.).
Conflict of Interest Statement
The authors declare that the research was conducted in the absence of any commercial or financial relationships that could be construed as a potential conflict of interest.
Author Contributions
SC developed the tracking and reconstruction algorithms. SD assisted with implementing the reconstruction algorithms. SC, JL and JC analyzed the data. SC, JL and JC developed the data visualization. JL and JC performed the experiments. SC assisted during the experiments and performed the camera calibrations together with JC. JL and JC designed and built the imaging setup. JC designed and built the imaging chamber. JC designed the figures and wrote the manuscript. JL and JC conceived the research.
Acknowledgements
We would like to thank Ilija Uzelac for fruitful discussions about cameras, lenses and optical mapping in general.
References
- Salama et al. [1987] G. Salama, R. Lombardi, and J. Elson, Maps of optical action potentials and NADH fluorescence in intact working hearts, American Journal of Physiology-Heart and Circulatory Physiology 252, H384 (1987).
- Zhang et al. [2016] H. Zhang, K. Iijima, J. Huang, G. P. Walcott, and J. M. Rogers, Optical mapping of membrane potential and epicardial deformation in beating hearts, Biophysical Journal 111, 438 (2016).
- Christoph et al. [2017] J. Christoph, J. Schröder-Schetelig, and S. Luther, Electromechanical optical mapping, Progress in Biophysics and Molecular Biology 130, 150 (2017).
- Christoph et al. [2018] J. Christoph, M. Chebbok, C. Richter, J. Schröder-Schetelig, P. Bittihn, S. Stein, I. Uzelac, F. H. Fenton, G. Hasenfuss, R. J. Gilmour, and S. Luther, Electromechanical vortex filaments during cardiac fibrillation, Nature 555, 667 (2018).
- Christoph and Luther [2018] J. Christoph and S. Luther, Marker-free tracking for motion artifact compensation and deformation measurements in optical mapping videos of contracting hearts, Frontiers in Physiology 9, 1483 (2018).
- Kappadan et al. [2020] V. Kappadan, S. Telele, I. Uzelac, F. Fenton, U. Parlitz, S. Luther, and J. Christoph, High-resolution optical measurement of cardiac restitution, contraction, and fibrillation dynamics in beating vs. Blebbistatin-uncoupled isolated rabbit hearts, Frontiers in Physiology 11, 10.3389/fphys.2020.00464 (2020).
- Lebert et al. [2022] J. Lebert, N. Ravi, G. Kensah, and J. Christoph, Real-time optical mapping of contracting cardiac tissues with gpu-accelerated numerical motion tracking, Frontiers in Cardiovascular Medicine 9, 10.3389/fcvm.2022.787627 (2022).
- [8] V. Kappadan, A. Sohi, U. Parlitz, S. Luther, I. Uzelac, F. Fenton, N. S. Peters, J. Christoph, and F. S. Ng, Optical mapping of contracting hearts, The Journal of Physiology n/a, https://doi.org/10.1113/JP283683.
- Chen et al. [2023] Z. Chen, K. Nguyen, G. Kowalik, X. Shi, J. Tian, M. Doshi, B. R. Alber, X. Guan, X. Liu, X. Ning, M. W. Kay, and L. Lu, Transparent and stretchable au–ag nanowire recording microelectrode arrays, Advanced Materials Technologies 8, 2201716 (2023).
- Gray et al. [1995] R. A. Gray, J. Jalife, A. Panfilov, W. T. Baxter, C. Cabo, J. M. Davidenko, and A. M. Pertsov, Nonstationary vortexlike reentrant activity as a mechanism of polymorphic ventricular tachycardia in the isolated rabbit heart, Circulation 91, 2454 (1995).
- Swift et al. [2021] L. M. Swift, M. W. Kay, C. M. Ripplinger, and N. G. Posnack, Stop the beat to see the rhythm: excitation-contraction uncoupling in cardiac research, American Journal of Physiology-Heart and Circulatory Physiology 321, H1005 (2021).
- Efimov et al. [2004] I. R. Efimov, V. P. Nikolski, and G. Salama, Optical imaging of the heart, Circ. Res. 95, 21 (2004).
- Bray et al. [2000] M.-A. Bray, S.-F. Lin, and J. Wikswo, Three-dimensional surface reconstruction and fluorescent visualization of cardiac activation, IEEE Transactions on Biomedical Engineering 47, 1382 (2000).
- Kay et al. [2004] M. Kay, P. Amison, and J. Rogers, Three-dimensional surface reconstruction and panoramic optical mapping of large hearts, IEEE Transactions on Biomedical Engineering 51, 1219 (2004).
- Kay et al. [2006] M. W. Kay, G. P. Walcott, J. D. Gladden, S. B. Melnick, and J. M. Rogers, Lifetimes of epicardial rotors in panoramic optical maps of fibrillating swine ventricles, American Journal of Physiology-Heart and Circulatory Physiology 291, H1935 (2006).
- Rogers et al. [2007] J. M. Rogers, P. G. Walcott, J. D. Gladden, S. B. Melnick, and M. W. Kay, Panoramic optical mapping reveals continuous epicardial reentry during ventricular fibrillation in the isolated swine heart, Biophysical Journal 92, 1090 (2007).
- Rohde et al. [2005] G. K. Rohde, B. M. Benoit, and S. Lin, Corrections of motion artifacts in cardiac optical mapping using image registration, IEEE Trans. Biomed. Eng. 52, 338 (2005).
- Svrcek et al. [2009] M. Svrcek, S. Rutherford, and B. Smaill, Characteristics of motion artifacts in cardiac optical mapping studies, Conference Proceedings, 31st Annual International Conference of the IEEE EMBS, Minneapolis, USA 31, 3240 (2009).
- Khwaounjoo et al. [2015] P. Khwaounjoo, S. L. Rutherford, M. Svrcek, I. J. LeGriece, M. L. Trew, and B. H. Smaill, Image-based motion correction for optical mapping of cardiac electrical activity, Ann. Biomed. Eng. 43, 1235 (2015).
- Rodriguez and Nygren [2015] M. P. Rodriguez and A. Nygren, Motion estimation in cardiac fluorescence imaging with scale-space landmarks and optical flow: a comparative study, IEEE Trans. Biomed. Eng. 62, 774 (2015).
- Bourgeois et al. [2011] E. B. Bourgeois, A. D. Bachtel, J. Huang, G. P. Walcott, and J. M. Rogers, Simultaneous optical mapping of transmembrane potential and wall motion in isolated, perfused whole hearts, Journal of Biomedical Optics 16, 096020 (2011).
- Garrido-Jurado et al. [2014] S. Garrido-Jurado, R. Muñoz-Salinas, F. Madrid-Cuevas, and M. Marín-Jiménez, Automatic generation and detection of highly reliable fiducial markers under occlusion, Pattern Recognition 47, 2280 (2014).
- Kwon [1999] Y.-H. Kwon, Object plane deformation due to refraction in two-dimensional underwater motion analysis, Journal of Applied Biomechanics 15, 396 (1999).
- Oliver Batchelor [2023] Oliver Batchelor, multical (2023).
- Schönberger et al. [2016] J. L. Schönberger, E. Zheng, M. Pollefeys, and J.-M. Frahm, Pixelwise view selection for unstructured multi-view stereo, in European Conference on Computer Vision (ECCV) (2016).
- Klaudiny and Hilton [2011] M. Klaudiny and A. Hilton, Cooperative patch-based 3d surface tracking, in 2011 Conference for Visual Media Production (IEEE, 2011).
- Barnes et al. [2009] C. Barnes, E. Shechtman, A. Finkelstein, and D. B. Goldman, PatchMatch: A randomized correspondence algorithm for structural image editing, ACM Transactions on Graphics (Proc. SIGGRAPH) 28 (2009).
- Farnebäck [2003] G. Farnebäck, Two-Frame Motion Estimation Based on Polynomial Expansion, in Image Analysis, Vol. 2749, edited by G. Goos, J. Hartmanis, J. van Leeuwen, J. Bigun, and T. Gustavsson (Springer Berlin Heidelberg, Berlin, Heidelberg, 2003) pp. 363–370.
- Lebert et al. [2021] J. Lebert, N. Ravi, F. H. Fenton, and J. Christoph, Rotor localization and phase mapping of cardiac excitation waves using deep neural networks, Frontiers in Physiology 12, 10.3389/fphys.2021.782176 (2021).
- Li et al. [2020] X. Li, T. P. Almeida, N. Dastagir, M. S. Guillem, J. Salinet, G. S. Chu, P. J. Stafford, F. S. Schlindwein, and G. A. Ng, Standardizing single-frame phase singularity identification algorithms and parameters in phase mapping during human atrial fibrillation, Frontiers in Physiology 11, 10.3389/fphys.2020.00869 (2020).
- Lebert and Christoph [2019] J. Lebert and J. Christoph, Synchronization-based reconstruction of electromechanical wave dynamics in elastic excitable media, Chaos: An Interdisciplinary Journal of Nonlinear Science 29, 10.1063/1.5101041 (2019).
- Lee et al. [2017] P. Lee, C. J. Calvo, J. M. Alfonso-Almazin, J. G. Quintanilla, F. J. Chorro, P. Yan, L. N. Loew, D. Filgueiras-Rama, and J. Millet, Low-cost optical mapping systems for panoramic imaging of complex arrhythmias and drug-action in translational heart models, Scientific Reports 7, 10.1038/srep43217 (2017).
- Rieger et al. [2021] M. Rieger, C. Dellenbach, J. vom Berg, J. Beil-Wagner, A. Maguy, and S. Rohr, Enabling comprehensive optogenetic studies of mouse hearts by simultaneous opto-electrical panoramic mapping and stimulation, Nature Communications 12, 10.1038/s41467-021-26039-8 (2021).
Appendix