Unbiased Pain Assessment through Wearables and EHR Data: Multi-attribute Fairness Loss-based CNN Approach
Abstract
The combination of diverse health data (IoT, EHR, and clinical surveys) and scalable-adaptable Artificial Intelligence (AI), has enabled the discovery of physical, behavioral, and psycho-social indicators of pain status. Despite the hype and promise to fundamentally alter the healthcare system with technological advancements, much AI adoption in clinical pain evaluation has been hampered by the heterogeneity of the problem itself and other challenges, such as personalization and fairness. Studies have revealed that many AI (i.e., machine learning or deep learning) models display biases and discriminate against specific population segments (such as those based on gender or ethnicity), which breeds skepticism among medical professionals about AI adaptability. In this paper, we propose a Multi-attribute Fairness Loss (MAFL) based CNN model that aims to account for any sensitive attributes included in the data and fairly predict patients’ pain status while attempting to minimize the discrepancies between privileged and unprivileged groups. In order to determine whether the trade-off between accuracy and fairness can be satisfied, we compare the proposed model with well-known existing mitigation procedures, and studies reveal that the implemented model performs favorably in contrast to state-of-the-art methods. Utilizing NIH All-Of-US data, where a cohort of 868 distinct individuals with wearables and EHR data gathered over 1500 days has been taken into consideration to analyze our suggested fair pain assessment system.
Index Terms:
Wearable, Electronic Health Record, Fairness, Privileged and Unprivileged Group, Sensitive Attribute.I Introduction
The Intelligent Internet of Things (IIoT) has the potential to revolutionize healthcare by allowing for continuous monitoring of health vitals and behaviors, which can lead to timely health interventions for communities in need [1, 2]. However, using AI in healthcare brings major risks and potential unintended harm by introducing biases in decisions. Biased AI may discriminate based on sensitive attributes like race, gender, ethnicity, and disabilities, leading to mistrust among clinicians and preventing AI systems from being adopted in clinical settings [3]. Measuring bias is challenging because it may occur explicitly or implicitly. Explicit bias involves conscious attitudes that can be measured by self-report but poses the risk of falsely endorsing more socially desirable attitudes. Implicit biases occur outside of conscious awareness and can result in a negative evaluation of a person based on sensitive attributes.
Identifying and measuring pain [4] begins with a person’s self-report, while simply worded questions and tools, that are easily understood, continue to be the most effective. The best choice for assessing pain intensity includes self-reported surveys such as Iowa Pain Thermometer (IPT) and Numeric Rating Scale (NRS). Despite the prevalence and consequences of pain, healthcare professionals struggle in assessing [5] and treating pain accurately [6]. On the other hand, worded questions-based assessments become ineffective among the geriatric population with disparities in terms of cognition, hearing, literacy, and language abilities, as surveys-based assessment tools highly rely on the above abilities.
In this paper, we present a research contribution that focuses on mitigating disparity in sensitive attributes to ensure the fair classification of pain status (i.e., pain improves or degrades) from patient’s heart rate and step counts data collected from wearable and EHR. We introduce a novel Multi-attribute Fairness Loss (MAFL) based CNN approach that incorporates all the sensitive attributes present in the nationwide collected heterogeneous data (All-Of-Us data) [7]. Our model tries to reduce the discrepancies between the privileged and unprivileged groups, hence encouraging fairness in categorization, by explicitly taking into account these features.
II Related Works
Clinical pain assessment relies heavily on self-reported pain scale surveys, including disease-specific and generalized tools. While changes in pain measures are currently the standard for tracking patient progress, these questionnaires still depend on subjective patient assessments and are vulnerable to various biases [8, 9]. However, research has shown that racial, age-related, and socioeconomic biases exist in pain treatment, with nonwhite and older patients and those of lower socioeconomic status being less likely to receive pain medication [10, 11]. Despite fairness training, these biases may persist in clinical settings, leading to unfair treatment to the unprivileged group. Biases in clinical data can also lead to unfair machine learning (ML) algorithms.
Given the limitations of subjective self-reported measures of pain, there has been increasing interest in pain assessment objectively. While many areas of medicine have developed meaningful biomarkers and endpoints to objectively treat patients, the development of objective biomarkers in pain has been lacking [12]. There is very little research has been done to investigate the potential use of wearable devices to complement the assessment and treatment of painful conditions. Recently, fMRI-based and ICU video-based facial expression monitoring [13, 14] methods show promising objective pain assessment automation, but such hospital-based, controlled imaging studies are not feasible for assessing ongoing real-time objective markers of pain. Recent studies showed that wearable sensors are not free of biases and may provide inaccurate data, for example, people with darker skin tones [15]. Similarly, it has been anticipated that wearable-based health vitals monitoring may provide disparities for older adults, persons with skin disease, and so on, which also may persist in wearable-based ML algorithms [16]. [17] provides benchmarking pre-processing, in-processing, and post-processing algorithms to mitigate bias in the ML algorithms, and fairness measure is done here by using 5 fairness metrics. But algorithms introduced by [17] only consider single sensitive attributes and are compatible with ML models.
This research paper introduces MAFL, a novel loss function-based CNN model that incorporates either single or multiple protected attributes. By minimizing the disparities between privileged and unprivileged groups, MAFL-CNN effectively mitigates bias in classification tasks.
III Methodology
III-A Data Collection
To access NIH All of Us data, we registered and signed a Data Use and Registration Agreement (DURA). Each member underwent the Collaborative Institutional Training Initiative (CITI Program) training and applied for Controlled Tier access. Using concept ID ‘3036453’, we collected data for 868 individuals who had been evaluated with pain at least twice in a hospital visit during the same year and had complete wearable sensor data. The pain assessment tool used was the Visual Analog Score ranging from 0 to 10. We use the feature deviance method to extract personalized features for each individual. In this regard, at first, we extract statistical, temporal, and spectral domain feature where , and refer to the type of feature , index of feature (we have total N=60 features), day of the collected wearable data. We consider 4 different deviant functions (mathematical, logarithmic, cosine, and logcosh) on these 60 extracted features.
III-B Loss Function Design
Multi_Attribute_Fair_Loss(): unprivileged_indices indices where sensitive_attributes equals 0 privileged_indices indices where sensitive_attributes equals 1 loss_unprivileged mean of values at unprivileged_indices loss_privileged mean of values at privileged_indices disparity loss_privileged - loss_unprivileged loss Binary_Cross_Entropy(,) loss += regularization_loss 0.01 total_loss loss + regularization_loss return total_loss
MAFL adds fairness to the regular loss function. Initially, it takes the indices of the unprivileged and privileged groups within the sensitive attributes list and then calculates the mean prediction values for the unprivileged and privileged groups separately. The difference represents the disparity between the groups in terms of the predictions made by the model. A regularization term is added to the loss function to further promote fairness. The term penalizes large differences between individual predictions and the mean prediction of all samples. Finally, the total loss is calculated by summing the regular loss function (in this case, it is Binary Cross-Entropy) and the regularization loss. Here, a fairness score is applied to input and target for sensitive attributes (k=1 to n). In our dataset, we have 5 protected attributes (gender, race, ethnicity, age, and cognitive ability (dementia)).
III-C Integrated CNN Framework to Predict Pain Levels
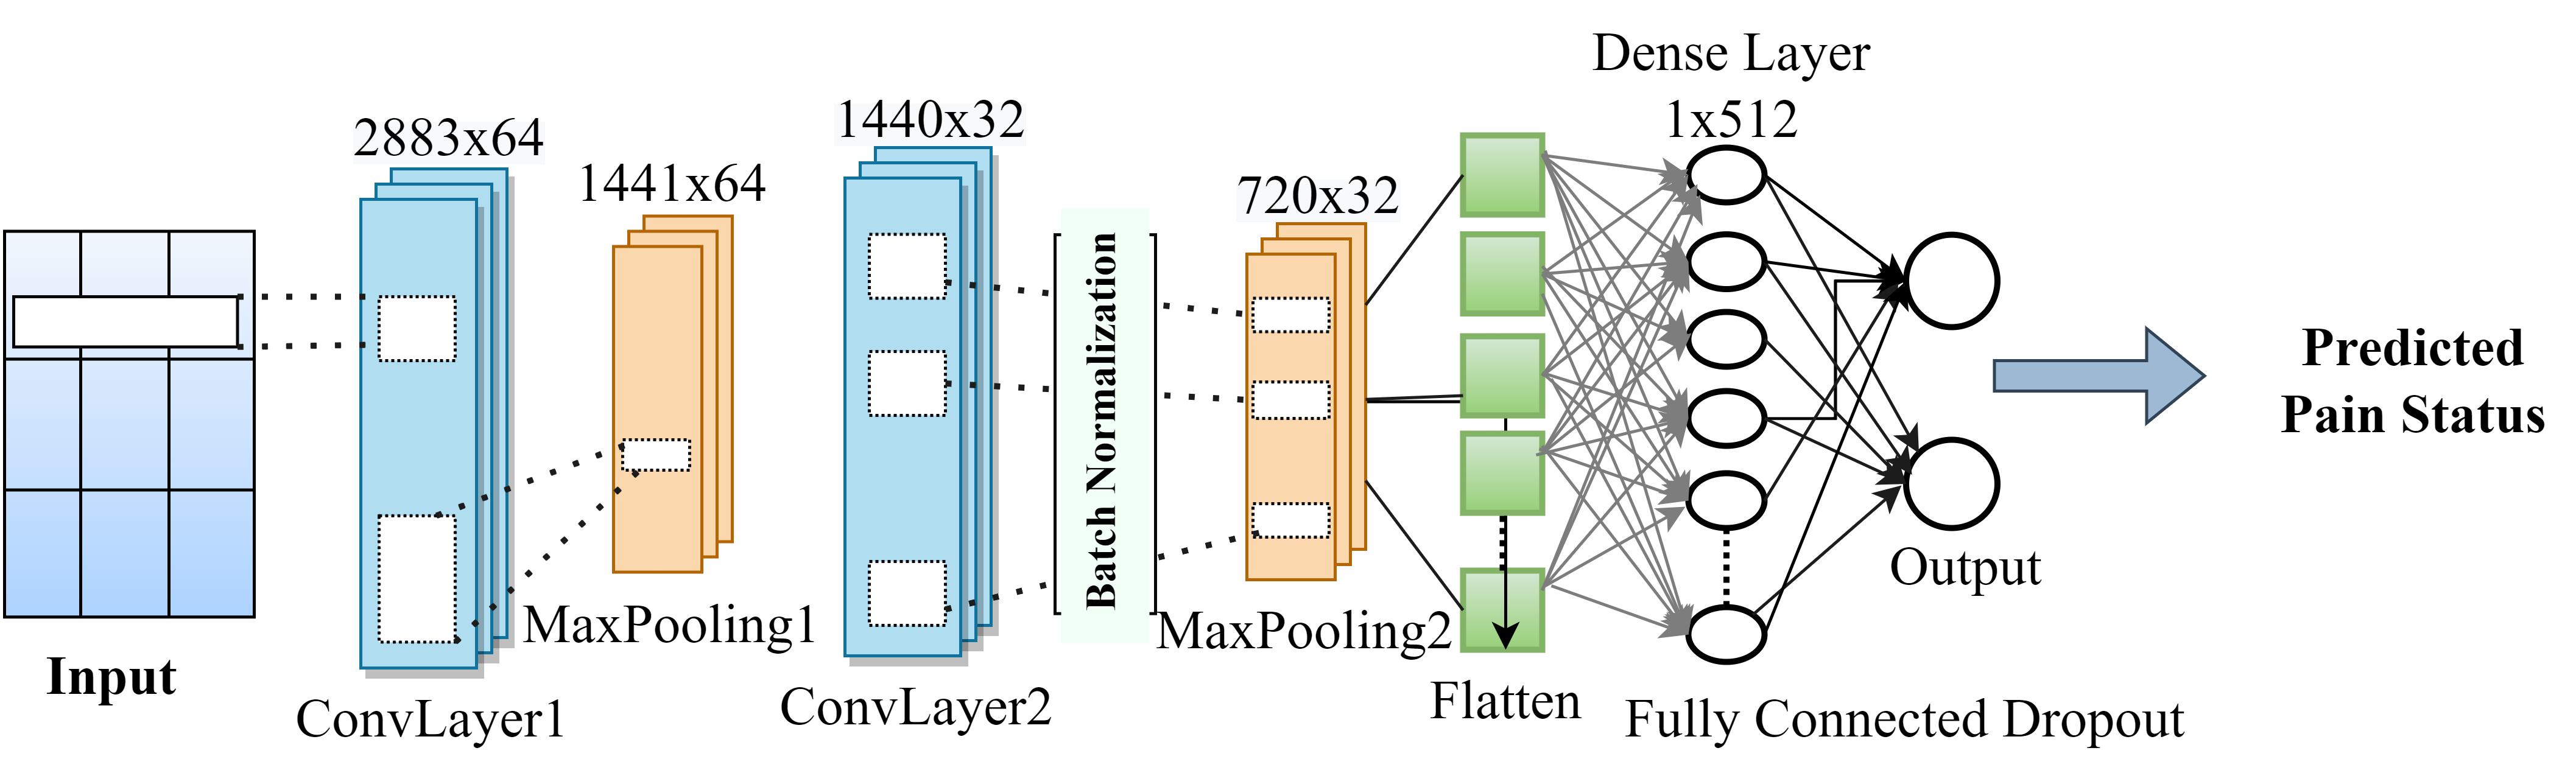
The 1-D CNN model [Figure 1] has seven layers, including two 1D-convolutional layers, two max-pooling layers, one flattening layer, one fully-connected hidden layer, and an output layer. The input layer has 2883 input numbers representing demographic features, heart rate, and step counts for a day. A 1D max-pooling layer is added to convert variable-length hidden features in the previous convolution layer to a fixed number of features. The extracted features are fed into a 512-node fully-connected hidden layer, and the output layer contains two nodes. The softmax function is applied to predict the pain level probability. The dropout technique is used in the hidden layer to prevent over-fitting. To leverage the discriminative power of 1-D CNNs, we integrate MAFL into the network architecture. The CNN framework learns features that are both informative for classification and less dependent on sensitive attributes. By optimizing the proposed loss function, we train the network to effectively reduce disparity in the classification outcomes.
IV Experimental Evaluation
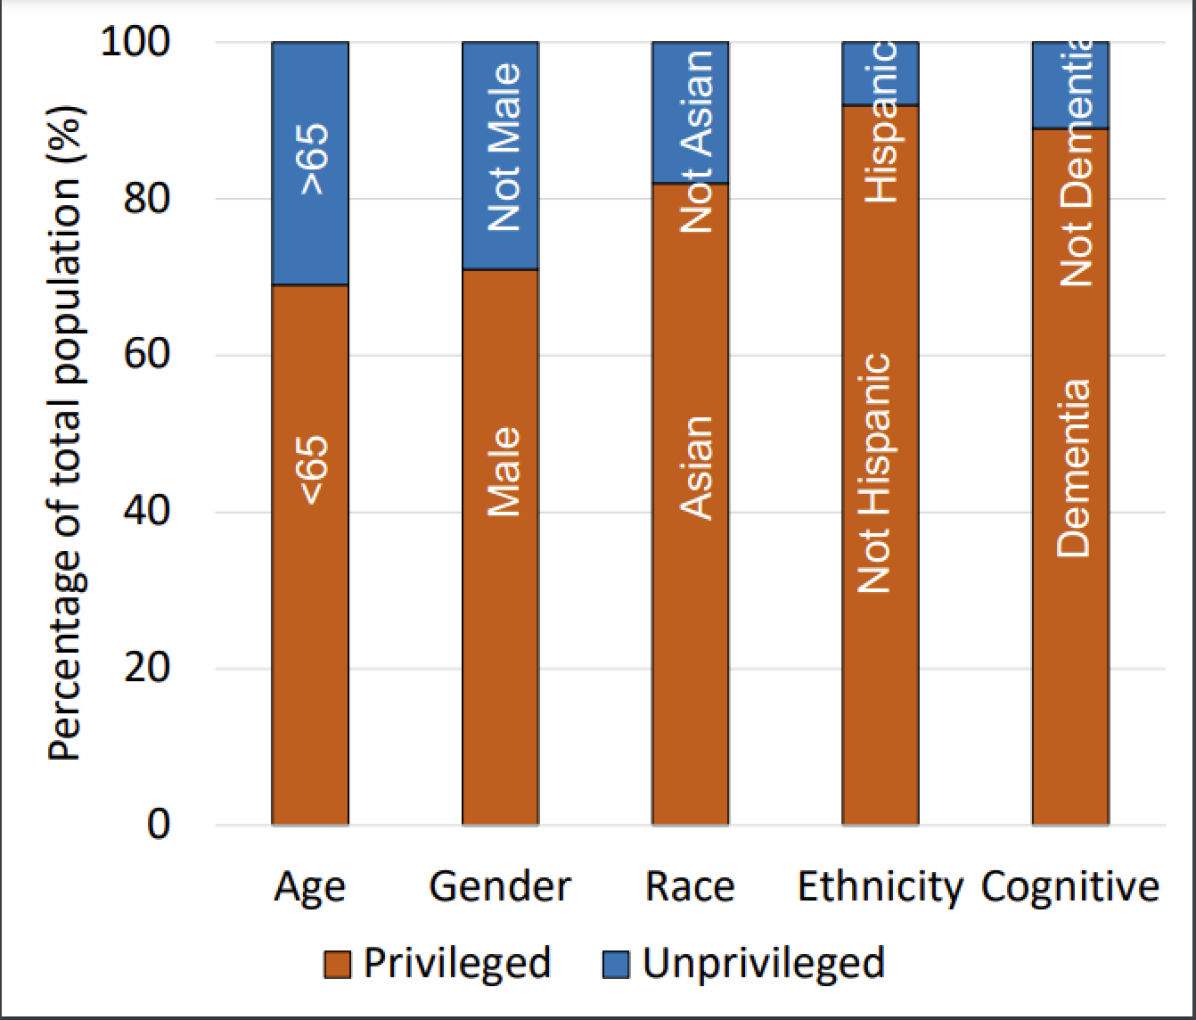
To enable the classification model to function effectively, the raw data was transformed into a clean dataset. The initial step involved comparing pain levels between consecutive dates. Pain improvement was represented as 1, otherwise 0. Categorical features were encoded as binary column vectors. Missing rows were filled with mean or interpolated values. Irrelevant columns were dropped after applying Min-Max normalization. The resulting clean dataset consisted of 868 records. It included 5 protected attributes (gender, race, ethnicity, age, and dementia), and privileged subgroups for each attribute were determined to be males, Asians, non-Hispanic individuals, those under 65, and people without dementia, respectively (Figure 3).
We conduct tests on our dataset using benchmark pre-processing, in-processing, and post-processing bias mitigation techniques suggested by AIF360[17] to show that MAFL-CNN satisfies the tradeoff between fairness and accuracy. AIF360 toolkits consider single protected attributes present in the data and except the Adversarial Debiasing algorithm, all other algorithms only work for machine learning models. Since our dataset comprises five sensitive attributes, the loss function we created can take into account all of them simultaneously based on their indices as well as only one attribute. We assess the effectiveness of our MAFL-CNN model in terms of fair accuracy by comparing it to cutting-edge fairness-aware AIF360 bias mitigation techniques on Logistic Regression (LR), Random Forest (RF), Decision Tree (DT), Support Vector Machine (SVM), and Naive Bayes (NB) models. We selected the best model based on the highest number of fair classification matrices (Statistical Parity Difference, Disparate Impact, Equal Opportunity Difference, Theil Index, and Average Odd Difference) to satisfy accuracy and fairness trade-off. Using Python3.11, the experiment was carried out in a virtual setting and finished in about 170 minutes.
| Mitigation | Age | Gender | Race | Cognitive | Ethnicity | Altogether | ||||||
|---|---|---|---|---|---|---|---|---|---|---|---|---|
| Best Model | Acc(%) | Best Model | Acc(%) | Best Model | Acc(%) | Best Model | Acc(%) | Best Model | Acc(%) | Best Model | Acc(%) | |
| Before Mitigation | LR | 82.0 | SVM | 75.5 | LR | 74.1 | RF | 70.4 | LR | 78.3 | – | – |
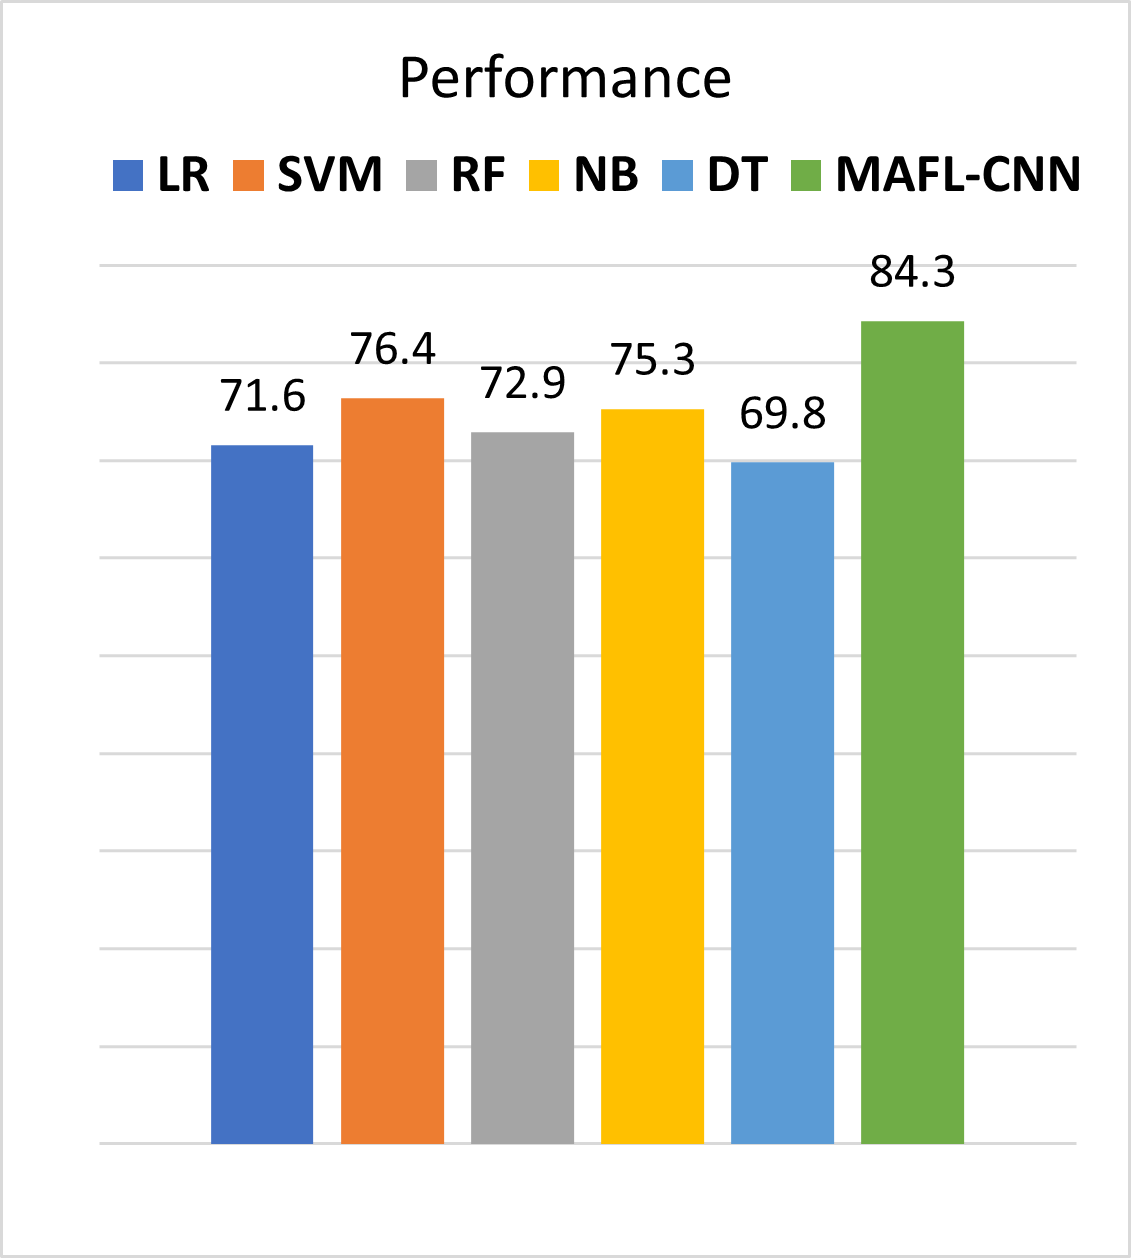
| RW - Preprocessing | SVM | 76.2 | SVM | 76.4 | LR | 69.8 | LR | 70.4 | NB | 75.3 | – | – |
| DIR-Preprocessing | RF | 71.6 | LR | 67.6 | DT | 69.8 | RF | 70.6 | SVM | 72.9 | – | – |
| MAFL-CNN | - | 77.3 | - | 75.2 | - | 75.6 | - | 79.5 | - | 78.7 | - | 84.3 |
| EGR-Inprocessing | LR | 71.6 | SVM | 65.7 | SVM | 72.7 | SVM | 62.2 | RF | 72.9 | – | – |
| AD-Inprocessing | – | 75.8 | – | 74.7 | – | 76.9 | – | 74.7 | – | 71.3 | - | – |
| PR-Inprocessing | - | 76.4 | - | 75.7 | - | 82.6 | - | 77.1 | - | 72.5 | – | – |
| ROC-Postprocessing | - | 73.3 | - | 75.2 | - | 80.6 | - | 77.5 | - | 72.3 | - | – |
V Results
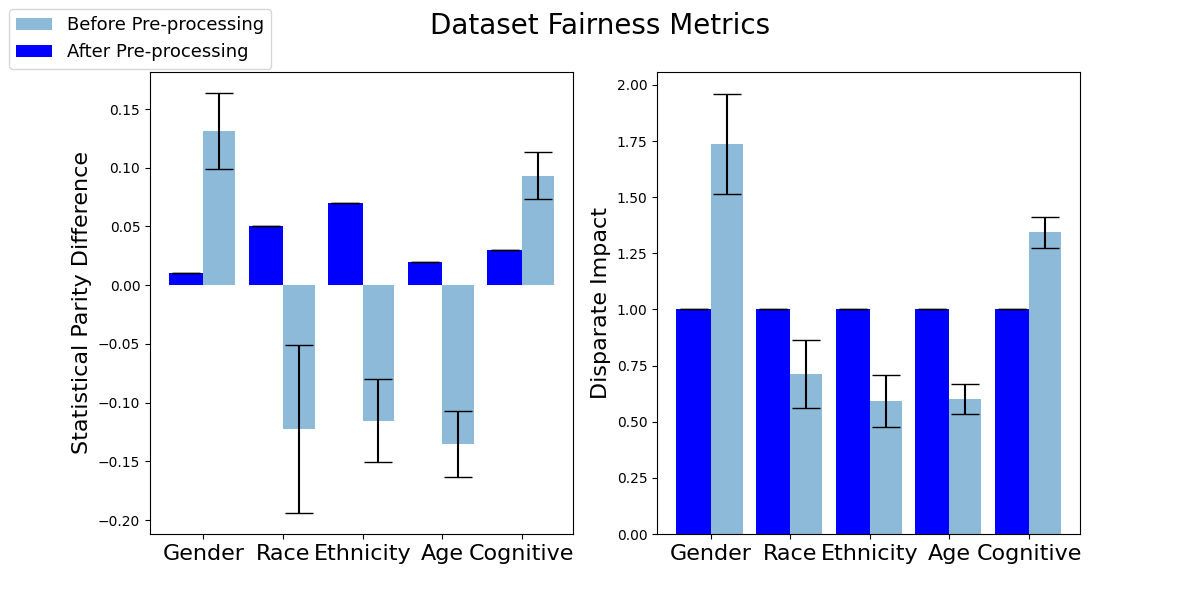
To assess the presence of bias in our dataset, we employed two fairness metrics, namely statistical parity difference and disparate impact, as described in the work by AIF360 [17]. If the unprivileged group receives a positive outcome of less than of their proportion relative to the privileged group, it suggests a potential bias or disparate impact. In our original dataset, prior to any mitigation efforts, the disparate impact value was , and the statistical parity difference was , which ideally should range between and . To address these biases, we made modifications to the original dataset using fair pre-processing procedures. To evaluate the impact of these pre-processing bias mitigation techniques on bias detection metrics, we computed fairness metrics both before and after the transformation. The results, shown in Figure 4, indicate the extent of standard deviation using the bars. It is evident that the Reweighing and Disparate Impact Remover pre-processing techniques enhance fairness for all the datasets in terms of both provided measures.
The performance of the classification models in predicting pain status fairly is depicted in Figure 3. However, when considering protected attributes such as gender, age, race, ethnicity, and cognitive disability, all the classifiers exhibit unfairness according to our proposed majority voting bias detection metrics. Table I provides a comprehensive summary of the results, highlighting the best-performing model in terms of accuracy and fairness for each mitigation technique, and comparing it with benchmarking techniques from [17].
In Table I, we only report the best model in terms of accuracy and fairness for each mitigation technique. Among the pre-processing techniques, SVM demonstrates the highest balance between accuracy and fairness metrics, achieving an accuracy of . In the case of in-processing techniques, the Prejudice Remover (PR) technique performs well in terms of accuracy for the sensitive attribute ’Race,’ while the RF model shows fairness as a predictor for the Exponentiated Gradient Reduction (EGR) technique. The Reject Option Classification (ROC) technique exhibits an average accuracy of around for each sensitive attribute. However, our MAFL-CNN model suppresses the performance of all the models, resulting in accuracy ranging from to . Furthermore, unlike the AIF360 mitigation techniques, our MAFL-CNN model can consider multiple sensitive attributes. Additionally, it is worth noting that AIF360 only includes one neural network (NN) model, which is the adversarial debiasing algorithm, and its performance is noticeably lower than our MAFL-CNN model.
VI Discussion
Our experimental results demonstrate the efficacy of our proposed approach. We observe significant reductions in disparity between privileged and unprivileged groups while maintaining competitive classification accuracy [Figure 4]. Furthermore, we analyze the impact of different sensitive attributes on the fairness metrics to gain insights into their influence on the classification process. By mitigating disparity in classification outcomes, our approach contributes towards promoting fairness and reducing bias in decision-making systems [Figure3] with accuracy ranging from to . Future studies emphasize exploring the generalizability of our method across different datasets and extending the approach to other deep learning architectures.
VII Conclusion
In this paper, we have presented a novel loss function, MAFL, integrated into a 1-D CNN framework to address disparity issues arising from sensitive attributes in classification tasks. Our approach demonstrates notable reductions in disparity while maintaining competitive classification accuracy ranging from to for single or multiple sensitive attributes.
References
- [1] Keogh, A., et al. Assessing the usability of wearable devices to measure gait and physical activity in chronic conditions: a systematic review. J NeuroEngineering Rehabil 18, 138 (2021).
- [2] Mosconi P, et al. Use of Health Apps and Wearable Devices: Survey Among Italian Associations for Patient Advocacy. JMIR Mhealth Uhealth. 2019 Jan 15;7(1):e10242
- [3] Nelson, A. (2002). Unequal treatment: confronting racial and ethnic disparities in health care. Journal of the national medical association, 94(8), 666.
- [4] Cleeland, C. S., & Ryan, K. M. (1994). Pain assessment: Global use of the Brief Pain Inventory. Annals, Academy of Medicine, Singapore, 23(2), 129–138.
- [5] Kaasalainen SJ, et al. The assessment of pain in the cognitively impaired elderly: A literature review. Perspectives. 1998;22:2.
- [6] Morrison RS, Siu AL. A comparison of pain and its treatment in advanced dementia and cognitively intact patients with hip fracture. J Pain Symptom Manage. 2000.
- [7] The “All of Us” Research Program, August 15, 2019 N Engl J Med 2019
- [8] Tsai PF. Assessing pain in older adults. J Gerontol Nurs. 2011.
- [9] Tsze DS, von Baeyer CL, Bulloch B, Dayan PS. Validation of self-report pain scales in children. Pediatrics. 2013.
- [10] Shah AA, Zogg CK, et al. Analgesic Access for Acute Abdominal Pain in the Emergency Department Among Racial/Ethnic Minority Patients: A Nationwide Examination. Med Care. 2015.
- [11] Singhal A, et al. Racial-Ethnic Disparities in Opioid Prescriptions at Emergency Department Visits for Conditions Commonly Associated with Prescription Drug Abuse. PLoS One. 2016.
- [12] van der Miesen MM, et al. Neuroimaging-based biomarkers for pain: state of the field and current directions. Pain Rep. 2019.
- [13] Wager TD, et al. An fMRI-based neurologic signature of physical pain. N Engl J Med. 2013.
- [14] Perraudin CG, et al. Observational Study of a Wearable Sensor and Smartphone Application Supporting Unsupervised Exercises to Assess Pain and Stiffness. Digit Biomark. 2018
- [15] Shcherbina A, et al. Accuracy in wrist-worn, sensor-based measurements of heart rate and energy expenditure in a diverse cohort. J Pers Med. 2017;7(2):3.
- [16] Alam et. al., AI-Fairness Towards Activity Recognition of Older Adults, Mobiquitous 2020.
- [17] Bellamy, R. K. E. (2018, October 3). AI Fairness 360: An Extensible Toolkit for Detecting, Understanding, and Mitigating Unwanted Algorithmic Bias.