DIG: The Data Interface Grammar
Abstract.
Building interactive data interfaces is hard because the design of an interface depends on the data processing needs for the underlying analysis task, yet we do not have a good representation for analysis tasks. To fill this gap, this paper advocates for a Data Interface Grammar (DIG) as an intermediate representation of analysis tasks. We show that DIG is compatible with existing data engineering practices, compact to represent any analysis, simple to translate into an interface design, and amenable to offline analysis. We further illustrate the potential benefits of this abstraction, such as automatic interface generation, automatic interface backend optimization, tutorial generation, and workload generation.
1. Introduction
Interactive data interfaces are essential for data exploration and analysis (Google, 2021; iCheck, 2021; Murray, 2013; Kandel et al., 2011; Chen and Huang, 2022). However, designing a new interface is a multi-step process that includes determining the queries that are appropriate for the analysis task, as well as the parts of the queries that users should be able to change. Once the analysis has been determined, the interface designer can now choose the appropriate visualizations, interactions, and layouts to design the interface. These two steps are closely related and need to be kept in sync, yet require distinctly specialized skill sets: to write complex queries over complex data sources, and to design and implement a usable and effective interface. Further expertise in system optimization is needed to ensure that the resulting interface is responsive as the data grows.
Is there an intermediate abstraction of an interface’s underlying data needs that can decouple these tasks, so that data practitioners can focus on expressing complex analysis tasks, visualization designers can focus on interface design, and backend engineers can focus on optimization?
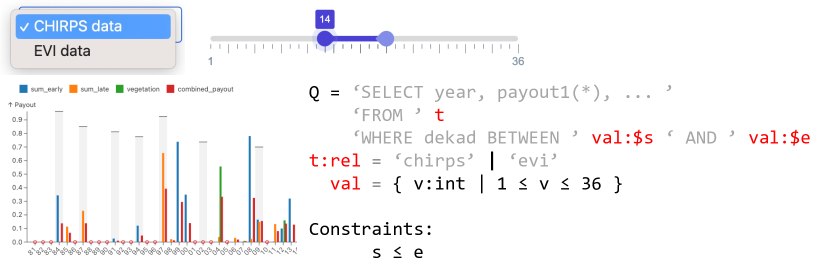
Let us first examine the different ways a developer might build an interface today. Figure 1 is a simplified subset of a drought insurance design tool used to protect rural farmers (Greatrex et al., 2015). The simplest approach is to predefine all possible queries in the application ahead of time, and when the user interacts with the interface, we identify which query to execute. Although the queries can be optimized ahead of time, this requires enumerating a combinatorial number of possible queries (e.g., 1332 = 2 for the dropdown * 666 for the slider). Parameterized queries allow literals in the WHERE clause to be wildcards. This compactly expresses the slider interaction and can be optimized offline (Ioannidis et al., 1997), but cannot express arbitrary structure changes in the query (e.g., the dropdown). In short, there exist tools to create and optimize very simple data interfaces where the interactions largely correspond to filters or where the user simply cannot express very much. Beyond this, the developer must resort to constructing query strings in the application, which is highly flexible but not amenable to analysis.
What criteria should an intermediate abstraction satisfy? We believe that it should (C1) compactly represent any analysis task that a developer may wish to express, (C2) have a well-defined correspondence to interactive interfaces composed of charts, widgets, and interactions, and (C3) be amenable to offline analysis for e.g., optimization, interface synthesis.
It is easy to see that existing approaches do not satisfy these criteria. Predefining every query is neither compact nor expressive, parameterized queries are compact but only express simple query transformations, and programmatically constructing SQL is expressive but not analyzable. Other works on interactive data interface benchmarks (Eichmann et al., 2018; Battle et al., 2020) model the interface in order to generate query workloads but are limited to SPJA queries and cross-filter interactions. Business Intelligence(BI) and visualization tools (e.g., Tableau (Tableau, 2023), Power BI (BI, 2023), Vega-lite (Satyanarayan et al., 2016, 2018)) are primarily focused on data cube-like operations.
In this paper, we examine two observations. First, the queries that an interface expresses can be compactly represented as a grammar. A grammar is a set of production rules that define a valid program; each production rule defines a set of choices that encode the allowable program variations. That grammar may be a single production rule that chooses from a small enumeration of predefined queries, the entire language (e.g., SQL), or a language subset specific to an analysis. Second, the design of a data interface has a direct correspondence to the grammar: interactions make choices in the grammar, and when all choices in the grammar have been made, the grammar is equivalent to a syntactically valid query string that the database executes. In other words, interactions navigate the space of syntactically valid queries expressible by the interface.
To this end, we propose DIG, a Data Interface Grammar that extends Parsing Expression Grammars (PEG) with annotations specific to data programs. For instance, the DIG program for Figure 1 is a query string (gray text) where nonterminals encode program variations: t chooses the relation name, and val chooses an integer between 1 and 36. t is annotated to be a relation name, and s e. In the interface, these choices are respectively bound by the dropdown and range slider.
DIG satisfies our desired criteria. Since it extends a formal grammar, it compactly express any set of queries useful for a task (C1), and defines a direct correspondence to interactive interface designs (C2). Finally, since DIG encodes the the entire space of possible programs, it is amenable to offline analysis, and Section 4 outlines examples such as interface synthesis and physical optimization(C3).
In the rest of this paper, we will first introduce Data Interface Grammar (DIG) and illustrate its correspondence with interactive interfaces. We further comment on its connections with existing data pipeline and analysis representations (Section 2). We then describe how DIG simplifies interface creation via real-world examples (Section 3), and finally highlight the benefits of the DIG representation for solving a number of challenging data interface problems (Section 4).
2. Data Interface Grammar
A data interface helps the user navigate a space of useful data programs (e.g., SQL) through interactive controls. This section first presents DIG, a Data Interface Grammar, to express this set of data programs in a simple, analyzable manner, and then defines the set of valid interfaces that express a given DIG program. These definitions form the basis for useful applications like interface synthesis, physical visualization optimization that we describe in Section 4.
2.1. DIG Definition
DIG is a Data Interface Grammar that defines the syntactic structure of queries that an interface wishes to express: the set of queries parsable by the grammar. Given that existing data query languages such as SQL, PRQL (prq, 2023), and Pandas have well-established grammar definitions, DIG is a superset of the widely-used Parsing Expression Grammar (PEG). By extending PEG, we both build on decades of research and tooling and simplify the ability to port existing PEG-based languages to DIG.
We formally define DIG = as follows, where the sub-grammar rooted at each starting rule parses a set of queries:
-
•
a finite set of nonterminals ;
-
•
a finite set of terminals that is disjoint from ;
-
•
a finite set of parsing rules ;
-
•
a finite set of starting rules , each not referenced by any other rule;
-
•
a set of constraints C.
Terminals. Similar to typical grammars, DIG matches terminals to valid strings expressible by regular expressions. Although regular expressions are useful for matching string literals, most interactions (e.g., sliders, dropdowns, visualization selections) are typed and limited to a domain of valid values that regular expressions cannot distinguish. Thus, DIG also supports domain terminals that may reference the underlying database.
-
•
Predicate Domain: A = {var:type | <predicate>}.
-
•
Query Domain: A = {SELECT QUERY}.
A predicate domain specifies a typed variable along with a boolean expression that must evaluate to true for a value to be valid. For instance, val = {x:int | x[1,36]} specifies the terminal as an integer between 1 and 36. Note that a regular expression pattern p is expressible as a predicate domain {s:str | s matches p}.
A query domain specifies a query over the database; the terminal must be an element in the query result. For instance, prods = {SELECT name FROM products} ensures that the terminal is a valid product name. The data types may be structured as well, for instance X = { SELECT fname, lname FROM users } would choose from the first and last names of existing users. This formulation serves as hints for the interface to choose a good interaction for the rule, and as input validation rules to guarantee syntactically correct programs.
Following second order languages like SchemaSQL (Lakshmanan et al., 1996), we additionally support special string types to express relation names (rel) and attribute of a relation (attr[str:rel]) where it is optionally parameterized by a relation name. Thus the following restricts name s to attribute names in two relations:
 sources = { s:rel | s in [’usproducts’, ’euproducts’]}
    name = { s:attr[sources] }
Rules. Each rule in is structured as , where is a non-terminal and is a parsing expression composed of a reference to a non-terminal, a terminal (e.g., a string literal), or an expression composed of either a sequence , selection , or zero-or-more operator111PEG operators like AND and NOT can be omitted since DIG is not used for parsing.. Selection implicitly has a domain that specifies which subexpression is selected, and zero-or-more’s domain is the natural numbers, which specifies the number of repetitions. Other patterns, such as and , are reducible to these operators.
A non-terminal on the left side of a rule can optionally be typed by adding the suffix :type. For instance, t:rel in Figure 1 specifies that ‘chirps‘ and ‘evi‘ are relation names. Type violations result in a parsing error.
Naming. Naming is necessary for defining constraints and interface mappings next, thus we now introduce annotations and choice variables. An annotation assigns a variable name to a non-terminal reference by appending :$varname to the reference. For instance, Figure 1 assigns the two val references to s and e. If a reference is not annotated, DIG assigns a unique name by appending a unique number to the non-terminal name (e.g., val1).
Unfortunately, variables alone are not sufficient because the same non-terminal can be referenced multiple times. Consider the following rules:
A = B:$v1 B:$v2 B = C:$v3 C = \d+
The variable v3 is ambiguous because both v1 and v2 reference it. Thus, we define a variable’s fully qualified name as the path from the root of the DIG to the variable, where each element in the path is a non-terminal reference.
All variability in DIG is expressed by non-terminals that expand to a predicate or query domain, selection expression, or zero-or-more expression. We use the term choice variable to refer to the fully qualified reference to such a non-terminal. For instance, v1, v2, v1/v3, v2/v3 are the choice variables in the above example. Further, let be the domain of a given choice variable, as defined in the Terminals and Rules paragraphs above.
Constraints. The developer can specify boolean expressions over choice variables; these constraints are evaluated when the user performs an interaction to determine validity. For instance s e in Figure 1 ensures that start should be less than or equal to the end of the range. Two terms assigned to the same variable name implies an equality constraint. DIG handles equality constraints between variables (e.g., s = e) in a special way: if one variable is bound to a value , then the other is updated to as well; if both are updated then we check if they are equal.
2.2. Valid Interfaces for a DIG
An interface renders query results and lets the user navigate the space of valid queries. Since choice variables encapsulate all variability, a valid interface is one whose interactions can bind values to the set of choice variables. Once they are all bound, the grammar reduces to an executable query string, and the interface renders its evaluation result(s). We will first define interactions and how they cover choice variables, and then define the set of valid interfaces for a DIG grammar. In practice, each starting rule in a grammar represents a separate query, and the interface will render the results of each query; this extension is straightforward and we assume a single root for clarity.
Interfaces and Interactions. An interface consists of a view (e.g., a table, a visualization, a paragraph) that renders the output of the starting rule and a set of interactions . We model an interaction by the state it can express. is its type (e.g., dropdown, slider) and is its domain with schema . For instance, the domain for a dropdown with options is ; for a text box is the set of all strings (perhaps up to a specified length); for a slider is the set of numbers between the min and max; and for a 2-D brush interaction in a scatter plot is the set of bounding boxes in the chart. An interaction’s developer is responsible for defining its domain. Note that our interface model supports arbitrary layout because layout does not affect the interface’s expressiveness222Chart layout (e.g., faceting/small multiples) may affect the set of interactions the chart can express, but is encapsulated by the chart.
Let a mapping map attributes in the interaction’s domain to attributes in the choice variable’s domain, and the mapping’s projection be the subset of attributes in the interaction’s domain that have a mapping. An interaction is said to cover a choice variable if 1) every attribute in is mapped to in , and 2) the interaction’s domain is a superset of the choice variable’s domain: . These ensure that all possible assignments to can be expressed in the interface. Given these definitions, we are now ready to define a interface validity.
Definition 0 (Valid Interface).
An interaction is valid for a DIG grammar if every choice variable in is covered by at least of interaction in , and every root rule is rendered by at least one view.
Example 0.
Figure 1 contains two interactions and two mappings. The dropdown maps its selected index to the choice variable t; since the dropdown is initialized with set of choices in t (e.g., “chirps”, “evi”), their domains will be identical - . The range slider maps the left slider handle to s and the right slider handle to e; the slider’s domain is , which matches the predicate domain and constraints over s and e.
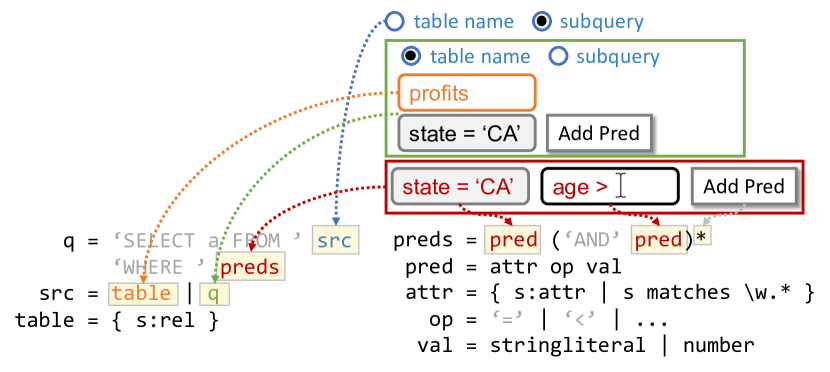
Text Inputs and Parsing. Text inputs are a special type of interaction because they can, in principle, produce arbitrary strings that are interpreted as query substrings rather than string literals. For instance, Figure 2 is a query builder where the user types in predicate expressions, and clicks on “add pred” to add additional conjunctive clauses. The text input is parsed by the pred rule, which implicitly binds the attribute, operator, and value.
For these reasons, a text input333In general, this can be any interaction whose domain is all strings. can map to any term in a DIG grammar. Any input string will first be parsed and validated by the subgrammar rooted at . The parsing process implicitly binds all of the choice variables in the subgrammar, and all parsing errors or constraint violations are passed to the interaction in order to surface as error messages.
This functionality is helpful for several reasons. First, DIG can automatically perform parsing and validation such that any text input is guaranteed to be syntactically correct and naturally prevents issues such as SQL injection. Second, every DIG statement is guaranteed at least one valid interface: one where a text input maps to the root of the grammar, which is equivalent to a typical console-based interface. Third, it enables a progressive interface design process, where starting from the default text-based interface, more specialized interactions are added to the interface to “carve out” more and more choice variables.
Recursive Rules. So far, we have implicitly assumed that the DIG grammar is hierarchical and non-recursive. However, DIG allows recursion in the rule set. For instance, SQL allows nested queries anywhere a value or relation is expected. How does recursion map to a valid interface? We outline three categories of approaches.
The first approach is to simply map the first external reference of the recursive rule set to a text input. However, this may reduce the interface to a single text box. The second approach is to enforce a maximum recursion depth and “unroll” the recursion; this effectively produces a new grammar without this recursion that we can map to a valid interface. The third approach is inspired by existing query builder interfaces that support nested queries: they typically instantiate a “new” query builder interface to represent the nested query. In DIG, we first ignore the expression that introduces the recursion and determine a valid interface for the remaining rules in the recursive rule set. We then map a button to that, when clicked, instantiates a new instance of in the interface.
Figure 2 illustrates recursion in the src rule, which specifies a table name or a subquery with the same structure. The interface lets the user choose between the options using a radio button. If the user chooses table name, they fill a text box with the relation name (e.g., “profits”), which is validated by the table rule. Otherwise, we instantiate a nested interface containing the radio buttons and set of predicates.
2.3. Cross-filter Example
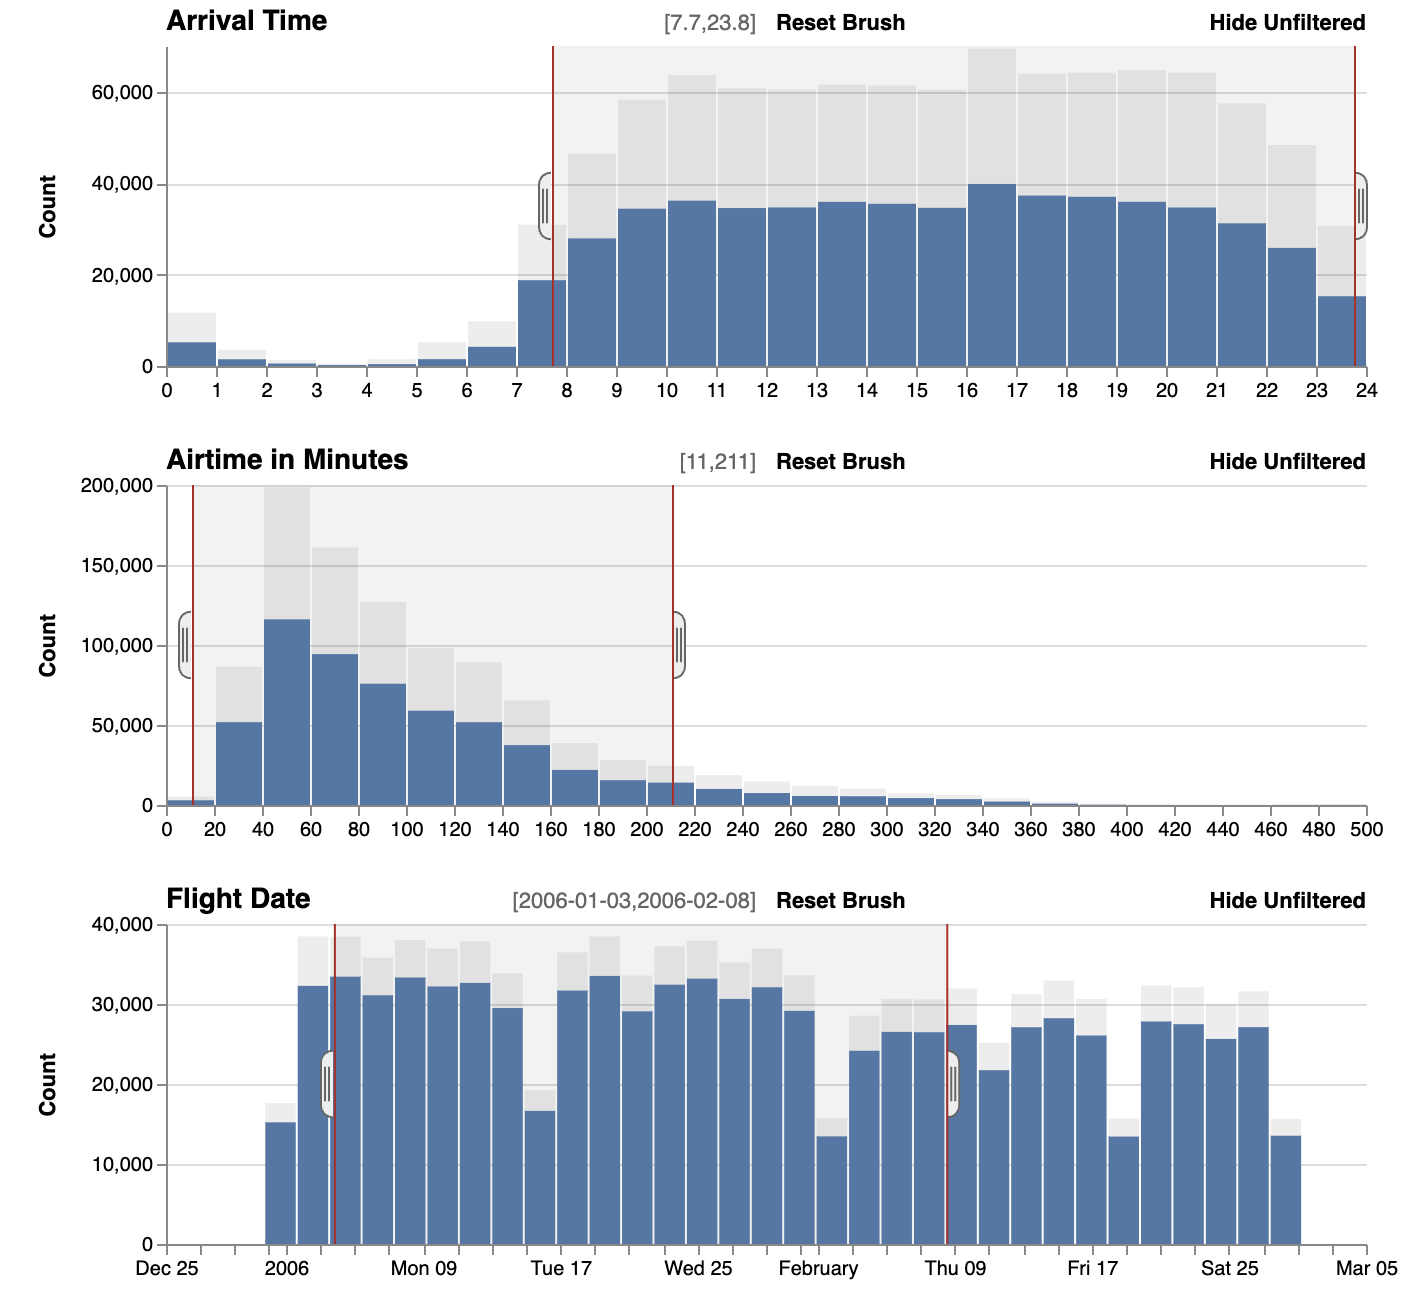
We now use the popular cross-filter visualization (cro, 2023) to illustrate DIG end-to-end on a real-world example. Each bar chart in cross-filter renders an aggregation grouped on one attribute in the underlying dataset. For instance, Figure 3 shows three bar charts grouped on arrival time, airtime, and date, respectively. Brushing over a chart grouped on attr adds a predicate that filters over attr to the other charts; the filtered aggregates are rendered as an overlay, while the unfiltered results are gray in the background.
The following DIG grammar describes the rules to render the arrival (q1) and airtime (q2) charts; it omits constraints and the rules for the date chart.
q1_bg = ’SELECT arrival, count() FROM flights GROUP BY arrival ’ q2_bg = ’SELECT airtime, count() FROM flights GROUP BY airtime ’ ... q1 = ’SELECT arrival, count() FROM flights WHERE ’ p_airtime:$pair ’ AND ’ p_date:$pd ’GROUP BY arrival’ q2 = ’SELECT airtime, count() FROM flights WHERE ’ p_arrival:$parr ’ AND ’ p_date:$pd ’GROUP BY airtime’ ...p_arrival = true | ’arrival BETWEEN ’ arr:$arrs ’ AND ’ arr:$arrep_airtime = true | ’airtime BETWEEN ’ air:$airs ’ AND ’ air:$aire p_date = true | ’date BETWEEN ’ date:$s ’ AND ’ date:$e arr = { SELECT arrival FROM flights } air = { SELECT airtime FROM flights } date = { SELECT date FROM flights }The _bg starting rules define the background unfiltered results, while q1 and q2 define the overlay filtered queries. Each query is filtered by a conjunction of predicate rules (e.g., p_airtime); and each predicate such as p_airtime either evaluates to true, meaning the airtime chart is not brushed, or a BETWEEN clause, meaning that the airtime chart is brushed and the start and end of the brush range map to airs and aire. Notice that p_date in q1 and q2 are both named pd to ensure that their bindings are identical.
2.4. Tool Compatibility
A benefit of DIG is that it is compatible with existing data engineering practices. For instance, data pipelines and analyses are increasingly expressed as a DAG of SQL views using tools like DBT (DBT, 2023). This is useful because data engineers can define these DAGs, while business analysts and data consumers can use these views in visualization and data science tools. Each DAG node is called a model and expressed as a Jinja template that, when evaluated, returns a SQL string. The template can reference custom variables and call logic to change the query by assigning values to the variables in a configuration file.
For instance, the following model uses the variables region to choose the input table (specified using the ref() function), and age to change the filter. region may be set to USA or EUR, themselves are names of other models.
SELECT cty, sum(profit) FROM {{ref(var("region"))}} WHERE age > {{var("age")}}DBT models that ref(), variable, and branching logic can automatically translate into DIG grammars. ref() translates into non-terminal reference to either a base relation/view or the starting rules for grammars translated from other models; a variable translates into a terminal rule; and branching logic translates into a selection rule (e.g., e1 | e2 | ..) with one option for each branch; if the condition expression references a variable, we evaluate the expression dynamically to decide which branch to choose.
For instance, the above model translates into the following, where we assume usa and eur are the starting rules for their respective DBT models.
q = ’SELECT cty, sum(profit) FROM ’ t ’ WHERE age > ’ age t = usa | eur usa = ... eur = ... age = { n:int | n > 0 }
3. Vision: DIG-based Interface Creation
So far, we have described DIG as a compact and expressive abstraction that naturally maps to interactive interfaces. How can such an abstraction change how we design, implement, and use new data-oriented interfaces? Here, we sketch a potential development cycle that DIG can enable. The next section sketches our progress towards this vision.
Design. Barb wants to create a new data interface to analyze user signup flows, and decides to use DIG. One option is to manually write a DIG grammar. Alternatively, she might induce a grammar from existing user signup analyses by extracting queries from e.g., Jupyter notebooks, DBMS query logs, or other database-backed applications, or by translating a natural language description of her analysis goals into a DIG grammar.
Her design tool then automatically synthesizes a custom interactive interface. She likes the overall design, but resizes the canvas to fit a smaller screen, and specifies that the interface should be more expressive. The synthesized interface updates, and she re-positions the charts and widgets to fine-tune the layout.
Implementation. Barb now connects the design tool to the the user signups database. If her dataset is small, the design tool can load the database into memory and either run the interface, or export to a web application. However, if the dataset might grow over time or if it resides in a cloud database (which optimizes for throughput rather than query latency), then Barb potentially needs to engineer an entire client-server system. However, Barb does not have the time, desire, nor expertise to make all of the decisions about which DBMS, data structures, and optimization techniques to employ so that the interface is responsive.
Instead, Barb gives the design tool her budget, and specifies her desired responsiveness for the different interactions. The tool uses metadata about the underlying database to estimate how much resources are needed to meet her responsiveness goals. The proposed architecture requires materializing and caching 7GB of data structures (Pahins et al., 2016; Graefe et al., 2011) in server-side memory, which costs $35/month. Barb thinks it’s too expensive, and moves part of the interface related to post-signup actions to a separate page; this relaxes some of the interactivity constraints, and reduces the sizes of the data structures to 2GB and costs to $15/month. When she accepts the recommendation, and the design tool allocates a cloud server, instantiates the data structures and execution plans, and hosts an end point for the new interface.
Use. Barb knows that learning to use the new interface can be hard for users, so she records herself performing some example analyses. A new user plays with the interface for a bit, gets confused, and then watches a recording. Half way through, he wonders how he can get to that point without reloading the interface and starting from scratch. He clicks a “show me how” button, and the interface dynamically creates a tutorial from where he currently is to the point in the recording. After following the tutorial, he asks “show user flows for only adults above 50” in natural language; it automatically aligns this with the grammar’s structure, translates the natural language input into the appropriate choice variable bindings, and the interface walks through the interactions needed to perform this request.
4. Progress So Far
DIG introduces novel problems to improve how interfaces are created, optimized, and used. We now outline for example problems that we have explored in current or prior work.
4.1. Automatic Interface generation
Section 2 defined the set of valid interfaces that can be mapped from a Data Interface Grammar, and enables the potential to automatically explore and generate valid interfaces for a given DIG grammar. It is also possible to transform the grammar to induce new sets of valid interfaces. Consider the following example based on our recent work called Precision Interfaces 2 (PI2) (Chen and Wu, 2022):
Example 0 (Interface Generation).
Figure 4(a) is an initial DIG grammar and a corresponding valid interface. The grammar expresses four queries that each differs in the filter predicate string; the interface simply selects one of the predicate strings using radio buttons. We can rewrite the grammar to the equivalent grammar in Figure 4(b) by factoring out the “=” character from each predicate and creating separate rules for the left and right sides. The corresponding interface has two sets of radio buttons, one to choose the attribute and one to choose the value. Although this appears trivially similar, we might now apply generalization rules to e.g., let var match any number, or to lift attr to an attribute type. These rules increase the expressiveness of the resulting grammar, and consequently, the set of valid interfaces that a cost model might pick from.
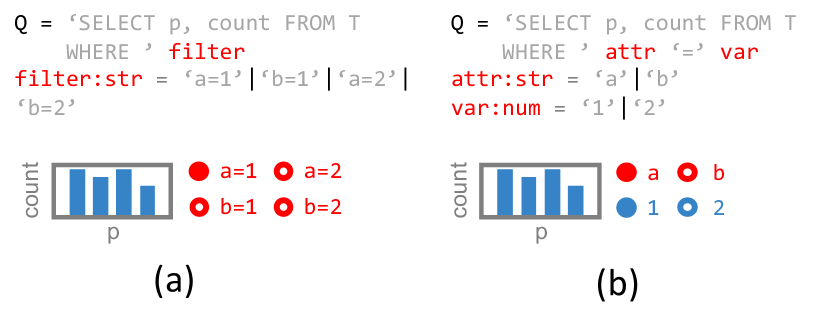
Where Do DIGs Come From? There are many ways to generate a DIG grammar. In our prior work, we have explored a sequence of SQL queries from database logs (Chen and Wu, 2022, 2020), analyses in notebooks (Tao et al., 2022), or query models in DBT (DBT, 2023). Alternatively, it can also be generated from a large language model (Chen et al., 2022), as LLMs are proficient at generating text. For instance, in Figure 4, the DIG could be generated from a natural language query such as ”How is the total count for different p when a is one versus when b is two?”
4.2. Automatic Backend Optimization
Users care about interactivity, and can detect even milliseconds of interaction delay (Jota et al., 2013). As a result, designers must make complex trade-offs between the interface design, levels of responsiveness for different interactions, and the systems and resource implications to guarantee those levels of responsiveness.
Ideally, a designer can label different interactions with their latency constraints and allow an automated tool to check their feasibility and resource requirements. This is not straightforward today. Physical database advisors (Agrawal et al., 2006) take a sample of queries as input, but individual nor sets of queries do not map directly to interactions because, as we have shown, interactions transform targeted portions of a query.
In contrast, DIG naturally models interactions based on the non-terminals they bind; annotating each interaction with latency expectations is now straightforward. This further offers a complete picture of the interface’s data processing requirements, as this annotated DIG grammar expresses the universe of possible queries along with their latency requirements. Given this annotated grammar, we can identify visualization-specific physical data structures to materialize and maintain, along with a placement and query execution plan that spans the client, server, and cloud DBMS, that guarantees these latency requirements. We term this problem Physical Visualization Design (PVD).
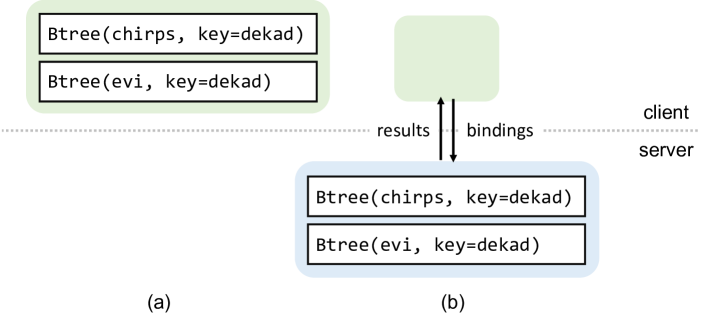
Example 0 (Physical Visualization Design).
Consider the interface in Figure 1. The designer specifies that the slider shold respond in 10ms and dropdown in 100ms, and that the client and server memory constraints are set to 5GB and 50GB, respectively.
Figure 5 shows two potential physical designs. The first suggestion (a) might be to materialize BTree data structures over the chirps and evi datasets on the client in order to execute the slider range interactions as index lookups. If the estimated data structure sizes are less than 5GB, then this option is desirable. If their sizes grow too large, then moving their placement to the server may be preferable (b). This incurs network communication latencies, but the index lookups may be faster due to a faster server CPU.
4.3. Tutorial Generation
When encountering a new interface, the user must both learn how the interface works and use it to achieve different tasks (Kelleher and Pausch, 2005; Grabler et al., 2009; Li et al., 2013). DIG offers the potential to automatically generate interactive tutorial walkthroughs because it manages all of the interface state and explicitly represents its correspondence to interactions in the UI. Thus, given a start and end interface state—expressed as the states of the UI interactions and their corresponding set of bindings in the DIG grammar—we can automatically identify the sequence of user interactions necessary to go from start to end state, and use this sequence to generate an interactive, static, or video tutorial.
Example 0 (Tutorial Generation).
Consider again the interface in Figure 1 as the starting state and the following end state:
SELECT year, payout1(*), ... FROM evi WHERE dekad BETWEEN 1 AND 2To transition to the end state, we simply need to re-bind the choice variables t (using the dropdown) and s,e (using the slider). The order of interactions may be determined by e.g., a user cost model that estimates the amount of effort to perform different sequences.
More complex interface may contain data dependencies—where one choice variable may be a descendant of another . Given the DIG grammar, we can easily infer that the user must interact with before .
4.4. Workload Generation
Visualization benchmarks (Eichmann et al., 2018; Battle et al., 2020) are designed to help evaluate data processing systems that power interactive data interfaces by sequences of query workloads that simulate what an interface would produce during a user’s analysis process. However, existing benchmarks are limited in expressiveness—to SPJA query structures and parameterized filters. Even simple transforms like changing the input relation (Figure 1) are not supported.
In contrast, DIG can express arbitrary query structures, arbitrary transformations, and models a direct correspondence between user interactions and their query transformations. As such, simply developing different user models—say, training a markov model or using a large language model to simulate an agent—can easily generate diverse query workloads and timings that reflect real data interfaces, queries, and user needs.
5. Conclusions
In this paper, we propose DIG, a Data Interface Grammar that extends Parsing Expression Grammars (PEG) with annotations specific to data programs. DIG satisfies all three desired criteria: (C1) it can compactly express any set of queries useful for a task; (C2) it has a well-defined correspondence to interactive interfaces composed of charts, widgets, and interactions; (C3) it is amenable to offline analysis. We also demonstrate the compatibility with existing data engineering practices - DBT (DBT, 2023). We further illustrate the potential benefits of this abstraction, such as automatic interface generation, automatic interface backend optimization, tutorial generation, and workload generation. Addtionally, we describe how DIG simplifies interface creation via real-world examples.
Acknowledgements.
Thanks to Miles Hong for helpful feedback. This material is based upon work supported by NSF grants 1845638, 2008295, 2106197, 2103794; Amazon and Adobe. Any opinions, findings, and conclusions or recommendations expressed in this material are those of the author(s) and do not necessarily reflect the views of the funders.References
- (1)
- cro (2023) 2023. Crossfilter: Fast Multidimensional Filtering for Coordinated Views. http://crossfilter.github.io/crossfilter/.
- prq (2023) 2023. Pipelined Relational Query Language. https://prql-lang.org/.
- Agrawal et al. (2006) Sanjay Agrawal, Nicolas Bruno, Surajit Chaudhuri, and Vivek R Narasayya. 2006. AutoAdmin: Self-Tuning Database SystemsTechnology. IEEE Data Eng. Bull. 29, 3 (2006), 7–15.
- Battle et al. (2020) Leilani Battle, Philipp Eichmann, Marco Angelini, Tiziana Catarci, Giuseppe Santucci, Yukun Zheng, Carsten Binnig, Jean-Daniel Fekete, and Dominik Moritz. 2020. Database benchmarking for supporting real-time interactive querying of large data. In Proceedings of the 2020 ACM SIGMOD International Conference on Management of Data. 1571–1587.
- BI (2023) Power BI. 2023. Turn your data into immediate impact. https://powerbi.microsoft.com/en-us/.
- Chen and Huang (2022) Yiru Chen and Silu Huang. 2022. TSEXPLAIN: Explaining Aggregated Time Series by Surfacing Evolving Contributors. arXiv preprint arXiv:2211.10909 (2022).
- Chen et al. (2022) Yiru Chen, Ryan Li, Austin Mac, Tianbao Xie, Tao Yu, and Eugene Wu. 2022. NL2INTERFACE: Interactive Visualization Interface Generation from Natural Language Queries. ArXiv abs/2209.08834 (2022).
- Chen and Wu (2020) Yiru Chen and Eugene Wu. 2020. Monte Carlo Tree Search for Generating Interactive Data Analysis Interfaces. In the AAAI-20 Workshop on Intelligent Process Automation (IPA-20).
- Chen and Wu (2022) Yiru Chen and Eugene Wu. 2022. PI2: End-to-End Interactive Visualization Interface Generation from Queries. In Proceedings of the 2022 International Conference on Management of Data (Philadelphia, PA, USA) (SIGMOD ’22). Association for Computing Machinery, New York, NY, USA, 1711–1725. https://doi.org/10.1145/3514221.3526166
- DBT (2023) DBT. 2023. Transforming data. Transforming teams. https://www.getdbt.com/.
- Eichmann et al. (2018) Philipp Eichmann, Carsten Binnig, Tim Kraska, and Emanuel Zgraggen. 2018. IDEBench: A Benchmark for Interactive Data Exploration. Proceedings of the 2020 ACM SIGMOD International Conference on Management of Data (2018).
- Google (2021) Google. 2021. Facets - Know Your Data. https://pair-code.github.io/facets/.
- Grabler et al. (2009) Floraine Grabler, Maneesh Agrawala, Wilmot Li, Mira Dontcheva, and Takeo Igarashi. 2009. Generating photo manipulation tutorials by demonstration. ACM Trans. Graph. 28 (2009), 66.
- Graefe et al. (2011) Goetz Graefe et al. 2011. Modern B-tree techniques. Foundations and Trends® in Databases 3, 4 (2011), 203–402.
- Greatrex et al. (2015) Helen Greatrex, James Hansen, Samantha Garvin, Rahel Diro, Margot Le Guen, Sari Blakeley, Kolli Rao, and Daniel Osgood. 2015. Scaling up index insurance for smallholder farmers: Recent evidence and insights. CCAFS Report (2015).
- iCheck (2021) iCheck. 2021. iCheck. icheckuclaim.org.
- Ioannidis et al. (1997) Yannis E Ioannidis, Raymond T Ng, Kyuseok Shim, and Timos K Sellis. 1997. Parametric query optimization. The VLDB Journal 6 (1997), 132–151.
- Jota et al. (2013) Ricardo Jota, Albert Ng, Paul Dietz, and Daniel Wigdor. 2013. How fast is fast enough? a study of the effects of latency in direct-touch pointing tasks. In Proceedings of the sigchi conference on human factors in computing systems. 2291–2300.
- Kandel et al. (2011) S. Kandel, A. Paepcke, J. Hellerstein, and J. Heer. 2011. Wrangler: interactive visual specification of data transformation scripts. Proceedings of the SIGCHI Conference on Human Factors in Computing Systems (2011).
- Kelleher and Pausch (2005) Caitlin L. Kelleher and Randy F. Pausch. 2005. Stencils-based tutorials: design and evaluation. Proceedings of the SIGCHI Conference on Human Factors in Computing Systems (2005).
- Lakshmanan et al. (1996) Laks VS Lakshmanan, Fereidoon Sadri, and Iyer N Subramanian. 1996. SchemaSQL-a language for interoperability in relational multi-database systems. In VLDB, Vol. 96. Citeseer, 239–250.
- Li et al. (2013) Wei Li, Yuanlin Zhang, and George W. Fitzmaurice. 2013. TutorialPlan: Automated Tutorial Generation from CAD Drawings. In International Joint Conference on Artificial Intelligence.
- Murray (2013) Daniel Murray. 2013. Tableau Your Data!: Fast and Easy Visual Analysis with Tableau Software.
- Pahins et al. (2016) Cicero AL Pahins, Sean A Stephens, Carlos Scheidegger, and Joao LD Comba. 2016. Hashedcubes: Simple, low memory, real-time visual exploration of big data. IEEE transactions on visualization and computer graphics 23, 1 (2016), 671–680.
- Satyanarayan et al. (2018) Arvind Satyanarayan, Dominik Moritz, Kanit Wongsuphasawat, and Jeffrey Heer. 2018. Vega-Lite: A Grammar of Interactive Graphics. IEEE Transactions on Visualization and Computer Graphics 23 (2018), 341–350.
- Satyanarayan et al. (2016) Arvind Satyanarayan, Ryan Russell, Jane Hoffswell, and Jeffrey Heer. 2016. Reactive Vega: A Streaming Dataflow Architecture for Declarative Interactive Visualization. IEEE Transactions on Visualization and Computer Graphics 22 (2016), 659–668.
- Tableau (2023) Tableau. 2023. The world’s leading analytics platform. https://www.tableau.com/.
- Tao et al. (2022) Jeffrey Tao, Yiru Chen, and Eugene Wu. 2022. Demonstration of PI2: Interactive Visualization Interface Generation for SQL Analysis in Notebook. In Proceedings of the 2022 International Conference on Management of Data (Philadelphia, PA, USA) (SIGMOD ’22). Association for Computing Machinery, New York, NY, USA, 2365–2368. https://doi.org/10.1145/3514221.3520153