Applying Process Mining on Scientific Workflows: a Case Study††thanks: The authors gratefully acknowledge the German Federal Ministry of Education and Research (BMBF) and the Ministry of Education and Research of North-Rhine Westphalia for supporting this work/project as part of the NHR funding. Also, we thank the Alexander von Humboldt (AvH) Stiftung for supporting our research.
Abstract
Computer-based scientific experiments are becoming increasingly data-intensive. High-Performance Computing (HPC) clusters are ideal for executing large scientific experiment workflows. Executing large scientific workflows in an HPC cluster leads to complex flows of data and control within the system, which are difficult to analyze. This paper presents a case study where process mining is applied to logs extracted from SLURM-based HPC clusters, in order to document the running workflows and find the performance bottlenecks. The challenge lies in correlating the jobs recorded in the system to enable the application of mainstream process mining techniques. Users may submit jobs with explicit or implicit interdependencies, leading to the consideration of different event correlation techniques. We present a log extraction technique from SLURM clusters, completed with an experimental.
Keywords:
High Performance Computing SLURM Scientific workflow Process mining.1 Introduction
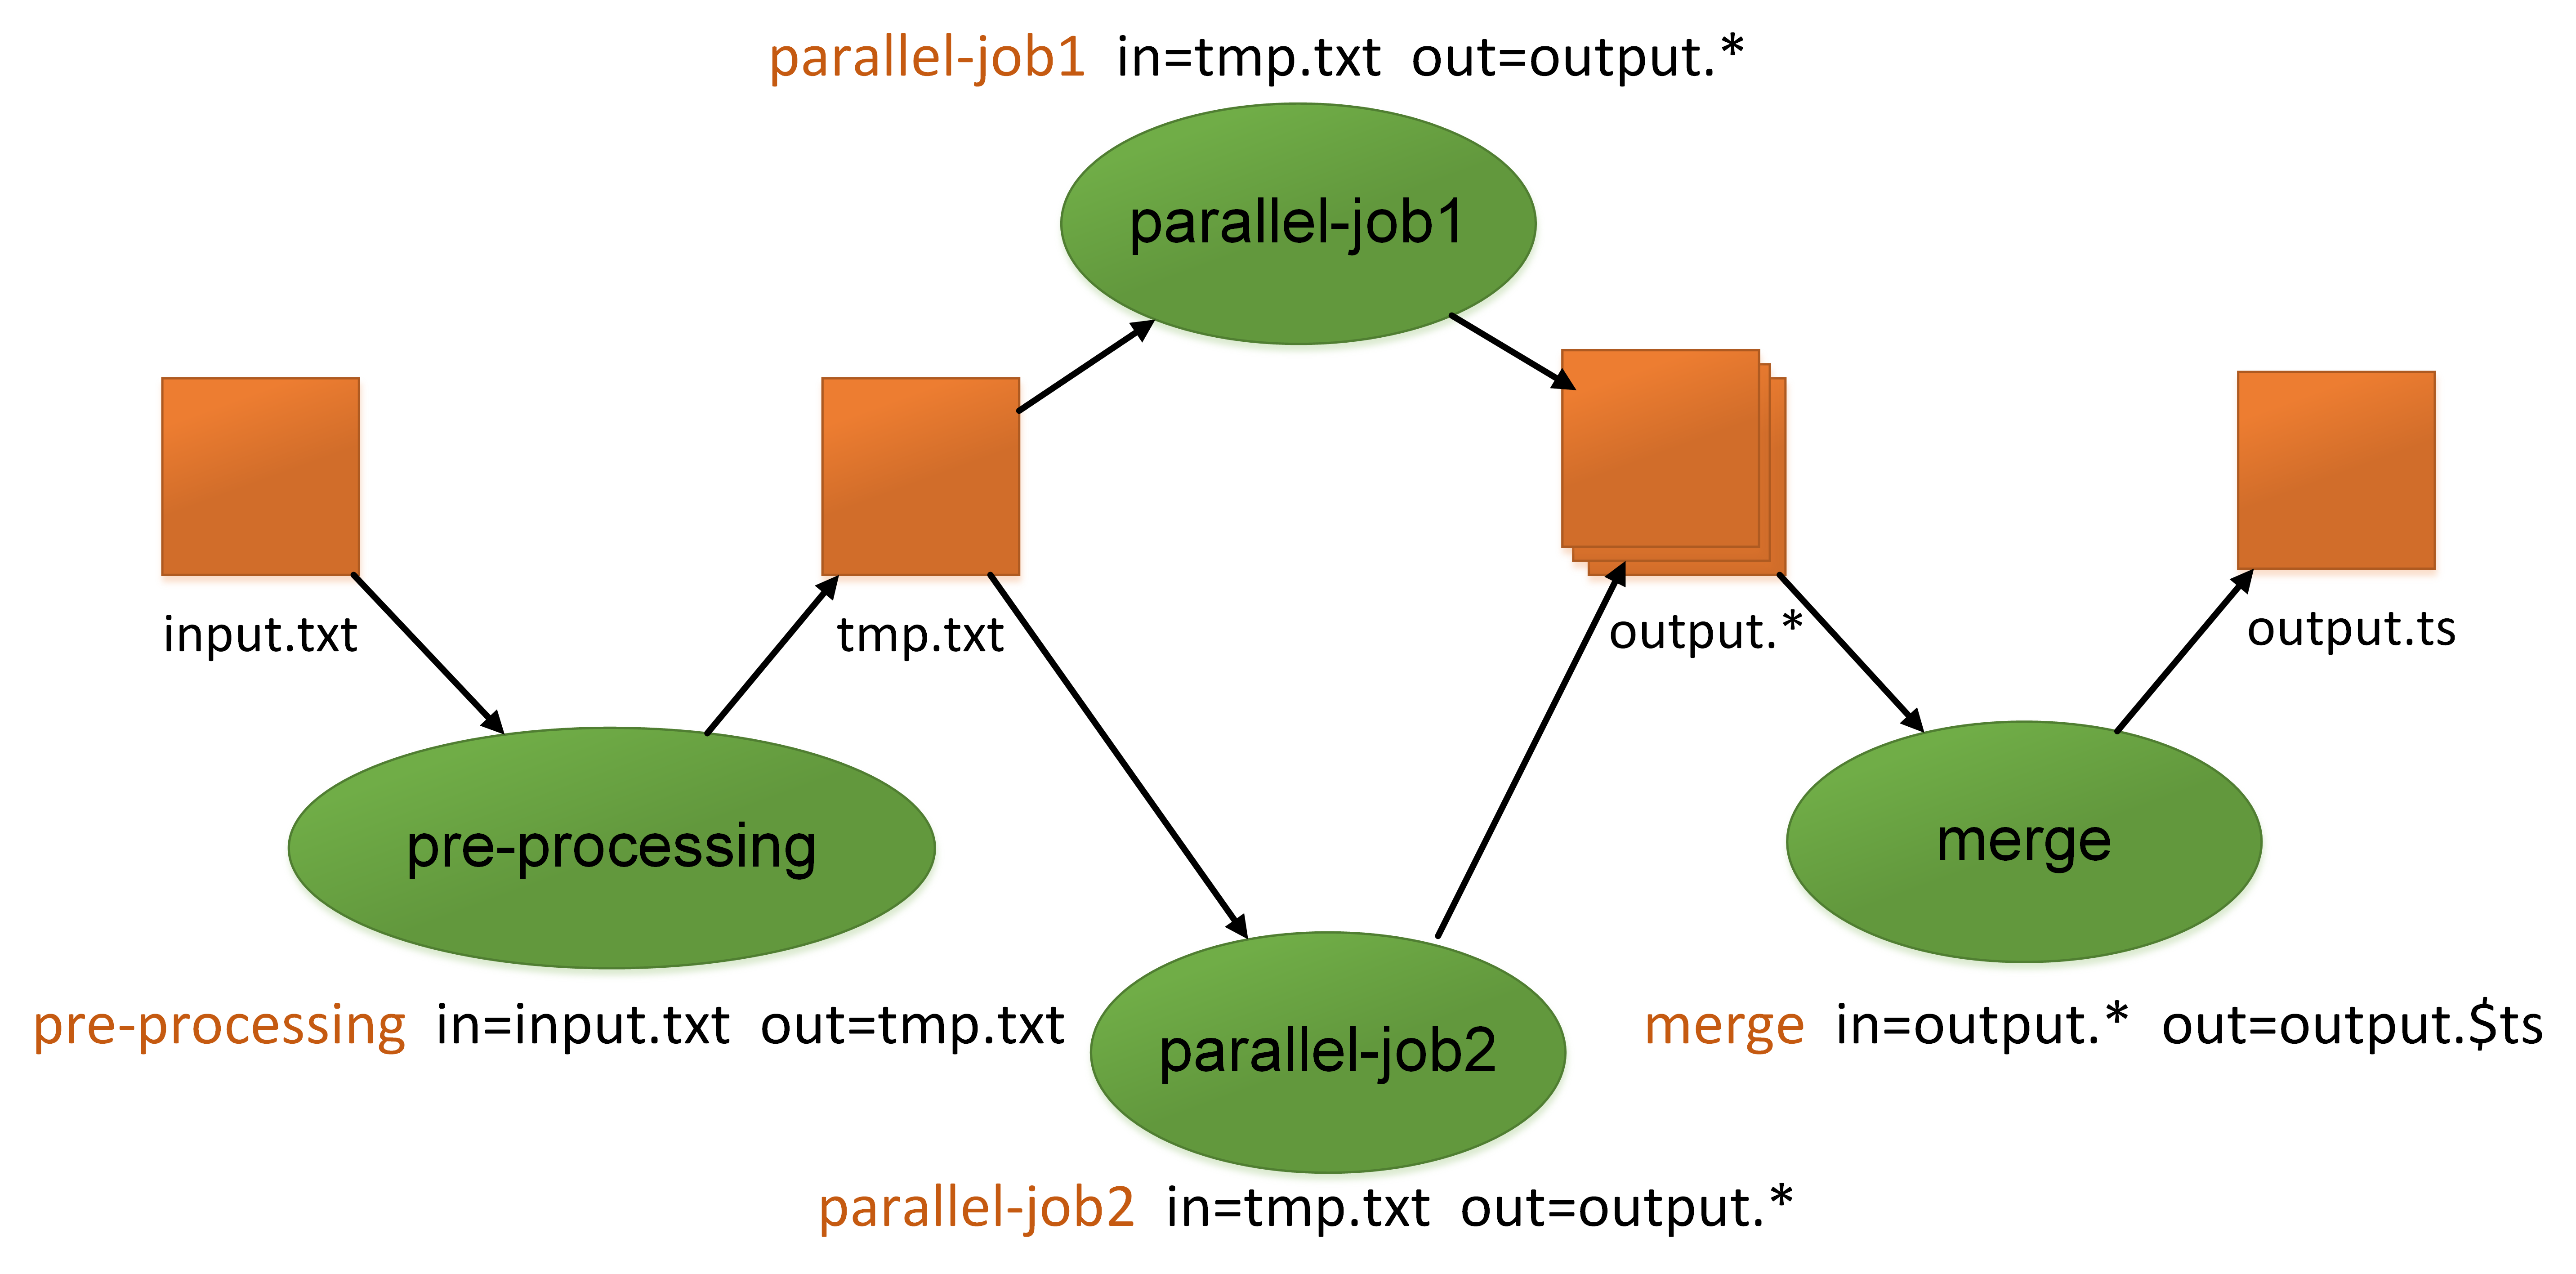
A workflow is a description and automation of a process, in which data is processed by different logical data processing activities according to a set of rules. A scientific workflow is an ensemble of scientific experiments, described in terms of scientific activities with data dependencies between them [2]. Scientific workflows allow scientists to model and express the entirety of data processing steps and their dependencies. Fig. 1 shows an example of scientific workflows depicted as a flow chart, where each task is associated with a command.
Modern scientific experiments generate and consume a vast amount of data, making scientific workflows increasingly data-intensive. To process this massive data in a reasonable time, scientists need to use parallel processing methods in the cloud or on an HPC cluster [5], which can provide the necessary computing power for heavy tasks. However, executing scientific workflows on HPC clusters is usually complex and time-consuming due to the large data involved [10]. This paper aims to employ process mining techniques to improve the understanding of the workflow execution process and identify optimization opportunities.
Over the past decades, there has been a growing interest in the field of process mining [1]. Process mining aims to extract information about processes from event logs, i.e., execution histories. This paper applies process mining to existing scientific workflows with the following goals:
-
•
Documentation of scientific workflows: reporting which commands are executed and in which order. We pursue this goal by using process discovery techniques, one of the main branches of process mining [1]: Process discovery techniques assume that every record in the event log contains at least: (i) a reference to the executed activity, (ii) a reference to the identifier that associates an event to a particular execution of the process, and (iii) the timestamp at which the event has occurred.
-
•
Detection of bottlenecks affecting the execution of scientific workflows. We enrich the process model discovered in the previous step with performance results obtained .
While the techniques proposed in this paper can be applied to any workflow system, to promote applicability we focus on the SLURM system governing the RWTH HPC cluster, one of the most widely used platforms in the field.
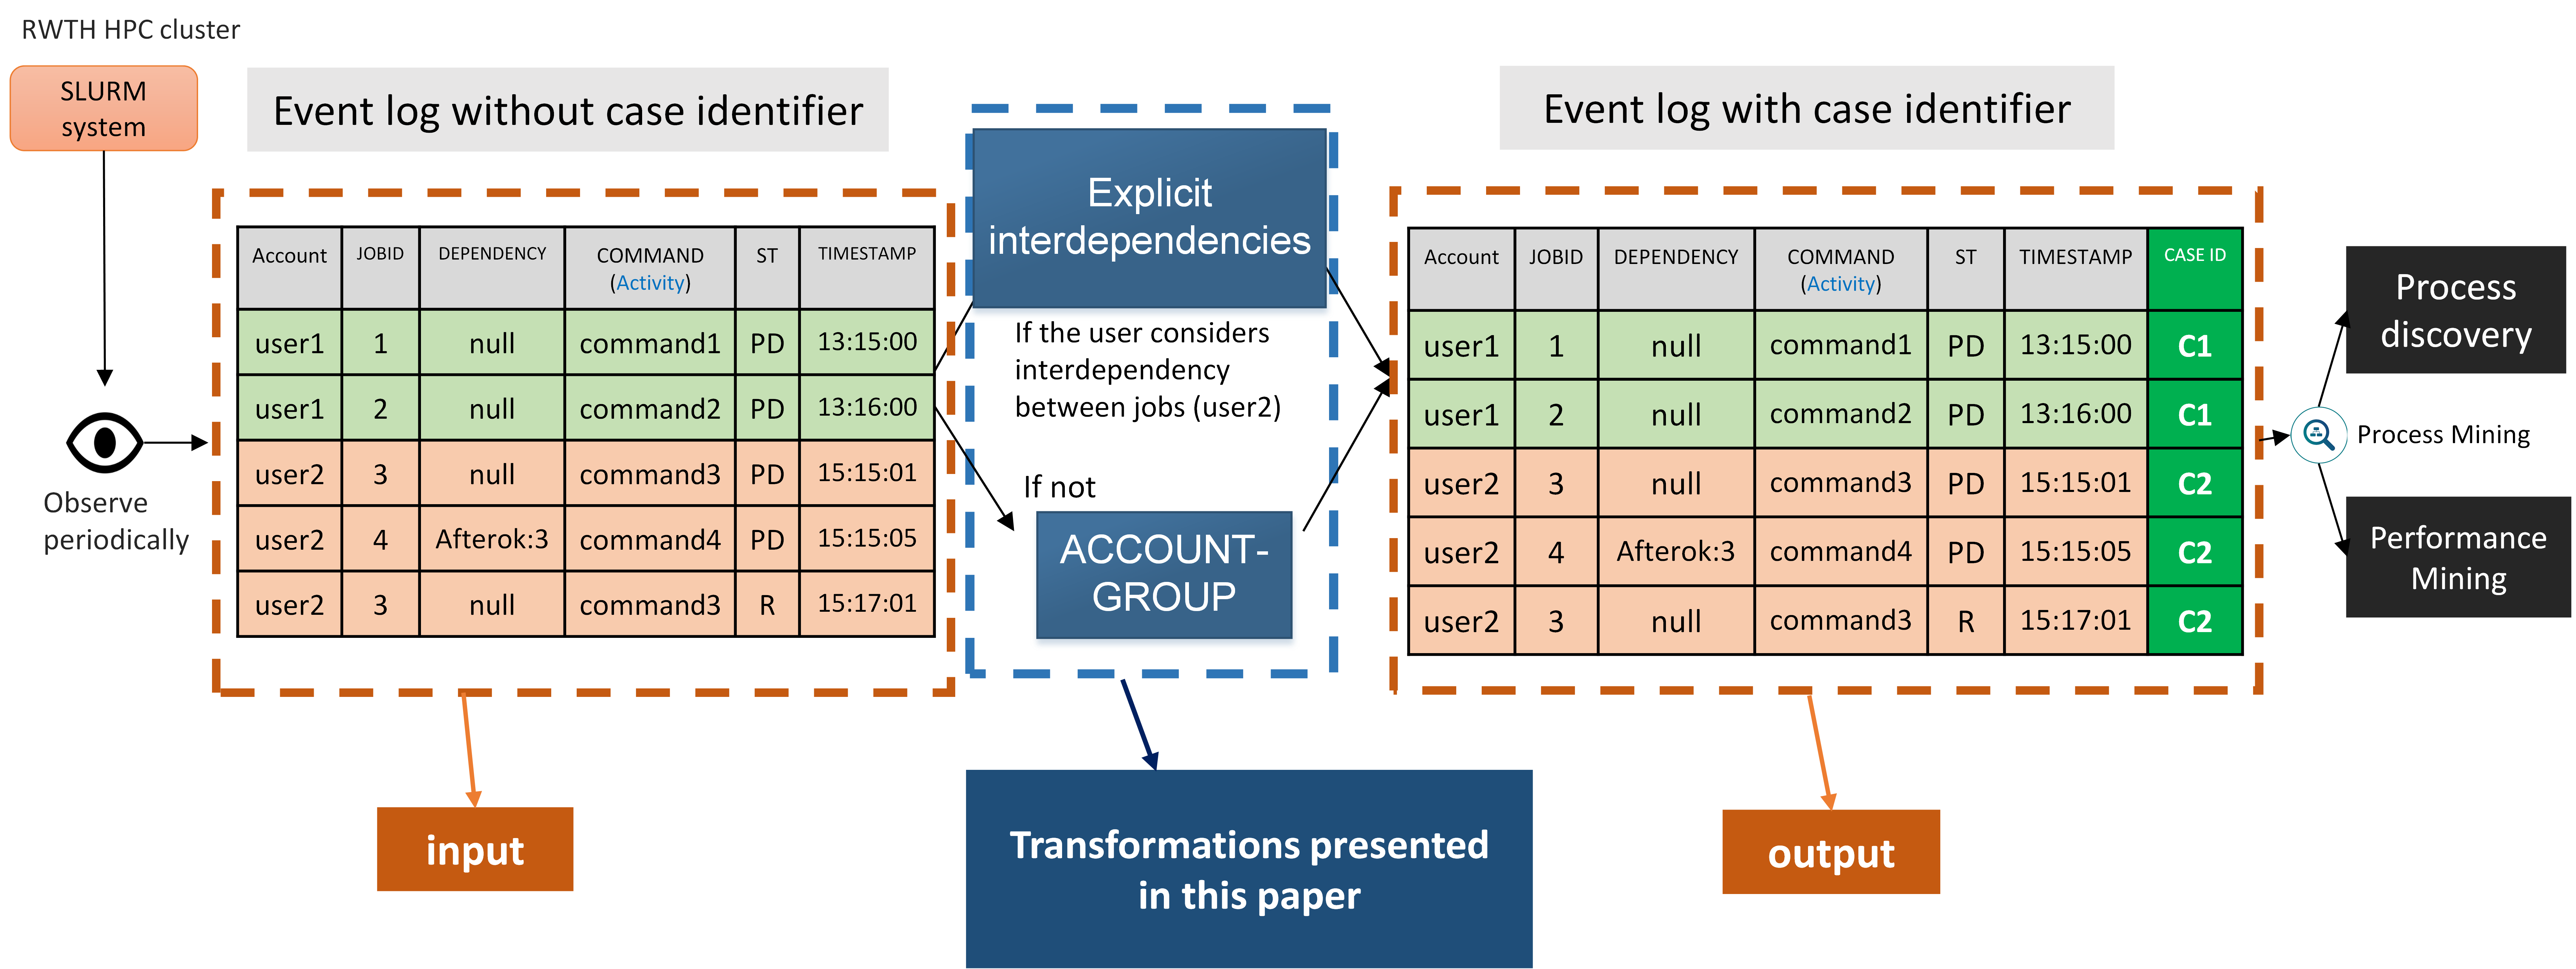
The issue in examining the logs obtained from a given workflow system is the absence of a clearly defined case identifier that groups events associated with the same execution. In order to apply process mining on these logs, it is necessary to study the correlation between tasks that are running on the HPC cluster. Fig. 2 shows an overall view of our approach. The RWTH HPC cluster is observed periodically, and an input log is generated; then, based on the way the user has executed their jobs on the SLURM [9], we propose two different approaches to assign case IDs to events. Finally, we obtain an event log on which process mining techniques can be applied.
The remainder of this paper is organized as follows. Sec. 2 reviews some related works. Sec. 3 shows some technical notions on how the SLURM system is implemented and which information is available to eventually form an event log. Sec. 4 explains our approach to apply process mining techniques to the scientific workflows running on SLURM-based HPC clusters. Sec. 5 introduces some analyses of the event log extracted from the SLURM system of RWTH Aachen University. Finally, Sec. 6 concludes the paper.
2 Related Work
Many studies have analyzed HPC behavior starting from data collected about the running jobs. In [4], an extension of miniHPC is proposed, to enable job-level monitoring to interpret anomalous behaviors such as load imbalance, CPU and I/O anomalies, or memory leaks. A framework for monitoring, analyzing, and predicting jobs running on PBS-based job scheduler HPCs is defined in [6]. The monitoring module captures data about the topology of in-use nodes while a job is running. This provides a deeper understanding of how the job is distributed across the HPCs node network. In [3], a software stack for center-wide and job-aware cluster monitoring to influence node performance is described.
Process mining techniques have been used to analyze scientific/business workflow logs. In [10, 11], a technique to mine scientific workflows based on provenance (i.e., the source of information involved in manipulating artifacts) is proposed. In [8], Scientific Workflow Mining as a Service (SWMaaS) is presented to support both intra-cloud and inter-cloud scientific workflow mining.
A limitation of [4, 3, 6, 7] is that they examine the jobs regardless of their interdependencies. Moreover, in [11, 8], it is assumed that the data source already contains all the necessary information to apply process mining, ignoring the situations in which no case notion is defined. This paper aims to introduce event correlation methods applicable to event data extracted from scientific workflows.
3 Preliminaries
We will focus on analyzing event data from the popular SLURM platform for HPC computing. Hence, in this section, we present some technical notions. To interact with SLURM, we have a set of possible commands. The most essential commands are listed here [9]:
-
•
srun: runs a single job. We need to create a srun script, which can then be submitted on SLURM for real-time execution.
-
•
sbatch: submits one or more srun commands for later execution on SLURM.
-
•
squeue: reports the states of the running jobs. This command helps us to extract a log for process mining purposes.
3.1 Execution of a Single Job on SLURM
Any script runs on SLURM as a job. As mentioned above, the execution of a job on SLURM could be easily done with srun and sbatch containing one single srun command. Understanding the sequential stages a job undergoes for execution, and the data that can be extracted for each job running in the SLURM queue is valuable [9].
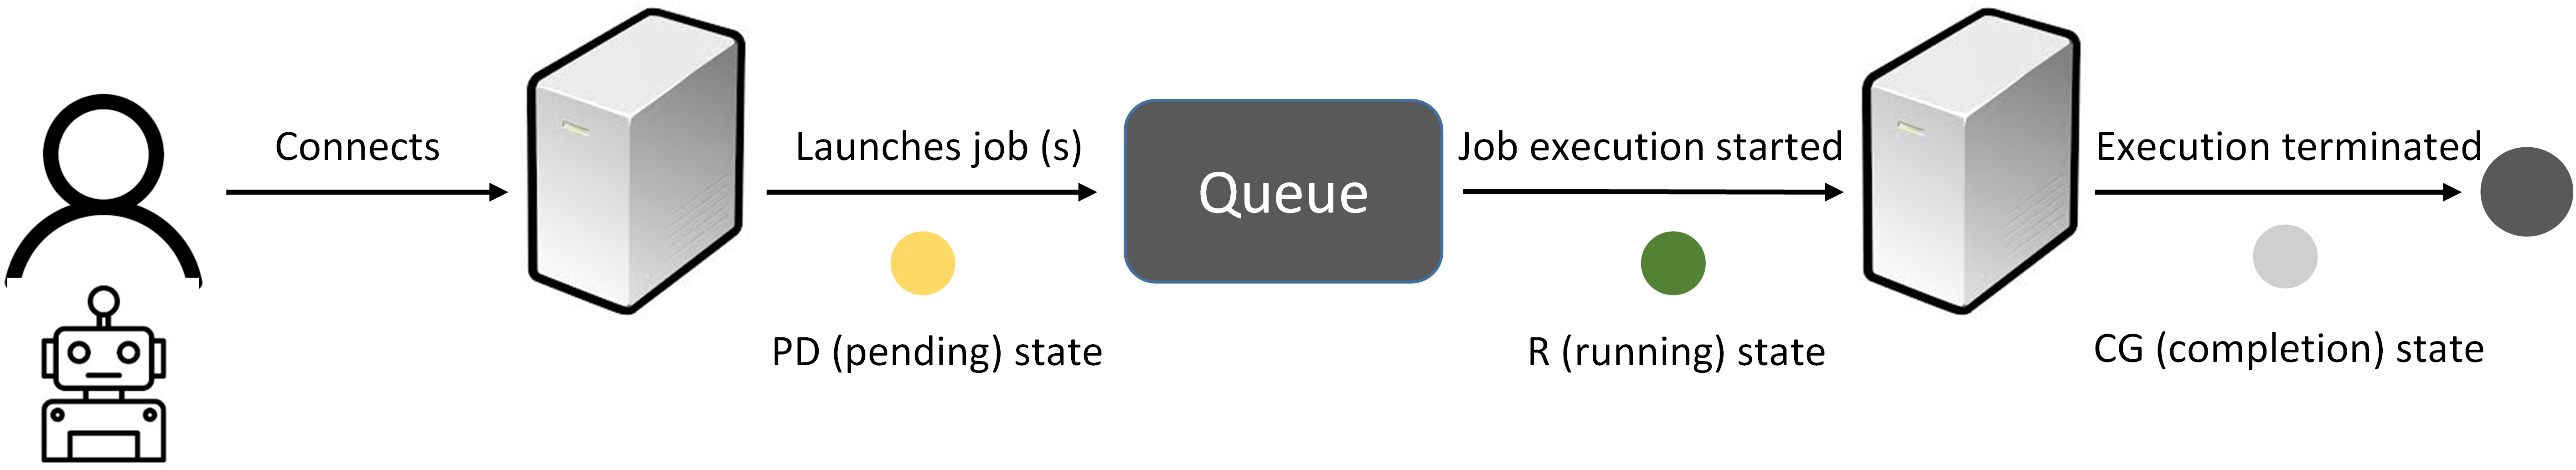
Typically, jobs pass through several states in the course of their execution. There are a total of 24 possible states for a job, of which three can be seen in Fig. 3 [9].
-
•
PENDING (PD): the job is waiting for resource allocation.
-
•
RUNNING (R): the job is currently allocated.
-
•
COMPLETING (CG): the job is in the process of completion.
The SLURM scheduling queue contains all the information about running jobs. To view this information we use the squeue command. The most important features of the jobs that have been used in our study are listed in Table 1. These features could be extracted with the squeue -o "%a %i %E %o %t %g" command on the SLURM system. This command shows the list of jobs in the SLURM scheduling queue along with their account, job ID, declared dependency, executed command, status, and project ID information [9].
| Column title | Description |
|---|---|
| ACCOUNT | Account associated with the job. |
| JOBID | An unique value as job identifier. |
| DEPENDENCY | Specify the dependencies of the job on other jobs. This job will not begin execution until these dependent jobs are complete. In the case of a job that cannot run due to job dependencies never being satisfied, the full original job dependency specification will be reported. A value of NULL implies this job has no dependencies. |
| COMMAND | The command to be executed. |
| ST | Jobs typically pass through several states in the course of their execution. The typical states are PENDING, RUNNING, SUSPENDED, COMPLETING, and COMPLETED. ST is the compact state of the job. |
| GROUP | Group name of the job. The project ID is reported as GROUP in SLURM. |
3.2 Execution of a Sequence of Jobs on SLURM
To explain how to run a series of jobs (sequence of scripts) on the SLURM workflow system, we will go through an example. Consider a user who wants to run four scripts on SLURM, pre-processing as the first one, then parallel-job1 and parallel-job2, which can be executed in parallel but must be executed after the pre-processing script (because they need the output from pre-processing). Finally, the merge script needs the output of the two parallel jobs for its execution. The user can run the sequences of jobs on SLURM in two ways: either manually (without explicit interdependencies) or automatically (with interdependencies).
Execution of a Sequence of Jobs without Explicit Interdependencies: In this case, the user runs the jobs manually—without declaring the inter-dependencies between jobs—and after submitting each job waits for its execution to be completed; then, executes the next job (Fig. 4). In this case, each job is executed as independent, and only the user knows that some of these jobs are logically dependent on each other.
Execution of a Sequence of Jobs with Explicit Interdependencies: In this scenario, the user uses the SLURM dependency management system and submits all jobs at once with correct inter-dependencies on the SLURM system, as shown in Fig. 5. Here, the user uses the sbatch command. This command is used to submit a job script for later execution using the --dependency option. The script typically contains one or more srun commands to launch parallel tasks. In this case, the user does not need to wait for the outputs of a single job, but can wait for the execution of all the tasks and retrieve the final results at completion (Fig. 5).
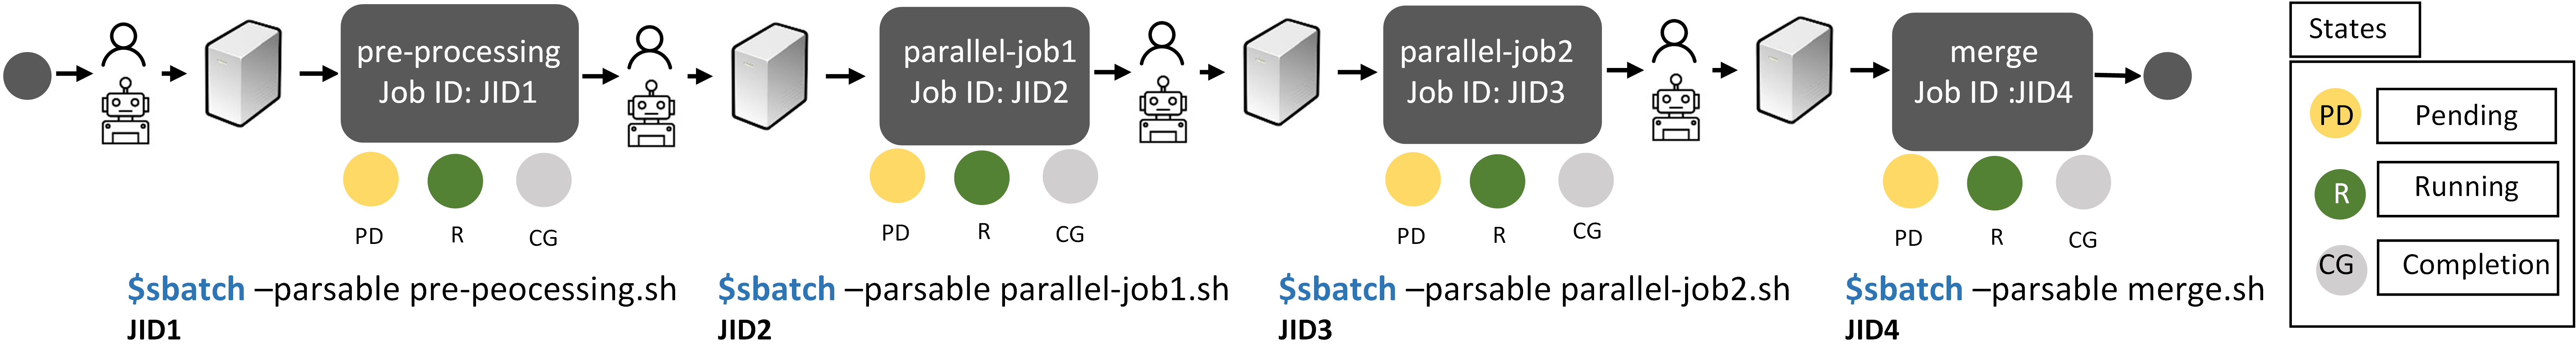
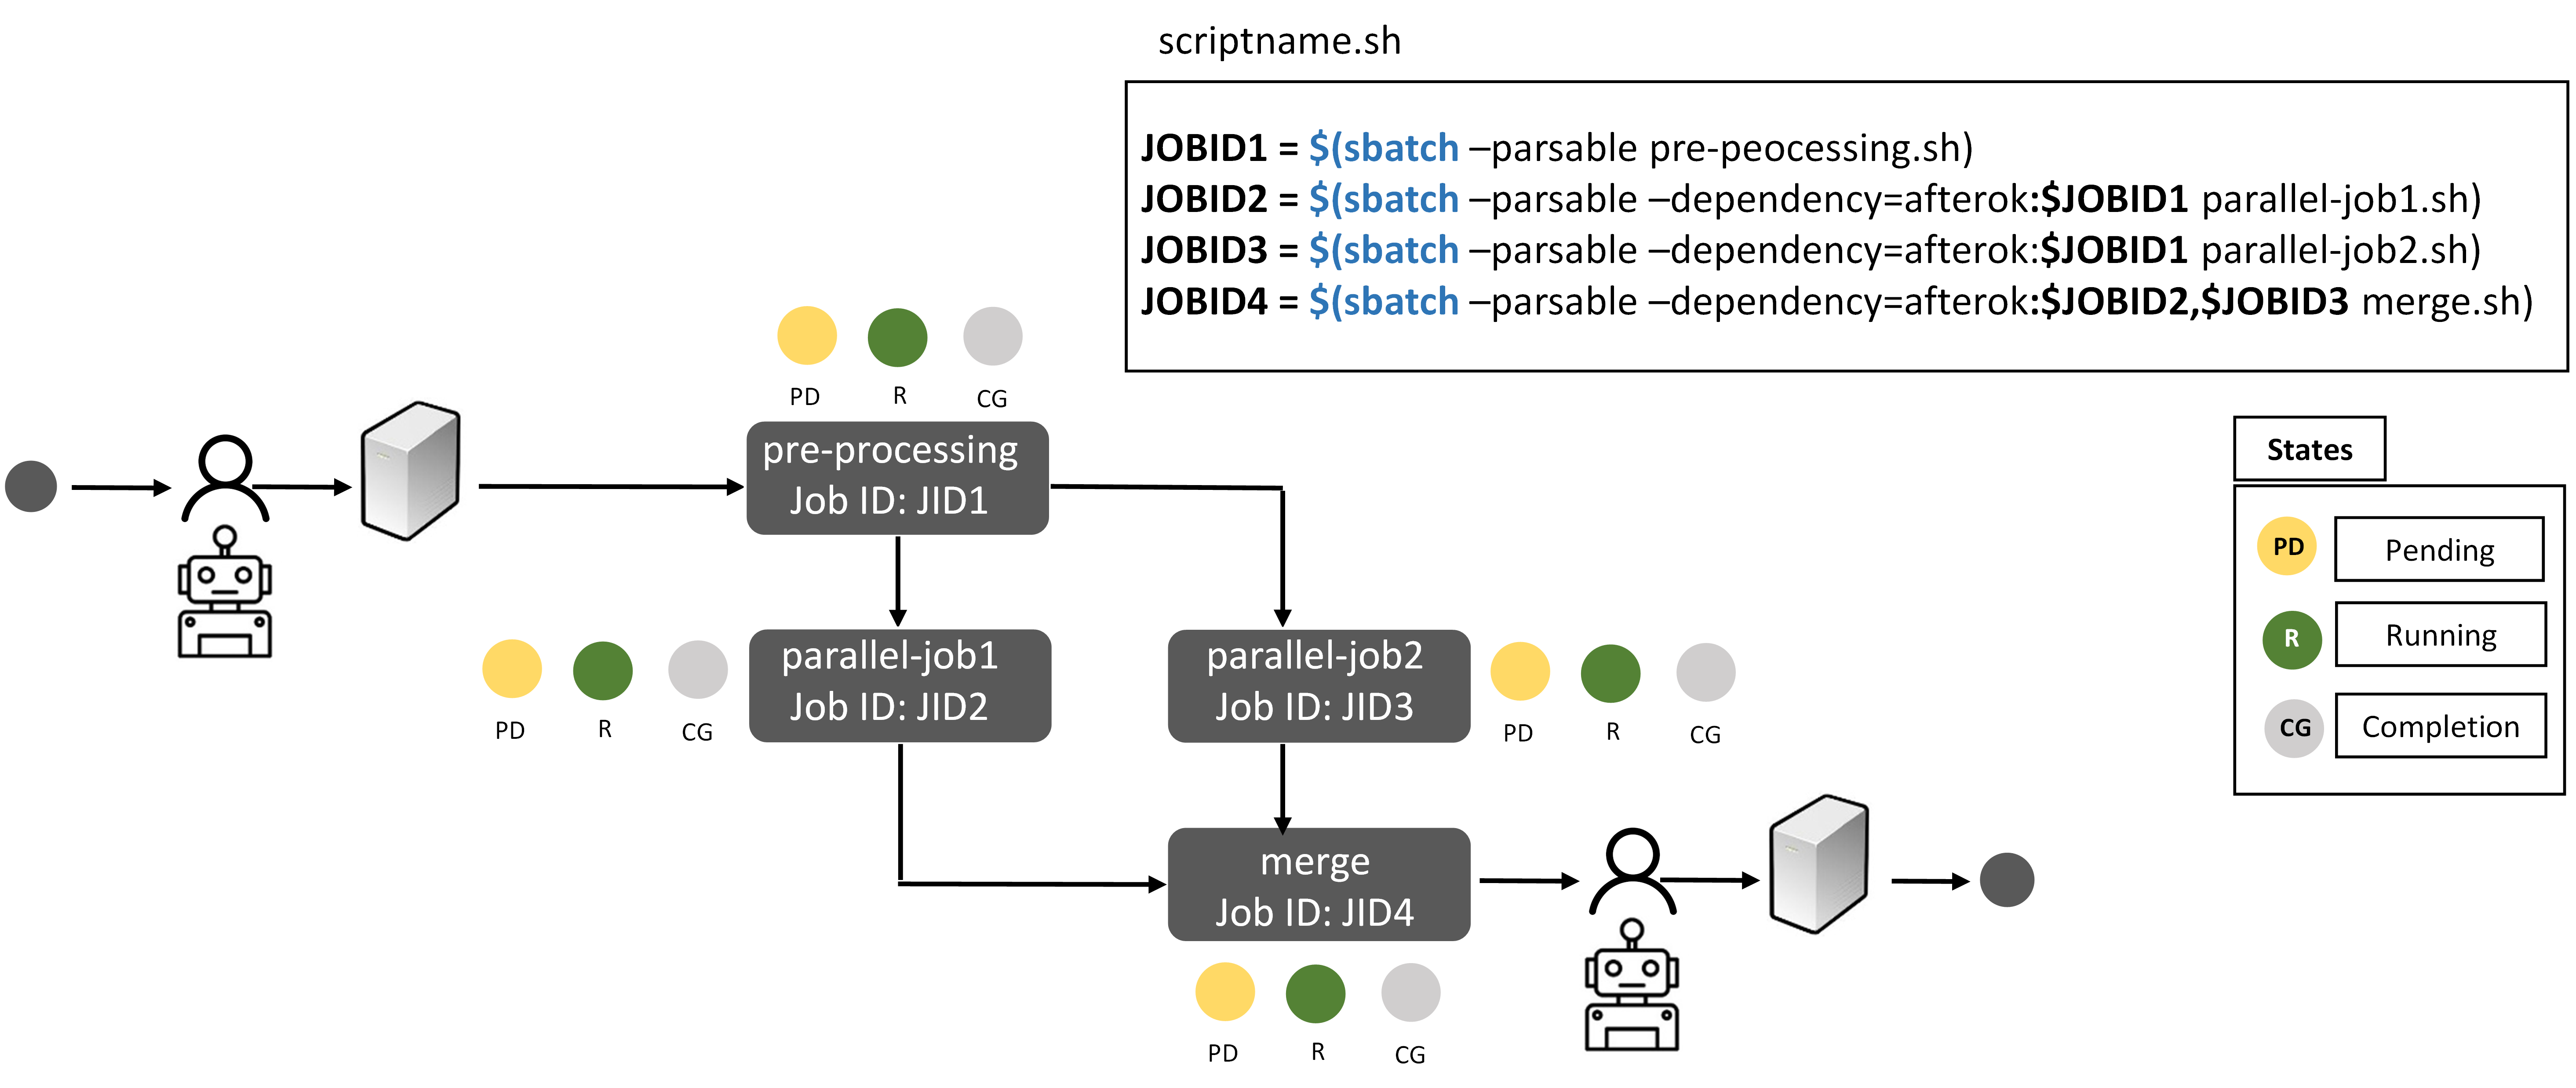
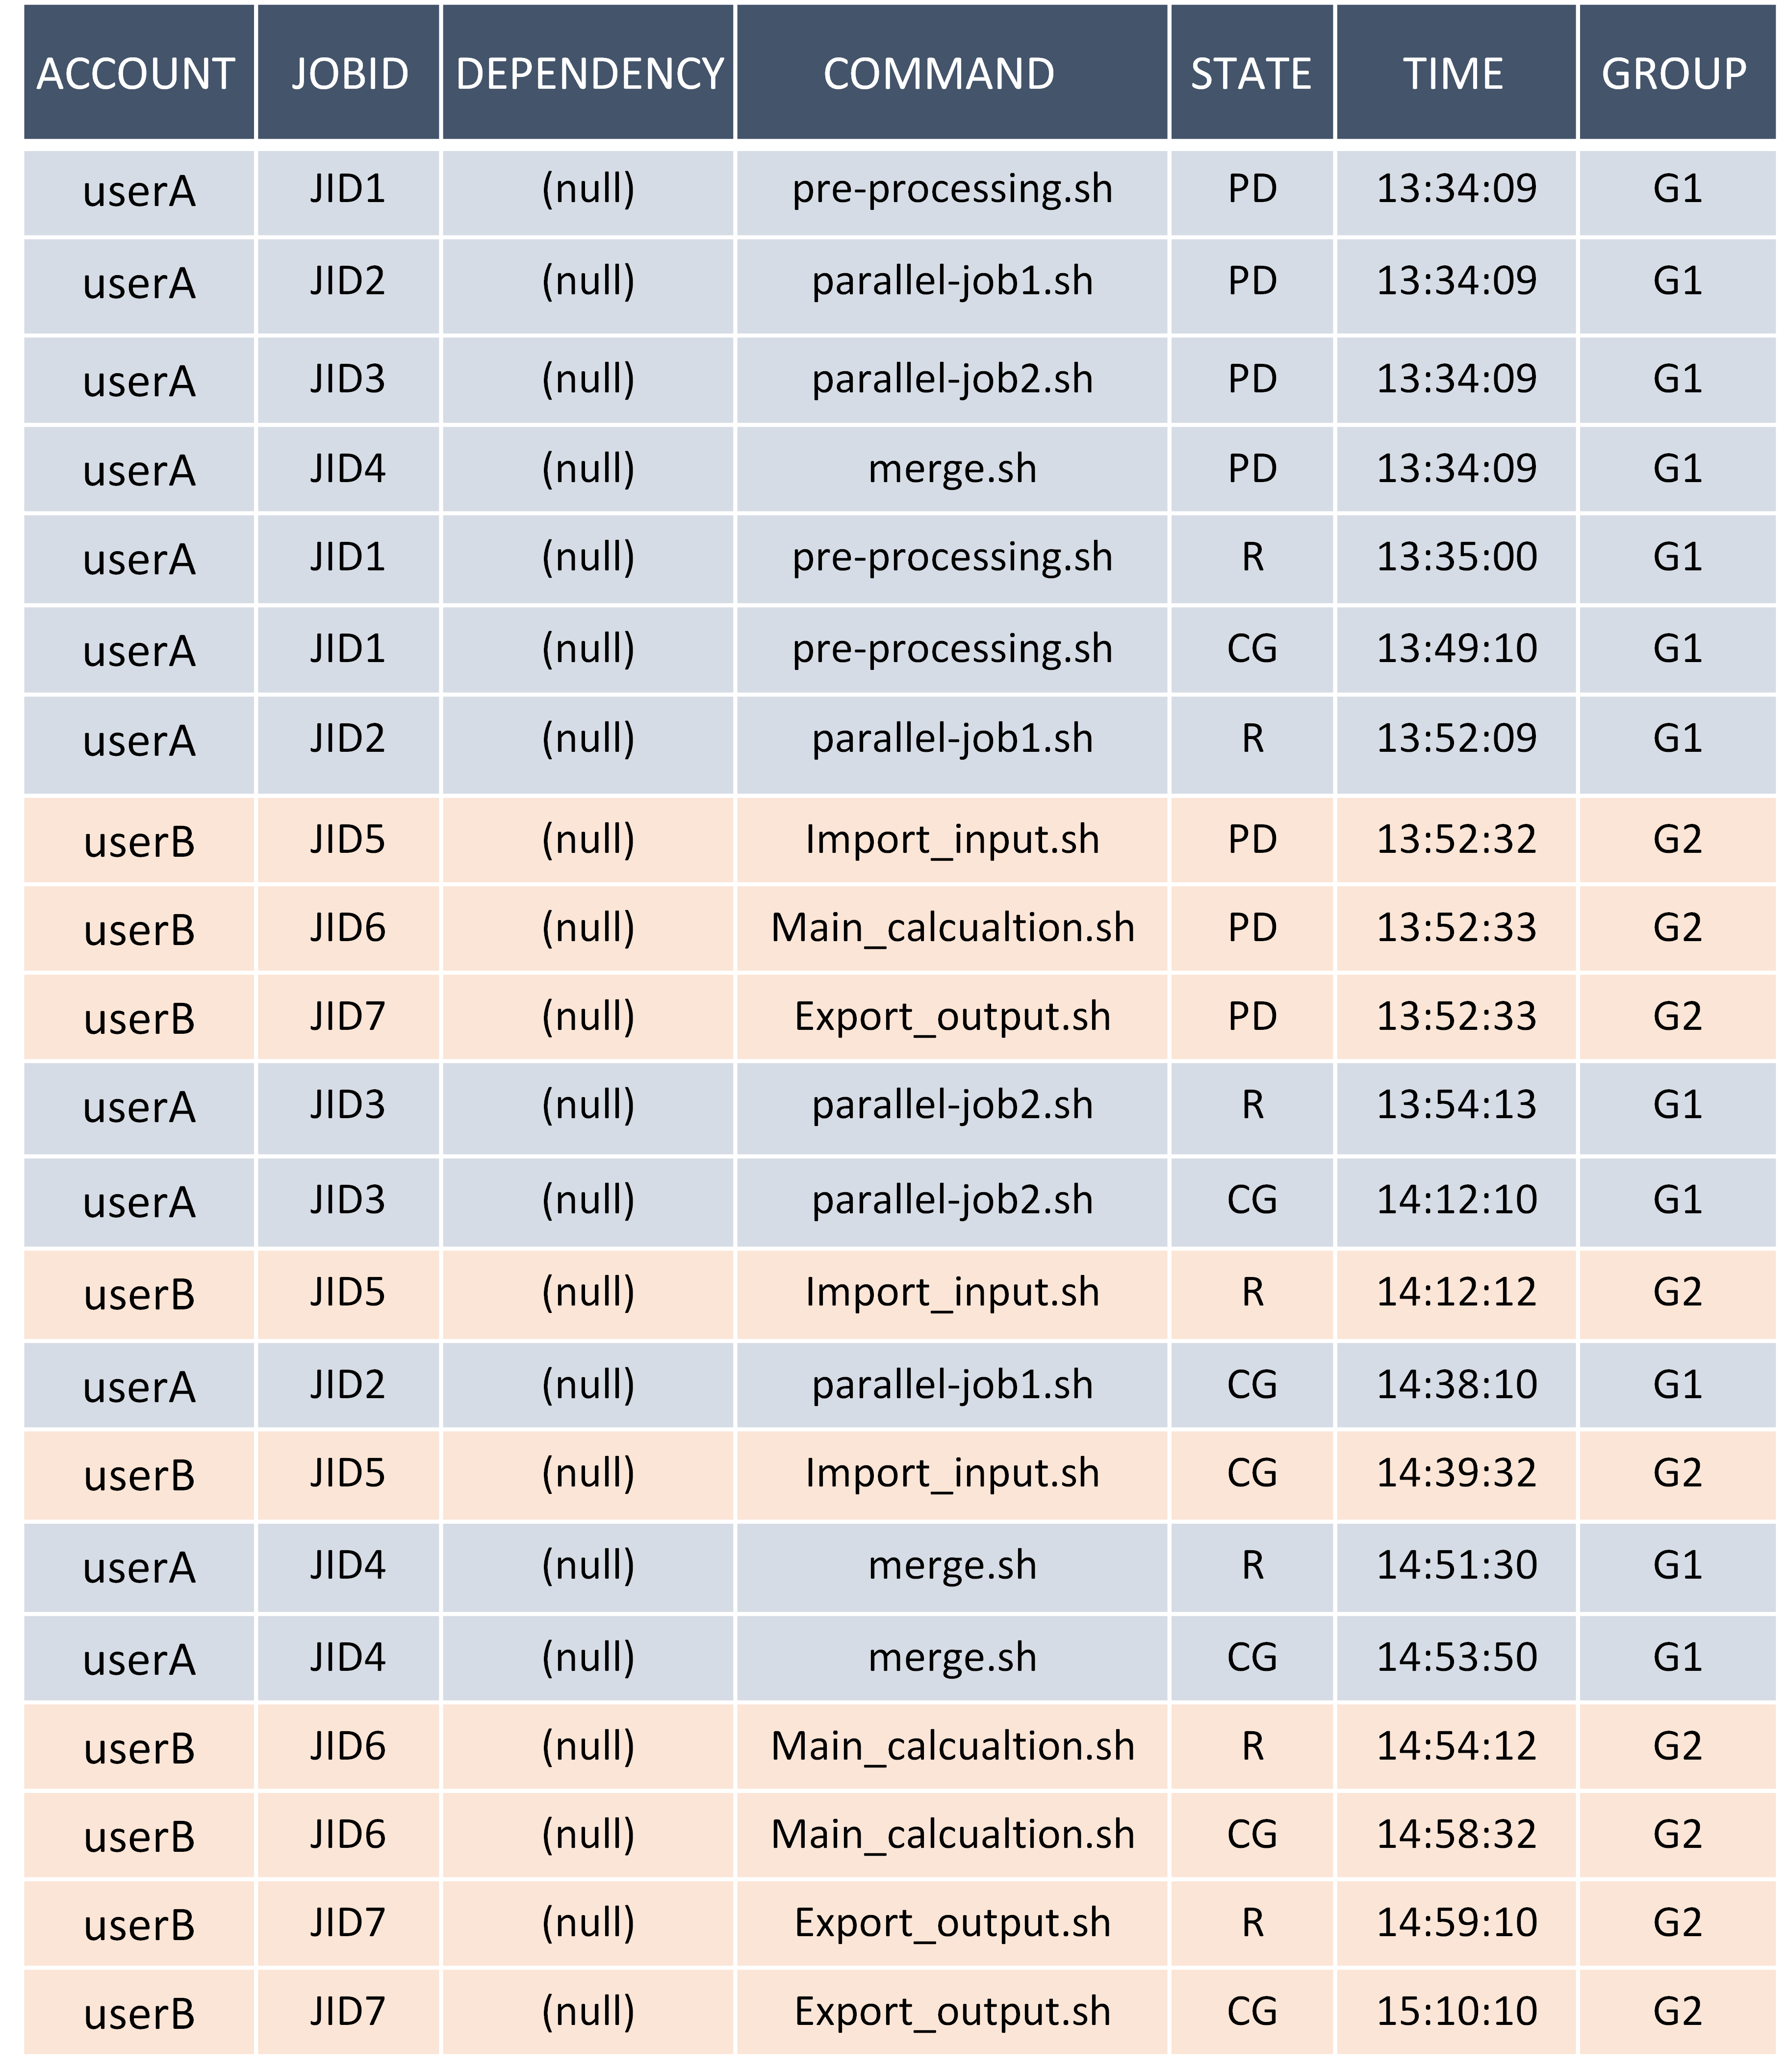
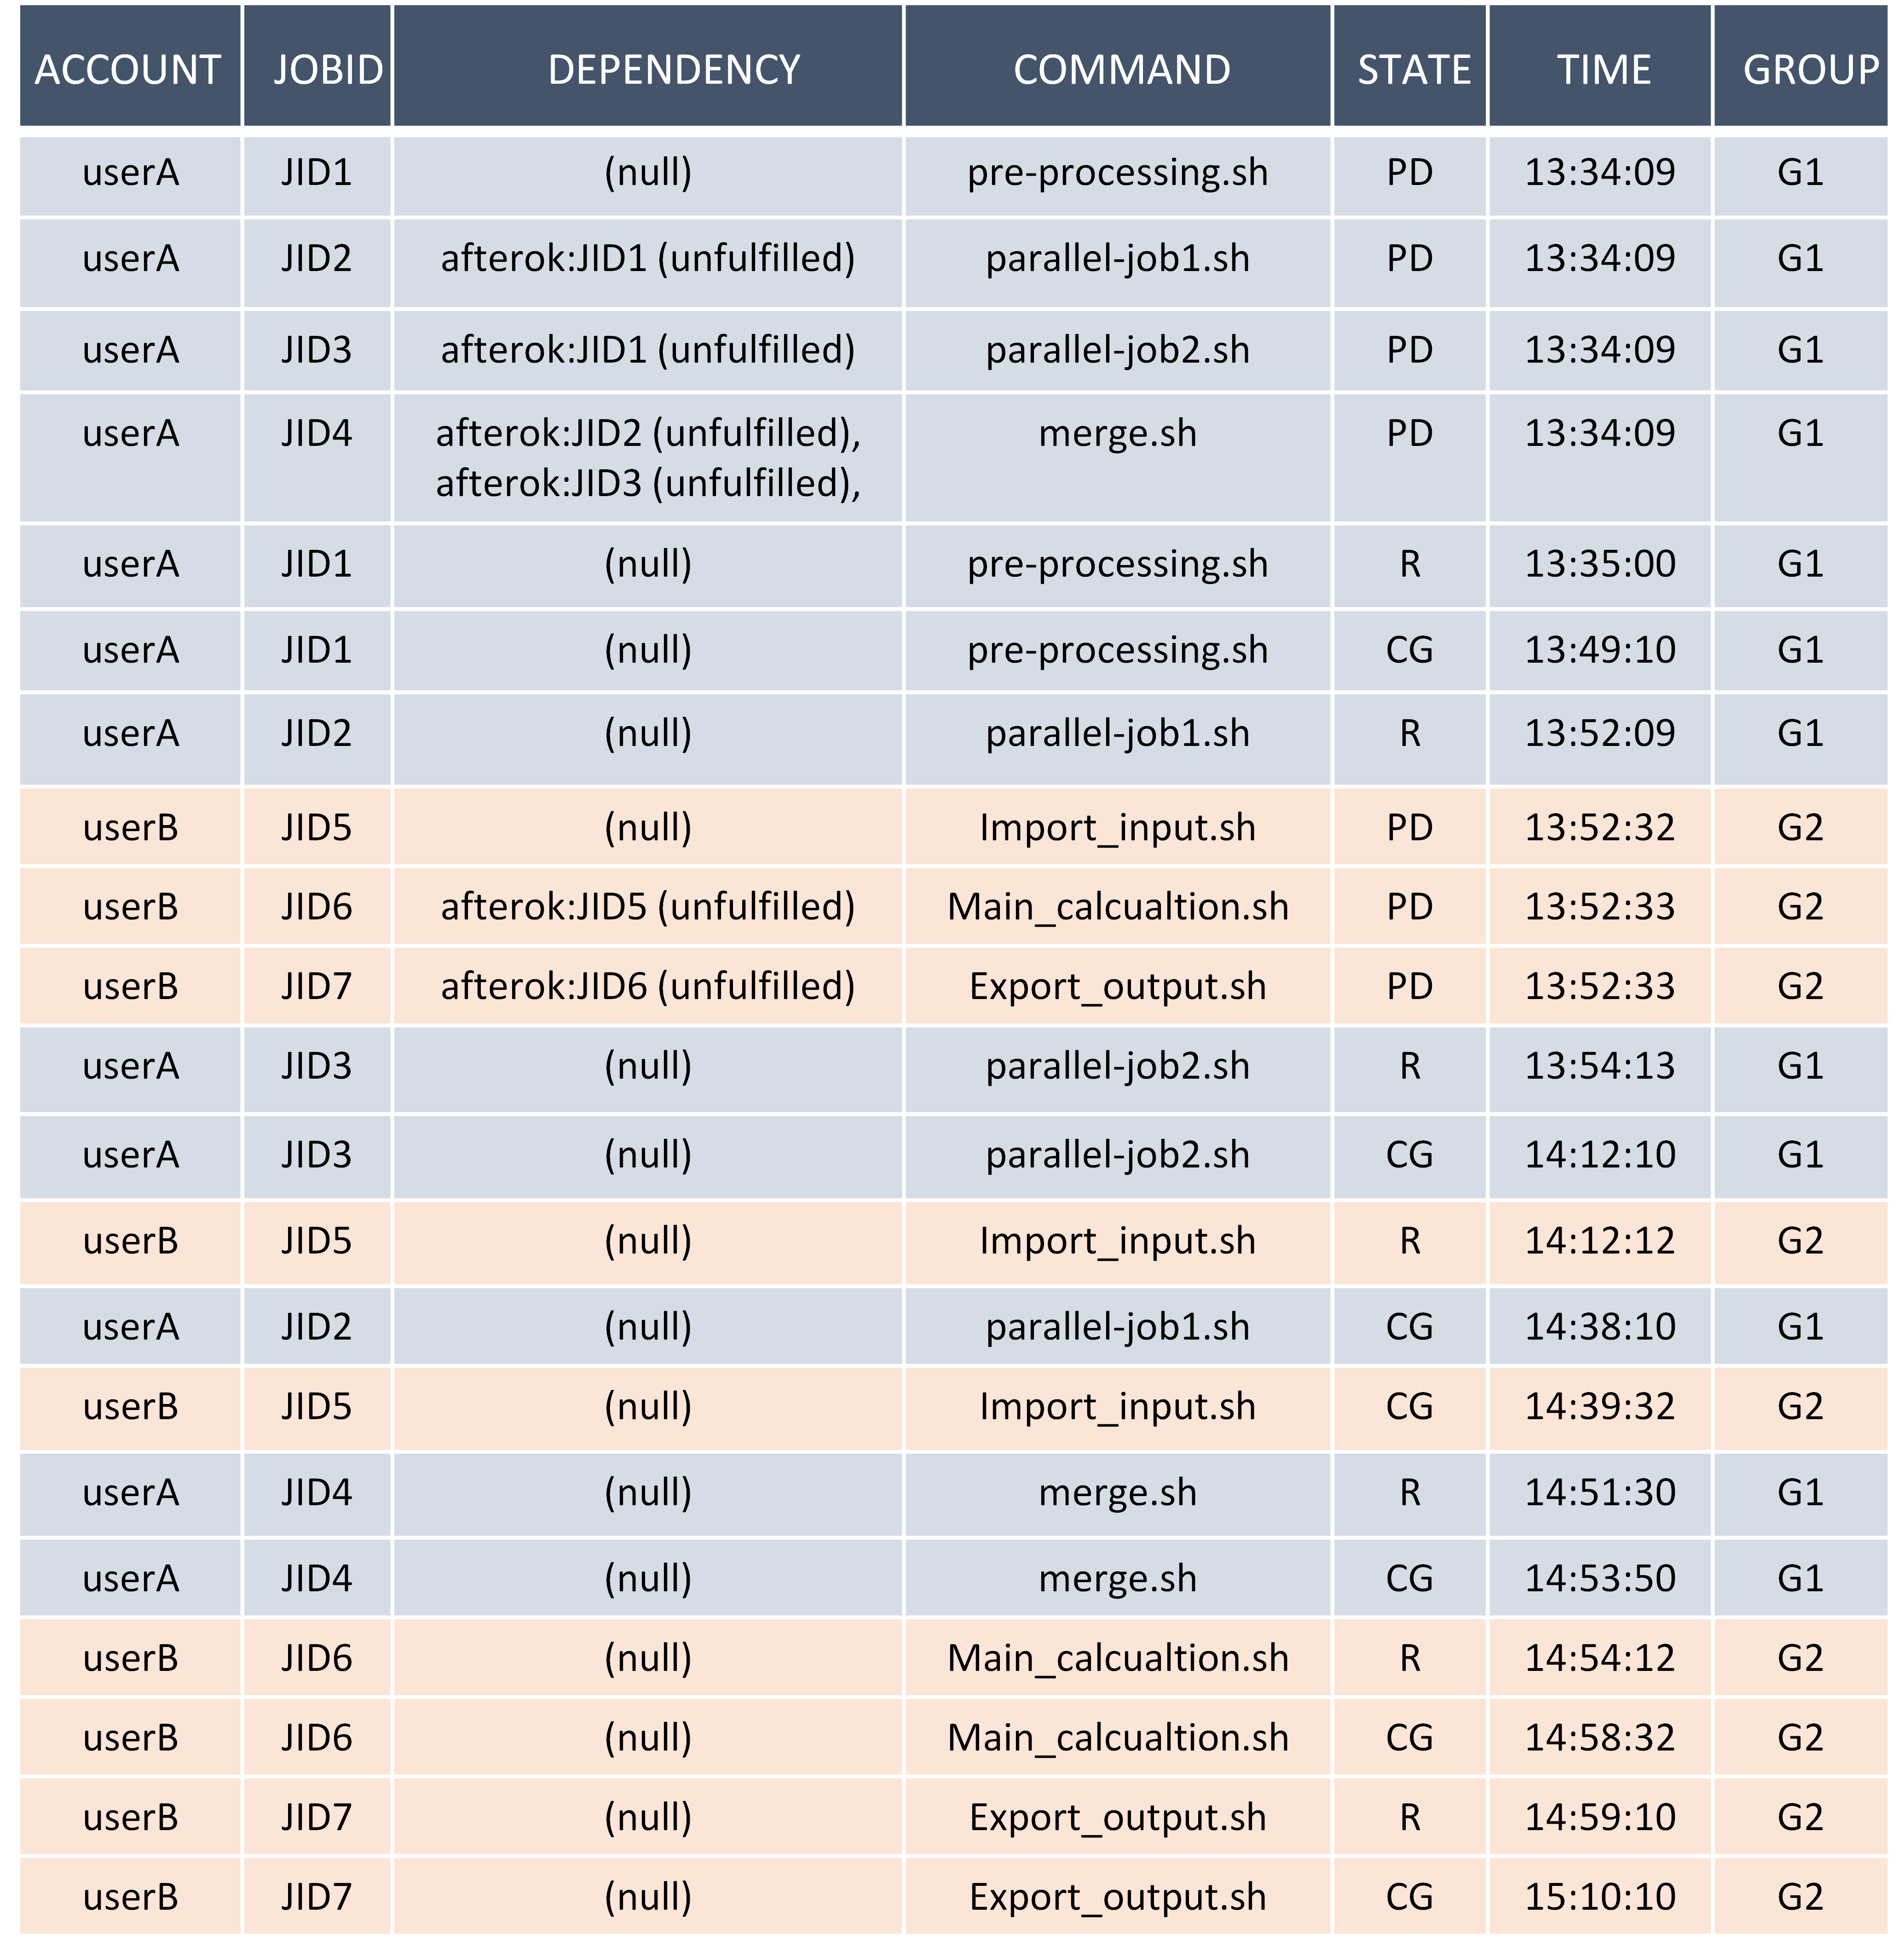
Fig. 6(a) shows the output of the squeue command where the user runs jobs manually, and where the DEPENDENCY column in the PENDING state has no values. Fig. 6(b) shows the output of the squeue command where the user has declared explicit interdependencies between jobs. As one may see, the DEPENDENCY column in the PENDING state has a non-empty value.
4 Approach
The input of most process mining algorithms is an event log, which contains at least a case, an activity, and a timestamp as attributes for each event. The majority of algorithms presume that the event data is fully accessible and has a clearly defined case notion.
However, we cannot assume that we know the complete historical log, because of privacy issues and the required administrative privileges on the target workflow system. Instead, we aim to observe it for a limited amount of time, avoiding the aforementioned issues, as described in Sec. 4.1.
Moreover, since the SLURM log does not contain any explicit case notion, in Sec. 4.2 we describe event correlation to assign a case to the different events and allow for process mining analyses.
4.1 Register SLURM events
In order to extract an event log from the system, we perform the following operations periodically (we refer to this as observing the system):
-
1.
Connect to the access node of the SLURM system
-
2.
Observe the status (e.g., PENDING, RUNNING, COMPLETING) of the current jobs using the squeue SLURM command.
-
3.
For each of the listed jobs (rows of the log file), one of the following situations occurs:
-
•
The JOBID is new: register an event related to the creation of the job.
-
•
The JOBID already exists, but the status has changed: register an event related to the status change.
-
•
The JOBID already exists, and the status has not changed: do nothing.
-
•
All the features mentioned in Table 1 are recorded for each job. Our log also has a TIMESTAMP column that marks the time of observation of the event, and the COMMAND values are mapped from the executed file path to the executed file name (filtering on the last part of the path).
4.2 Event Correlation
Let us now obtain case IDs from SLURM. We extract a case ID with different techniques, depending on whether the jobs were executed with or without explicit interdependencies.
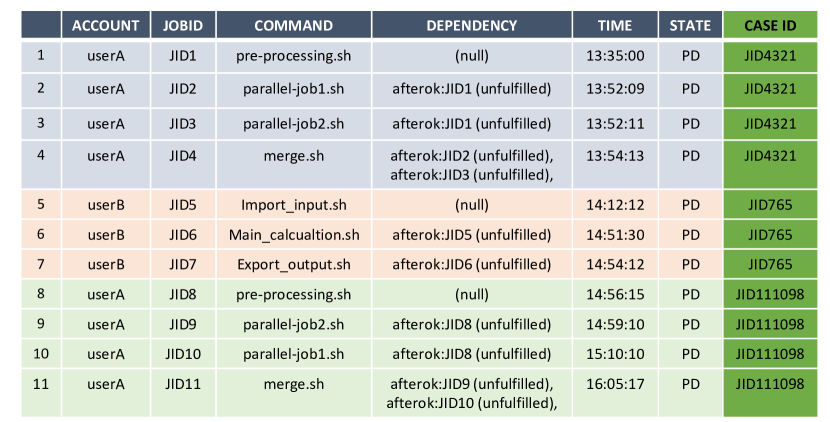
Case ID Extraction with Explicit Interdependencies: We utilize this technique when the user has specified the inter-dependencies among jobs. This declaration allows the inclusion of the DEPENDENCY column in the extracted log, indicating the jobs on which the current job depends. Note that the DEPENDENCY column for the job lists only the dependencies that have not been completed yet. Thus, the DEPENDENCY list would be naturally empty for a job that is in the RUNNING state.
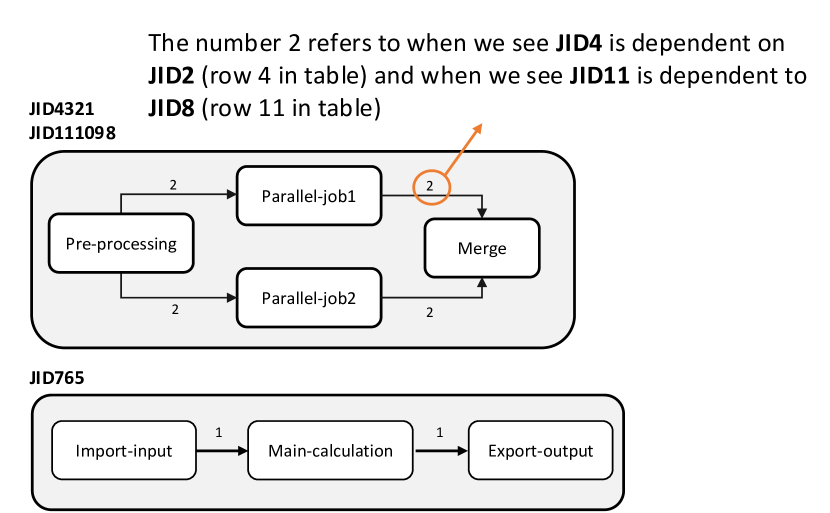
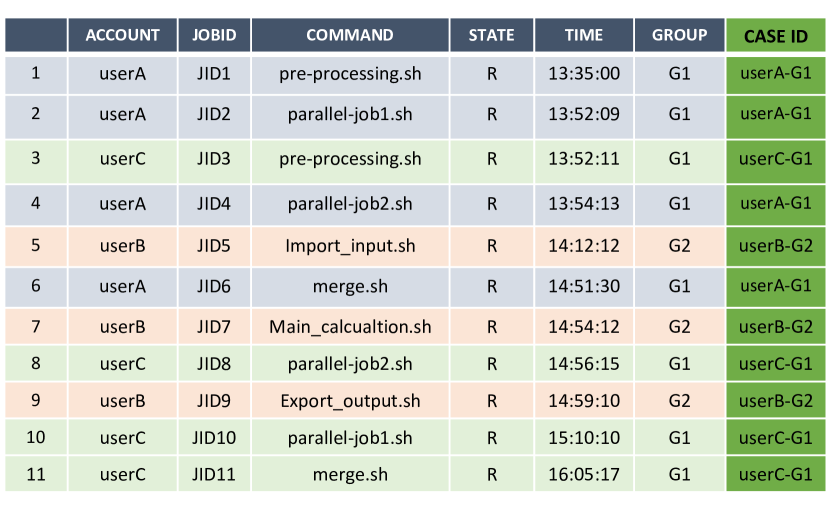
To implement this method, a Directed Acyclic Graph (DAG) is generated for each chain of connected jobs in PENDING state by utilizing the JOBID, and DEPENDENCY columns. The vertices are job IDs and the edges show dependent job IDs, and then a unique case ID will be assigned to all of the connected job IDs as shown in Fig. 7(a). As shown in the table of Fig. 7(a), JID2 and JID3 are dependent on JID1, and JID4 is dependent on JID2 and JID3. This connection is exploited to assign case ID JID4321 (Fig. 7(b), green column of Fig. 7(a)). Different cases will be assigned to different discovered connected components. For instance, JID111098 is assigned to another execution of the same chain of commands as JID4321.
Case ID Extraction without Explicit Interdependencies: In this case, we do not have explicitly defined job dependencies; therefore, we need to use the attributes at the event level to determine correlations and dependencies between the jobs. We use a combination of the following two attributes in order to define the case identifier:
-
•
The account executing the job: it is reported as ACCOUNT in SLURM.
-
•
The group of the given job: the project ID is intended to group the jobs belonging to the same project. The status should be empty or default if the user does not call the command with the project ID. The project ID is reported as GROUP in SLURM. So, whenever we execute the same scripts several times, the project ID is reported as the same GROUP in SLURM.
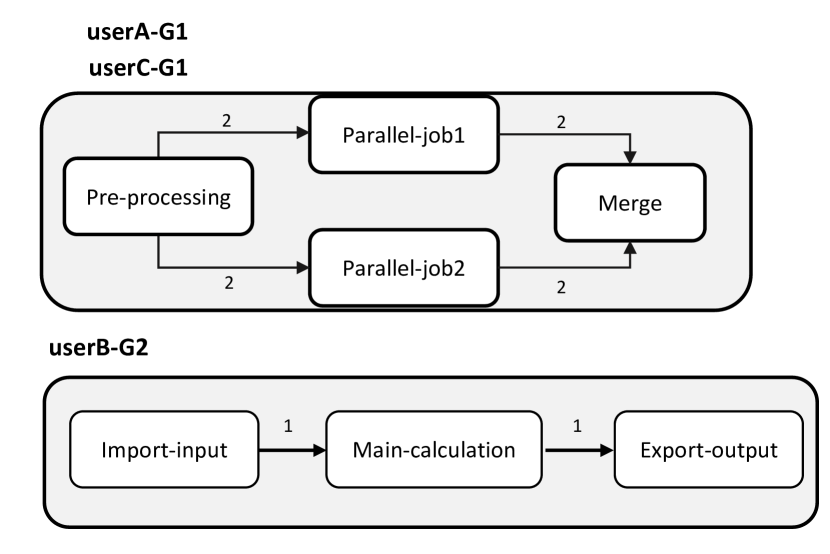
We have a many-to-many relationship between accounts and groups. All the jobs executed by an account under a given group are therefore related to the same project. We can use ACCOUNT-GROUP as case ID; in this case, we are certain that the jobs executed by the same user under the same project are all collected. In this technique, we generate a unique case ID per each unique combination of ACCOUNT and GROUP, as shown in Fig. 8(a). The parallel relationship between Parallel-job1 and Parallel-job2 has been discovered based on their occurrence in rows 2, 4 and 8, 10, which show they can be executed in any order.
In this method, we may consider only the account instead of considering the combination of group and account, but the advantage of considering also the group is that the control flow of different projects of the same account is not combined. This technique also has limitations, including adding loops for commands, because we do not have a way to recognize that two consecutive executions of the same command are related to different experiments. As a result, the precision is significantly reduced, because many different behaviors and command sequences are allowed by the resulting model.
5 Experiments
| Number of events | 81632 |
|---|---|
| Number of unique submitted jobs | 17997 |
| Number of accounts | 123 |
| Percentage of accounts who submitted jobs with explicit interdependencies | 0.06% |
| Percentage of jobs defined with explicit interdependencies | 0.02% |
| Average number of allocated CPUs per job | 13.71 |
| Average amount of allocated RAM per job | 5G |
The HPC Monitoring Cockpit was applied to the SLURM system of the RWTH Aachen University repeatedly, and an event log was obtained111RWTH HPC cluster: https://help.itc.rwth-aachen.de/service/rhr4fjjutttf/. A sample event log can be downloaded at the address https://www.ocpm.info/hpc˙log.csv.. Some statistics about the considered event log are contained in Table 2.
As the different accounts belong to different research areas (including physics, chemistry, biology, and computer science) and executed purpose-specific scripts, we could not produce models containing the flow of execution for all the accounts. Instead, we focus on the process models that we can extract for a single account. These process models show the scientific workflows executed by a single user/research group. Moreover, the process model is annotated with performance information on the arcs, allowing for the detection of paths with high execution time (bottlenecks), and therefore fulfilling the second goal of finding root causes of performance problems.
To highlight different execution paradigms, we focus on two accounts:
-
•
jara0180: contains computations performed on a funded research project (Molecular dynamics simulations of P2X receptors).
-
•
thes1331: contains scientific experiments performed for an MSc thesis.
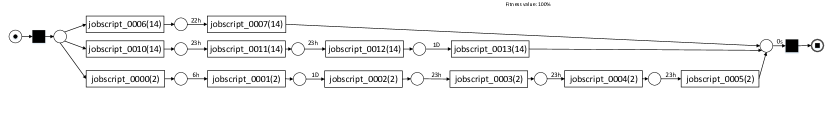

The executions carried out by jara0180 take advantage of explicit interdependencies (since HPC expertise is involved). Therefore, for jara0180 we were able to develop a meaningful process model, as depicted in Fig. 9(a). In this figure, we observe two distinct chains of commands. The first chain comprises commands from jobscript_0000 to jobscript_0005 , while the second chain includes the remaining commands related to two different projects and corresponding to 30 distinct cases in the event log. We could still obtain a model from the data (contained in Fig. 9(b)) without considering these interdependencies (considering the ACCOUNT and GROUP values lead to two distinct cases). However, this model is less precise because it relies solely on the temporal order of command execution, where every event belongs to the same case in the event log.
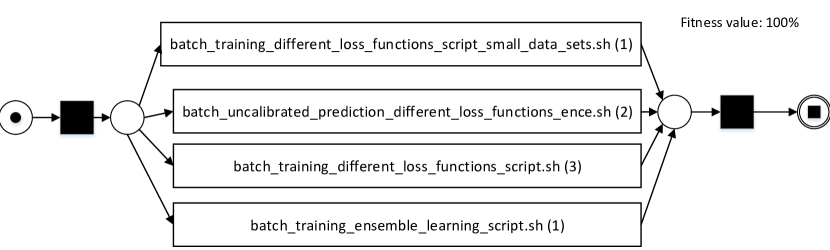
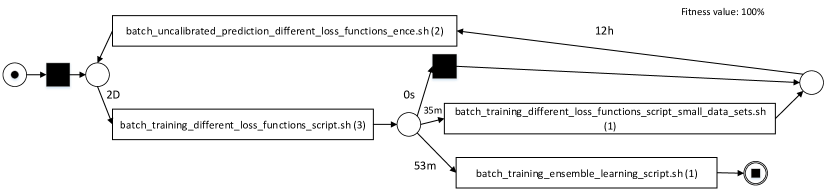
The executions performed by thes1331 are defined without explicit interdependencies. The case extraction approach, relying on explicit interdependencies, leads to the assignment of a unique case ID to each execution (seven distinct cases). Consequently, the model depicted in Fig. 10(a) exhibits concurrency among all the executed commands, rendering it highly imprecise. For thes1331, it is more appropriate to focus on the models discovered without considering the explicit interdependencies (contained in Fig. 10(b)), which shows the temporal order of execution of the commands.
The discovered models provide valuable insights to users by visualizing the control flow and execution frequency, enabling them to identify bottlenecks and make informed decisions for further improvements. Based on Table 2, a mere fraction of HPC users submits their jobs on HPC clusters with explicit interdependencies. Such interdependencies are crucial for identifying connected jobs. Without them, the resulting models are imprecise due to the following scenarios: either every event belongs to a different case, or every event belongs to the same case.
6 Conclusion
In this paper, we propose an approach to extract and analyze process mining event logs of an HPC system (in particular, we focus on the SLURM system). While this is not the first application of process mining to HPC systems, existing techniques assume the case notion to be well-defined in the data source. This assumption is not satisfied by mainstream systems, and we propose two different case notions (using and not using explicit interdependencies). Moreover, we propose the HPC Monitoring Cockpit as a tool to connect to the HPC system, extract an event log, and perform a process mining analysis. The analyses allow us to document the execution of scientific workflows for different accounts or research groups utilizing process models that are annotated with performance information (allowing us to detect bottlenecks). Therefore, we can respond to our initial research questions by using process mining techniques.
Our event logs are extracted from information that is publicly available in the SLURM system (including the command that is executed and the requested environment, i.e., the number of CPUs, RAM, and disk space required). However, we do not know the detailed content of the commands or have access to more advanced profiling options. This would require collaboration with the specific research groups operating in the HPC systems and availability to modify the execution of scientific workflows to accommodate more detailed process mining analyses.
Our process mining analyses rely on a single account or research groups. Since the naming schema of the commands is quite arbitrary, we could not identify shared logical steps (e.g., pre-processing, training of ML model, testing of the model) between different accounts; therefore, we could not produce a generic process model. This is indeed a limitation that could not be tackled without properly naming the commands executed on SLURM and without having insights about the commands.
Overall, our approach succeeds in extracting an event log for process mining purposes from the SLURM HPC system, and we can respond to our basic analytical goals. However, given the arbitrary execution styles and naming conventions, we could not produce more general analyses, which remain as a goal for future work.
References
- [1] van der Aalst, W.M.P., Carmona, J. (eds.): Process Mining Handbook, Lecture Notes in Business Information Processing, vol. 448. Springer (2022). https://doi.org/10.1007/978-3-031-08848-3
- [2] Deelman, E., Gannon, D., Shields, M.S., Taylor, I.J.: Workflows and e-science: An overview of workflow system features and capabilities. Future Gener. Comput. Syst. 25(5), 528–540 (2009). https://doi.org/10.1016/j.future.2008.06.012
- [3] Dietrich, R., Winkler, F., Knüpfer, A., Nagel, W.E.: PIKA: center-wide and job-aware cluster monitoring. In: IEEE International Conference on Cluster Computing, CLUSTER 2020, Kobe, Japan, September 14-17, 2020. pp. 424–432. IEEE (2020). https://doi.org/10.1109/CLUSTER49012.2020.00061
- [4] Kunz, P.: HPC Job-Monitoring with SLURM, Prometheus, and Grafana (2022)
- [5] Liu, J., Pacitti, E., Valduriez, P., Mattoso, M.: A survey of data-intensive scientific workflow management. J. Grid Comput. 13(4), 457–493 (2015). https://doi.org/10.1007/s10723-015-9329-8
- [6] Pal, A., Malakar, P.: MAP: A visual analytics system for job monitoring and analysis. In: IEEE International Conference on Cluster Computing, CLUSTER 2020, Kobe, Japan, September 14-17, 2020. pp. 442–448. IEEE (2020). https://doi.org/10.1109/CLUSTER49012.2020.00063
- [7] Röhl, T., Eitzinger, J., Hager, G., Wellein, G.: LIKWID monitoring stack: A flexible framework enabling job specific performance monitoring for the masses. In: 2017 IEEE International Conference on Cluster Computing, CLUSTER 2017, Honolulu, HI, USA, September 5-8, 2017. pp. 781–784. IEEE Computer Society (2017). https://doi.org/10.1109/CLUSTER.2017.115
- [8] Song, W., Chen, F., Jacobsen, H., Xia, X., Ye, C., Ma, X.: Scientific workflow mining in clouds. IEEE Trans. Parallel Distributed Syst. 28(10), 2979–2992 (2017). https://doi.org/10.1109/TPDS.2017.2696942
- [9] Yoo, A.B., Jette, M.A., Grondona, M.: SLURM: simple linux utility for resource management. In: Job Scheduling Strategies for Parallel Processing, 9th International Workshop, JSSPP 2003, Seattle, WA, USA, June 24, 2003, Revised Papers. Lecture Notes in Computer Science, vol. 2862, pp. 44–60. Springer (2003). https://doi.org/10.1007/10968987_3
- [10] Zeng, R., He, X., van der Aalst, W.M.P.: A method to mine workflows from provenance for assisting scientific workflow composition. In: World Congress on Services, SERVICES 2011, Washington, DC, USA, July 4-9, 2011. pp. 169–175. IEEE Computer Society (2011). https://doi.org/10.1109/SERVICES.2011.55
- [11] Zeng, R., He, X., Li, J., Liu, Z., van der Aalst, W.M.P.: A method to build and analyze scientific workflows from provenance through process mining. In: 3rd Workshop on the Theory and Practice of Provenance, TaPP’11, Heraklion, Crete, Greece, June 20-21, 2011. USENIX Association (2011), https://www.usenix.org/conference/tapp11/method-build-and-analyze-scientific-workflows-provenance-through-process-mining