Early-time Spectropolarimetry of the Aspherical Type II Supernova SN 2023ixf
Abstract
We present six epochs of optical spectropolarimetry of the Type II supernova (SN) 2023ixf ranging from to 15 days after the explosion. Polarimetry was obtained with the Kast double spectrograph on the Shane 3 m telescope at Lick Observatory, representing the earliest such observations ever captured for an SN. We observe a high continuum polarization % on days +1.4 and +2.5 before dropping to 0.5% on day +3.5, persisting at that level up to day +14.5. Remarkably, this change coincides temporally with the disappearance of highly ionized “flash” features. The decrease of the continuum polarization is accompanied by a rotation of the polarization position angle () as seen across the continuum. The early evolution of the polarization may indicate different geometric configurations of the electron-scattering atmosphere as seen before and after the disappearance of the emission lines associated with highly-ionized species (e.g., He II, C IV, N III), which are likely produced by elevated mass loss shortly prior to the SN explosion. We interpret the rapid change of polarization and from days +2.5 to +4.5 as the time when the SN ejecta emerge from the dense asymmetric circumstellar material (CSM). The temporal evolution of the continuum polarization and the is consistent with an aspherical SN explosion that exhibits a distinct geometry compared to the CSM. The rapid follow-up spectropolarimetry of SN 2023ixf during the shock ionization phase reveals an exceptionally asymmetric mass-loss process leading up to the explosion.
fixltx2e
,
1 Introduction
The core collapse of a red supergiant (RSG) with a zero-age main sequence (ZAMS) mass of at least 8 is halted by the newly formed neutron star. The infalling material bounces off the neutron star, generating a shock () that eventually advances through the opaque stellar envelope. The shock dissipates due to radiative losses when the optical depth drops below . When the radiation from the shock breaks out close to the surface of the star, it produces a bright X-ray/ultraviolet (UV) flash that lasts minutes to hours depending on the size of the exploding progenitor (Waxman & Katz, 2017). Subsequently, the stellar envelope expands and cools, generating UV/optical emission on a longer timescale of a few days. The shock may also interact with circumstellar material (CSM) shed by the progenitor through mass-loss processes in the years leading up to the explosion.
The high-energy radiation ionizes various species in the CSM (e.g., He II, C III, C IV, N III, N IV) which recombine to form narrow emission lines. When discussing “flash” features, we are referring to the emission lines formed as a result of interaction between the shock and the CSM (shock ionization). This is not to be confused with the flash-ionization features produced in the CSM by the breakout X-ray/UV flash, which recombine on a timescale of hours. Emission lines that persist beyond a few hours thus demand a long-lived source of ionizing photons that can be supplied by the interaction of the shock with dense CSM. Such emission lines that are produced as a result of ejecta-CSM interaction are a superposition of a km s-1 P Cygni profile and a broadened wing produced by electron scattering, which has a typical width of km s-1 (see, e.g., Fransson et al., 2014; Yaron et al., 2017.) The resulting emission is visible until the expanding ejecta sweep up the pre-existing CSM. The complete disappearance of the narrow emission lines generally within several days is observed in some explosions with RSG progenitors, thus implying that the CSM is confined to cm (Yaron et al., 2017).
Spectropolarimetry, which measures the polarized flux at various wavelengths, is a remarkably effective tool for assessing the geometric properties of the SN ejecta and its CSM without spatially resolving the source. In addition, the polarization measured across prominent spectral lines can help characterize the distribution of individual elements within the ejecta. Comprehensive reviews of polarimetric studies of SNe have been provided by Wang & Wheeler (2008), Branch & Wheeler (2017), and Patat (2017). The fundamental principle of this method is straightforward. Polarized photons are produced via Thomson scattering in SN atmospheres, with the electric field of the scattered photon perpendicular to the plane of scattering. Any deviation from spherical symmetry would result in an incomplete cancellation of the electric-field vectors. Because the SN is observed as a point source and the light reaching a detector is an integration of all the electric-field vectors, any asymmetries would yield a net polarization greater than zero. Therefore, polarimetry can provide critical information about the geometric configuration shortly after the SN explosion.
The ability to acquire and analyze the earliest spectra of core-collapse supernovae (CCSNe) has become feasible thanks to the alert stream of transients provided by contemporary wide-field sky surveys that operate on a nightly cadence, such as the Zwicky Transient Facility (ZTF; Bellm et al., 2019). At these early stages, conventional photometry and spectroscopy offers only limited insights into the structures of the ejecta and their interaction with the CSM, projecting and smearing the geometry into a single dimension of radial velocity.
The central portion of the emission profiles of the highly-ionized “flash” features is primarily shaped by recombination photons from the CSM. As a result, it typically exhibits a width km s-1, reflective of the velocity of the CSM. Consequently, the narrow core of the feature remains essentially unpolarized as the emission lines from recombination form typically above the electron-scattering photosphere.
On the other hand, the wings of the “flash” emission features, which originate from electron scattering within the highly ionized CSM and are represented by a symmetric Lorentzian profile (Chugai, 2001; Chugai et al., 2004; Huang & Chevalier, 2018), can produce polarization if the CSM distribution deviates from spherical symmetry. Consequently, the degree of polarization (%) and the across the electron-scattering wings can help map out the geometric distributions of the associated elements in the CSM. A comparison of the polarization spectrum over the continuum and such “flash” features also serves to evaluate whether the axially symmetric explosion of the progenitor and its pre-explosion mass-loss process align along a similar symmetry axis.
Over the past few decades, polarimetric measurements have suggested that the core collapse of massive stars is generally aspherical. However, SNe with an optically thick H-rich envelope were observed to have relatively low polarization ( %) during the phase of hydrogen recombination, suggesting the presence of an almost spherical H-rich envelope (Wang & Wheeler, 2008). The light curve of the SN remains on a “plateau” that typically lasts a few months after the explosion, as the hydrogen recombination becomes the dominant emission source.
For example, time-series polarimetry of the Type IIP SN 2004dj showed negligible continuum polarization (%) during its plateau phase, followed by a rapid increase to % when the outer H-rich envelope recombined and the inner aspherical helium core was revealed (Leonard et al., 2006). This physical picture of an aspherical explosion surrounded by a spherical hydrogen envelope has become ubiquitous among many other SNe II (see, e.g., Leonard & Filippenko, 2001; Chornock et al., 2010; Nagao et al., 2019; Dessart et al., 2021).
However, recent studies have also identified a % continuum polarization intrinsic to the Type IIP/IIL SN 2013ej (Mauerhan et al., 2017; Nagao et al., 2021) and Type IIP SN 2021yja (Vasylyev et al., 2023) from as early as –3 weeks after the explosion. The polarization spectra of SN 2021yja follow a dominant axis as displayed on the Stokes plane, indicative of a well-defined axial symmetry starting from the outer layer of its hydrogen envelope and in contrast to the previous low early continuum polarization of H-rich SNe. Such a high degree of large-scale asphericity during the early phase of the explosion is likely induced by an interaction process preserving a well-defined symmetry axis, potentially involving a binary companion or a significant concentration of CSM in the equatorial plane (Vasylyev et al., 2023).
SN 2023ixf was discovered on 2023-05-19 17:27 (UTC dates are used throughout this paper) / MJD 60083.73 in the spiral galaxy Messier 101 at a clear-band magnitude of 14.9 (Itagaki, 2023). A prediscovery clear-band detection about 11.4 hr earlier at mag was reported by Filippenko et al. (2023). The earliest detection of the SN was MJD (Mao et al., 2023) at mag 17.7. The time of the first light is estimated to be MJD 60082.75 (Hosseinzadeh et al., 2023), which will be used throughout this paper. A classification spectrum obtained at 2023-05-19 22:23 / MJD 60083.93 contains a series of emission lines of H, He, C, and N (Perley et al., 2023), centering at zero velocity relative to the reported redshift of its host galaxy (Riess et al., 2022). These prominent emission features, superimposed on a blue continuum, are characteristic of SNe II observed within mere hours to a few days following the explosion (Perley et al., 2023). Several works have constrained the progenitor to be a RSG, with evidence of periodic pre-explosion variability (Kilpatrick et al., 2023; Jencson et al., 2023; Soraisam et al., 2023). Throughout our analysis, all spectra have been corrected to the rest frame.
This paper is organized as follows. In Section 2, we summarize our spectropolarimetric observations of SN 2023ixf and discuss systematic errors associated with instrumentation and contamination from interstellar polarization. Section 3 describes the temporal evolution of the polarization degree and polarization position angle. A qualitative discussion of the major spectropolarimetric properties of SN 2023ixf and an interpreted geometry of the SN ejecta and the CSM is presented in Section 4. We summarize our results in Section 5.
2 Spectropolarimetric Observations and Data Reduction
SN 2023ixf was observed using the Kast double spectrograph on the Shane 3 m reflector at Lick Observatory (Miller et al., 1988; Miller & Stone, 1994). A dense spectropolarimetric sequence was obtained, consisting of six epochs of observations that spanned from +1.4 to +14.5 days after the explosion. To our knowledge, the first epoch is the earliest spectropolarimetry of any known SN to date.
Observations and data reduction were carried out following the description provided by Patra et al. (2021). Telluric lines were removed through comparison with the flux spectrum of the standard-star BD +262606 (Oke & Gunn, 1983). The 300 line mm-1 grating, a GG455 order-blocking filter, and the 3′′-wide slit were adopted, resulting in a spectral resolving power of , corresponding to the size of a resolution element of 18 Å at a central wavelength of 6800 Å. A log of spectropolarimetric observations is presented in Table 2.
In order to characterize the instrumental polarization, nightly observations of the low-polarization standard star HD 212311 were carried out with the same polarimetry optics used to observe SN 2023ixf. Following the expression adopted by Patra et al. (2022), the average of the intensity-normalized Stokes parameters derived for the unpolarized standard are minimal (%, %), thus confirming the negligible instrumental polarization and high stability of the Kast spectropolarimeter. The typical systematic uncertainties expected from the instrument and the reduction procedure are % (Leonard et al., 2001). We carried out a sanity check by comparing repeated observations of SN 2023ixf within a single night. Our findings suggest that these systematic uncertainties are accurately characterized by and , within the continuum wavelength range of 5600–6400 Å. These systematic errors are well above the statistical uncertainties calculated for the stokes parameters. A detailed discussion of the systematic effects expected from the Kast spectropolarimeter can be found in the Appendix of Leonard et al. (2001).
3 Results of Spectropolarimetry Observations
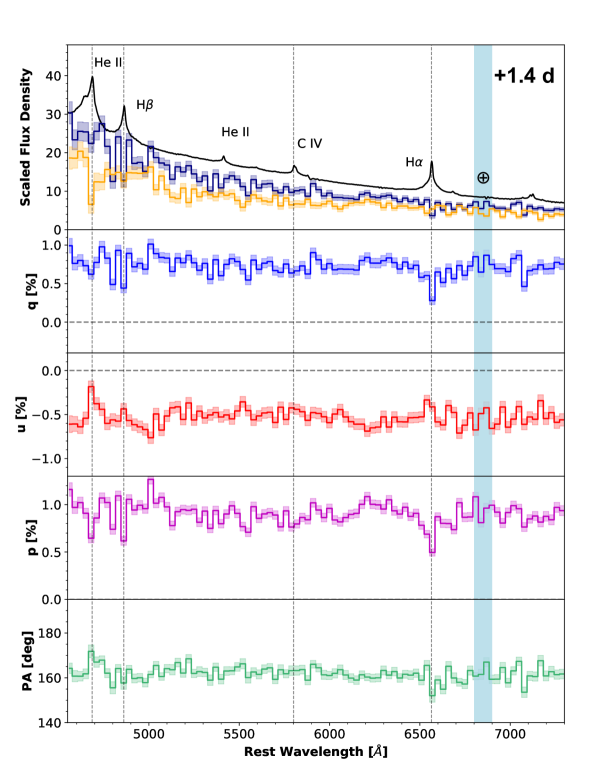
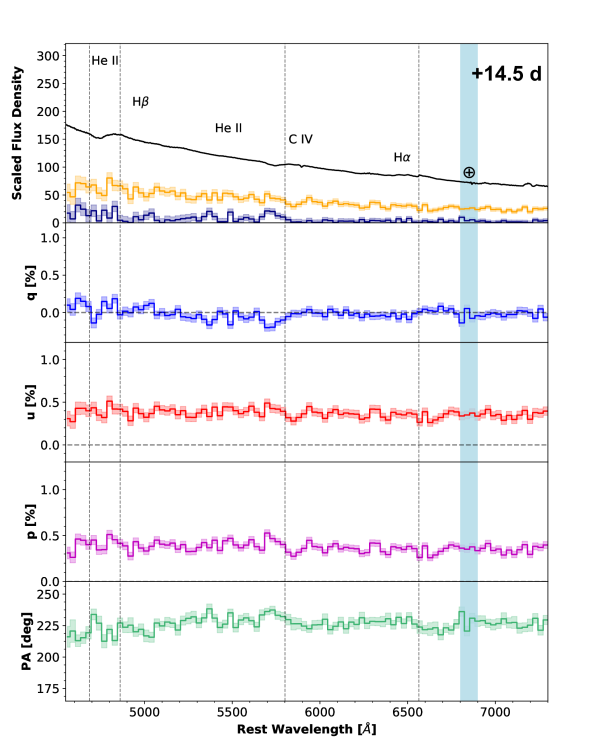
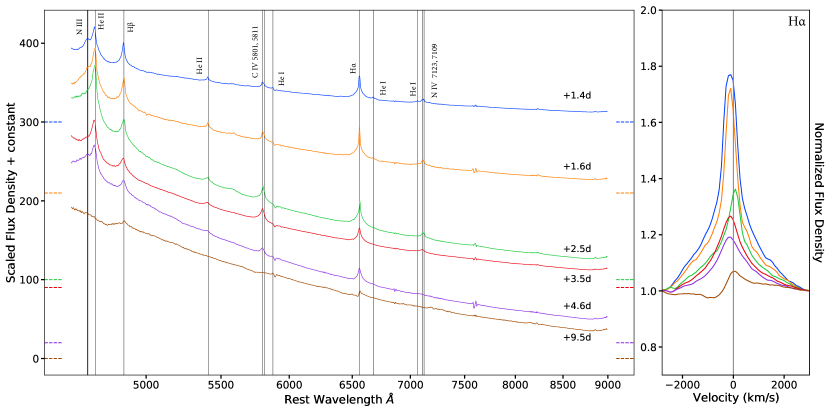
The flux-density spectrum of SN 2023ixf at day +1.4 was derived from an average of two sets of Stokes parameters, acquired from two spectropolarimetric observations at MJD 60084.20 and 60084.39. The polarization measurements for both epochs were found to be consistent within the systematic errors and thus were combined in our discussion. As indicated in Figure 2, the spectrum showcases a sequence of narrow emission lines superimposed on a blue continuum. These include the Balmer lines, He II 4686, 5411; C IV 5801, 5812; N III 4634, 4641, 4687; N IV 4068, 7115; and He I 5876, 6678. The spectral signatures are comparable to those in the earliest classification spectrum obtained 6 hr earlier at MJD 60083.93 (Perley et al., 2023).
Additionally, the total-flux spectrum obtained from the second set of spectropolarimetry at MJD 60084.39 also shows a significantly decreased strength in the N III 4634, 4641 profile, along with an apparent weakening of the Balmer lines. A more detailed discussion of the spectral evolution on an hourly timescale within the first two days after the SN explosion, as the SN ejecta sweep through the pre-existing CSM, will be presented in a separate paper (Zimmerman et al., in prep.).
3.1 Interstellar Polarization
The intrinsic polarization of the SN 2023ixf explosion could be contaminated by the polarization induced by interstellar aspherical dust grains along the SN-Earth line of sight. This interstellar polarization (ISP) is produced by the dichroic extinction caused by paramagnetic dust grains that have been partially aligned by a large-scale magnetic field (see Davis & Greenstein, 1951). The total host-galaxy reddening, , to SN 2023ixf is expected to be low given the high Galactic latitude () and favorable location of the SN in its face-on host. The Galactic and the host-galaxy reddening of SN 2023ixf can be estimated as mag based on the extinction map given by Schlafly & Finkbeiner (2011), and mag as derived from the equivalent width of the Na I D absorption lines at the redshift of the host galaxy (Smith et al., 2023), respectively. Adopting an extinction law (Cardelli et al., 1989), we set an empirical upper limit for the ISP caused by dust along the SN-Earth line of sight, (Serkowski et al., 1975). The maximum possible ISP, %, is substantially smaller than the observed polarization at all times. Therefore, in the subsequent discussion, we do not include any ISP correction.
3.2 Temporal Evolution of the Continuum Polarization
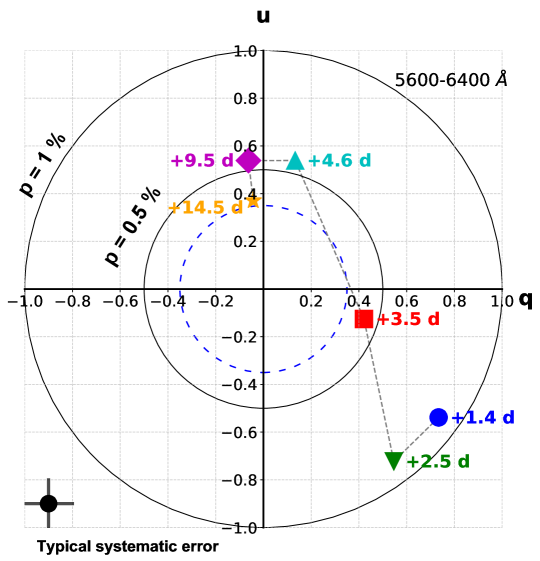
In Figure 3, we illustrate the evolution of the continuum polarization of SN 2023ixf from days +1.4 to +14.5 in the Stokes plane. For each epoch, we compute the error-weighted mean Stokes parameters within the wavelength range 5600–6400 Å, a region free of prominent spectral lines. In order to facilitate easier comparison with any future work, we confirm that the continuum polarization measured across 6900–7200 Å agrees with the aforementioned range within the systematic uncertainties. The continuum polarization is also measured across the wavelength range 6700–8400 Å as a consistency check. The continuum polarization measured across both 5600-6400 and 6700–8400 Å also agree within the systematic uncertainties.
| Phaseb | c | |||
|---|---|---|---|---|
| (days) | (%) | (deg) | ||
| 1.4 | 0.73 | 0.91 | 162(3) | |
| 2.5 | 0.55 | 0.91 | 153(3) | |
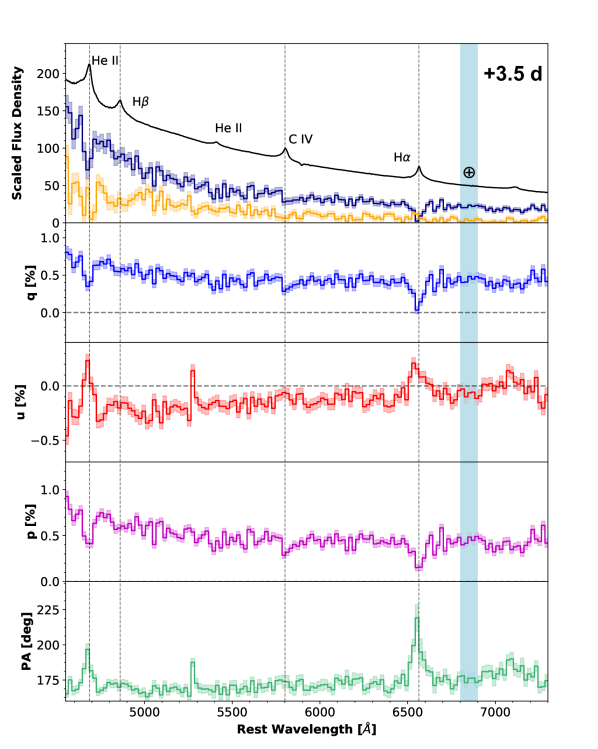
| 3.5 | 0.42 | 0.43 | 172(7) | |
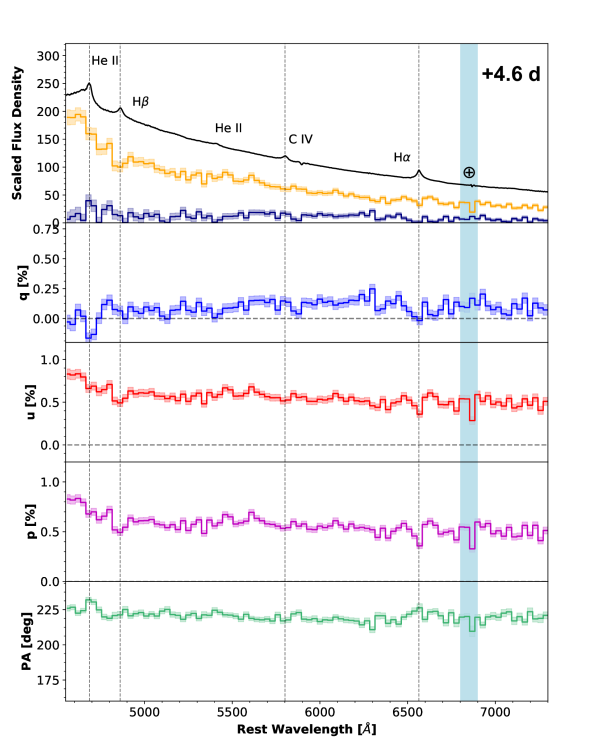
| 4.6 | 0.13 | 0.54 | 0.56 | 218(5) |
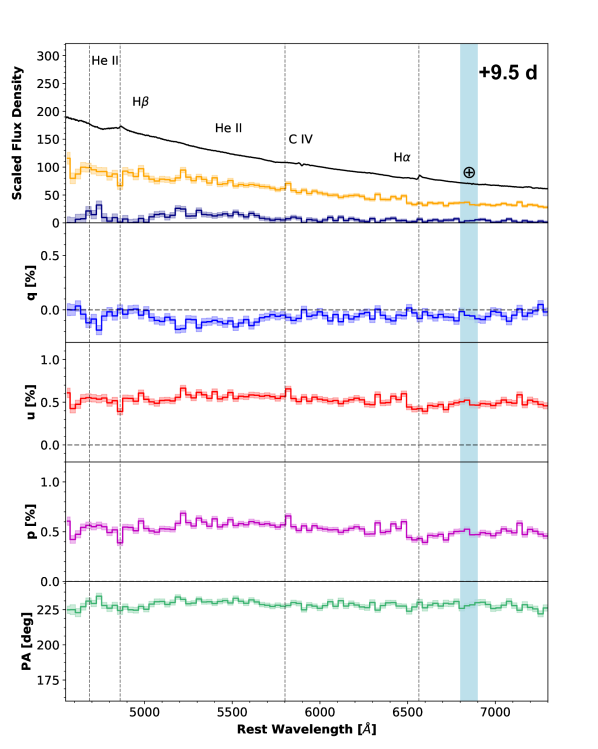
| 9.5 | 0.54 | 0.54 | 228(5) | |
| 14.5 | 0.37 | 0.38 | 228(8) |
aThe continuum polarization is calculated over the range 5600–6400 Å. Systematic errors for and (%) are well above the statistical uncertainties.
bDays after the estimated time of first light on MJD 60082.75 (18 May 2023).
cSystematic uncertainties for are presented in parentheses.
As shown in Figure 3 and Table 1, the continuum polarization observed on both days +1.4 and +2.5 is roughly consistent, at % and at a similar . These estimates are in good agreement with the polarimetric observations of SN 2023ixf with the Liverpool Telescope on MJD 60085.07 (Maund et al., 2023). Subsequently, a significant and rapid change in polarization was observed from days +2.5 to +4.6. At later epochs, the polarization of the SN settled to % and , where the polarized signal has been predominantly observed along the direction in the Stokes plane as shown in Figure 3. The rapid change of the polarization during –5 days after the SN explosion implies a significant alteration in the geometric configuration of the electron-scattering atmosphere at particular phases. The rather constant continuum polarization measured after day suggests that the geometry of the SN has settled to a distinct configuration compared to the earlier phases.
3.3 Polarization Evolution across Emission Lines
On both days +1.4 and +2.5, the values across the scattering wings [with full width at half-maximum intensity (FWHM) 1000 km s-1] of the major flash features such as H and the He II+N III complex are overall consistent with that measured across the continuum (see Figures 2, 4, and 2). Such rather flat patterns in across the flash lines corroborate a similar geometric configuration shared by the regions that emitted the earliest continuum and created the scattering wings of the “flash” features — both are from an aspherical distribution of the CSM.
An alternative method for investigating the polarization of spectral features is to compare the flux density () with its polarized components, and . The broadened wings arise from electron scattering above the recombination front of the associated “flash” features. Thus, the polarized flux density shows the source that participates in the scattering process. In other words, its spectral shape mirrors the flux-density spectrum of the obscured source (Hough, 2006). Therefore, when measuring the polarized flux density across the highly ionized lines, any deviation from their adjacent continuum would quantify the polarization of such features.
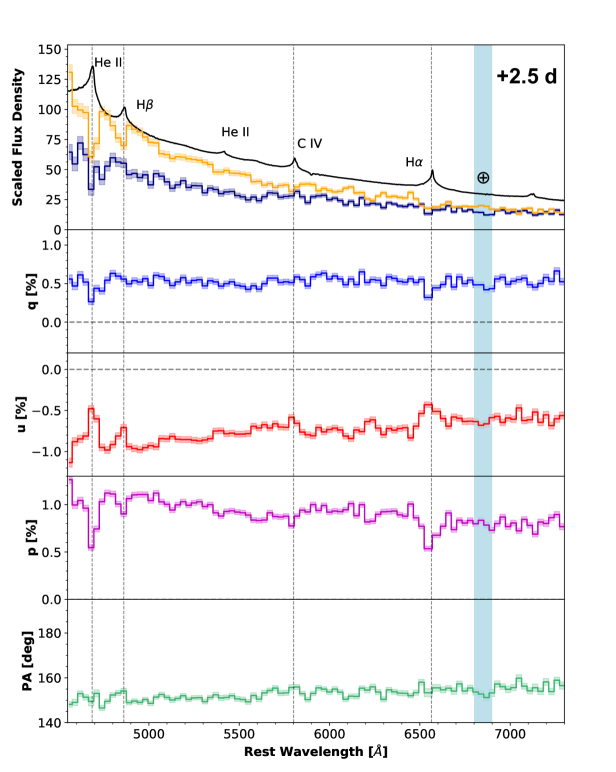
As shown in the top panel of Figure 2, we compare the spectral profiles of the polarized flux densities and with the total flux density. We identify a deviation in polarized flux density across He II 4686 + N III 4634, 4641 from the adjacent continuum, which appears to be stronger in compared to . However, no such deviation can be seen across H. This discrepancy between different “flash” features can be explained by a higher electron scattering optical depth experienced by the He II 4686 + N III 4634, 4641 photons compared to the H photons, which is caused by the different depth of their recombination fronts and last scattering regions — the recombination front for the former line complex resides deeper in the CSM (Groh (2014); see Figure 4 of (Shivvers et al., 2015)). At day +2.5, despite the continuum polarization remaining unchanged compared to day +1.4, more significant deviations in and from the continuum can be clearly seen across both He II 4686 and H (Figure 2). The rapidly fading N III 4634, 4641 has already disappeared. We caution that interpretations of these features are speculative, as the polarization flux is not as reliable at wavelengths blueward of 5500 Å. This is largely due to the decreasing detector sensitivity at shorter wavelengths. We also find that the systematic uncertainties below 5500 Å are higher (%) than for the region 5500–6700 Å (%).
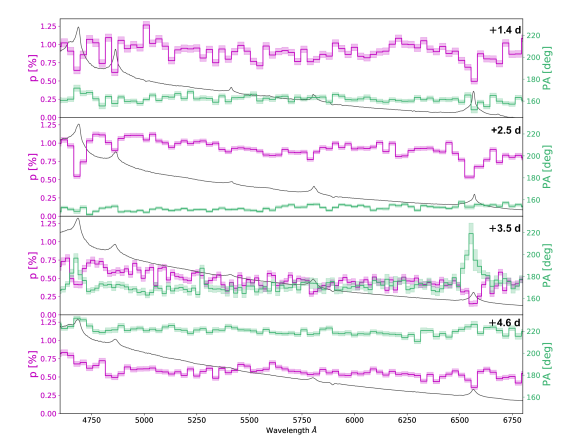
The trend of increasing polarized line flux density continues on day +3.5. The widths of the He II 4686 feature and the Balmer lines have increased to FWHM km s-1. The across the wings of these prominent emission profiles has evolved into a modulation that changes progressively from to as measured toward the inner part of the wings. The latter is also consistent with the continuum polarization of the SN after day +4.6, when the CSM has been swept away by the expanding ejecta. As the narrow emission lines are diminishing after day +4.6, the across major spectral profiles has leveled out with the continuum.
4 Discussion
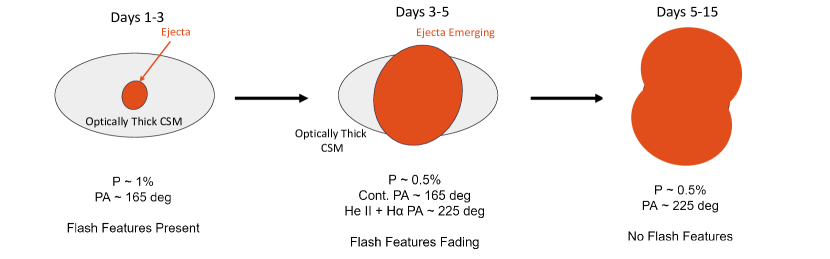
To summarize, we have observed, for the first time, the temporal evolution of the spectropolarimetric properties of a young Type II SN before its CSM has been swept away by the ejecta. A schematic picture to illustrate this early ejecta-CSM interaction based on the spectropolarimetry of SN 2023ixf is sketched in Figure 5.
The rapid evolution of the “flash” features during the first days after the SN explosion suggests a confined radial distribution caused by the CSM enrichment from the progenitor within a period of
where gives the duration of the flash features, and and respectively denote the velocity of the wind and the expanding SN ejecta. Such dense CSM around SN 2023ixf has been suggested to be confined to a radius of cm (Bostroem et al., 2023) or cm (Jacobson-Galan et al., 2023). Furthermore, given the lack of a blueshift in the narrow absorption component of the flash features’ P Cygni profiles, the CSM is expected to be asymmetric and predominantly away from our line of sight to the SN (Smith et al., 2023). Additionally, X-ray and radio signatures were observed for SN 2023ixf by Grefenstette (2023) and Berger et al. (2023), respectively, suggestive of a truncated CSM.
The % continuum polarization observed before day +2.5 is compatible with the presence of an optically thick, asymmetric CSM. Within the regime of an optically thick CSM (), where gives the shock velocity, the photosphere (optical depth ) would reside significantly above the layer of . Therefore, a % continuum polarization before day +2.5 traces the geometry of the outer regions of the dense CSM while the SN ejecta are contained within it. Considering the CSM will remain opaque to the inner ejecta, despite a decreasing within the first few days, the polarization will still stay close to an asymptotic limit when the optical depth is larger than (see, e.g., Figure 1 of Hoflich 1991).
The synchronous disappearance of the flash features and the drift of the continuum polarization in the Stokes plane as shown in Figure 3 suggest a large-scale transformation of the geometry as the CSM is swept away by the SN ejecta. In addition to the continuum polarization at day +3.5, which has been measured to be located midway between days +3 and +5 in the Stokes plane, conspicuous evolution of the polarization spectrum across the broadened Balmer lines and He II 4686 can be identified (see Figure 4). This broadening of the emission profiles is also seen in the high-resolution spectra obtained at similar phases (Smith et al., 2023). The displays a steady increase from to from the electron-scattering wings to the line rest wavelength of H. Interestingly, the former is consistent with the continuum at day +3.5, while the latter seems to agree with the continuum as measured after day +4.6.
A possible explanation for the observed rotation in , seen solely across the H and He II wings at day +3.5 and coinciding with the continuum after day +4.6, is that the H and He lines originate from the outer regions of the elongated SN ejecta emerging from the CSM. As the shock-driven ejecta break through the CSM, a significant shift is observed in both the continuum and the scattering wings, settling to a roughly constant continuum polarization and after day +4.6.
Before day +2.5, both the Balmer and the He II 4686 lines are characterized by a narrow emission core in their central region. For a more detailed discussion of the H core in SN 2023ixf, refer to the presentation of high-resolution spectra by Smith et al. (2023). This core is superimposed on an electron-scattering wing which can be modeled with a Lorentzian profile. The recombination front of He II is expected to be deeper than that of H, as the former requires a higher electron temperature (see, e.g., Groh (2014)). If the recombination front is situated above the photosphere, the photons radiating from the central spectral profile will undergo minimal scattering. As a result, the scattering wings will progressively depolarize toward the rest wavelength of the emission line until they reach a zero level of polarization. For instance, if the recombination front of H is above the photosphere, complete depolarization will be measured at the center of the H core assuming that there is no overlap from nearby lines (e.g., He II). The He II front could be close to or within the electron-scattering photosphere, thereby producing a more polarized flux due to intensified electron scattering.
The depolarization behavior toward the center of the emission lines is apparent across both He II 4686 and H at days +1.4 and +2.5. Nevertheless, owing to a minimum resolution of 18 Å with the chosen Kast spectropolarimeter configuration (equivalent to km s-1 in velocity), the measured line profiles are not sufficient to resolve any complete depolarization at the emission-line cores. Therefore, our low-resolution spectropolarimetry limits our determination of the relative locations between the photosphere and the recombination fronts of H and He II. In any case, the scattering wings of the flash features arise from the CSM; thus, the polarimetry measured across the wings traces the geometric distribution of the CSM.
At day +1.4, as illustrated by the polarized flux profiles and in Figure 2, we detected a slight deviation in the polarized flux across He II 4686 + N III 4634, 4641 compared to that taken from the adjacent continuum. However, no such deviation can be observed across H. The higher deviation across the former flash feature can be attributed to the recombination fronts of He II and N III being located deeper within the CSM compared to H. This is also consistent with the rapid disappearance of N III on day +1.4, possibly due to an increasing temperature and therefore ionization level in the emitting region of the CSM or to being engulfed by the SN ejecta. However, we caution that the detection of such deviation is marginal. It is also possible that both He II 4686 + N III 4634, 4641 and H may be polarized the same as the continuum.
On day +2.5, the scattering wings of both He II 4686 and H show an increased deviation in and from the continuum, compared to what was observed on day +1.4 (see Figures 2 and 2). This is concurrent with a significant decrease in the central emission peak. Moreover, the and profiles of He II 4686 and H have both broadened to a FWHM of km s-1 on day +2.5. The increased deviation of polarized flux from the continuum becomes even more prominent on day +3.5 (see Figure 7. Such an excess of polarized photons, which exhibits a rather broad profile compared to the electron-scattering wings seen on day +1.4, might be attributed to the recession of the recombination fronts relative to that of the photosphere. As time proceeds, the recession of the recombination fronts for He II and H will lead to increased scattering optical depths for both lines. The former is always located at a deeper layer compared to the latter owing to a higher required electron temperature. Consequently, the scattering of the recombination photons from both He II and H lines becomes stronger as they emerge from the photosphere. This may account for the progressively enhanced amount of polarized photons measured across the scattering wings observed before days, which is manifested as significant departures from that measured at the continuum. This mechanism could take place before the CSM has been overtaken by the expanding ejecta. We remark that the ejecta expanding into the CSM does not contradict the recession of the recombination front. The latter expands more slowly compared to the former, so both are expanding relative to the CSM, which moves at km s-1. It is noteworthy that the H line does not show the rotation observed in H and He II lines on day 3.5. This is perhaps related to the details of the formation of the hydrogen Balmer lines. The Balmer decrement is measured to be on day 3.5, which is significantly different from typical values of 2.8 for gas at temperatures of K (Miller, 1974). This suggests that the Balmer lines are formed at a density that is typically optically thick to the Balmer lines such that collisional excitation, radiative excitation by the photospheric continuum, or Balmer-line self-absorption are important. The region of H line formation is expected to more closely track the location of the photosphere than the H line, thus maintaining a polarization PA that more closely follows that of the continuum at day 3.5.
The transition phase between the earlier “flash” phase and the later “photospheric” phase occurs over a 2 day timescale. A significant alteration in geometry was recorded as the CSM was engulfed by the expanding ejecta. This change has been inferred from the temporal evolution of the polarization from days +2.5 to +4.6 (Figure 3), which then stabilized to % along the direction at later epochs (for instance, as measured at days +9.5 and +14.5). Polarimetry obtained at day +3.5 samples the geometry during the transitional phase, when the ejecta just surpass the outer boundary of the dense CSM. Meanwhile, polarimetry at day +4.6 samples the geometry of the SN ejecta after they have fully overtaken the dense CSM, as indicated by the disappearance of the flash features.
On day +4.6, no significant deviation can be identified in the polarized flux across both He II 4686 and H (see Figures 7. The former disappeared after day +9.5, and the latter evolved into a weak and broader P Cygni profile, suggesting that the SN ejecta have completely swept up the CSM. As the photosphere recedes inside the ejecta, the constant % and after day +4.6 thus reflect the geometry of the SN ejecta. The constant obtained from days +4.6 to +14.5 is also consistent with the continuum polarization settling to 0.5%, while also suggesting that the outermost H-rich layer of SN ejecta is itself aspherical.
Although we do not address the removal of ISP, our general interpretations remain unchanged, even at the upper limit of %. This is because ISP cannot account for the rapid decrease in continuum polarization and the rotation. A proper determination and removal of the ISP would result in a shift of the origin in the plane (see blue dashed circle in Figure 3). However, the exact values of the continuum polarization and will differ depending on and .
We also remark that the scenario of the early ejecta-CSM interaction depicted by the temporal evolution of the polarimetric behavior is generally consistent with the physical picture derived from the evolution of spectral-profile widths. These profiles arise from different regions of the CSM and the interface where the SN ejecta interact with the CSM, as discussed by Smith et al. (2023). The highly aspherical mass-loss process leading up to the explosion could have been shaped by interactions between eruptive mass ejections and a binary companion, as suggested by pre-SN modeling (Soker, 2013; Smith & Arnett, 2014). The detailed geometric properties of the SN ejecta, which may have been shaped by turbulent processes during the progenitor’s final burning stages leading to the explosion or by asymmetries in the explosion process itself, still remain unclear. The geometry of the core and information about the preferential axis of the explosion could be further probed by monitoring the temporal evolution of the continuum polarization after SN 2023ixf falls off from its plateau phase. Also, inspection of the emission-line profiles during the nebular phase will provide an additional probe of any asymmetries in the CSM.
The physical scenario presented in Figure 5 is also compatible with SN ejecta expanding into a disk-like, toroidal geometry characterized by a steep falloff in density beyond a CSM radius cm. The SN ejecta break out through the higher latitudes and are pinched in the plane of the disk. After +4.6 days, the SN ejecta engulf the dense CSM disk/torus and are elongated in the polar directions. A similar model was used to describe the rapid rotation of the and the change in continuum polarization for the interacting Type II SNe 1997eg (Hoffman et al., 2008) and 2009ip (see Figures 9 and 10 of Mauerhan et al. (2014)), albeit at much later times. The spectropolarimetric observations presented in this work align with the conclusions of Smith et al. (2023), where the CSM was also suggested as being asymmetric from the lack of blueshifted absorption components in the narrow P Cygni profiles. Another possible model for the CSM includes the presence of a pre-explosion effervescent zone (see Soker (2023)). The polarimetry results suggest that such an effervescent zone may be flat due to a rotation of the progenitor or binary interaction.
We draw comparisons between our polarimetric observations and those of other interacting SNe such as Type IIn SN 1998S (Shivvers et al., 2015). In contrast to SN 2023ixf, SN 1998S exhibited prolonged “flash” features ( days) and a high (%) continuum polarization (Leonard et al., 2000) at early times, a characteristic commonly observed in SNe IIn, indicative of the presence of an extended CSM (Bilinski et al., 2023). The depolarization observed near the emission-line cores of SN 2023ixf have been observed in SNe IIn such as SN 1997eg (Hoffman et al., 2008) and 2010jl (Patat et al., 2011), which were also characterized by a high continuum polarization similar to that of SN 1998S. Models of these interacting SNe favor an extended, dense CSM with distinct narrow-line regions in an equatorial plane (disk) and a diffuse broad-line region which dominates in the polar directions (Leonard et al., 2000; Hoffman et al., 2008). Other models, compatible with the equatorial CSM distribution, favor a cold dense shell (CDS) envelope producing narrow-line emission, surrounded by a broad-line region (Chugai et al., 2004; Dessart et al., 2016). In the observed sample of interacting SNe, a pattern emerges: persistent asymmetries exist with a certain diversity that can be explained by viewing-angle effects (Bilinski et al., 2023), as well as varying environments on a continuum, which likely involve either binary interaction or eruptive mass-loss processes.
5 Conclusions
We present a spectropolarimetric sequence of the nearby Type II SN 2023ixf carried out starting 1.4 days after the SN explosion. The first epochs of observations (days +1.4 and +2.5), which were obtained before the disappearance of a series of highly ionized emission features, are the earliest such measurements for any SN to date. The timing of these observations, combined with their high cadence, offers an unprecedented opportunity to investigate the “flash” ionization features, the outermost layers of the explosion, and its immediate circumstellar environment. The inferred geometric properties can therefore further constrain the associated progenitor mass-loss history.
A high continuum polarization (1%) was measured at days +1.4 and +2.5 after the explosion, compatible with a highly aspherical, optically thick CSM that extends beyond the location of the shock-driven SN ejecta at this phase. A constant observed across both the continuum and the scattering wings of the short-lived, narrow emission lines (FWHM km s-1) may indicate a common emitting region shared by both the continuum and the early recombination features, namely the outer layers of the ambient CSM. On day +3.5, the continuum polarization dropped to nearly 0.5%. The polarization angle of the continuum remained near to within the systematic uncertainties. Meanwhile, the along the wings of the H and He II 4686 lines rotated gradually to and (respectively) toward their rest wavelengths. This rapid change is observed as a shift of the continuum polarization in the Stokes plane, coinciding with the weakening of the “flash” features. After day +4.6, the continuum polarization has settled to a relatively constant value in the Stokes plane, with the corresponding and measured to be approximately 0.5% and 225∘, respectively. The again shows a constant level across both the continuum and the major emission lines.
Based on the temporal evolution of the polarization of SN 2023ixf, we propose a physical scenario where the aspherical, optically thick CSM is swept away by the aspherical SN ejecta within the first five days after the explosion of the progenitor star as illustrated in Figure 5. The asymmetry in the CSM likely results from a disk-like or toroidal geometry produced by eruptive mass loss occurring within a few years before the explosion, possibly involving interaction with a binary companion. Ongoing spectropolarimetric surveillance of SN 2023ixf through the falloff from its photospheric plateau and during nebular phases will provide valuable insights into the origins of the observed asymmetries.
6 acknowledgments
A major upgrade of the Kast spectrograph on the Shane 3 m telescope at Lick Observatory, led by Brad Holden, was made possible through gifts from the Heising-Simons Foundation, William and Marina Kast, and the University of California Observatories. We appreciate the expert assistance of the staff at Lick Observatory. Research at Lick Observatory is partially supported by a gift from Google.
Generous financial support was provided to A.V.F.’s supernova group at U.C. Berkeley by the Christopher R. Redlich Fund, Steven Nelson, Landon Noll, Sunil Nagaraj, Sandy Otellini, Gary and Cynthia Bengier, Clark and Sharon Winslow, Sanford Robertson, Alan Eustace, Briggs and Kathleen Wood, and numerous other donors. R.M. acknowledges support by the National Science Foundation (NSF) under awards AST-2221789 and AST-2224255. L.W. acknowledges the NSF for support through award AST-1817099. The TReX team at U.C. Berkeley is partially funded by the Heising-Simons Foundation under grant #2021-3248 (PI R. Margutti).
Appendix A Appendix: Polarization Spectra of SN 2023ixf
| UT Date | MJDb | Phasea | Airmass | Avg. Seeing | Exposure Timec |
|---|---|---|---|---|---|
| (MM-DD-YYYY) | (days) | (arcsec) | (s) | ||
| 05-20-2023 | 60084.18 | 1.4 | 1.12–1.44 | 1.2 | |
| 05-21-2023 | 60085.23 | 2.5 | 1.06 | 1.2 | |
| 05-22-2023 | 60086.24 | 3.5 | 1.05 | 1.2 | |
| 05-23-2023 | 60087.35 | 4.6 | 1.15 | 1.2 | |
| 05-28-2023 | 60092.20 | 9.5 | 1.05 | 1.2 | |
| 06-02-2023 | 60097.26 | 14.5 | 1.06 | 1.2 |
aDays after the estimated time of first light on MJD 60082.75 (UTC 18 May 2023).
bMJD is given as the start time of the CCD exposure.
cExposure time of a single exposure 4 retarder-plate angles number of loops. Wavelength range for Kast is 4550–9800 Å.
References
- Astropy Collaboration et al. (2013) Astropy Collaboration, Robitaille, T. P., Tollerud, E. J., et al. 2013, A&A, 558, A33, doi: 10.1051/0004-6361/201322068
- Astropy Collaboration et al. (2018) Astropy Collaboration, Price-Whelan, A. M., Sipőcz, B. M., et al. 2018, AJ, 156, 123, doi: 10.3847/1538-3881/aabc4f
- Bellm et al. (2019) Bellm, E. C., Kulkarni, S. R., Graham, M. J., et al. 2019, PASP, 131, 018002, doi: 10.1088/1538-3873/aaecbe
- Berger et al. (2023) Berger, E., Keating, G. K., Margutti, R., et al. 2023, Millimeter Observations of the Type II SN2023ixf: Constraints on the Proximate Circumstellar Medium, doi: 10.48550/arXiv.2306.09311
- Bilinski et al. (2023) Bilinski, C., Smith, N., Williams, G. G., et al. 2023, Multi-Epoch Spectropolarimetry for a Sample of Type IIn Supernovae: Persistent Asymmetry in Dusty Circumstellar Material, doi: 10.48550/arXiv.2304.13034
- Bostroem et al. (2023) Bostroem, K. A., Pearson, J., Shrestha, M., et al. 2023, Early Spectroscopy and Dense Circumstellar Medium Interaction in SN~2023ixf, arXiv. http://arxiv.org/abs/2306.10119
- Branch & Wheeler (2017) Branch, D., & Wheeler, J. C. 2017, Supernova Explosions, doi: 10.1007/978-3-662-55054-0
- Cardelli et al. (1989) Cardelli, J. A., Clayton, G. C., & Mathis, J. S. 1989, ApJ, 345, 245, doi: 10.1086/167900
- Chornock et al. (2010) Chornock, R., Filippenko, A. V., Li, W., & Silverman, J. M. 2010, ApJ, 713, 1363, doi: 10.1088/0004-637X/713/2/1363
- Chugai (2001) Chugai, N. 2001, MNRAS, 326, 1448, doi: 10.1111/j.1365-2966.2001.04717.x
- Chugai et al. (2004) Chugai, N. N., Blinnikov, S. I., Cumming, R. J., et al. 2004, MNRAS, 352, 1213, doi: 10.1111/j.1365-2966.2004.08011.x
- Davis & Greenstein (1951) Davis, Leverett, J., & Greenstein, J. L. 1951, ApJ, 114, 206, doi: 10.1086/145464
- Dessart et al. (2016) Dessart, L., Hillier, D. J., Audit, E., Livne, E., & Waldman, R. 2016, MNRAS, 458, 2094, doi: 10.1093/mnras/stw336
- Dessart et al. (2021) Dessart, L., Hillier, D. J., & Leonard, D. C. 2021, A&A, 651, A10, doi: 10.1051/0004-6361/202140409
- Filippenko et al. (2023) Filippenko, A. V., Zheng, W., & Yang, Y. 2023, Transient Name Server AstroNote, 123, 1. https://ui.adsabs.harvard.edu/abs/2023TNSAN.123....1F
- Fransson et al. (2014) Fransson, C., Ergon, M., Challis, P. J., et al. 2014, ApJ, 797, 118, doi: 10.1088/0004-637X/797/2/118
- Grefenstette (2023) Grefenstette, B. 2023, The Astronomer’s Telegram, 16049, 1. https://ui.adsabs.harvard.edu/abs/2023ATel16049....1G
- Groh (2014) Groh, J. H. 2014, A & A, 572, L11, doi: 10.1051/0004-6361/201424852
- Hoffman et al. (2008) Hoffman, J. L., Leonard, D. C., Chornock, R., et al. 2008, ApJ, 688, 1186, doi: 10.1086/592261
- Hoflich (1991) Hoflich, P. 1991, A & A, 246, 481
- Hosseinzadeh et al. (2023) Hosseinzadeh, G., Farah, J., Shrestha, M., et al. 2023, arXiv e-prints, arXiv:2306.06097, doi: 10.48550/arXiv.2306.06097
- Hough (2006) Hough, J. 2006, Astronomy and Geophysics, 47, 3.31, doi: 10.1111/j.1468-4004.2006.47331.x
- Huang & Chevalier (2018) Huang, C., & Chevalier, R. A. 2018, MNRAS, 475, 1261, doi: 10.1093/mnras/stx3163
- Itagaki (2023) Itagaki, K. 2023, Transient Name Server Discovery Report, 2023-1158, 1
- Jacobson-Galan et al. (2023) Jacobson-Galan, W. V., Dessart, L., Margutti, R., et al. 2023, arXiv e-prints, arXiv:2306.04721, doi: 10.48550/arXiv.2306.04721
- Jencson et al. (2023) Jencson, J. E., Pearson, J., Beasor, E. R., et al. 2023, A Luminous Red Supergiant and Dusty Long-period Variable Progenitor for SN 2023ixf, arXiv. http://arxiv.org/abs/2306.08678
- Kilpatrick et al. (2023) Kilpatrick, C. D., Foley, R. J., Jacobson-Galán, W. V., et al. 2023, SN2023ixf in Messier 101: A Variable Red Supergiant as the Progenitor Candidate to a Type II Supernova, arXiv. http://arxiv.org/abs/2306.04722
- Landsman (1993) Landsman, W. B. 1993, 52, 246. https://ui.adsabs.harvard.edu/abs/1993ASPC...52..246L
- Leonard & Filippenko (2001) Leonard, D. C., & Filippenko, A. V. 2001, PASP, 113, 920, doi: 10.1086/322151
- Leonard et al. (2001) Leonard, D. C., Filippenko, A. V., Ardila, D. R., & Brotherton, M. S. 2001, ApJ, 553, 861, doi: 10.1086/320959
- Leonard et al. (2000) Leonard, D. C., Filippenko, A. V., Barth, A. J., & Matheson, T. 2000, ApJ, 536, 239, doi: 10.1086/308910
- Leonard et al. (2006) Leonard, D. C., Filippenko, A. V., Ganeshalingam, M., et al. 2006, Nature, 440, 505, doi: 10.1038/nature04558
- Mao et al. (2023) Mao, Y., Zhang, M., Cai, G., et al. 2023, TNS, 130, 1. https://ui.adsabs.harvard.edu/abs/2023TNSAN.130....1M
- Mauerhan et al. (2014) Mauerhan, J., Williams, G. G., Smith, N., et al. 2014, MNRAS, 442, 1166, doi: 10.1093/mnras/stu730
- Mauerhan et al. (2017) Mauerhan, J. C., Van Dyk, S. D., Johansson, J., et al. 2017, ApJ, 834, 118, doi: 10.3847/1538-4357/834/2/118
- Maund et al. (2023) Maund, J. R., Wiersema, K., Shrestha, M., Steele, I., & Hume, G. 2023, Transient Name Server AstroNote, 135, 1
- Miller & Stone (1994) Miller, J., & Stone, R. 1994, The Kast Double Spectrograph
- Miller (1974) Miller, J. S. 1974, ARA&A, 12, 331, doi: 10.1146/annurev.aa.12.090174.001555
- Miller et al. (1988) Miller, J. S., Robinson, L. B., & Goodrich, R. W. 1988, in Instrumentation for Ground-Based Optical Astronomy, ed. L. B. Robinson, Santa Cruz Summer Workshops in Astronomy and Astrophysics (New York, NY: Springer), 157–171, doi: 10.1007/978-1-4612-3880-5_14
- Nagao et al. (2019) Nagao, T., Cikota, A., Patat, F., et al. 2019, MNRAS: Letters, 489, L69, doi: 10.1093/mnrasl/slz119
- Nagao et al. (2021) Nagao, T., Patat, F., Taubenberger, S., et al. 2021, MNRAS, 505, 3664, doi: 10.1093/mnras/stab1582
- Oke & Gunn (1983) Oke, J. B., & Gunn, J. E. 1983, The Astrophysical Journal, 266, 713, doi: 10.1086/160817
- Patat (2017) Patat, F. 2017, in Handbook of Supernovae, ed. A. W. Alsabti & P. Murdin (Cham: Springer International Publishing), 1017–1049
- Patat et al. (2011) Patat, F., Taubenberger, S., Benetti, S., Pastorello, A., & Harutyunyan, A. 2011, A & A, 527, L6, doi: 10.1051/0004-6361/201016217
- Patra et al. (2021) Patra, K. C., Yang (杨轶), Y., Brink, T. G., et al. 2021, MNRAS, 509, 4058, doi: 10.1093/mnras/stab3136
- Patra et al. (2022) Patra, K. C., Yang, Y., Brink, T. G., et al. 2022, MNRAS, 509, 4058, doi: 10.1093/mnras/stab3136
- Perley et al. (2023) Perley, D. A., Gal-Yam, A., Irani, I., & Zimmerman, E. 2023, Transient Name Server AstroNote, 119, 1
- Riess et al. (2022) Riess, A. G., Yuan, W., Macri, L. M., et al. 2022, ApJ, 934, L7, doi: 10.3847/2041-8213/ac5c5b
- Schlafly & Finkbeiner (2011) Schlafly, E. F., & Finkbeiner, D. P. 2011, ApJ, 737, 103, doi: 10.1088/0004-637X/737/2/103
- Serkowski et al. (1975) Serkowski, K., Mathewson, D. S., & Ford, V. L. 1975, ApJ, 196, 261, doi: 10.1086/153410
- Shivvers et al. (2015) Shivvers, I., Groh, J. H., Mauerhan, J. C., et al. 2015, ApJ, 806, 213, doi: 10.1088/0004-637X/806/2/213
- Smith & Arnett (2014) Smith, N., & Arnett, W. D. 2014, ApJ, 785, 82, doi: 10.1088/0004-637X/785/2/82
- Smith et al. (2023) Smith, N., Pearson, J., Sand, D. J., et al. 2023, arXiv e-prints, arXiv:2306.07964, doi: 10.48550/arXiv.2306.07964
- Soker (2013) Soker, N. 2013, A binary scenario for the pre-explosion outburst of the supernova 2010mc, arXiv, doi: 10.48550/arXiv.1302.5037
- Soker (2023) —. 2023, RA&A, 23, 081002, doi: 10.1088/1674-4527/ace51f
- Soraisam et al. (2023) Soraisam, M. D., Szalai, T., Van Dyk, S. D., et al. 2023, The SN 2023ixf Progenitor in M101: I. Infrared Variability, arXiv. http://arxiv.org/abs/2306.10783
- Vasylyev et al. (2023) Vasylyev, S. S., Yang, Y., Patra, K. C., et al. 2023, arXiv e-prints, arXiv:2303.06497, doi: 10.48550/arXiv.2303.06497
- Wang & Wheeler (2008) Wang, L., & Wheeler, J. C. 2008, Annual Review of A & A, 46, 433, doi: 10.1146/annurev.astro.46.060407.145139
- Waxman & Katz (2017) Waxman, E., & Katz, B. 2017, in Handbook of Supernovae, ed. A. W. Alsabti & P. Murdin (Cham: Springer International Publishing), 967–1015, doi: 10.1007/978-3-319-21846-5_33
- Yaron et al. (2017) Yaron, O., Perley, D. A., Gal-Yam, A., et al. 2017, Nature Physics, 13, 510, doi: 10.1038/nphys4025