ReveaLLAGN 0: First Look at JWST MIRI data of Sombrero and NGC 1052
Abstract
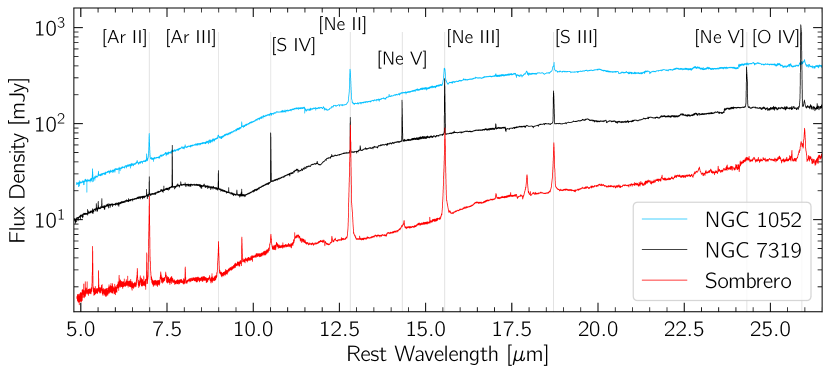
We present the first results from the Revealing Low-Luminosity Active Galactic Nuclei (ReveaLLAGN) survey, a JWST survey of seven nearby LLAGN. We focus on two observations with the Mid-Infrared Instrument’s (MIRI) Medium Resolution Spectrograph (MRS) of the nuclei of NGC 1052 and Sombrero (NGC 4594 / M104). We also compare these data to public JWST data of a higher-luminosity AGN, NGC 7319. JWST clearly resolves the AGN component even in Sombrero, the faintest target in our survey; the AGN components have very red spectra. We find that the emission-line widths in both NGC 1052 and Sombrero increase with increasing ionization potential, with FWHM1000 km s-1 for lines with ionization potential 50 eV. These lines are also significantly blue-shifted in both LLAGN. The high ionization potential lines in NGC 7319 show neither broad widths or significant blue shifts. Many of the lower ionization potential emission lines in Sombrero show significant blue wings extending 1000 km s-1. These features and the emission-line maps in both galaxies are consistent with outflows along the jet direction. Sombrero has the lowest luminosity high-ionization potential lines ([Ne V] and [O IV]) ever measured in the mid-IR, but the relative strengths of these lines are consistent with higher luminosity AGN. On the other hand, the [Ne V] emission is much weaker relative to the [Ne III] and [Ne II] lines of higher-luminosity AGN. These initial results show the great promise that JWST holds for identifying and studying the physical nature of LLAGN.
1 Introduction
As material falls onto a black hole, that material heats up and emits light creating an active galaxy nucleus (AGN). While the most rapidly accreting objects are seen to the edges of our Universe as luminous quasars, the vast majority of central supermassive black holes in nearby galaxies are low-luminosity AGN (LLAGN), accreting at rates far below their Eddington limits (; see Ho, 2009, for a review).
The observational signatures of LLAGN differ from their higher luminosity counterparts (e.g. Ho, 2008; Trump et al., 2011). In particular, an increasing fraction of the LLAGN energy is channeled into a compact jet that can impact the gas in their host galaxies, keeping massive early-type galaxies quiescent (e.g. Croton et al., 2006; Weinberger et al., 2017). The inner part of the accretion disk is believed to transition to a radiatively inefficient accretion flow (RIAF; Yuan & Narayan, 2014), but the structure of LLAGNs is still not yet well understood.
Infrared (IR) wavelengths are particularly valuable for studying AGN (Sajina et al., 2022), as the dust that hides many AGN at optical and UV wavelengths strongly emits in the IR. In fact, the energy output for many AGN is highest at X-ray and mid-IR wavelengths (Prieto et al., 2010). Furthermore, the emission from AGN at 12 m has been found to be tightly correlated with the 2-10 keV X-ray emission, with similar luminosities in both bands (Asmus et al., 2015). In addition to the continuum emission from dust or jet emission (e.g. Prieto et al., 2016; Fernández-Ontiveros et al., 2023), strong emission lines are seen at infrared wavelengths, including high ionization potential (IP) “coronal” emission lines that track the ionization field of the AGN (e.g. Satyapal et al., 2008; Goulding & Alexander, 2009). At lower accretion rates, the infrared signatures may change (Dumont et al., 2020), however, it also becomes increasingly difficult to separate out the nuclear emission from LLAGN from the surrounding emission from star formation due to the less luminous AGN. This is especially true for low ionization nuclear emission regions (LINERs), which are characterized by strong low-ionization emission lines, a weakly-accreting black hole and shocked emission from strong outflows (e.g., Heckman, 1980; Ho, 2008; Eracleous et al., 2010; Molina et al., 2018).
The advent of JWST brings new opportunities in the study of AGN. It is the most sensitive instrument ever for detecting AGN, roughly matching 2 Ms in Chandra Deep Field North in just 10 ks (Xue et al., 2016, assuming the Asmus et al. (2015) relation between the mid-IR and X-ray emission). However, given their low accretion rates, emission from the central engine in LLAGNs is often mixed with the emission from the surrounding host galaxy. Thus, we will need empirical templates or models to cleanly separate LLAGN emission from that of the galaxy.
Fortunately, JWST also has remarkable spatial resolution, which allows us to isolate the LLAGN emission from that of the host galaxy in nearby objects. This is the goal of the Revealing LLAGN (ReveaLLAGN) project, which is obtaining integral field spectroscopic (IFS) observations of seven nearby, well-known LLAGN spanning a wide range of both black hole mass (10 M⊙) and Eddington ratio (log() of -6.2 to -2.7). In addition to providing templates of LLAGN that can be applied to more distant observations, the continuum and coronal line emission can provide valuable constraints for understanding the internal structure of LLAGN.
In this paper, we report the first results from the ReveaLLAGN project based on the Mid-Infrared Instrument (MIRI) medium-resolution spectrometer (MRS) data from our first two targets, Sombrero (also known as M104 and NGC 4594) and NGC 1052. The overall properties of these galaxies are listed in Table 1. Both galaxies are classified as LINERs based on their optical emission lines (Heckman, 1980; Ho et al., 1997), and their low AGN luminosities are due to their low Eddington ratios and accretion rates. In the context of the full ReveaLLAGN sample these two galaxies bracket the survey in terms of their mid-IR fluxes, and thus represent the expected highest (NGC 1052) and lowest (Sombrero) signal-to-noise ratios (S/N). In this paper, we contrast these two LLAGN with the higher luminosity and Eddington ratio Seyfert 2 AGN in NGC 7319 (part of the JWST Early Release Observations; Pontoppidan et al., 2022), which is also at a much larger distance. All three galaxies have similar BH masses, thus the primary differences between these AGN are that they have Eddington ratios spanning 4 dex. Both Sombrero and NGC 1052 have well-studied AGN with small-scale radio jets that can create shocked emission which could contribute to the observed nuclear emission (e.g., Claussen et al., 1998; Hada et al., 2013; Molina et al., 2018; Fernández-Ontiveros et al., 2023). Additionally, both galaxies’ spectral energy distributions (SEDs) show a lack of emission in the UV relative to higher luminosity AGN (Fernández-Ontiveros et al., 2023), consistent with other LLAGN (Ho, 2008). We review previous observations of both galaxies’ AGN in more depth in Section 5.3.
In Section 2 we describe the data acquisition and reduction processes. We present our spectral extraction process and emission-line measurements for both the nuclear spectra and the emission-line maps in Section 3. We present our analysis of the data in Section 4, and discuss them in context of previous work in Section 5. We conclude in Section 6. We note that all JWST data is barycenter corrected, and thus velocities are given in the barycentric frame.
| Galaxy Name | Distance | Galaxy Mass | Morph. | AGN Type | BH Mass | AGN X-ray Lum. | Eddington Ratio | |
|---|---|---|---|---|---|---|---|---|
| Mpc | km s-1 | log(M⋆/M⊙) | log(M∙/M⊙) | log(/erg s-1) | log( | |||
| NGC 1052 | 19.40.2 | 1487.95.1 | 10.71 | E4 | L1.9 | 8.82 | 41.46 | -3.97 |
| Sombrero/M104/NGC 45941 | 9.60.3 | 1090.95.1 | 11.18 | Sa | L2 | 8.83 | 40.04 | -5.66 |
| NGC 7319 | 99.87.0 | 6747.43.6 | 11.07 | SBbc | Sy2 | 8.10 | 42.17 | -1.67 |
References. — Distances: NGC 1052 – Tonry et al. (2001), Sombrero – McQuinn et al. (2016); for NGC 7319, the distance is a flow-corrected redshift based distance assuming from the NASA Extragalactic Database. Systemic Velocities : are NASA Extragalactic database heliocentric velocities taken from Fouque et al. (1992) for NGC 1052, de Vaucouleurs et al. (1991) for Sombrero, and Nishiura et al. (2000) for NGC 7319. Galaxy Mass: NGC 1052 & Sombrero from S4G (Sheth et al., 2010; Eskew et al., 2012) with Sombrero corrected to the distance used here; for NGC 7319, we use Jarrett et al. (2003) and assume . Morphological Type: from de Vaucouleurs et al. (1991), AGN Type: NGC 1052 and Sombrero from Ho et al. (1997), NGC 7319 from Koss et al. (2022). BH Mass: NGC 1052 & NGC 7319 based on velocity dispersion (Koss et al., 2022), Sombrero from Jardel et al. (2011). AGN X-ray Luminosity: 2-10 keV luminosities for NGC 1052 & NGC 7319 from Koss et al. (2022), Sombrero from Fernández-Ontiveros et al. (2023) using updated distance. Eddington Ratio: NGC 1052 and Sombrero from Fernández-Ontiveros et al. (2023) using listed distances and BH masses, NGC 7319 from Koss et al. (2022).
2 Data Reduction and Methods
2.1 Targets and Data Acquisition
We use JWST MIRI/MRS (Wells et al., 2015) to collect IFS data for our ReveaLLAGN targets in the mid-IR (4.9–27.9 m). The full mid-IR wavelength range for MIRI/MRS is covered by 4 different channels (ch1–4): ch1 (4.9–7.65 m) and ch2 (7.51–11.71 m) use the MIRIFU_SHORT Detector, while ch3 (11.55–17.98 m) and ch4 (17.71–27.9 m) use the MIRIFU_LONG Detector. Each channel has an increasing field of view (FoV): ch1 (3.2″ 3.7″), ch2 (4.0″ 4.8″), ch3 (5.2″ 6.2″), and ch4 (6.6″ 7.7″), and pixel size: ch1 (0196), ch2 (0196), ch3 (0245), ch4 (0273). All observations were taken using all three MIRI/MRS sub-channels.
We describe the observational details for our two ReveaLLAGN targets; details on the NGC 7319 observation are discussed in (Pereira-Santaella et al., 2022). Our Sombrero observations are centered at RA: 12:39:59.430 DEC: -11:37:22.99; this is taken from Gaia EDR3 (Gaia Collaboration et al., 2021). Our NGC 1052 observations are centered at RA: 02:41:04.798, DEC: -08:15:20.75 taken from very-long-baseline interferometry measurements of the AGN (Lambert & Gontier, 2009).
Background exposures were taken using offset blank fields selected based on WISE 12 m imaging: for Sombrero this field was at RA: 12:39:55.9810, DEC: 11:32:11.44 and for NGC 1052 at RA: 02:41:5.1200, DEC: 08:12:37.70.
Our MIRI/MRS measurements were taken using the 4-Point, Extended Source optimized ALL-channel dither pattern using the inverted, or negative, dither orientation111https://jwst-docs.stsci.edu/jwst-mid-infrared-instrument/miri-operations/miri-dithering/miri-mrs-dithering. This ensures improved sampling of the point spread function (PSF) at all wavelengths and allows the correction of hot detector pixels. The exposure time for both Sombrero and NGC 1052 was 921.313 seconds split over four dithers for each sub-channel setting. Background exposures used a single dither position with an exposure length of 230.328 seconds for each sub-channel setting. The Sombrero data were among the first science data taken with JWST on July 4th, 2022, while the NGC1052 data were taken on August 11th, 2022.
2.2 Data Reduction
We process the raw observations for Sombrero, NGC 1052, and NGC 7319 through version 1.8.2 of the JWST pipeline using jwst_0989.pmap, which is a versioned reference file that gives overall context for the pipeline. Calibration of our data is divided into three main stages of processing; the Detector1, Spec2, and Spec3 pipelines.
The Detector1 pipeline takes the raw counts from the detector, applies basic detector-level corrections to all exposures, and creates uncalibrated countrate images, or lvl2a data products222 See calwebb_detector1 documentation for more information. . The Spec2 pipeline takes the lvl2a products and applies additional instrumental corrections and calibrations to produce a fully calibrated individual exposure, or lvl2b data products. For MIRI/MRS observations, this stage includes adding WCS information, flat field corrections, and stray light subtraction. We include an optional fringing removal333See calwebb_spec2 documentation for more information step during this stage to address the significant fringes found in the MIRI/IFU data. The Spec3 pipeline processes lvl2b spectroscopic observations into lvl3 data by combining calibrated lvl2b data from associated dithered exposures into a 3-D spectral cube or 2-D extracted spectra. For MIRI/MRS data the master background subtraction and outlier detection occurs in this stage as well. We choose a final product of 4 data cubes, one for each channel444See calwebb_spec3 documentation for more information. . The wavelength solution, FLT-4, associated with our pipeline version has a 1 wavelength calibration error of 1030 km s-1 (Argyriou et al., 2023) through the MRS wavelength range.
3 Spectral Extraction and Methods
3.1 Nuclear Spectra Extraction
Nuclear spectra were extracted using the photutils python package’s aperture photometry code. At each wavelength, we used a photometric aperture centroided on the median flux image of each channel. The width of this aperture depended on wavelength to account for the changing PSF, with an angular radius of 1.22/(6.5 meters) – roughly 1 spatial FWHM (); this aperture radius ranges from 019 at 5 m to 097 at 25 m. The radius of this aperture on the short wavelength 019 corresponds to 8.8, 17.9, and 92 pc in Sombrero, NGC 1052, and NGC 7319 respectively. Background subtraction was done using an annulus with radii between 2 and 2.5 this value.
We created a wavelength-dependent aperture correction based on the MIRI data cube of 10 Lac (obtained from Argyriou, I., private communication). This aperture correction (total/aperture flux) was derived using the same aperture and background annulus as for our galaxy nuclei, with the total flux obtained by integrating the flux of the full data cube. Due to residual sky background issues, we took the median flux of pixels with a radius greater than as a background subtraction in each spaxel before calculating the total flux of the data cube at each wavelength. To create a smooth relation, we smoothed the derived aperture correction at each wavelength with a moving median. We compared this smoothed aperture correction to several other point source observations (HD192163 and HD76534) as well as NGC 1052, which is nearly point like at longer wavelengths and found generally good agreement (to within 10%) in the aperture corrections between sources for channels 1-3, with much poorer agreement and due to noisier measurements in channel 4. The aperture correction declines from values of 2.1 at 5 m to values similar to the WebbPSF prediction (1.4). We therefore fit a 5th order polynomial to our smoothed correction in channels 1-3, and set the ch4 correction to a constant 1.4 value. This aperture correction has been applied throughout this paper.
3.2 Measuring Emission Features
3.2.1 Multi-Gaussian Fitting of the Nuclear Spectrum
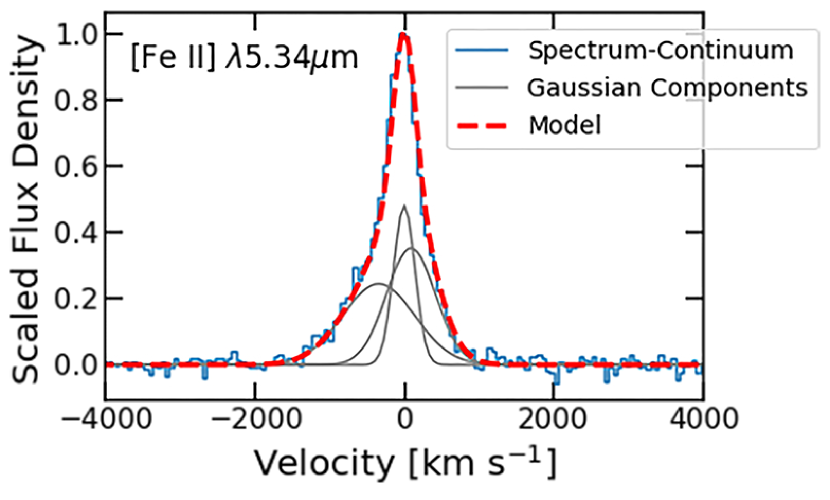
Our nuclear spectra are very high S/N with clear evidence of many emission lines. These lines often show complex profiles – to extract both flux and velocity information from these lines, we perform multi-Gaussian fits. We first define continuum and fitting windows for each line based on visual inspection – our default fitting window is based on a velocity width of 5000 km s-1. We fit a linear function to the continuum on either side of the emission feature and subtract the result from the data. Next, we utilize the python package lmfit to fit both a single Gaussian and multi-Gaussian model to the continuum-subtracted emission line. We allow the multi-Gaussian model to consist of up to five components, where each Gaussian component is constrained by the width of the wavelength dependent MIRI instrument LSF and the results of the initial single-Gaussian fits. We select the model with the lowest Bayesian inference criteria (BIC) as the best-fit model. An example fit to [Fe II]5.34 m is shown in the left panel of Figure 2. We do not ascribe any physical interpretation to the individual Gaussian components, instead, we use them to accurately describe the emission-line profile from which we measure the flux, peak velocity, and . The of each emission-line is corrected for the width of the MIRI/MRS line spread function (LSF) at the corresponding wavelength, given by
| (1) |
We use the MIRI MRS LSF width given by Argyriou et al. (2023): , where is the speed of light, and 4603 - 128.
Errors on derived quantities are determined from a Monte Carlo (MC) simulation with Gaussian noise added to each pixel based on the standard deviation of the pixels in the continuum windows. The median standard deviation in the continuum pixels is 4 the formal flux errors provided by the pipeline. Emission-line detections are determined if the integrated flux of the best single-Gaussian emission-line model is above a 5 threshold. 5 upper limits are provided for lines without clear detections. We adopt a lower limit on errors for any wavelength dependent measurement equal to the wavelength calibration error of 30 km s-1 provided in 2.2. The derived line properties and their associated errors are given in Table 2.
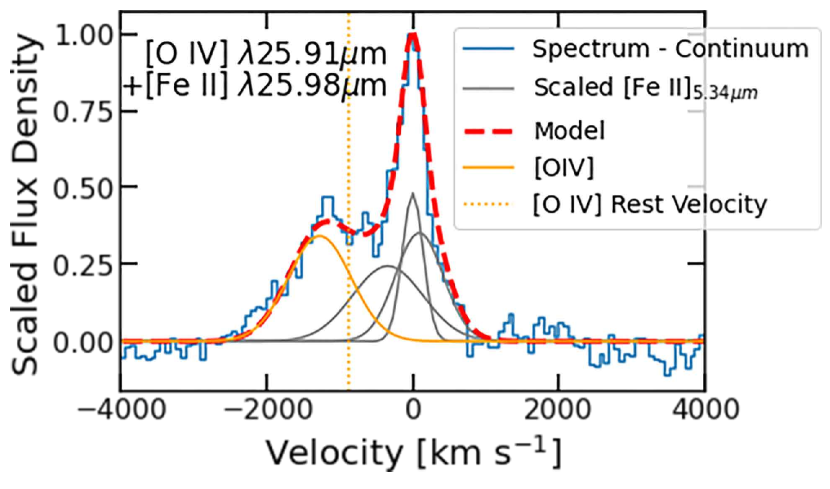
Two key lines of interest for tracing AGN activity are the high-IP lines (IP 50 eV) [Ne V]14.32 m and [O IV]25.91 m. However in both our ReveaLLAGN targets, these lines are each blended with a neighboring low-IP line (IP . Specifically, [Ne V]14.32 m is blended with the [Cl II]14.36 m emission line, while [O IV]25.91 m is blended with the [Fe II]25.98 m emission line. We deblend the features using a constrained multi-Gaussian model; the low-IP component is fixed to be a scaled version of the [Fe II]5.34 m line (Figure 2), an isolated low-IP line with high signal-to-noise. We then allow lmfit to fit the [Ne V]14.32 m and [O IV]25.91 m emission with a single Gaussian component. To capture the full uncertainty of this measurement we fit the [Fe II]5.34 m in each iteration of the MC process before constraining the [Ne V]14.32 m and [O IV]25.91 m models.
3.2.2 Constructing Emission Line Maps
Outside the nucleus, many lines have low signal-to-noise ratios, making the multi-Gaussian method we use for the nuclear spectrum less robust. We therefore simplify the Gaussian fitting process used for the nuclear spectra described above by limiting the Gaussian model to a single Gaussian component. The emission-line flux is calculated by measuring the area under the best-fit Gaussian model, while velocity is determined by calculating the displacement between the centroid of the best-fit Gaussian model and the rest wavelength of the emission line. For the blended high-IP features (e.g. Fig. 2, right), we attempted to deblend them pixel-by-pixel using two-Gaussian fits, but found no significant detection of the [Ne V]14.32 m and [O IV]25.91 m emission beyond the central few spaxels due to a combination of low S/N and perhaps the nuclear concentration of these lines. We calculate errors on the flux and velocity using a Monte Carlo simulation as above, and use a 5 detection threshold, below which we find our Gaussian fits don’t characterize the data well. We discuss the resulting line maps in the Section 4.2.1.
To investigate the ionizing mechanisms of our emission lines, we quantify the spatial extent of the emission region in our line maps by measuring the spatial FWHM () of prominent emission lines. We do this by creating a contour at 50% of the peak flux and calculate 2 the median radius from the peak flux to the contour line. We correct the measured for the MIRI/MRS PSF, which varies by a factor of five over the MIRI wavelength range. Using the FWHM of the MIRI/MRS PSF (FWHMMRS) taken from Argyriou et al. (2023) we get:
| (2) |
4 Results
4.1 Nuclear Region Emission Line Analysis
4.1.1 Variations with Ionization Potential
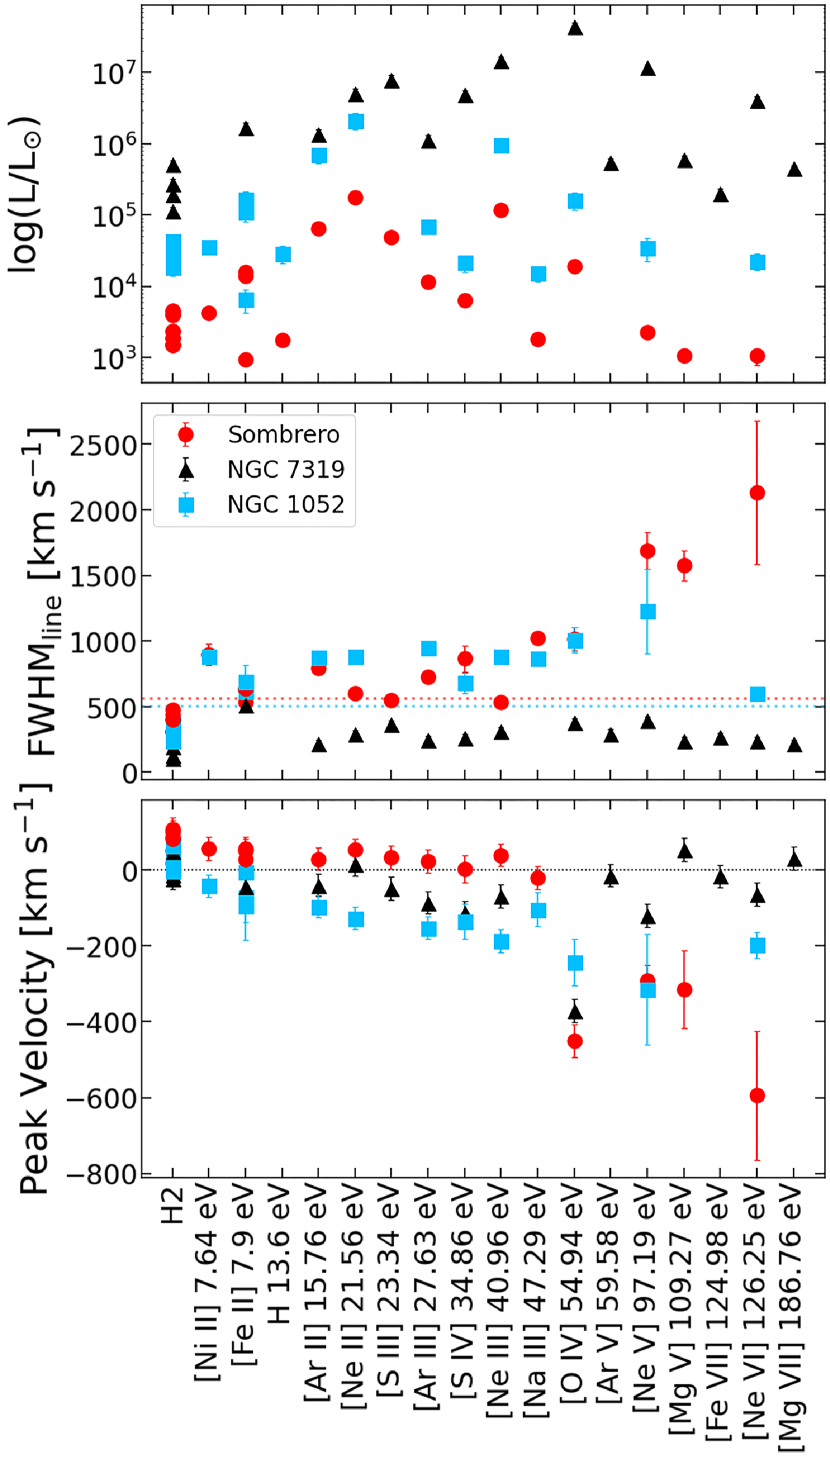
In Figure 3 we show the nuclear emission-line properties in our two ReveaLLAGN targets, as well as NGC 7319, ordered by their IP to search for systematic trends. The top panel shows the line luminosity and we find the most luminous detected lines in Sombrero and NGC 1052 are [Ne II]12.81 m followed by [Ne III]15.56 m which have IPs of 21.56 and 40.96 eV respectively, while in NGC 7319 the [O IV]25.91 m line (IP54.94 eV) is the most luminous line. More generally, NGC 7319 shows overall higher luminosity in all lines compared to Sombrero and NGC 1052, with the relative luminosity increasing for the higher IP lines.
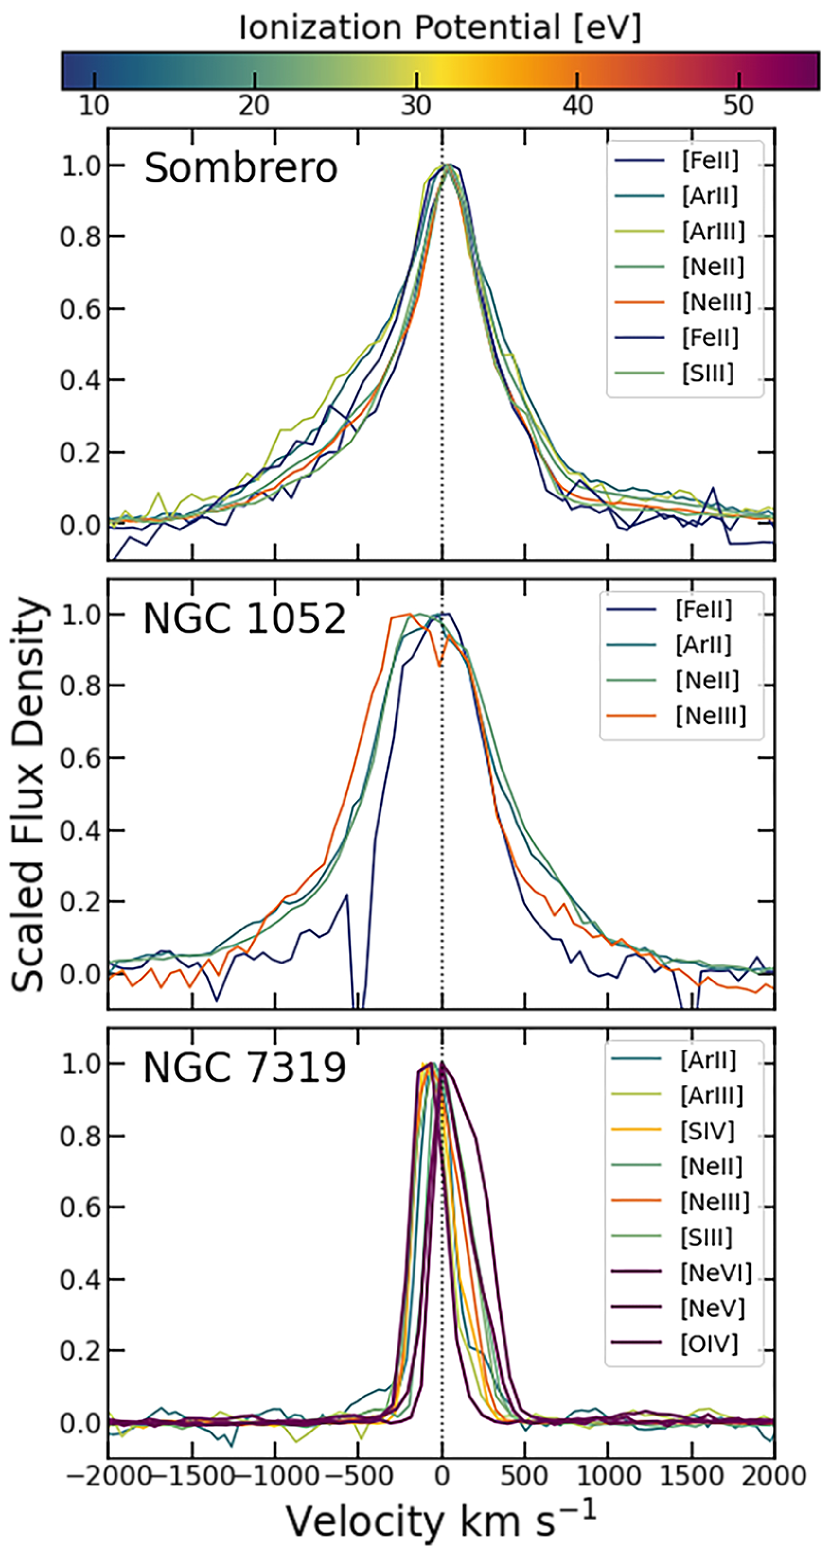
The middle panel of Figure 3 shows the (see equation 1) of each line as a function of IP. These values are derived from the best-fit multi-Gaussian model to the nuclear emission lines (see Section 3.2.1). The red and blue dashed lines represent arcsecond-level central velocity dispersions for Sombrero and NGC 1052 (Ho et al., 2009) translated to a FWHM. The emission lines in Sombrero and NGC 1052 are visibly broader than those in NGC 7319 (as can be seen in Figure 1). Specifically, in NGC 7319 the lines have 200 km s-1 regardless of IP. Meanwhile in Sombrero and NGC 1052, all detected lines are significantly wider, where the broadest lines have 1000 km s-1. A clear trend is also seen with IP in Sombrero with the higher IP lines having significantly larger values. A similar trend is seen in NGC 1052 though with the [Ne VI]7.65m emission feature being notably narrower than other high-IP lines.
=5cm {rotatetable}
| Galaxy | Line | WavelengthaaRest wavelengths from NIST. | IPbbIonization potential energy from NIST. | Transition | Flux | Flux Err | Peak Vel | Peak Vel Err | FWHMline | FWHMline Err | S/N | Warning |
|---|---|---|---|---|---|---|---|---|---|---|---|---|
| Sombrero | [Fe II] | 5.340 | 7.90 | 4F-a 6D | 0.488 | 0.004 | 50 | 30 | 540 | 30 | 94.5 | 0 |
| Sombrero | H2 | 5.448 | 15.37 | (12-10)O(9) | 0.009 | – | – | – | – | – | 0.0 | 0 |
| Sombrero | [Mg VII] | 5.504 | 186.76 | 3P2-3P1 | 0.020 | – | – | – | – | – | 1.7 | 0 |
| Sombrero | H2 | 5.511 | 15.37 | (0-0)S(7) | 0.083 | 0.003 | 110 | 30 | 310 | 30 | 25.8 | 0 |
| Sombrero | [Mg V] | 5.608 | 109.27 | 3P1-3P2 | 0.038 | 0.004 | -310 | 100 | 1580 | 110 | 7.9 | 0 |
| Sombrero | H2 | 6.109 | 15.37 | (0-0)S(6) | 0.053 | 0.005 | 20 | 30 | 320 | 160 | 12.5 | 0 |
| Sombrero | [Ni II] | 6.636 | 7.64 | 2 D-2 D | 0.150 | 0.004 | 60 | 30 | 900 | 80 | 35.2 | 0 |
| Sombrero | [Fe II] | 6.721 | 7.90 | 4F-a 6D | 0.033 | 0.003 | 60 | 30 | 620 | 50 | 9.5 | 0 |
| Sombrero | H2 | 6.909 | 15.37 | (0-0)S(5) | 0.159 | 0.003 | 100 | 30 | 400 | 30 | 49.9 | 0 |
| Sombrero | [Ar II] | 6.985 | 15.76 | 2 P-2 P | 2.320 | 0.007 | 30 | 30 | 800 | 30 | 370.5 | 0 |
| Sombrero | [Na III] | 7.318 | 47.29 | 2 P-2 P | 0.064 | 0.003 | -20 | 30 | 1020 | 40 | 20.8 | 0 |
| Sombrero | H | 7.458 | 13.60 | Pfund-alpha | 0.063 | 0.003 | 130 | 30 | 1130 | 30 | 18.5 | 0 |
| Sombrero | [Ne VI] | 7.652 | 126.25 | 2P-2P | 0.037 | 0.010 | -590 | 170 | 2140 | 550 | 6.7 | 0 |
| Sombrero | H2 | 8.026 | 15.37 | (0-0)S(4) | 0.053 | 0.001 | 50 | 30 | 440 | 30 | 32.7 | 0 |
| Sombrero | [Ar III] | 8.991 | 27.63 | 3P1-3P2 | 0.403 | 0.007 | 20 | 30 | 730 | 50 | 89.3 | 0 |
| Sombrero | [Fe VII] | 9.527 | 124.98 | 3F3-3F2 | 2.195 | – | – | – | – | – | 0.1 | 0 |
| Sombrero | H2 | 9.665 | 15.37 | (0-0)S(3) | 0.140 | 0.002 | 90 | 30 | 400 | 30 | 58.0 | 0 |
| Sombrero | [S IV] | 10.510 | 34.86 | 2P-2P | 0.222 | 0.006 | 0 | 40 | 870 | 100 | 31.8 | 0 |
| Sombrero | H2 | 12.278 | 15.37 | (0-0)S(2) | 0.042 | 0.002 | 60 | 30 | 530 | 40 | 16.6 | 1 |
| Sombrero | H | 12.367 | 13.60 | Humph-alpha | 0.050 | 0.004 | -130 | 80 | 1670 | 190 | 15.7 | 1 |
| Sombrero | [Ne II] | 12.814 | 21.56 | 2P-2P | 6.317 | 0.020 | 50 | 30 | 600 | 30 | 757.2 | 0 |
| Sombrero | [Ar V] | 13.102 | 59.58 | 3P1-3P0 | 0.004 | – | – | – | – | – | 4.0 | 0 |
| Sombrero | [Ne V] | 14.322 | 97.19 | 3P-3P1 | 0.080 | 0.004 | -290 | 40 | 1690 | 140 | 32.7 | 0 |
| Sombrero | [Cl II] | 14.368 | 12.97 | 3P1-3P2 | – | – | – | – | – | – | 13.3 | 3 |
| Sombrero | [Ne III] | 15.555 | 40.96 | 3P1-3P2 | 4.101 | 0.015 | 40 | 30 | 540 | 30 | 556.2 | 0 |
Note. — The complete table is presented in the online version of the Astrophysical Journal. Here we present the first few rows to show its form and content. The measured quantities provided here are derived from the multi-component Gaussian fits described in Section 3.2.1. We define the line as detected if the integrated flux of a best-fit single-Gaussian model has a ; upper limits are provided for undetected emission lines. The “Warning” column identifies issues with the spectra (blended feature, bad pixel, etc). 0 good fit; measurements reported. 1 blended/possibly blended features based on visual inspection; measurements reported. 2 unacceptable spectra quality; no measurements to report. 3 no measurements to report due to deblending procedure (Section 3.2.1, Figure 2).
Finally, the bottom panel of Figure 3 shows the peak velocity of the emission lines as a function of IP. The peak velocity is measured from our best-fit multi-Gaussian models and we see distinct differences between the galaxies here. For NGC 7319, the peak velocities are quite close to zero at all IP, which some slightly blue-shifted lines (50 km s-1) at intermediate IPs. The exception is the [O IV] line, which shows a significant blue-shift. We caution that this line is one of the longest wavelength lines we have; the wavelength calibration is less accurate at long wavelengths, but is still estimated to be 30 km s-1 by Argyriou et al. (2023); this line is also among the most blue-shifted lines in Sombrero and NGC 1052.
For Sombrero, the high-IP lines are almost all significantly blueshifted (greater than 3 from zero), while the lower IP lines and H2 lines show a slight redshift. The redshift of the H2 lines in Sombrero (median Peak Velocity of 56 km s-1) may indicate that our systemic velocity taken from HI measurements (de Vaucouleurs et al., 1991) is offset; if this were the case most of the low- and mid-IP lines would show a modest blue-shift with a general trend of larger blue-shift with higher IP. In NGC 1052, the blueshift in the highest IP lines are weaker, but there is also a sign of blue-shifted emission even at lower IP. The blue-shifted emission could be due to outflows, which we discuss in detail in Section 5.3.
4.1.2 Detailed Nuclear Line Profiles
The high spectral resolution of JWST lets us resolve line widths and look at the detailed shapes of emission lines. Above we found that the high-IP lines show broad, often blue-shifted emission lines, and here we look in more detail at the shapes of the lines with the highest signal-to-noise ratios (S/N 50). Figure 4 shows these lines in each galaxy centered on their expected velocity. Looking at each galaxy, these strong lines show remarkably consistent line profiles between different lines suggesting a common physical origin. However, significant differences are seen between galaxies, with Sombrero having a notably asymmetric line profile with blue wings reaching 1000 km s-1, while NGC 1052 and NGC 7319 show more symmetric lines. The strong asymmetry in Sombrero likely indicates the presence of an outflow, which we will discuss in more detail in Section 5.3. The narrower lines in NGC 7319 relative to the other two galaxies are clearly visible as well. We note that the highest IP lines in NGC 1052 and Sombrero are not high enough S/N to examine their line profiles in detail (as well as blending issues in a couple lines) .
4.2 2-D Emission Line Information: Line Maps & FWHM
4.2.1 Flux and Velocity Maps
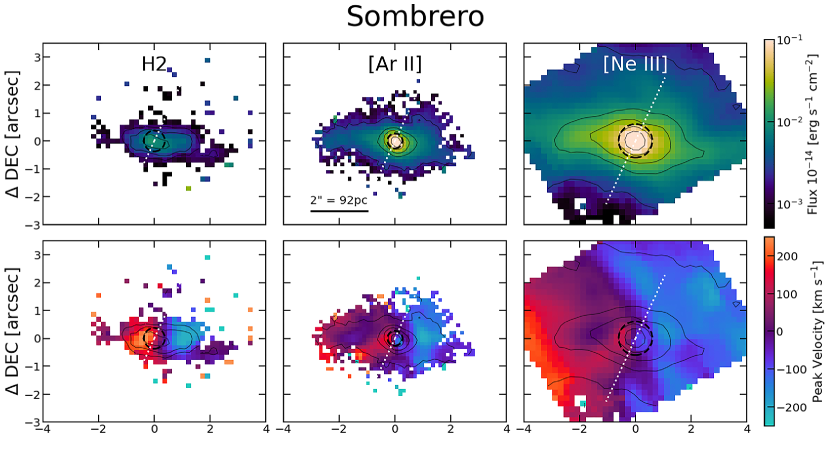
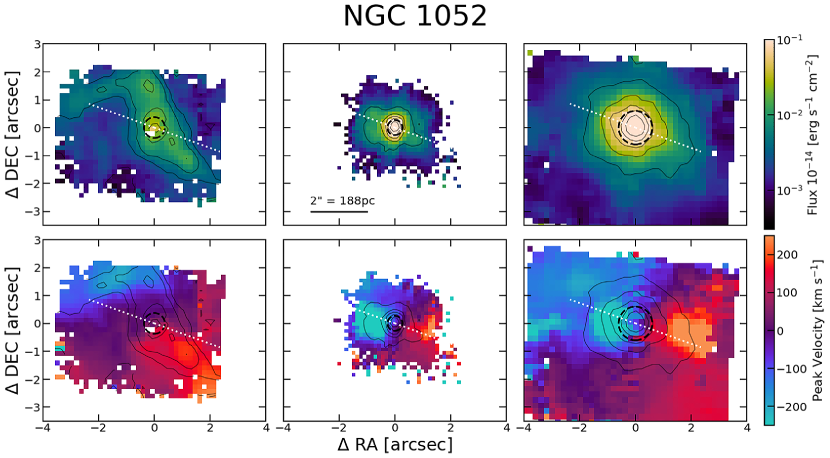
Figure 5 shows flux and velocity maps for three lines in both Sombrero and NGC 1052. These are created using the single Gaussian fitting method described in Section 3.2.2. Three lines are shown for each galaxy; a relatively strong molecular hydrogen line at 9.66 m, the [Ar II] line at 6.98 m (IP: 15.76 eV), and the [Ne III] line at 15.56 m (IP: 40.96 eV). These three lines span a wide range of IP and critical densities and thus likely trace very different density gas (e.g. Stern et al., 2014). The highest IP lines are unresolved, and therefore compact, showing detectable emission only in the central few pixels. Although we don’t show velocity dispersion maps here, we discuss them below.
In the Sombrero galaxy, all three lines have similar morphologies, extended East-to-West with blue-shifted emission towards the West. The molecular hydrogen emission has no clear point-like emission and is red-shifted relative to the systemic velocity in the nuclear region; this redshift is also seen in several other H2 and low IP lines in Sombrero(Figure 3). As discussed in the previous subsection, this may be due to the adopted systemic velocity for Sombrero. The velocity dispersion seen in molecular hydrogen emission maps is quite homogeneous with values up to 240 km s-1, comparable to the measured nuclear stellar velocity dispersion (241 km s-1; Ho et al., 2009). Clear point-like emission is seen in both [Ar II]6.98m and [Ne III]15.56 m; this emission appears to be more concentrated in [Ar II]6.98m than [Ne III]15.56 m, however this may be due simply to the lower resolution at these wavelengths; we examine this in more detail below in Section 4.2.2. Filaments can be seen extending out to the North/West from the nuclear region in the [Ne III]15.56 m flux map. The velocity maps of both ions shown are similar to the H2, but show complex velocity fields e.g. a patch of blue-shifted emission 2″ East of the nucleus. The velocity dispersion in [Ar II]6.98m and [Ne III]15.56 m both peak in the nuclear region with a maximum velocity of about 500 km s-1.
In NGC 1052, the H2 emission-line map differs significantly from the Ar II]6.98m and [Ne III]15.56 m emission. The H2 emission-line flux maps have a weak peak in the nuclear region and extend north-east to south-west, similar in morphology to the CO gas seen with ALMA in (Kameno et al., 2020), which they interpret as a circumnuclear disk. The velocity maps of H2 are blue-shifted in the north-east and red-shifted to the south and west. Velocity dispersion is patchy and peaks at 275 km s-1, a bit higher than the Ho et al. (2009) central stellar velocity dispersion of 215 km s. The [Ar II]6.98m and [Ne III]15.56 m emission-line flux maps are strongly peaked in the nucleus and share a roughly concentric radial profile. Their velocity maps exhibit a heavily blue-shifted region directly east of the nuclear region and a heavily red-shifted region directly west with V 300 km s-1 – these regions are roughly aligned with the orientation of the compact radio jet (Kadler et al., 2004). The velocity increases in these heavily red and blueshifted regions up to 590 km s-1.
4.2.2 Spatial FWHM Measurements
Following the methodology outlined in Section 4.2.1, we determine FWHMspat,corr, characterizing the PSF-corrected spatial extent, for six emission lines in Sombrero and four emission lines in NGC 1052. These lines are at low- and mid- IP and have sufficient signal-to-noise to enable the measurement. The FWHMMRS, FWHMspat and FWHMspat,corr measurements are provided in Table 3. Overall, we find that the lines in NGC 1052 are either unresolved or just barely spatially resolved, with the [Ne III] line having the largest spatial extent (FWHM or 28.2 pc). On the other hand, all the emission lines in Sombrero are spatially resolved, with FWHM or 8 pc, and no clear trend with IP. We note that while FWHMspat,corr estimates were not possible for the high-IP coronal lines ([O IV]25.91 m and [Ne V]14.32 m), these lines do appear to be quite compact in both galaxies. In both galaxies, the [Ne III]15.56 m emission is more extended than the [Ne II]12.81 m emission, a somewhat surprising result that we discuss further in Section 5.2.
| Feature | Rest Wavelength | IP | FWHMMRS | Sombrero | NGC 1052 | ||||
|---|---|---|---|---|---|---|---|---|---|
| FWHMspat | FWHMspat,corr | FWHMspat | FWHMspat,corr | ||||||
| (m) | eV | (arcsec) | (arcsec) | (arcsec) | (pc) | (arcsec) | (arcsec) | (pc) | |
| [Fe II] | 5.34 | 7.9 | 0.27 | 0.49 | 0.42 | 19.45 | 0.36 | 0.24 | 22.34 |
| [Ar II] | 6.99 | 15.76 | 0.31 | 0.35 | 0.17 | 7.87 | 0.33 | 0.12 | 10.35 |
| [Ar III] | 8.99 | 27.63 | 0.42 | 0.46 | 0.20 | 9.26 | 0.41 | –‡ | – |
| [Ne II] | 12.81 | 21.56 | 0.57 | 0.62 | 0.24 | 11.11 | 0.58 | 0.09 | 8.46 |
| [Ne III] | 15.56 | 40.96 | 0.63 | 0.70 | 0.31 | 14.35 | 0.69 | 0.30 | 28.22 |
| [S III] | 18.71 | 23.34 | 0.86 | 0.99 | 0.49 | 22.69 | 0.86 | –‡ | – |
Note. — The FWHM of the MRS PSF (FWHMMRS) is taken from Argyriou et al. (2023). We combine this with the measured spatial FWHM () via Equation 2 to calculate the corrected FWHM (). We only report the lines that we were able to spatially resolve in at least one galaxy. See Section 4.2.2 for details.
∗ FWHMspat measurement unavailable.
‡ Line is unresolved, FWHMspat FWHMMRS.
5 Discussion
In this section we present our results in the context of previous work. First, in section 5.1, we discuss the power of JWST in separating LLAGN from their host galaxies. Then in section 5.2, we compare the nuclear emission features from our LLAGN to AGNs of varying types, and end with section 5.3 by discussing evidence for outflows seen in the LLAGN spectra.
5.1 The Promise of JWST for Revealing LLAGN
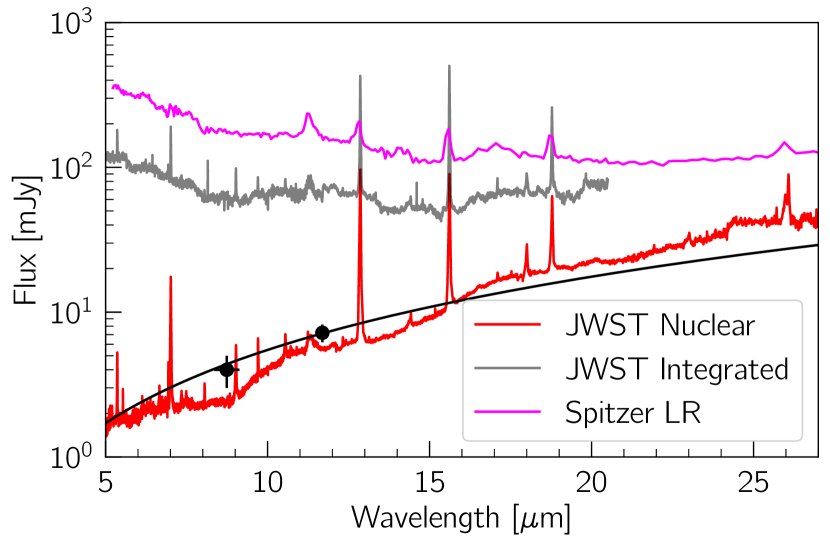
In Figure 6 we show a comparison of the extracted nuclear spectrum (see Section 3.1) in Sombrero to both the integrated flux in the JWST data cube, and the Spitzer LR spectrum from the SINGS survey (Kennicutt et al., 2003). The integrated flux was calculated by summing all spaxels in each MIRI data cube. Since the FoV varies between each channel, we normalized the integrated spectrum to channel 4. In this channel the FoV measures corresponding to a physical scale of pc2 at the distance of Sombrero. Note that the integrated spectrum is not shown at the longest wavelengths due to sky subtraction issues as discussed in Gasman et al. (2023).
The nuclear emission clearly shows a SED that increases with wavelength, while the integrated data cube has a very different SED. Just 1% of the flux in the JWST integrated cube is coming from the nuclear component at 5 m, while the nuclear compoment is 10% of the flux by 20 m. This rising nuclear SED is consistent with two previous photometric measurements of Sombrero at high resolution (black points/line in Figure 6) and within the expectations of LLAGN spectra (Fernández-Ontiveros et al., 2023). However, the information available in the nuclear spectrum is clearly far richer than was available with previous ground-based photometric measurements.
The two larger scale spectra from both Spitzer and our integrated JWST data in Figure 6 show very different spectral shapes that are dominated by galaxy emission. The shape of these two spectra are in good agreement despite the different apertures suggesting a roughly constant SED for the galaxy component. Overall, the data show that even in Sombrero, the faintest target in the ReveaLLAGN survey, we can cleanly extract the LLAGN emission and separate it from its surrounding galaxy. Although the primary goal of this paper is analysis of the emission lines in our ReveaLLAGN MIRI spectra, the continuum shape also encodes information on the emission mechanisms of these LLAGN. High angular resolution work on LLAGN has consistently shown jet dominated emission to follow a broken power-law continuum (Ho et al., 1996; Chary et al., 2000; Prieto et al., 2016; Fernández-Ontiveros et al., 2023) which is consistent with self-absorbed synchrotron emission characteristic of compact jet emission (Marscher & Gear, 1985).
While Figure 6 shows broad agreement with a single power-law fit from Fernández-Ontiveros et al. (2023) over the MIRI wavelength range, there is also considerable complexity seen in the SEDs (Figure 1), with a clear inflection point in the Sombrero nuclear spectrum at 9 m. We also see a gradual flattening of the spectrum at long wavelengths in NGC 1052, which is consistent with the turnover of the broken power below 20 µm and the nuclear fluxes at lower frequencies (Fernández-Ontiveros et al., 2019). The complexity of the continuum shapes we see in the MIRI spectra suggest additional information may be available from detailed fitting of the continuum that includes the contributions of broad silicate features (Fernández-Ontiveros et al., in prep).
5.2 The Emission Lines of LLAGN: Comparison to Previous Work
In this subsection, we focus on comparing the nuclear emission-line luminosities and ratios to previous measurements of typically much higher luminosity AGN.
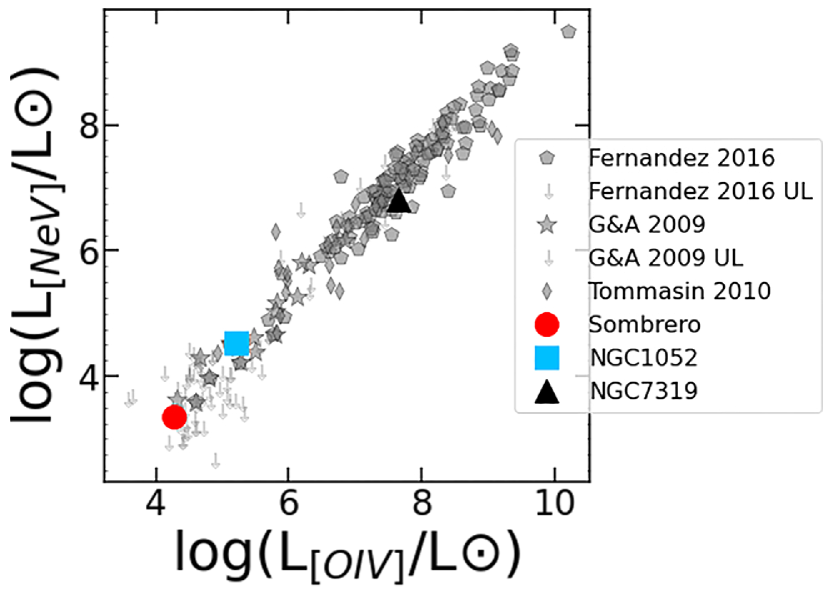
Figure 7 compares the luminosities of the two high-IP lines detected in all three galaxies, [Ne V]14.32 m and [O IV]25.91 m to literature measurements primarily from Spitzer (Goulding & Alexander, 2009; Tommasin et al., 2010; Fernández-Ontiveros et al., 2016). We note that these data have much lower physical resolution than our nuclear JWST data, and thus contamination of the AGN spectra by galaxy light is likely significant in some cases, especially for lower-IP lines discussed below that are excited by sources other than the AGN. NGC 7319, as expected, has luminosities in both lines very typical of previously measured AGN, while Sombrero has the lowest luminosities of both lines compared to any previous measurements. While, Sombrero and NGC 1052 stand out as being very low luminosity detections, they both follow the tight, nearly linear correlation between these two coronal lines that is seen across a wide range of AGNs (Goulding & Alexander, 2009).
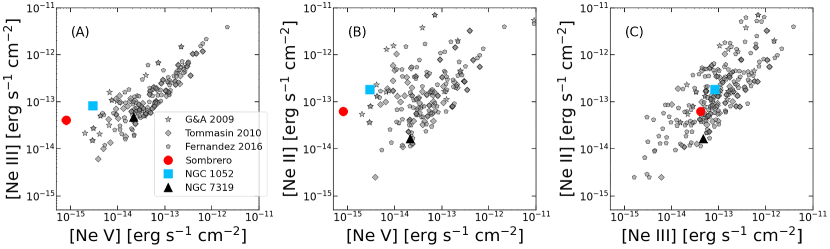
Comparing ionized states of a particular atom enables us to study the ionization structure within an AGN more clearly. In this regard, the mid-IR is particularly valuable as it contains multiple neon emission lines at different ionizations. In Figure 8 we compare the flux values of [Ne II]12.81 m, [Ne III]15.56 m, and [Ne V]14.32 m from our sample to previous surveys. Comparing line fluxes (rather than luminosities) ensures that correlations seen are the result of excitation differences, and not caused by observing sources at a range of distances (which can create false correlations between line luminosities).
The left panel comparing [Ne V]555For the rest of the discussion, we will refer to [Ne II]12.81 m, [Ne III]15.56 m and [Ne V]14.32 m as [Ne II], [Ne III] and [Ne V], respectively. and [Ne III] shows a roughly linear correlation that gets tighter with increasing [Ne V] flux. Sombrero has significantly weaker [Ne V] than other sources with similar [Ne III] flux, and many of the lower luminosity sources including NGC 1052 also scatter towards fainter [Ne V] flux relative to the relation seen at higher line fluxes. Thus Sombrero is an outlier, but follows the qualitative trend of lower [Ne V] luminosity that are seen in other lower luminosity AGN. The middle panel comparing the flux of [Ne II] to [Ne V] shows similar results to the left panel, but with a much looser relation seen between the lines at high line fluxes. Finally the right panel shows that the relative [Ne II] and [Ne III] flux fall within the range of previous measurements in all three galaxies. This suggests that these lower IP lines have values typical of higher luminosity AGN, and it is the [Ne V] line that is weaker than in other sources.
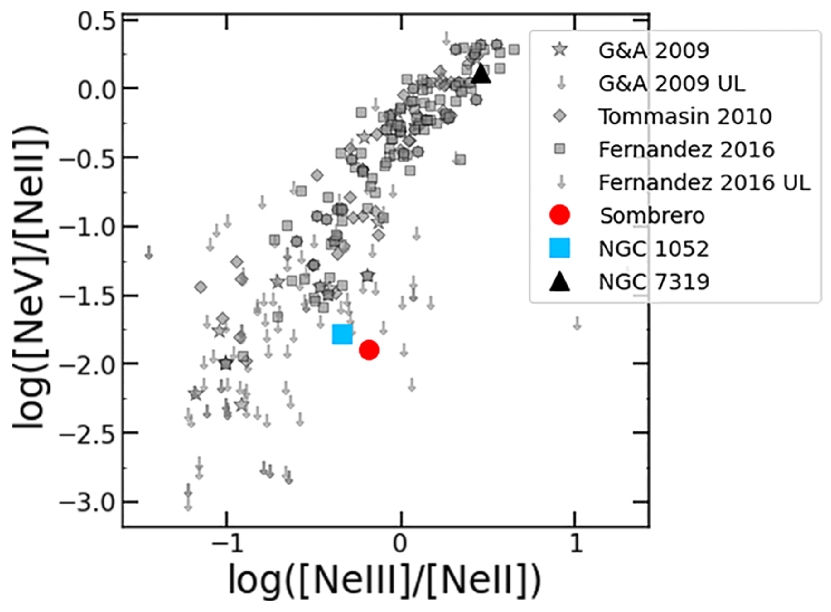
We combine the information on all three neon lines in Figure 9, which compares the ratios of [Ne V]/[Ne II] and [Ne III]/[Ne II]. The ratio of [Ne V] to [Ne II] has been employed as a diagnostic tool in IR spectra to assess the contribution of AGN activity (Goulding & Alexander, 2009; Sajina et al., 2022). Since [Ne V] can only be formed through AGN processes, while [Ne II] can arise from both AGN and non-AGN mechanisms, this ratio helps determine the presence and influence of AGN. We emphasize again, that the literature data here have low spatial resolution, and therefore any line emission in the central kiloparsecs of the galaxies contain significant contamination from the host galaxy. NGC 1052 and especially Sombrero fall well below the main trend line found in Figure 9 and into a region only populated with upper limits of [Ne V] from other surveys.
We can get a sense of the level of galaxy contamination in our own JWST spectra by comparing the extent of emission features with different IP and in Section 4.2.2 we find that the of the [Ne II] and [Ne III] emission lines are quite compact. We would expect [Ne II] be more spatially extended than higher IP lines, including [Ne III], since [Ne II] lines come predominantly from star formation. This is not what we find in either source; in fact [Ne II] is found to be more compact than [Ne III] in both NGC 1052 and Sombrero. The fact that [Ne II] emission is compact doesn’t strictly mean that it comes from the AGN, it could simply mean that any star formation is also compact/unresolved. While Prieto et al. (2014) reports the presence of extended H emission perpendicular to the jet in Sombrero, which may be associated with star formation, they find no conclusive evidence of star formation, from UV to IR, within parsecs of the center of Sombrero, nor in NGC 1052 (Prieto et al., 2021). A lack of excitation from star formation is consistent with the absence of any PAH emission in the nuclear spectra of NGC 1052 and only a weak PAH signature at 11.3 m in Sombrero (Fig. 1). This lack of evidence for star formation suggests that the nuclear line ratios from our targets (Figure 9) are not significantly contaminated by emission from star formation, and that the outlier status of our two galaxies are the result of very low luminosity detections of [Ne V] made possible by the spatial and spectral resolution of JWST. The differences we see then in Figure 8 are due to excitation differences from the AGN accretion structure. This difference can be explained by either a change in SED or very low ionization parameters that result in a deficiency of the high energy photons (100 eV) needed to excite the line. This conclusion is consistent with previous work on LLAGNS (Ho, 2008; Eracleous et al., 2010) including photoionisation models for compact jet synchrotron emission (Fernández-Ontiveros et al., 2023), shock excitation models (Dopita et al., 2015), and the expectations of a central engine with advection dominated accretion flows (Nemmen et al., 2014). We will be able to test this result and compare this to models for AGN ionization once the full ReveaLLAGN sample is available (Fernández-Ontiveros et al., in prep).
5.3 Outflows in NGC 1052 and Sombrero
In Section 4.1, we identify the following emission-line features in NGC 1052 and Sombrero:
-
•
an increase in line widths with IP
-
•
an increase in blue-shifted emission with IP
-
•
broad emission in the weakly-detected high-IP and coronal lines, and
-
•
prominent blue wings in the high signal-to-noise lines of Sombrero.
The trend of increasing line width and IP was originally attributed to cloud stratification–the coronal lines are emitted from denser clouds closer to the central engine which are subject to more intense ionizing flux (Filippenko & Halpern, 1984; Filippenko, 1985; Filippenko & Sargent, 1988; Appenzeller & Oestreicher, 1988). Recent work has confirmed that many Seyfert galaxies, regardless of brightness or AGN type, show an increase in both line FWHM and line blue-shifting with increasing IP (e.g., Rodríguez-Ardila et al., 2006, 2011). Furthermore, there are known correlations between blue-shifted emission and both increasing IP in coronal lines and increasing line width in the [O III] line in narrow-line Seyfert 1 galaxies (e.g. Komossa et al., 2008). While there is clear evidence that coronal-line emission and their profiles are driven mainly by photoionization from the AGN (e.g., Nussbaumer & Osterbrock, 1970; Korista & Ferland, 1989; Oliva et al., 1994; Pier & Voit, 1995; Rodríguez-Ardila et al., 2011), other work has demonstrated that outflows are needed to fully explain the observed emission (e.g., Appenzeller & Oestreicher, 1988; Erkens et al., 1997; Wilson & Raymond, 1999; Rodríguez-Ardila et al., 2006, 2011; Müller-Sánchez et al., 2011). In fact, the blue-shifted emission even at mid-IPs could trace out-flowing material closer to the AGN than the narrower emission, with the line asymmetry being caused by red-shifted emission being absorbed along the line-of-sight (Komossa et al., 2008).
Given the known importance of outflows and shocked emission in LINERs (e.g., Ho, 2008; Trump et al., 2011; Molina et al., 2018), we conclude that the emission-line features identified above are indicators of outflows for both Sombrero and NGC 1052. We discuss other evidence and the possible origins of the outflows in NGC 1052 and Sombrero below.
5.3.1 Previous Evidence of Outflows in NGC 1052
Previous work has demonstrated the presence of AGN-related outflows in NGC 1052 on multiple spatial scales. Optical IFS studies of NGC 1052 show evidence for an outflow from the AGN on larger scales (Sugai et al., 2005; Dopita et al., 2015; Dahmer-Hahn et al., 2019; Cazzoli et al., 2022). The outflow is roughly aligned with the radio jet (Claussen et al., 1998; Kadler et al., 2004), with a PA of 70∘ and is generally in good agreement with the velocity structures seen in Figure 5. These studies also find a broad H and H component with a width of 3000 km s-1; this is significantly broader than the widths of the mid and high-IP lines we see here.
Similarly, on much smaller spatial scales, Pogge et al. (2000), Walsh et al. (2008) and Molina et al. (2018) found evidence for outflows in HST data. Both Pogge et al. (2000) and Walsh et al. (2008) found evidence for strong outflows as well as ionized regions associated with jet-like features. Meanwhile, Molina et al. (2018) demonstrated that shocked emission likely originating from these outflows are the dominant power source at just 20 pc outside of the galaxy center . Similar to Dopita et al. (2015), Cazzoli et al. (2022) and this work, Molina et al. (2018) found that the shock-dominated, off-nuclear emission lines had widths consistent with km s-1. They also found broad H and H emission in the unresolved AGN spectrum, with km s-1. We note that a majority of the emission seen in Molina et al. (2018) lies within the JWST nuclear aperture used in this work.
5.3.2 Previous Evidence of Outflows in Sombrero
Given the low accretion rate and the presence of a small-scale radio jet, Sombrero likely has strong radio outflows (Meier, 2001; Fender & Belloni, 2004). In fact, Walsh et al. (2008) determined that while Sombrero has organized motion within the central 05 consistent with an overall rotation pattern, there are significant irregularities that could be caused by outflows. Pogge et al. (2000) also found evidence of turbulent motion via spiral-like wisps in the narrow-band H+[N II] imaging. Emsellem & Ferruit (2000) further identified a strong velocity gradient near the galaxy center, and noted that the kinematics of the gas within the central 1″ was decoupled from the gas in the spiral wisps. These East-West oriented wisps are not well-aligned with the inner radio jet described by Hada et al. (2013) and Mezcua & Prieto (2014), which runs along the North-South axis and is oriented towards our line of sight. We note that the presence of broad H is unclear, with two analyses of the same HST spectra coming to different conclusions (Walsh et al., 2008; Hermosa Muñoz et al., 2020). Mason et al. (2015) found that the near-infrared SED appears to be similar to that of other type 2 LINERs, and Gallimore et al. (2006) and Li et al. (2011) also found evidence for larger-scale outflows in Sombrero using radio and X-ray data, respectively.
5.3.3 Origins of Outflows
Here we consider two possible models for the outflows seen in NGC 1052 and Sombrero. We note that radiation pressure-driven outflows do not significantly contribute to the outflows seen in LLAGN (Meena et al., 2023), and therefore we do not discuss them below. As a reminder, we note that both of these objects are classified as LINERs with low Eddington ratios given in Table 1. They also both have detected small-scale radio jets (Kadler et al., 2004; Hada et al., 2013).
Winds Launched from the RIAFs:
Unlike traditional cold, thin-disk models, RIAFs occur when the accretion rate is sufficiently low that the inner disk puffs up and becomes a hot, advection-dominated accretion flow (Narayan & Yi, 1995; Blandford & Begelman, 1999; Yuan & Narayan, 2014). Previous empirical studies showed that radio outflows from AGNs, including those with thin-disk accretion flows and RIAFs, increase in strength as the accretion rate decreases (e.g., Ho, 2002; Meléndez et al., 2010). RIAFs extending to large scales can eliminate broad line emission (Elitzur & Ho, 2009) and the “big blue bump” associated with thin-disk accretion (e.g., Trump et al., 2011); the corresponding lack of UV emission and broad line features in most LINER AGN (e.g., Nicastro et al., 2003; Ho, 2008) suggests they may be powered by RIAFs.
The strong wind along the polar or jet direction in RIAFs that was predicted by magnetohydrodynamical numeral simulations (Yuan et al., 2012, 2015) has been observationally confirmed in recent years (e.g. Wang et al., 2013; Cheung et al., 2016; Park et al., 2019; Shi et al., 2021). These energetic winds originate in the coronal region of the accretion flow, implying that higher-IP lines would experience more intense outflows, and thus likely have larger widths, consistent with the findings presented in Section 4.1. Given their low accretion rates (see Table 1), the absence of the “big blue bump” in both of their SEDs (Fernández-Ontiveros et al., 2012), and the lack of clear broad H emission in Sombrero (Walsh et al., 2008), it is likely that both NGC 1052 and Sombrero are powered by a RIAF. Therefore, we conclude that the energetic winds driven by the hot accretion flows in both LLAGNs likely contribute to the observed emission. However, we note that by their nature RIAFs do drive radio jets, and as such these winds may not be the sole explanation for the observed outflows.
Jet-Driven Outflows:
Jets associated with AGN accretion are known to drive outflows that create shocked emission and can regulate the star-formation rate in the galaxy (e.g., Silk & Rees, 1998; Weinberger et al., 2017; Davé et al., 2019). In fact, while we did not find any trends with IP in the nuclear spectra of NGC 7319, Pereira-Santaella et al. (2022) found that high-IP coronal-line emission is detected close to the hot spots of the known radio jet, which they conclude indicates the presence of a jet-driven outflow.
Due to their less luminous, lower-accretion rate engines, the shocked emission driven by jets or outflows can often dominate over photoionization at small distances from the nuclei in LLAGNs (Molina et al., 2018). Furthermore subparsec-scale radio jets occur more frequently in LINERs (Nagar et al., 2005), which could further indicate the presence of jet-driven outflows.
Recent work by Meenakshi et al. (2022) demonstrated that small-scale jets can produce large widths even in mid-IP lines like [O III] 5007, similar to the widths seen in our mid-IP lines studied here. They also conclude that similar widths can be seen in the different gas phases of the ISM, which appears to be somewhat qualitatively true for NGC 1052–the observed positive correlation between IP and FWHM in NGC 1052 in Figure 3 is much less pronounced than that in Sombrero. Furthermore, both Sugai et al. (2005) and Dopita et al. (2015) found evidence that the jet in NGC 1052 was interacting with the circumnuclear gas.
In both the RIAF- and jet-driven wind scenario, the orientation of the jet should impact the observable signatures. In Sombrero, modeling of VLBI data suggests the inner jet is oriented close to our line-of-sight (Hada et al., 2013), while in NGC 1052, the jet is oriented more in the plane of the sky (Kadler et al., 2004). This difference in jet orientation may be the reason that only Sombrero shows the blue-shifted emission in its nuclear spectrum, while the ionized emission-line maps in NGC 1052 show strong strong blue- and red-shifts oriented close to the jet axis (Figure 5). However, since both RIAF- and jet-driven winds will result in an outflow in the jet direction, a combination of SED modeling on the smallest scales with emission-line analysis like that presented here is likely required to resolve what drives the outflows in LLAGN.
6 Conclusions
This paper features the first observations of the ReveaLLAGN survey, a JWST project to characterize seven nearby LLAGN. We present MIRI/MRS data of the least and most luminous targets in our sample, Sombrero and NGC 1052. We compare these data to data of NGC 7319, a higher luminosity AGN. We characterize the numerous emission lines seen in the nuclear spectrum and create line maps across the MRS field of view for stronger lines.
We find the following results:
-
•
The resolution and sensitivity of JWST allows us to cleanly separate the AGN continuum and emission lines from the surrounding galaxy even in our least luminous target, Sombrero.
-
•
The ionized emission lines in both Sombrero and NGC 1052 are broad, and have widths that increase with increasing IP reaching FWHM1000km s-1. The highest IP lines (IP 50) show blue-shifted peak velocities with a median velocity of 423 km s-1 seen in Sombrero and 186 km s-1 in NGC 1052.
-
•
The highest signal-to-noise ionic lines in Sombrero with show a clear blue wing extending 1000km s-1 from the peak emission.
-
•
Sombrero has the lowest luminosity high-IP lines ([O IV] and [Ne V]) yet detected in any source. NGC 1052 also shows low luminosity in both these lines, and the relative luminosity of these lines follows the relation seen in more luminous AGN.
-
•
The [Ne V]14.32 m is weak relative to the [Ne II]12.81 m and [Ne III]15.56 m as compared to previously measured AGN. This does not appear to be due to galaxy contamination, and thus likely indicates a deficiency of high energy ionizing photons in these LLAGN.
Our full ReveaLLAGN dataset will include observations of seven nearby LLAGN with both the NIRSpec IFU and MIRI/MRS. We will present the nuclear spectra of these in an upcoming paper (Seth et al., in prep), as well as an analysis of their emission lines (Goold et al. in prep). We will also be modeling the continuum emission and emission lines from the ReveaLLAGN sample (Fernández-Ontiveros et al. in prep). The ReveaLLAGN spectra will be valuable in both identifying the unique features of LLAGN, and revealing the nature of the central engine in LLAGN.
References
- Appenzeller & Oestreicher (1988) Appenzeller, I., & Oestreicher, R. 1988, AJ, 95, 45, doi: 10.1086/114611
- Argyriou et al. (2023) Argyriou, I., Glasse, A., Law, D. R., et al. 2023, JWST MIRI flight performance: The Medium-Resolution Spectrometer, doi: 10.48550/arXiv.2303.13469
- Asmus et al. (2015) Asmus, D., Gandhi, P., Hönig, S. F., Smette, A., & Duschl, W. J. 2015, MNRAS, 454, 766, doi: 10.1093/mnras/stv1950
- Asmus et al. (2014) Asmus, D., Hönig, S. F., Gandhi, P., Smette, A., & Duschl, W. J. 2014, MNRAS, 439, 1648, doi: 10.1093/mnras/stu041
- Astropy Collaboration et al. (2018) Astropy Collaboration, Price-Whelan, A. M., Sipőcz, B. M., et al. 2018, AJ, 156, 123, doi: 10.3847/1538-3881/aabc4f
- Blandford & Begelman (1999) Blandford, R. D., & Begelman, M. C. 1999, MNRAS, 303, L1, doi: 10.1046/j.1365-8711.1999.02358.x
- Cazzoli et al. (2022) Cazzoli, S., Hermosa Muñoz, L., Márquez, I., et al. 2022, A&A, 664, A135, doi: 10.1051/0004-6361/202142695
- Chary et al. (2000) Chary, R., Becklin, E. E., Evans, A. S., et al. 2000, ApJ, 531, 756, doi: 10.1086/308486
- Cheung et al. (2016) Cheung, E., Bundy, K., Cappellari, M., et al. 2016, Nature, 533, 504, doi: 10.1038/nature18006
- Claussen et al. (1998) Claussen, M. J., Diamond, P. J., Braatz, J. A., Wilson, A. S., & Henkel, C. 1998, ApJ, 500, L129, doi: 10.1086/311405
- Croton et al. (2006) Croton, D. J., Springel, V., White, S. D. M., et al. 2006, MNRAS, 365, 11, doi: 10.1111/j.1365-2966.2005.09675.x
- Dahmer-Hahn et al. (2019) Dahmer-Hahn, L. G., Riffel, R., Ricci, T. V., et al. 2019, MNRAS, 489, 5653, doi: 10.1093/mnras/stz2453
- Davé et al. (2019) Davé, R., Anglés-Alcázar, D., Narayanan, D., et al. 2019, MNRAS, 486, 2827, doi: 10.1093/mnras/stz937
- de Vaucouleurs et al. (1991) de Vaucouleurs, G., de Vaucouleurs, A., Corwin, Herold G., J., et al. 1991, Third Reference Catalogue of Bright Galaxies
- Dopita et al. (2015) Dopita, M. A., Ho, I. T., Dressel, L. L., et al. 2015, ApJ, 801, 42, doi: 10.1088/0004-637X/801/1/42
- Dumont et al. (2020) Dumont, A., Seth, A. C., Strader, J., et al. 2020, ApJ, 888, 19, doi: 10.3847/1538-4357/ab5798
- Elitzur & Ho (2009) Elitzur, M., & Ho, L. C. 2009, ApJ, 701, L91, doi: 10.1088/0004-637X/701/2/L91
- Emsellem & Ferruit (2000) Emsellem, E., & Ferruit, P. 2000, A&A, 357, 111, doi: 10.48550/arXiv.astro-ph/0003167
- Eracleous et al. (2010) Eracleous, M., Hwang, J. A., & Flohic, H. M. L. G. 2010, ApJS, 187, 135, doi: 10.1088/0067-0049/187/1/135
- Erkens et al. (1997) Erkens, U., Appenzeller, I., & Wagner, S. 1997, A&A, 323, 707
- Eskew et al. (2012) Eskew, M., Zaritsky, D., & Meidt, S. 2012, AJ, 143, 139, doi: 10.1088/0004-6256/143/6/139
- Fender & Belloni (2004) Fender, R., & Belloni, T. 2004, ARA&A, 42, 317, doi: 10.1146/annurev.astro.42.053102.134031
- Fernández-Ontiveros et al. (2019) Fernández-Ontiveros, J. A., López-Gonzaga, N., Prieto, M. A., et al. 2019, MNRAS, 485, 5377, doi: 10.1093/mnras/stz716
- Fernández-Ontiveros et al. (2023) Fernández-Ontiveros, J. A., López-López, X., & Prieto, A. 2023, A&A, 670, A22, doi: 10.1051/0004-6361/202243547
- Fernández-Ontiveros et al. (2012) Fernández-Ontiveros, J. A., Prieto, M. A., Acosta-Pulido, J. A., & Montes, M. 2012, in Journal of Physics Conference Series, Vol. 372, Journal of Physics Conference Series, 012006, doi: 10.1088/1742-6596/372/1/012006
- Fernández-Ontiveros et al. (2016) Fernández-Ontiveros, J. A., Spinoglio, L., Pereira-Santaella, M., et al. 2016, ApJS, 226, 19, doi: 10.3847/0067-0049/226/2/19
- Filippenko (1985) Filippenko, A. V. 1985, ApJ, 289, 475, doi: 10.1086/162909
- Filippenko & Halpern (1984) Filippenko, A. V., & Halpern, J. P. 1984, ApJ, 285, 458, doi: 10.1086/162521
- Filippenko & Sargent (1988) Filippenko, A. V., & Sargent, W. L. W. 1988, ApJ, 324, 134, doi: 10.1086/165886
- Fouque et al. (1992) Fouque, P., Durand, N., Bottinelli, L., Gouguenheim, L., & Paturel, G. 1992, Catalogue of Optical Radial Velocities (Observatoire de Lyon)
- Gaia Collaboration et al. (2021) Gaia Collaboration, Brown, A. G. A., Vallenari, A., et al. 2021, A&A, 649, A1, doi: 10.1051/0004-6361/202039657
- Gallimore et al. (2006) Gallimore, J. F., Axon, D. J., O’Dea, C. P., Baum, S. A., & Pedlar, A. 2006, AJ, 132, 546, doi: 10.1086/504593
- Gasman et al. (2023) Gasman, D., Argyriou, I., Sloan, G. C., et al. 2023, A&A, 673, A102, doi: 10.1051/0004-6361/202245633
- Goulding & Alexander (2009) Goulding, A. D., & Alexander, D. M. 2009, MNRAS, 398, 1165, doi: 10.1111/j.1365-2966.2009.15194.x
- Hada et al. (2013) Hada, K., Doi, A., Nagai, H., et al. 2013, ApJ, 779, 6, doi: 10.1088/0004-637X/779/1/6
- Heckman (1980) Heckman, T. M. 1980, A&A, 87, 152
- Hermosa Muñoz et al. (2020) Hermosa Muñoz, L., Cazzoli, S., Márquez, I., & Masegosa, J. 2020, A&A, 635, A50, doi: 10.1051/0004-6361/201936680
- Ho (2002) Ho, L. C. 2002, ApJ, 564, 120, doi: 10.1086/324399
- Ho (2008) —. 2008, ARA&A, 46, 475, doi: 10.1146/annurev.astro.45.051806.110546
- Ho (2009) —. 2009, ApJ, 699, 626, doi: 10.1088/0004-637X/699/1/626
- Ho et al. (1996) Ho, L. C., Filippenko, A. V., & Sargent, W. L. W. 1996, ApJ, 462, 183, doi: 10.1086/177140
- Ho et al. (1997) —. 1997, ApJS, 112, 315, doi: 10.1086/313041
- Ho et al. (2009) Ho, L. C., Greene, J. E., Filippenko, A. V., & Sargent, W. L. W. 2009, ApJS, 183, 1, doi: 10.1088/0067-0049/183/1/1
- Jardel et al. (2011) Jardel, J. R., Gebhardt, K., Shen, J., et al. 2011, ApJ, 739, 21, doi: 10.1088/0004-637X/739/1/21
- Jarrett et al. (2003) Jarrett, T. H., Chester, T., Cutri, R., Schneider, S. E., & Huchra, J. P. 2003, AJ, 125, 525, doi: 10.1086/345794
- Kadler et al. (2004) Kadler, M., Ros, E., Lobanov, A. P., Falcke, H., & Zensus, J. A. 2004, A&A, 426, 481, doi: 10.1051/0004-6361:20041051
- Kameno et al. (2020) Kameno, S., Sawada-Satoh, S., Impellizzeri, C. M. V., et al. 2020, ApJ, 895, 73, doi: 10.3847/1538-4357/ab8bd6
- Kennicutt et al. (2003) Kennicutt, Robert C., J., Armus, L., Bendo, G., et al. 2003, PASP, 115, 928, doi: 10.1086/376941
- Komossa et al. (2008) Komossa, S., Xu, D., Zhou, H., Storchi-Bergmann, T., & Binette, L. 2008, ApJ, 680, 926, doi: 10.1086/587932
- Korista & Ferland (1989) Korista, K. T., & Ferland, G. J. 1989, ApJ, 343, 678, doi: 10.1086/167739
- Koss et al. (2022) Koss, M. J., Ricci, C., Trakhtenbrot, B., et al. 2022, ApJS, 261, 2, doi: 10.3847/1538-4365/ac6c05
- Lambert & Gontier (2009) Lambert, S. B., & Gontier, A. M. 2009, A&A, 493, 317, doi: 10.1051/0004-6361:200810582
- Li et al. (2011) Li, Z., Jones, C., Forman, W. R., et al. 2011, ApJ, 730, 84, doi: 10.1088/0004-637X/730/2/84
- Marscher & Gear (1985) Marscher, A. P., & Gear, W. K. 1985, ApJ, 298, 114, doi: 10.1086/163592
- Mason et al. (2015) Mason, R. E., Rodríguez-Ardila, A., Martins, L., et al. 2015, ApJS, 217, 13, doi: 10.1088/0067-0049/217/1/13
- McQuinn et al. (2016) McQuinn, K. B. W., Skillman, E. D., Dolphin, A. E., Berg, D., & Kennicutt, R. 2016, AJ, 152, 144, doi: 10.3847/0004-6256/152/5/144
- Meena et al. (2023) Meena, B., Crenshaw, D. M., Schmitt, H. R., et al. 2023, ApJ, 943, 98, doi: 10.3847/1538-4357/aca75f
- Meenakshi et al. (2022) Meenakshi, M., Mukherjee, D., Wagner, A. Y., et al. 2022, MNRAS, 516, 766, doi: 10.1093/mnras/stac2251
- Meier (2001) Meier, D. L. 2001, ApJ, 548, L9, doi: 10.1086/318921
- Meléndez et al. (2010) Meléndez, M., Kraemer, S. B., & Schmitt, H. R. 2010, MNRAS, 406, 493, doi: 10.1111/j.1365-2966.2010.16679.x
- Mezcua & Prieto (2014) Mezcua, M., & Prieto, M. A. 2014, ApJ, 787, 62, doi: 10.1088/0004-637X/787/1/62
- Molina et al. (2018) Molina, M., Eracleous, M., Barth, A. J., et al. 2018, ApJ, 864, 90, doi: 10.3847/1538-4357/aad5ed
- Müller-Sánchez et al. (2011) Müller-Sánchez, F., Prieto, M. A., Hicks, E. K. S., et al. 2011, ApJ, 739, 69, doi: 10.1088/0004-637X/739/2/69
- Nagar et al. (2005) Nagar, N. M., Falcke, H., & Wilson, A. S. 2005, A&A, 435, 521, doi: 10.1051/0004-6361:20042277
- Narayan & Yi (1995) Narayan, R., & Yi, I. 1995, ApJ, 452, 710, doi: 10.1086/176343
- Nemmen et al. (2014) Nemmen, R. S., Storchi-Bergmann, T., & Eracleous, M. 2014, MNRAS, 438, 2804, doi: 10.1093/mnras/stt2388
- Nicastro et al. (2003) Nicastro, F., Martocchia, A., & Matt, G. 2003, ApJ, 589, L13, doi: 10.1086/375715
- Nishiura et al. (2000) Nishiura, S., Shimada, M., Ohyama, Y., Murayama, T., & Taniguchi, Y. 2000, AJ, 120, 1691, doi: 10.1086/301561
- Nussbaumer & Osterbrock (1970) Nussbaumer, H., & Osterbrock, D. E. 1970, ApJ, 161, 811, doi: 10.1086/150585
- Oliva et al. (1994) Oliva, E., Salvati, M., Moorwood, A. F. M., & Marconi, A. 1994, A&A, 288, 457
- Park et al. (2019) Park, J., Hada, K., Kino, M., et al. 2019, ApJ, 871, 257, doi: 10.3847/1538-4357/aaf9a9
- Pereira-Santaella et al. (2022) Pereira-Santaella, M., Álvarez-Márquez, J., García-Bernete, I., et al. 2022, A&A, 665, L11, doi: 10.1051/0004-6361/202244725
- Pier & Voit (1995) Pier, E. A., & Voit, G. M. 1995, ApJ, 450, 628, doi: 10.1086/176171
- Pogge et al. (2000) Pogge, R. W., Maoz, D., Ho, L. C., & Eracleous, M. 2000, ApJ, 532, 323, doi: 10.1086/308567
- Pontoppidan et al. (2022) Pontoppidan, K. M., Barrientes, J., Blome, C., et al. 2022, ApJ, 936, L14, doi: 10.3847/2041-8213/ac8a4e
- Prieto et al. (2016) Prieto, M. A., Fernández-Ontiveros, J. A., Markoff, S., Espada, D., & González-Martín, O. 2016, MNRAS, 457, 3801, doi: 10.1093/mnras/stw166
- Prieto et al. (2014) Prieto, M. A., Mezcua, M., Fernández-Ontiveros, J. A., & Schartmann, M. 2014, MNRAS, 442, 2145, doi: 10.1093/mnras/stu1006
- Prieto et al. (2021) Prieto, M. A., Nadolny, J., Fernández-Ontiveros, J. A., & Mezcua, M. 2021, MNRAS, 506, 562, doi: 10.1093/mnras/stab1704
- Prieto et al. (2010) Prieto, M. A., Reunanen, J., Tristram, K. R. W., et al. 2010, MNRAS, 402, 724, doi: 10.1111/j.1365-2966.2009.15897.x
- Rodríguez-Ardila et al. (2011) Rodríguez-Ardila, A., Prieto, M. A., Portilla, J. G., & Tejeiro, J. M. 2011, ApJ, 743, 100, doi: 10.1088/0004-637X/743/2/100
- Rodríguez-Ardila et al. (2006) Rodríguez-Ardila, A., Prieto, M. A., Viegas, S., & Gruenwald, R. 2006, ApJ, 653, 1098, doi: 10.1086/508864
- Sajina et al. (2022) Sajina, A., Lacy, M., & Pope, A. 2022, Universe, 8, 356, doi: 10.3390/universe8070356
- Satyapal et al. (2008) Satyapal, S., Vega, D., Dudik, R. P., Abel, N. P., & Heckman, T. 2008, ApJ, 677, 926, doi: 10.1086/529014
- Sheth et al. (2010) Sheth, K., Regan, M., Hinz, J. L., et al. 2010, PASP, 122, 1397, doi: 10.1086/657638
- Shi et al. (2021) Shi, F., Li, Z., Yuan, F., & Zhu, B. 2021, Nature Astronomy, 5, 928, doi: 10.1038/s41550-021-01394-0
- Silk & Rees (1998) Silk, J., & Rees, M. J. 1998, A&A, 331, L1, doi: 10.48550/arXiv.astro-ph/9801013
- Stern et al. (2014) Stern, J., Laor, A., & Baskin, A. 2014, MNRAS, 438, 901, doi: 10.1093/mnras/stt1843
- Sugai et al. (2005) Sugai, H., Hattori, T., Kawai, A., et al. 2005, ApJ, 629, 131, doi: 10.1086/431544
- Tommasin et al. (2010) Tommasin, S., Spinoglio, L., Malkan, M. A., & Fazio, G. 2010, ApJ, 709, 1257, doi: 10.1088/0004-637X/709/2/1257
- Tonry et al. (2001) Tonry, J. L., Dressler, A., Blakeslee, J. P., et al. 2001, ApJ, 546, 681, doi: 10.1086/318301
- Trump et al. (2011) Trump, J. R., Impey, C. D., Kelly, B. C., et al. 2011, ApJ, 733, 60, doi: 10.1088/0004-637X/733/1/60
- Walsh et al. (2008) Walsh, J. L., Barth, A. J., Ho, L. C., et al. 2008, AJ, 136, 1677, doi: 10.1088/0004-6256/136/4/1677
- Wang et al. (2013) Wang, Q. D., Nowak, M. A., Markoff, S. B., et al. 2013, Science, 341, 981, doi: 10.1126/science.1240755
- Weinberger et al. (2017) Weinberger, R., Springel, V., Hernquist, L., et al. 2017, MNRAS, 465, 3291, doi: 10.1093/mnras/stw2944
- Wells et al. (2015) Wells, M., Pel, J. W., Glasse, A., et al. 2015, PASP, 127, 646, doi: 10.1086/682281
- Wilson & Raymond (1999) Wilson, A. S., & Raymond, J. C. 1999, ApJ, 513, L115, doi: 10.1086/311923
- Xue et al. (2016) Xue, Y. Q., Luo, B., Brandt, W. N., et al. 2016, ApJS, 224, 15, doi: 10.3847/0067-0049/224/2/15
- Yuan et al. (2012) Yuan, F., Bu, D., & Wu, M. 2012, ApJ, 761, 130, doi: 10.1088/0004-637X/761/2/130
- Yuan et al. (2015) Yuan, F., Gan, Z., Narayan, R., et al. 2015, ApJ, 804, 101, doi: 10.1088/0004-637X/804/2/101
- Yuan & Narayan (2014) Yuan, F., & Narayan, R. 2014, ARA&A, 52, 529, doi: 10.1146/annurev-astro-082812-141003