R. A. N. Brooks et al. \righttitleIAU Symposium 379: North-south asymmetry of ALFALFA H i WF
17 \jnlDoiYr2023 \doival10.1017/xxxxx
Proceedings of IAU Symposium 379
Origins of the north-south asymmetry in the ALFALFA H i velocity width function
Abstract
The number density of extragalactic 21-cm radio sources as a function of their spectral line-widths – the H i width function (H i WF) – is a tracer of the dark matter halo mass function. The ALFALFA 21-cm survey measured the H i WF in northern and southern Galactic fields finding a systematically higher number density in the north; an asymmetry which is in tension with cold dark matter models which predicts the H i WF should be identical everywhere if sampled in sufficiently large volumes. We use the Sibelius-DARK N-body simulation and semi-analytical galaxy formation model GALFORM to create mock ALFALFA surveys to investigate survey systematics. We find the asymmetry has two origins: the sensitivity of the survey is different in the two fields, and the algorithm used for completeness corrections does not fully account for biases arising from spatial galaxy clustering. Once survey systematics are corrected, cosmological models can be tested against the H i WF.
keywords:
galaxies: abundances – galaxies: luminosity function, mass function – radio lines: galaxies – dark matter1 Introduction
The kinematics of observable tracers in a galaxy are linked to the HMF because the maximum circular velocity of a halo, , is correlated to its mass (Navarro et. al, 1997). Connecting a kinematic tracer to often requires additional modelling, e.g., 21-cm spectral line widths. The 21-cm velocity spectrum is the H i mass-weighted line-of-sight velocity distribution, the full width at half maximum of the spectrum thus parameterises the line-width, . Instead of attempting to infer from line-width measurements, a more straightforward technique is to predict the number density of extragalactic 21-cm sources as a function of – the H i width function (H i WF) – and then compare with observational measurements.
Zavala et. al (2009), and more recently Oman (2022), found differences in the normalisation of the ALFALFA H i WF when measured in its northern and southern Galactic field. The driver of this asymmetry has been previously only speculated (e.g., see Oman, 2022). We use the Sibelius-DARK N-body simulation (McAlpine et. al, 2022) populated with galaxies using the GALFORM semi-analytical model (Lacey et. al, 2016) to create mock ALFALFA surveys. Our mock surveys provide a footing for an investigation into survey systematics that may be responsible for driving the asymmetry; our approach enables us to provide the first quantitative estimates for the magnitude of these effects and assess whether they can explain the observed asymmetry. A full account of this work is detailed in Brooks et. al (2023).
2 Mock 21-cm survey: Sibelius-DARK and GALFORM
The ALFALFA survey (Giovanelli et. al, 2005) mapped of the sky visible from Arecibo at 21-cm wavelengths out to . The survey was completed in 2012, and is composed of two separate fields on the sky; one in the northern Galactic hemisphere, visible during the spring, and the other in the southern Galactic hemisphere, visible during the autumn. By convention, these fields are labelled ‘spring’ and ‘fall’, respectively (Jones et. al, 2018). We define a selection of ALFALFA sources from which we measure the H i WF in a similar way to Oman (2022), but we impose a distance cut in order to facilitate comparison with the Sibelius-DARK simulation which is contaminated by low-resolution particles from outside of the zoom-in region beyond this distance (McAlpine et. al, 2022). Only sources above the per cent completeness limit (CL) of the survey are selected. There are sources above the per cent CL in the ALFALFA catalogue, of which are in the spring field and are in the fall field.
‘Simulations Beyond The Local Universe’ (Sibelius; Sawala et. al, 2022) aims to connect the Local Group with its cosmological environment using CDM initial conditions that are constrained such that the large-scale structure is accurately reproduced. The first simulation from the Sibelius project is Sibelius-DARK (McAlpine et. al, 2022), a realisation of a volume constrained within of the Milky Way, making it ideal to compare with the ALFALFA survey. The N-body Sibelius-DARK simulation has its galaxy population inferred using the Lacey et. al (2016) variant of the semi-analytical model of galaxy formation GALFORM.
Four steps are required to construct a mock 21-cm survey from the simulation: calculation of the galactic circular velocity curve, determination of the amount of H i gas as a function of line-of-sight velocity to produce a 21-cm spectrum, convolution with a kernel to model the thermal broadening of the 21-cm line, and application of the selection criteria consistent with the ALFALFA survey. The result is a mock survey containing sources, of which are in the spring field and are in the fall field.
Finally, to account for the undetected galaxy population we use the maximum-likelihood estimator. The estimator is 2D because the CL of the ALFALFA survey depends both on the integrated 21-cm flux and line-width of the source. From the summation of the values of the weights in 2D bins in and we compute the 2D H i mass-width function. The sum along the axis gives the H i MF, while the same along the mass axis gives the H i WF.
3 ALFALFA and Sibelius-DARK + GALFORM H i WFs
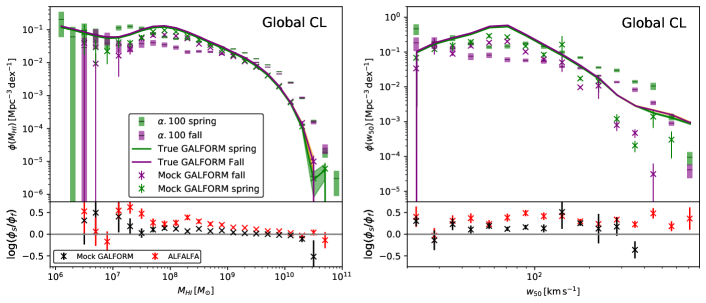
Understanding the origins of the asymmetric H i WFs is crucially important in the context of using it as a constraint on cosmology. The CDM cosmological model predicts that the dark matter HMF should be universal (in shape and normalisation, e.g. Frenk et. al, 1988; Mo et. al, 1996; Sheth et. al, 2002; Crain et. al, 2009) and therefore similar in the two fields surveyed in ALFALFA because the volumes sampled are sufficiently large. We have checked this explicitly in the Sibelius-DARK simulation: the HMFs in the spring and fall volumes differ by no more than per cent (within their uncertainties) at any halo mass . The most straightforward prediction for the H i WF is that it should also have the same shape and normalisation (within about 8 per cent) in the two fields. In the right panels of Fig. 1 we show the simulation H i WF of all galaxies with in the spring and fall survey fields (regardless of whether they would be detected) with the green and purple solid lines, respectively. The two H i WF curves differ by no more than per cent. If asymmetry of the H i WFs cannot otherwise be explained, then the CDM model could be called into question.
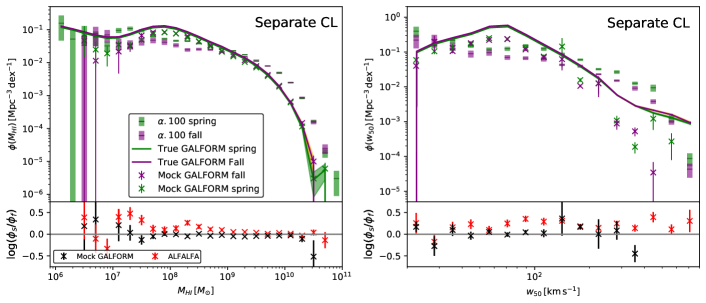
First, we make the measurement of the H i MF and H i WF for the spring and fall mock catalogues separately, following the procedure outlined in Oman (2022) where the globally derived CL for the ALFALFA survey is assumed in the estimator; top-left and right panels of Fig. 1 respectively show the H i MFs and H i WFs measured using this approach. The measurements of Oman (2022), now retaining only sources within , are also shown in these panels for comparison. We repeat the measurement of the H i MF and H i WF for the spring and fall ALFALFA and mock catalogues, but this time assuming CLs derived separately for the spring and fall ALFALFA fields in the calculation of the weights; bottom panels of Fig. 1. By adopting the separately derived CLS, the spring and fall mock survey H i WFs are no longer systematically offset from each other. Therefore, when the ‘correct’ CLs used to construct the mock catalogues are also used to correct them for incompleteness, the algorithm correctly recovers the fact that the H i WFs in the two fields are indistinguishable. For ALFALFA, the systematic offset between the spring and fall H i WFs is reduced when the ‘correct’ CLs are used in the estimator, but does not disappear: the median ratio between the spring to fall H i WFs is . The persisting asymmetry suggests that this is not the only systematic effect influencing the measurement.
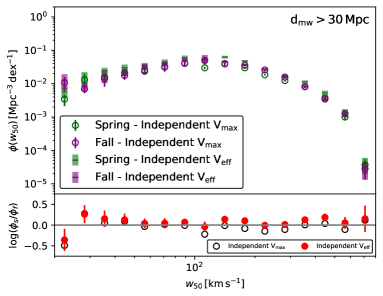
The origin of the remaining asymmetry stems from the number of detected sources in the foreground of the survey (). The estimator incorrectly extrapolates the foreground overdensity in the spring field through the entire survey volume, biasing the spring field to higher number densities. This effect is similar to what would occur if we used the estimator (Schmidt, 1968), which assumes that galaxies are uniformly distributed in space, but less severe – the algorithm is intended to compensate for non-uniformity in the galaxy distribution, but does so imperfectly. In Fig. 2, we show the H i WFs in the two fields measured with both (i) a conservative CL imposed to remove bias from the differing sensitivity in the two survey field and (ii) sources within removed. In this case the H i WFs in the two fields are very close to agreement; the median ratio between the spring to fall H i WFs derived using the independent weights is .
In summary, we attribute the asymmetry between the spring and fall ALFALFA H i WFs to: (i) the adopted completeness limit for the survey; and (ii) the estimator incorrectly extrapolating the foreground overdensity in the spring field through the entire survey volume. Accounting for these systematic effects leads to H i WFs in the spring and fall fields that are consistent with being identical, as expected from CDM cosmologies.
4 Outlook – the H i WF as a cosmological constraint
The influence of individual over/underdense regions on the calculation of weights can be mitigated by simply surveying a larger area on the sky; the ongoing WALLABY survey (Koribalski et. al, 2022) will cover an area about four times wider than that covered by ALFALFA. As the abundance of sources at low line-widths is sensitive to the adopted dark matter model, the H i WF has the potential to become a stringent test of cosmological models. Realising this potential will require a deeper understanding of the systematic biases influencing measurements, such as those due to spatial (or temporal) variability in survey sensitivity. Progress on theoretical issues is also needed. We look forward to the prospect of using the H i WF as a constraint on the nature of dark matter.
References
- Brooks et. al (2023) Brooks, Richard A. N. and Oman, Kyle A. and Frenk, Carlos S, 2023, MNRAS, 522, 3
- Crain et. al (2009) Crain, Robert A., Giuseppe, 2009, MNRAS, 399, 4
- Frenk et. al (1988) Frenk, Carlos S. and White, Simon D. M., 1988, ApJ, 327, 507
- Giovanelli et. al (2005) Giovanelli, Riccardo et. al, 2005, Astrophysical Journal, 130, 6
- Jones et. al (2018) Jones, Michael G. et. al, 2018, MNRAS, 477, 1
- Koribalski et. al (2022) Koribalski, Bärbel S. et. al, 2022, APSS, 365, 7, 118
- Lacey et. al (2016) Lacey, Cedric G. et. al, 2016, MNRAS, 462, 4
- McAlpine et. al (2022) McAlpine, Stuart et. al, 2022, MNRAS, 512, 4
- Mo et. al (1996) Mo, H. J. and White, Simon D. M., 1996, MNRAS, 282, 2
- Navarro et. al (1997) Navarro, Julio F. and Frenk, Carlos S. and White, Simon D. M., 1997, ApJ, 490, 2
- Oman (2022) Oman, Kyle A., 2022, MNRAS, 509, 3
- Sawala et. al (2022) Sawala, Till et. al, 2022, MNRAS, 509, 1
- Schmidt (1968) Schmidt, Maarten, 1968, ApJ, 151, 393
- Sheth et. al (2002) Sheth, Ravi K. and Tormen, Giuseppe, 2002, MNRAS, 329, 1
- Zavala et. al (2009) Zavala, J. et. al, 2009, ApJ, 700, 2