Cosmic abundance of iron
© 2023 г. N. N. Chugai111email: nchugai@inasan.ru
1Institute of Astronomy, Russian Academy of Sciences, Moscow
Submitted 15.05.2023 г.
Keywords: stars – supernovae; supernovae – nucleosynthesis; – extragalactic gamma-ray background
PACS codes:
Abstract
I explore a possibility to estimate an upper limit of the current iron abundance of the barion matter. The upper limit is determined by the minimal iron abundance, at which the gamma-ray background, produced by the decay of 56Ni synthesised in the Universe to date, contradicts the observational MeV gamma-ray background. I calculate the gamma-ray background from SNe Ia and SNe II with the gamma-ray scattering and absorption in supernova envelope. It is shown that the model background does not contradict the observed MeV background, if the present day iron abundance of the barion matter is less than 15% of the solar abundance.
1 Introduction
Overwhelming fraction of iron (92%) is represented by the isotop 56Fe that is synthesised by supernovae as 56Ni. It converts into iron via two step decay 56Ni (8.8 d) – 56Co (111.26 d) – 56Fe (Nadyozhin 1994). The 56Ni synthesis by SNe II (SN 1987A) is demonstrated via the detection of gamma-ray lines from the 56Co decay by the SMM observatory (Matz et al. 1988) and hard X-ray radiation detected by the orbital observatory Kvant (Sunyaev et al. 1987). In the case of SN Ia (SN 2014J) the 56Ni synthesis is demonstrated via the detection of gamma-ray lines from the 56Co decay by the INTEGRAL observatory (Churazov et al. 2014.)
Based on the fact that all the iron in the Universe originates from 56Ni decay ejected by supernovae Clayton and Silk (1969) estimated the brightness of the diffuse cosmic background produced by gamma-quanta of radioactive decay as cm-2 s-1 sr-1, that turned out comparable to the observed MeV-band background. Later, Clayton and Ward (1975) supported this conclusion based on the comparison with the background obtained at Appollo 15. Of course, for the background calculations authors used the barion density and Hubble constant significantly different compared to nowdays values; moreover the adopted solar abundance is rather unrealistic assumption.
The latter remarks motivate one to revisit this kind of analysis and pose somewhat different question: whether the measurement of the MeV background could be used to estimate an upper limit of the present day iron abundance of the barion matter? The question is intriguing since the answer is unknown, whereas it could clarify a general picture of the star formation and nucleosynthesis in the Universe. It should be emphasised that the posed question differs from the task of the gamma-ray background computation based on available estimates of supernova rates (Ruiz-Lapuente et al 2001, 2016; Iwabuchi and Kumagai 2001; Horiuchi et al. 2010; Lacki et al. 2014).
An attempt to answer the question on the upper limit of the iron abundance in the barion matter is the primary goal of this paper. Generally, the problem is reduced to the calculation of the gamma-ray background produced by the 56Ni decay for the adopted present day 56Fe abundance in the barion matter and adopted dependence of normalized rate of supernovae on the redshift. A major difference with earlier works (Clayton and Silk 1969, Clayton and Ward 1975), apart from the new data on barion density and Hubble constant, is the account for the gamma-quanta transfer in the expanding shell of SN Ia and SN II.
Preliminary considerations essential for the gamma-ray background
computation, particularly, relative contribution of SNe Ia and SNe II into the iron synthesis and redshift dependence of the supernova rates, are considered in the next section.
Hereafter we use cosmological parameters , , and km s-1 Mpc-1.
2 Supernovae and iron synthesis
2.1 Relative role of SN Ia и SN II
The first estimate of the relative role of different supernovae in the iron synthesis suggested that almost all the galactic iron could be produced by SNe II (Arnett et al. 1989). Later, Thielemann et al. (2002) have concluded that SNe Ia contribute 50-60% to the present day iron. This estimate was obtained from the observed ratio SN Ia/SN II of extragakactic supernovae assuming iron production and per one SN Ia and SN II, respectively.
One can use an alternative approach to estimate the relative role of supernovae based on the evolution of stellar iron and oxygen abundance. The O/Fe ratio in low metallicity stars, viz., [Fe/H] ] -2.6… -2, demonstrates a plateau on the [O/Fe] vs. [Fe/H] diagram at the level of [O/Fe] (Sitnova & Mashonkina 2018). Since the initial galactic nucleosynthesis is dominated by core-collapse supernovae, the inferred [O/Fe] value for old stars indicates that the average O/Fe ratio per one SN II exceeds the solar ratio by a factor of = (O/Fe)/(O/Fe).
The solar ratio O/Fe can be expressed via the total mass of synthesised oxygen and iron by supernovae SN Ia and SN II ( и ). Neglecting the SN Ia contribution to the galactic oxygen, one can write down the solar ratio O/Fe as
| (1) |
where is the relative contribution of SN Ia/SN II to the iron synthesis. This relation immediately gives us desirable value , which means that SNe Ia provide 80% of synthesised iron, whereas 20% of iron come from SNe II.

2.2 Evolution of supernova rates
To calculate the gamma-ray background one needs to know the normalized dependence of supernova rates on the redshift. The rate of SNe II can be adopted to be proportional to the star formation rate (SFR), since the delay between progenitor birth and explosion for is small compared to the SFR time scale (cf. Madau & Dickinson 2014). The SFR is presented here (Figure 1) by the broken power law with the brake at yr and power and -3.4 for and respectively.
The SN Ia rate is related to the SFR in a complicated way. In a paradigm of binary scenario (double white dwarf or white dwarf with a non-degenerate star) the evolution towards the explosion can take time comparable to the age of Universe (Tutukov & Yungelson 1994). In theory, the SN Ia rate is described by the convolution of the SFR and the delay time distribution (DTD) function , with being the delay of the explosion wrt binary birth. Ones consider sometimes nonmonotonic functions in an attempt to take into account different evolution scenaria and explosion models (Kobayashi et al. 2020), however I adopt power law (Frohmaier et al. 2019). The function is non-zero for and the minimal delay lies between yr (Tutukov & Yungelson 1994) and yr (Yubgelson 2010; Kobayashi et al. 2020). I adopt the explosion scenario of Chandrasekhar CO white dwarf that most adequitely reproduces the [O/Fe] vs. [Fe/H] diagram (Kobayashi et al. 2020) and consider two cases yr and yr.
Both options of the SN Ia rate, as well as the SN II rate in the normalised version (integral equals unity) are shown in Figure 1. The age – redshift relation is determined as , where the dimensionless Universe radius is and the expansion rate neglecting radiation is (Peebles 1993).
3 Gamma-ray background from 56Ni decay
3.1 Model
The photon brightness of the gamma-ray background from sources with the isotropic distribution along the redshift and the emissivity (cm-3 s-1 MeV-1) can be computed in a twofold way. In the first approach ones compute the gamma-ray density via integration of the source density over volume (e.g. Ruiz-Lapuente et al. 2016). Alternatively, one can directly calculate the background photon brightness (cm-2 s-1 MeV-1 sr-1) as a formal solution of the radiation transfer with isotropic sources and without absorption along the ray
| (2) |
where the photon energy emitted at the redshift is related to the observed energy as . The factor takes into account the reduction of both the energy interval and the photon arrival rate in the observer frame. This approach is applied, e.g., by Peebles (1993) to calculate the optical background. Using the differential relation , where , the integration over time is reduced to the intergration over
| (3) |
Background brightness is the sum of contribution of SNe Ia и SNe II , where and 2 for SN Ia and SN II, respectively. Emissivity for each supernova type is
| (4) |
where and , is the 56Fe isotope fraction, is the critical density, is the barion fraction, is the present day iron abundance in the barion matter, is the normalized rate of the 56Ni production for a certain supernova type, is the Avogadro number, (MeV-1) is the spectrum of escaping gamma-quanta per one 56Ni nucleus integrated over 600 days with the scattering and absorption in the envelope taken into account.
At first glance there might be significant uncertaity related to the absence of a consensus on the preferred explosion model for SNe Ia. Yet computations (Ruiz-Lapuente et al. 2016) of three different models including fully mixed W7 (Nomoto et al. 1984), 3D-model with the delayed detonation (Röpke et al. 2012), and binary CO white dwarf merging with the subsequent explosion (Pakmor et al. 2012) result in the identical gamma-ray spectra in the energy band of the maximum flux. This fact is related to the similar model ejecta mass and energy along with the almost complete mixing of 56Ni, which suggests similar column density at the same age.
Above mentioned gives us a reason to consider relatively simple SN Ia model: a freely expanding envelope of the uniform density and composition. The adopted below ejecta mass of 1.4 and the kinetic energy of erg (or 1.3 B) correspond to the W7 model (Nomoto et al. 1984). For the "average" SN II we adopt ejecta mass of 13 that corresponds to the initial progenitor mass of 15 , kinetic energy of erg, and assume 56Ni mixing in the central zone of 2.8 ; the variation of the latter value does not affect the total gamma-ray spectrum in the energy range of the maximum flux.

3.2 Modelling gamma-ray background
The spectrum of escaping gamma-rays from the 56Ni – 56Co – 56Fe decay in the rest frame is calculated using the Monte Carlo technique. The separate spectra computed every 6 days through 600 days are stacked into the resulting spectrum. Emitted photon energy and probability per one decay are taken from (Nadyozhin 1994).
Generally, emitted photon experiences multiple Compton scattering with the Klein-Nishina cross section and can eventually either escape the envelope or be absorbed. Absorption coefficients are taken from the NIST database. The SN Ia composition is represented by equal fractions of Fe and Si. The difference in the absorption coefficient between Fe, Ni, and Co is small and permits us to neglect the composition change due to the decay. For SN II we take into account absorption by O, Mg, Si, Fe with the iron mass of 0.044 in line with average 56Ni mass for SNe II (Anderson 2019) with masses of O, Mg, and Si being equal equal 0.68, 0.027 and 0.11 , respectively, in line with the model s15A of Woosley and Weaver (1995). The indicated masses are combined with masses of these elements in the presupernova hydrogen envelope assuming solar abundance.
The rest-frame gamma-ray spectra of SN Ia and SN II per one 56Ni nucleus are shown in Figure 2a. The spectra are qualitatively consistent with those calculated earlier (Watanabe et al. 1999, Iwabuchi & Kumagai 2001). The calculated cosmic background produced by SN Ia (80%) and SN II (20%) assuming the present day iron abundance in the barion matter are shown in Figure 2b. In the case of SN Ia two versions, with the explosion energy of 1.3 B and 1.1 B, are presented. For the fixed mass the energy determines the age when the envelope becomes transparent for MeV gamma-quanta, . The Figure 2b demonstrates weak dependence on the energy and therefore, on the choice of the dominant SN Ia model. We use the 56Ni production rate vs. redshift shown in Figure 1 and the rate of SN Ia corresponding to yr. The contribution of supernovae SN II in the background is rather small compared to SN Ia, which is related to the low Ni production and low fraction of escaping quanta.
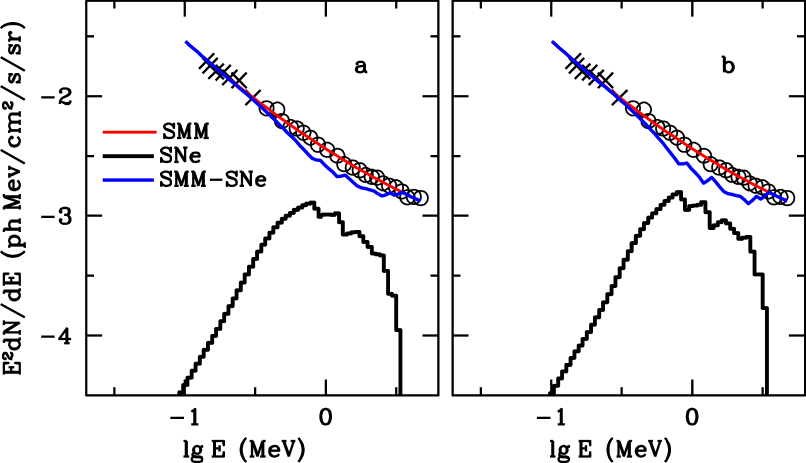
The calculated gamma-ray background produced by SN Ia и SN II for the present day cosmic iron abundance and two cases of time delay of SN Ia explosion, yr and yr, is displayed in Figure 3 along with observed MeV diffuse background according to SMM (Watanabe et al. 1997) and HEAO-1 (Kinzer et al. 1997) data. The estimate of the supernovae contribution in the observed background is actually ill-posed problem in the absence of reliable information on the possible components composed the background. We therefore reduce this problem to the discussion of the gamma-ray background in the absence of the supernova contribution, symbolically, . The shown average observed background is the non-linear fit with the root mean square deviation of %.
The recovered "observed" background without SNe contribution in the case of demonstrates pronounced depression () in the energy range of background produced by supernovae. The depression position is unnatural and it looks like as a conspiracy between different background sources to create a depression just in the energy range where the supernovae contribution is maximal. This possibility is highly unlikely and should be rejected. We therefore conclude that the present day cosmic abundance of iron in the barion matter is less than 15% of the solar abundance.
4 Discussion and conclusions
The aim of the paper has been to answer a question, what is the upper limit of the present-day iron abundance in the barion matter that does not contradict to the observational MeV gamma-ray diffuse background. The major our result is that the gamma-ray background produced by 56Ni decay is consistent with diffuse MeV background, if the present-day cosmic iron abundance is less than 15% of the solar abundance. Remarkably, the result in not sensitive to the variation of the adopted SN Ia explosion energy.
It would be useful to compare this upper limit with the available data on the metallicity of barion matter (Table 1). The Table lists fractions of major barion components (Nicastro et al. 2018) and their metallicity. For gas of galaxy clusters and L forrest the metallicity refers to minimum redshift in available data (Balestra et al. 2007, Rafelsky et al. 2012). For the warm-hot intergalactic medium (WHIM) the fraction of the hot component ( K) is estimated in the range of 9-40% (Nicastro et al. 2018). In the Table we adopt for this component estimated from the normalazation of all component sum on unity. In the bottom line of the Table we put the average metallicity . The lower and upper limits correspond to the indicated interval of the WHIM metallicity.
When comparing cosmic iron abundance with the metallicity of major components (L forrest and WHIM) one should take into account that the metallicity of latter is estimated from spectra of -elements, so the metallicity based on iron [Fe/H] can difer from the metallicity [/H] based on -elements. Indeed, in our Galaxy for the stellat metallicity [Fe/H] = -0.8, that corresponds to (Fe/H) = 0.15(Fe/H), the overabundance [element/Fe] of -particle nuclei C, O, Mg, Si is equal 0.15, 0.4, 0.25, 0.25 dex, respectivaly (Zhao et al. 2016) with the average overabundance [/Fe] . This rule takes place also for L forrest absorbers: the average difference of metallicities of L absorbers in the range of -2.7 < [metals/H] < -0.2 is [/H] - [Fe/H] dex (Rafelsky et al. 2012). Above arguments suggest that the iron abundance in the major barion components is about 10% of the solar, in agreement with our upper limit of 15%.
Table 1. Principal components of barion matter
| Component | ||
|---|---|---|
| Galaxies: | ||
| Stars | 0.07 | 1a |
| Cold gas | 0.017 | 0.5b |
| Hot gas | 0.05 | 0.5 |
| Intergalactic gas: | ||
| Hot gas of galaxy clusters: | 0.04 | 0.4c |
| L forrest | 0.28 | 0.15d |
| WHIM K | 0.15 | 0.1 - 0.2e |
| WHIM K | 0.39 | 0.1 - 0.2e |
a Gallazzi et al. (2008), b De Cia et al.(2021), c Balestra et al. (2007), d Rafelski et al. (2012), e Nicastro et al. (2018)
References
Anderson J.P., Astron. Astrophys. 628, A7 (2019)
Arnett W.D., Schramm D.N., Truran J.W., Astrophys. J. 339, L25 (1989)
Balestra I., Tozzi P., Ettori S. et al., Astron. Astrophys. 462, 429 (2007)
Churazov E., R. Sunyaev R., Isern J., et al., Nature 512,
406 (2014)
Clayton D.D., Silk J., Astrophys. J. 158, L43 (1999)
Clayton D.D., Ward R.A., Astrophys. J. 198, 241 (1975)
De Cia A., Jenkins E.B., Fox A.J. et al., Nature 597, 206 (2021)
Frohmaier C., Sullivan M., Nugent P. E. et al., Mon. Not. R. Astr. Soc. 486, 2308 (2019)
Gallazzi A., Brinchmann J., Charlot S.et al.,
Mon. Not. R. Astron. Soc. 383, 1439 (2008)
Horiuchi1 S., Beacom J.F., Astrophys. J. 723, 329 (2010)
Iwabuchi K., Kumagai S., Publ. Astron. Soc. Japan 53, 669 (2001)
Kinzer R.L., Jung G.V., Gruber D.E. et al., Astrophys. J. 475, 361 (1997)
Kobayashi C., Leung S.-C., Nomoto K. et al., Astrophys. J. 900, 179 (2020)
Lacki B.C., Brian C., Horiuchi S., Beacom J.F., Astrophys. J. 786, 40 (2014)
Madau P., Dickinson M., Ann. Rev. Astron. Astrophys. 52, 415 (2014)
Matz S. M., Share G. H., Chupp E. L.,
AIP Conference Proceedings, Volume 170, pp. 51-59 (1988).
Nadyozhin D.K., Astrophys. J. Suppl. 92, 527 (1994)
Nicastro F., Kaastra J., Krongold Y. et al., Nature 558, 406 (2018)
Nomoto K., Thielemann F.-K. , Yokoi K., Astrophys. J. 286, 644 (1984)
Pakmor R., Kromer M., Taubenberger S. et al. Astrophys. J. 747, L10 (2012)
Peebles P.J.E., Principles of physical cosmology (Princeton University Press, Princeton, New Jersey, 1993)
Rafelski M., Wolfe A.M., Prochaska J.X. et al., Astrophys. J. 755, 89 (2012)
Roepke F.K., Kromer M., Seitenzahl I.R. et al., Astrophys. J. 750, L19 (2012)
Ruiz-Lapuente1 P., The L.-S., Hartmann D., Astrophys. J. 812, 142 (2016)
Sitnova N.V., Mashonkina L.I., Astron. Lett. 44, 411 (2018)
Thielemann K.-F.,Argast D., Brachwitz F. et al., Astrophys. Space Sci. 281, 25 (2002)
Tutukov A.V., Yungelson L.R., Mon. Not. R. Astr. Soc. 268, 871 (1994)
Watanabe K., Hartman D.H., Leising M.D., The L.S.,
Astrophys. J. 516, 285 (1999)
Watanabe K., Hartmann D.H., Leising M.D., The L.S., Share G.H., Kinzer R.L.,
Fourth Compton symposium. AIP Conference Proceedings. 410, 1223 (1997)
Woosley S.E., Weaver T.A., Astrophys. J. Suppl., 101, 181 (1995)
Yungelson L.R., Astron. Lett. 36, 780 (2010)
Zhao, G., Mashonkina, L., Yan, H. L. et al., Astrophys. J. 833, 225 (2016)