Bluefish: A Relational Framework for Graphic Representations
Abstract.
Complex graphic representations — such as annotated visualizations, molecular structure diagrams, or Euclidean geometry — convey information through overlapping perceptual relations. To author such representations, users are forced to use rigid, purpose-built tools with limited flexibility and expressiveness. User interface (UI) frameworks provide only limited relief as their tree-based models are a poor fit for expressing overlaps. We present Bluefish, a diagramming framework that extends UI architectures to support overlapping perceptual relations. Bluefish graphics are instantiated as relational scenegraphs: hierarchical data structures augmented with adjacency relations. Authors specify these relations with scoped references to components found elsewhere in the scenegraph. For layout, Bluefish lazily materializes necessary coordinate transformations. We demonstrate that Bluefish enables authoring graphic representations across a diverse range of domains while preserving the compositional and abstractional affordances of traditional UI frameworks. Moreover, we show how relational scenegraphs capture previously latent semantics that can later be retargeted (e.g., for screen reader accessibility).
1. Introduction
Graphic representations, such as tables, charts, and diagrams, are essential problem solving tools. They externalize information, aiding recall, inference, and calculation tasks (Suwa and Tversky, 2002; Norman, 2014; Larkin and Simon, 1987). But complex, data-driven graphics — such as annotated visualizations, molecular structure diagrams, and Euclidean geometry — are still challenging to create. There are few solutions for authoring custom graphic representations, and often users are forced to use rigid, purpose-built tools with limited flexibility and expressiveness. For example, Mermaid (Sveidqvist and Vinod, 2014) is a popular JavaScript library for Markdown-based diagramming but offers a fixed palette of diagram types including flowcharts, class and state diagrams, and Gantt charts each with only a handful of customization options (e.g., only some diagram types allow customizing the curve style of arrows). While a new class of domain-specific languages (DSLs) has emerged to fill this gap (McNutt, 1912), these languages further fragment the landscape of tools. For instance, SmilesDrawer (Probst and Reymond, 2018), GoTree (Li et al., 2020), and Gosling (LYi et al., 2021) offer different abstractions for the shared concept of annotation. This fragmentation creates a burden for both language developers, who must reimplement similar primitives, as well as diagram authors, who must learn multiple often inconsistent and incompatible methods of accomplishing the same goal. Moreover, this fragmentation often causes authors to shepherd a diagram back-and-forth between separate tools (Bigelow et al., 2014, 2016) — a tedious, manual operation that is difficult to automate, must be repeated every time the diagram is updated, and can lead to visual inconsistencies that ultimately impact the reader.
An alternative to rigid tools are user interface (UI) frameworks such as React, Jetpack Compose, or Swift UI. Such frameworks have become widely used because they enable flexible and expressive specification of user interfaces. Developers author functional components that map data to visual output in a consistent, composable, and extensible way. Unfortunately, these frameworks have a significant limitation for authoring complex graphic representations. UI frameworks model graphics as hierarchical trees, but graphic representations convey information through overlapping perceptual relations (Tversky, 2001; von Engelhardt, 2002; Richards, 2002). A perceptual relation is a visual arrangement of elements that conveys information about the abstract relationship between those elements. For instance, Gestalt relations (Wagemans et al., 2012) are used to associate elements together by proximity (e.g., a text label and point in an annotated scatterplot), to connect two atoms together as part of a bond in a chemical diagram; or to relate a symbol to its definition via similar colors in a piece of augmented math notation (Head et al., 2022). Perceptual relations can also be more domain-specific — for example, collinearity and intersection are salient relations in Euclidean geometry. Integrating overlapping relations into a component-based framework could bring the flexibility and expressiveness of UI toolkits to graphic representations.
We present Bluefish, a diagramming framework that extends UI architectures to support overlapping perceptual relations. We generalize the concept of a UI component to encompass both user-extensible elements, the unique vocabulary for a particular visual domain (e.g., marks in data visualization, atoms and bonds in a molecular structure, or stack frames in a visualization of program state); and perceptual relations (subsection 3.2). To overlap components, Bluefish provides scoped references (subsection 3.3): a user can refer to another component via a special Ref component using names that are scoped to component namespaces, bolstering compositionality.
Bluefish is embedded in JavaScript, and diagrams are authored in JSX, a syntax extension to JavaScript popularized by the React library. A Bluefish specification is compiled into a relational scenegraph: a hierarchical data structure augmented with adjacency relations that is used for layout and rendering (section 4). Bluefish’s layout architecture extends industry standard UI approaches to layout from trees to compound graphs while preserving the expressiveness of those approaches. To handle overconstrained systems, Bluefish tracks bounding box ownership (subsubsection 4.2.2) to notify the user when two relations conflict. To handle underconstrained systems, Bluefish lazily materializes coordinate transforms to ensure that references can be properly resolved (subsubsection 4.2.4).
We demonstrate that Bluefish enables authoring graphic representations across a diverse range of domains while preserving the compositional and abstractional affordances of traditional UI frameworks (section 5). Moreover, we show how relational scenegraphs capture previously latent semantics that can later be retargeted (e.g., for screen reader accessibility) (section 6).
2. Related Work
2.1. Graphic Representations & Perceptual Relations
In visualization, “graphics” typically means statistical graphics (Wilkinson, 2012). Famed psychologist, Barbara Tversky offers a broad definition: a graphic is as a visual artifact consisting of “elements that are systematically arranged in space” (Tversky, 2001). Yuri Engelhardt defines a scope in-between the two called graphic representations (von Engelhardt, 2002) with ten primary types (including charts, tables, maps, pictures, and written text among others). These definitions inspire the scope and design of Bluefish: we focus on a set of data-driven graphic representations (i.e., those amenable to programmatic generation) via two classes of primitives, elements and perceptual relations. Perceptual relations, which include Gestalt relations (Wagemans et al., 2012), can not only spatially arrange elements but also denote other relationships including containment and connection. Perceptual relations can cover a broad range of phenomena including temporal relations (such as when several elements move in the same direction) or deal with complex emergent phenomena like continuity or closures. Bluefish focuses on a class of relations commonly found in static data-driven graphical representations (Wagemans et al., 2012; von Engelhardt, 2002; Richards, 2002; Tversky, 2001). We illustrate our standard library of relations in Figure 4.
2.2. UI and Diagramming Toolkits
UI Toolkits and Embedded Visualization Grammars. Modern user interface toolkits like React, SwiftUI, and Jetpack Compose have converged on the concept of a functional component to author UIs in a modular way. A UI component colocates related pieces of structure, content, and styling. Crucially, components can be nested, which produces new components that work the same way as primitive components (such as HTML elements) supplied by the system. This allows UI authors to build and share libraries of reusable functionality tailored to their specific problems, and to seamlessly compose many different libraries together. This approach stands in contrast to visualization systems which, with rare exceptions (McNutt and Chugh, 2021), offer a fixed palette of mark types. As a result, many developers have sought to embed the GoG in UI frameworks. Two prominent examples include Swift Charts (app, 2022) (embedded in SwiftUI) and Victory Charts (boygirl, 2015) (embedded in React). These libraries take advantage of the UI component model to provide additional extensibility for custom marks and axes, and high-level components for common chart types. These frameworks often also provide operators for some perceptual relations — typically spatial layout and alignment. These tools provide evidence for utility of embedding visualization and diagramming languages in UI frameworks, but they also inherit the tree structure limitation of those frameworks.
Domain-Specific Diagramming Languages There are a growing number of domain-specific languages (DSLs) for different kinds of diagrams (McNutt, 1912; Ellson et al., 2001; Sveidqvist and Vinod, 2014). These tools range from loose collections of inextensible diagram languages, such as Mermaid (Sveidqvist and Vinod, 2014), to DSLs focused on a single structure like GoTree (Li et al., 2020) for tree visualizations. These languages share many concepts including specific instances of perceptual relations like linking and alignment as well as higher-level relationships like annotation. Diagramming DSLs are still typically built as one-off systems, and so these shared relations must be rebuilt every time (McNutt, 1912). This places burden on both language designers, who must reimplement the same abstractions, and language users, who must relearn a new variation of a familiar concept.
General-Purpose Diagramming Languages. The idea of composing primitive elements to create new ones has also been embraced by diagramming languages and toolkits including
Haskell Diagrams (Yates and Yorgey, 2015), Diagrammar (Granström, [n. d.]), and Manim (Sanderson, 2018). These libraries provide primitives for many perceptual relations, but their APIs lack consistency and often expose perceptual relations as constraints. For example, Manim provides a next_to method for shapes that is similar to Row and Col components in Bluefish. However, next_to does not produce a new component; rather, it returns the modified object for method chaining.
In the Penrose diagramming language (Ye et al., 2020), programs are split into Substance and Style files, analogous to HTML and CSS, respectively. As a result, Penrose does not have a concept of a component. We provide a closer comparison to Penrose in subsection 5.3.
Layout Strategies. In addition to differences in user-facing APIs, these systems make different implementation decisions to lay out a user’s specification. Diagramming systems and domain-specific visualization grammars often select global solvers like linear programming or gradient descent for their expressivity. However UI toolkits and some diagramming languages opt for simpler, dataflow-based techniques like local propagation (Steele Jr, 1980). In fact, SwiftUI replaced their Auto Layout engine (based on the global linear programming solver Cassowary (Badros et al., 2001; Barth, 2016)) with a dataflow technique (Abrahams and Harper, 2019; Lettieri, 2022). Bluefish uses local propagation for layout, because it affords low viscosity and integration with external layout algorithms. We detail this design decision in subsection 4.2.
3. The Bluefish Language
Bluefish is a DSL embedded in a UI framework. In this section we motivate the design of this language and explain its embedding. We first identify four salient properties of UI frameworks that enable UI authoring, and use them as design goals to support the authoring of graphic representations: vocabulary correspondence, a user should be able to specify a graphics with primitive elements that map closely to their domain; creation by composition, it should be possible to create new elements by composing existing ones; universal composition, we should provide a set of reusable patterns for composition; and low viscosity, users should be able to make atomic edits to a specification to rapidly explore designs. We then extend the notion of a component to encompass both visual elements and perceptual relations. Overlapping relations are encoded using scoped references implemented in a special Ref component. Users can also write components against our low-level layout API, which we explain in more detail in subsection 4.2.
3.1. Design Goals and Motivation
Motivated by the diagramming literature and by research on notational affordances, we identify four salient properties of UI frameworks that support the construction of UIs.
Vocabulary Correspondence. A user should be able to specify a graphic with primitive elements that map closely to their domain. We adapt this goal from Ma’ayan & Ni et al. (Ma’ayan et al., 2020) as well as the Cognitive Dimensions of Notations (Blackwell et al., 2001). While elements like text, rectangles, circles, and lines provide the foundations for graphic representation, they present a greater articulatory distance (Hutchins et al., 1985) than primitives tailored to the author’s domain (e.g., atoms, bonds, and rings for diagrams of chemical molecules). In UI frameworks, users are empowered to both use and create domain-specific components. We extend this property to domain-specific elements and relations.
Creation By Composition. Domain-specific elements are often created by composing simpler elements. For example, a piece of math notation is often a deeply nested collection of basic symbols that are composed using lines, superscript and subscript positioning, and horizontal spacing. These kinds of composite elements are typically called glyphs in the visualization literature (Munzner, 2014; Satyanarayan et al., 2019). Domain-specific visualization languages like GoTree (Li et al., 2020) and Gosling (LYi et al., 2021) do not provide abstraction mechanisms for creating glyphs that work like built-in marks (McNutt, 1912; Wongsuphasawat, 2020b, a). Diagramming frameworks like Penrose (Ye et al., 2020) similarly do not allow end-users to define custom elements that work like built-in ones. Instead, to compose complex graphics, users of these languages typically concatenate many specifications together. However, UI frameworks use functional components to allow users to create new elements by composing together existing ones. Bluefish leverages this property by formalizing elements and relations as components.
Universal Composition. Counterbalancing the focus of the previous goals, the mechanisms for composition should afford authors the ability to cut across and cohere visual elements from disparate domains as part of a single diagram. Just as basic graphical elements are shared across domains, we aim to design a set of universal patterns for composition. This goal is motivated by a call from Park et al. who argue for the need to “unify many of these existing grammars, while retaining both the simplicity and power of the original ones” (Park et al., 2017). UI frameworks achieve this goal with a standard library of layout components like lists and grids. In Bluefish, we achieve universal composition through a standard library of perceptual relations.
Low Viscosity. Users should be able to make atomic edits to a specification in order to rapidly explore alternate designs (Blackwell et al., 2001). Components provide a uniform representation for layouts allowing a user to easily swap out a list for a grid, for example. To keep viscosity low in Bluefish, we design our standard library with two properties in mind. First, the semantics of the perceptual relations are consistent with one another: users should be able to trivially replace one perceptual relation with another and produce a valid graphic without having to significantly refactor the specification. Second, the behavior of perceptual relations are determined entirely by their input properties and children. As a result, a user is able to locally reason about the behavior of a perceptual relation as an isolated component.
Components are a powerful abstraction. A user can write a custom component tailored to a specific problem, compose multiple components to form a new one, and reuse a common component across different projects. Components provide a consistent abstraction that affords low viscosity authoring. But in the presence of overlapping relations, this consistency breaks down.
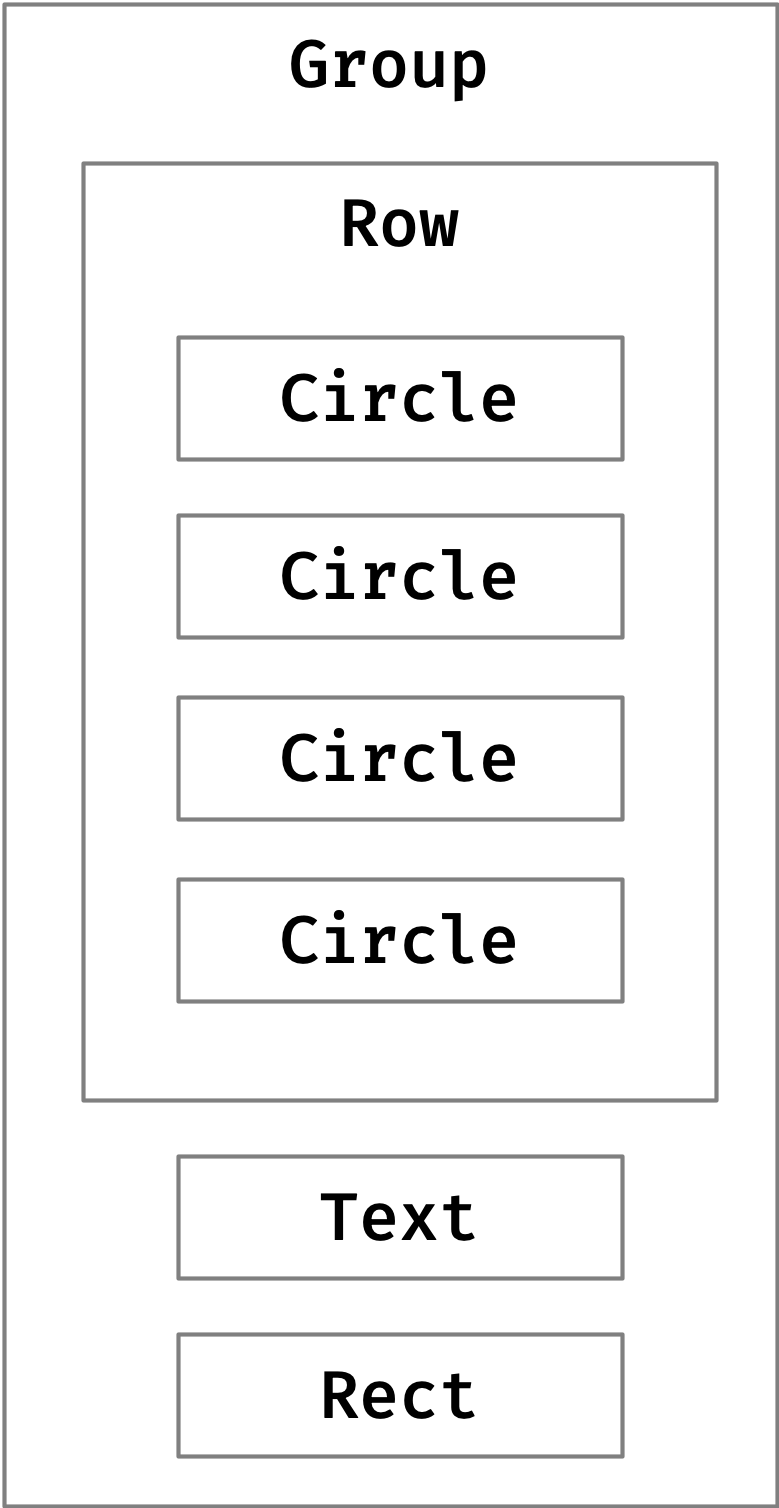
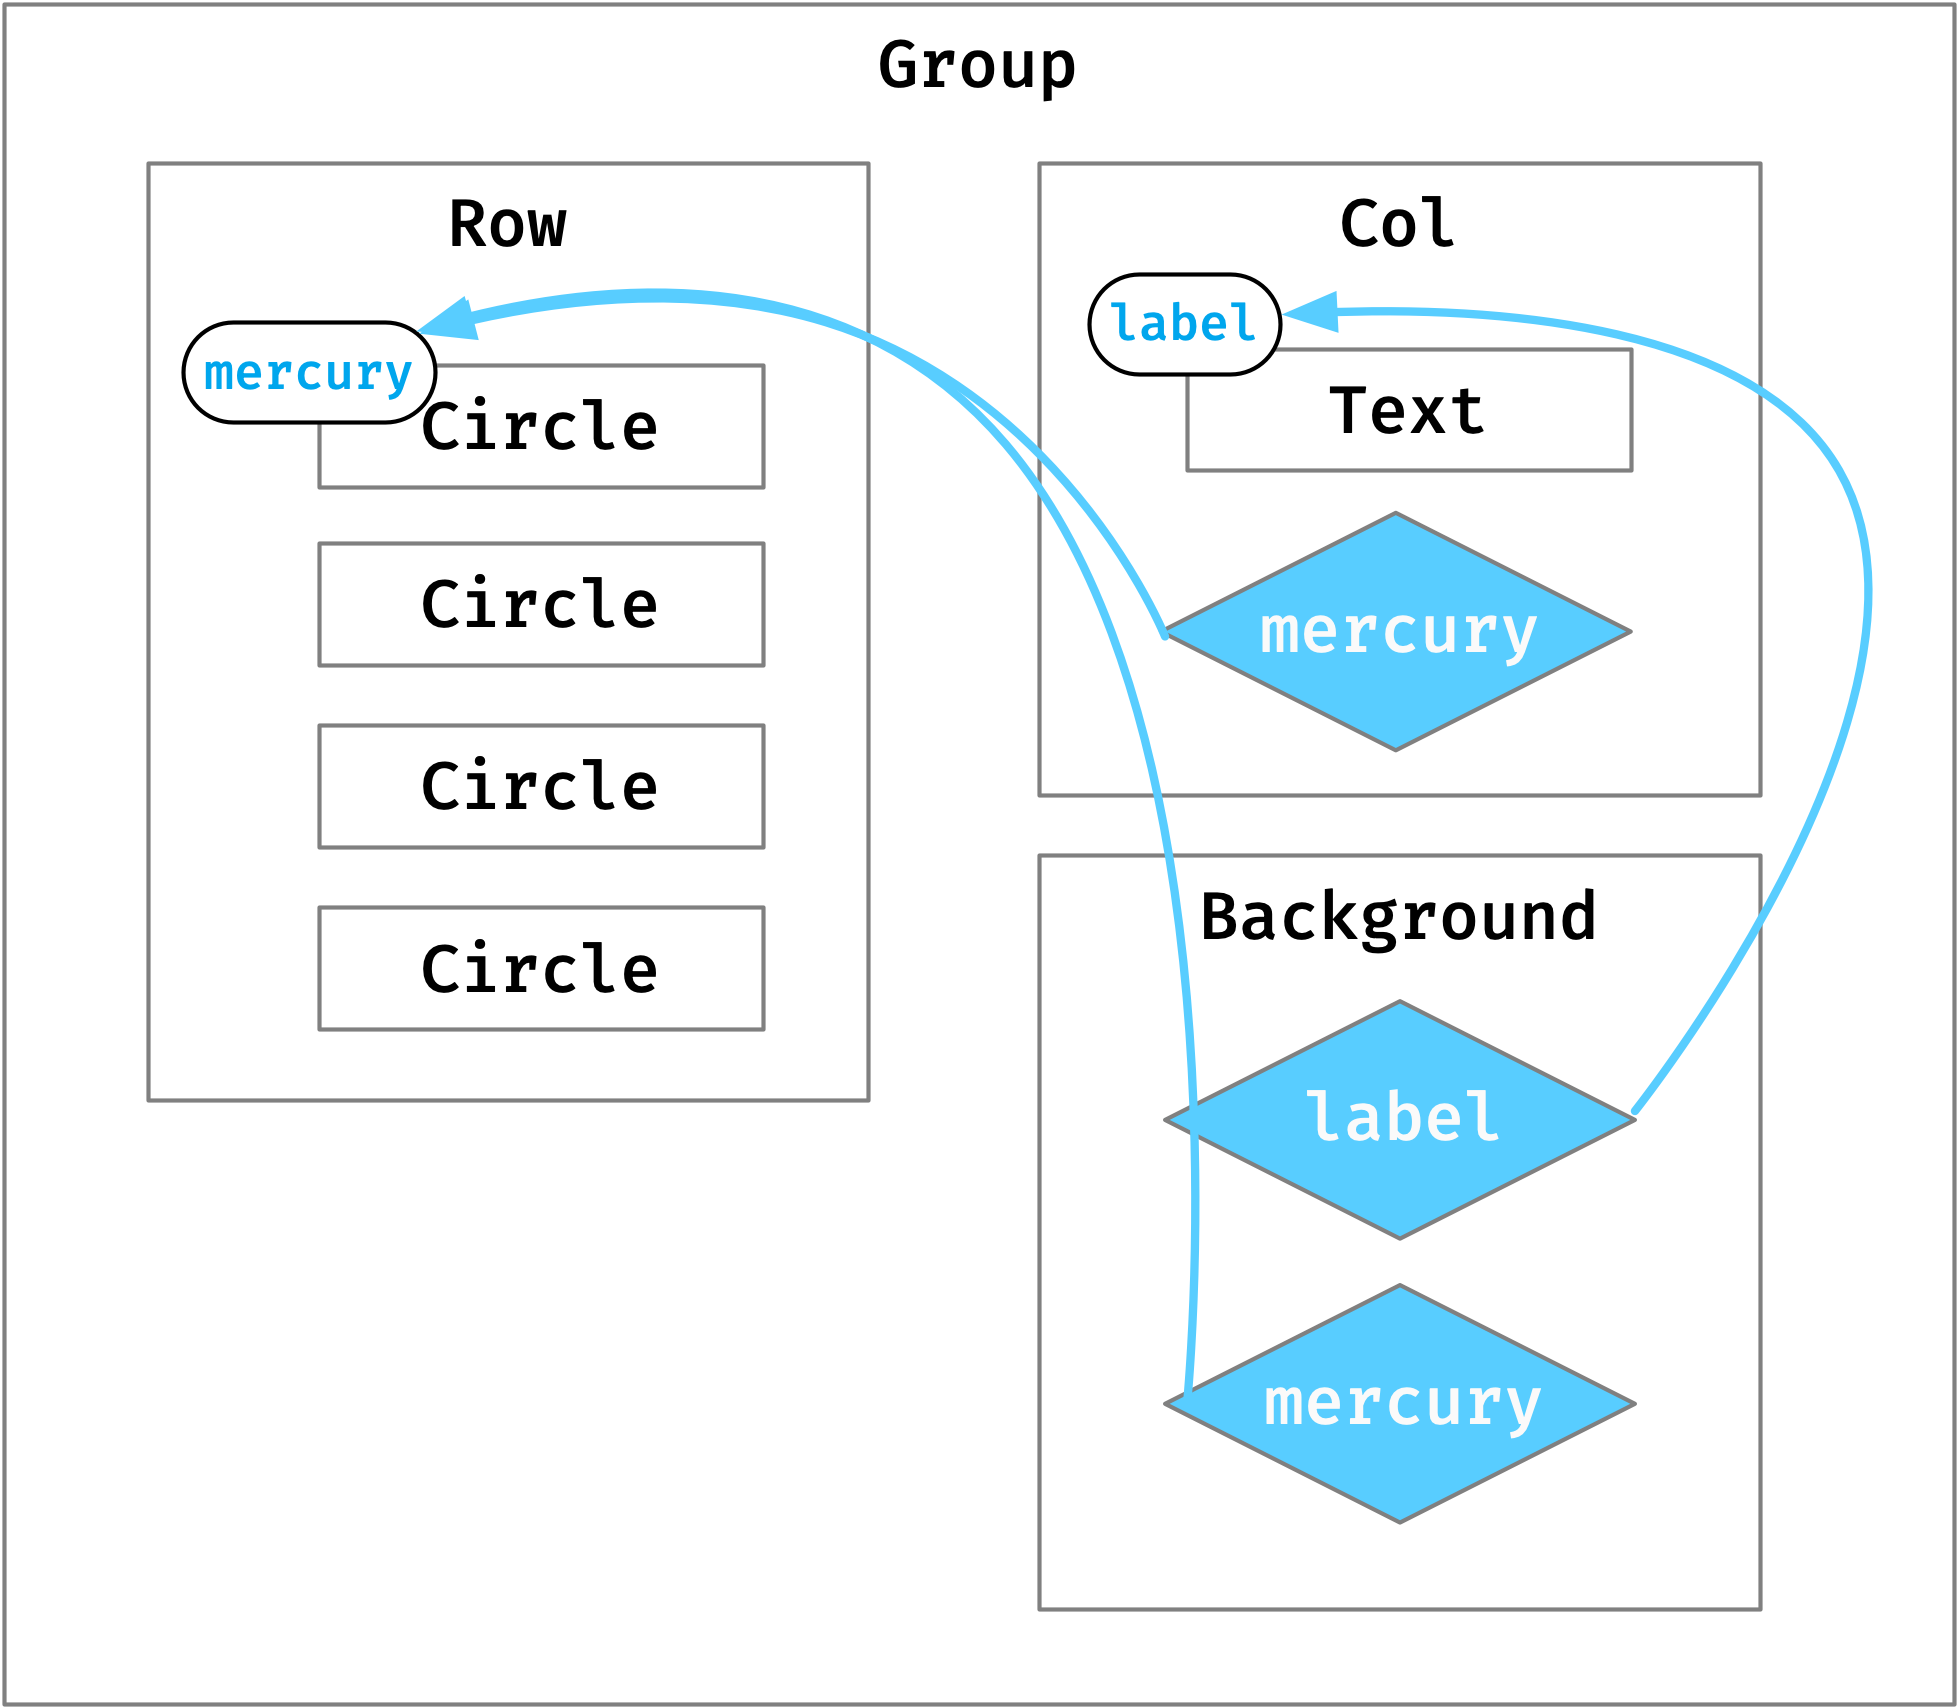
Figure 2 provides an example of this consistency problem. This figure depicts a diagram of the terrestrial planets, with an annotation for Mercury. Accompanying this figure is a specification in the React UI framework using a fictional useMeasure hook that gives the user access to the bounding boxes of various components. In the React specification, after the row of planets is specified, placing the label and the background require referencing previously placed elements. React has a concept of ref, but it is not reified as a component. As a result, the user must perform manual calculations that obscure the relationships between the text, the background, and the planets. In contrast the corresponding Bluefish specification replaces these explicit calculations with Refs, highlighting the overlapping relations between visual elements. The complex calculations on the Text component obscured the underlying Col relating it to Mercury. Because Bluefish represents Refs as components and not as attributes, components like Row and Col are called consistently regardless of how many of their children are Refs. The complex Rect computation is similarly replaced by a Background whose children are both references to prior elements.
This example demonstrates the key design principle we follow in the construction of Bluefish: conservative extension (Felleisen, 1991). To transfer the benefits of component designs to the larger domain of graphic representations, we aim to generalize UI framework concepts to overlapping relations conservatively, that is, if a specification does not contain any overlaps then Bluefish operates indistinguishably from a UI framework. As in Figure 2, Row and Col are designed to function identically to their UI framework counterparts if none of their children are Refs, and their behavior generalizes naturally to overlaps.
const[mercury,mercuryBnds]=useMeasure();
const[label,labelBnds]=useMeasure();
<Group>
<Rowspacing={50}alignment="middle">
<Circleref={mercury}r={15}fill="#EBE3CF"/>
<Circler={36}fill="#DC933C"/>
<Circler={38}fill="#179DD7"/>
<Circler={21}fill="#F1CF8E"/>
</Row>
<Text
ref={label}
contents="Mercury"
x={mercuryBnds.centerX-labelBnds.width/2}
y={mercuryBnds.top-labelBnds.height-10}
/>
<Rect
x={min(mercuryBnds.left,labelBnds.left)}
y={min(mercuryBnds.top,labelBnds.top)}
width={max(mercuryBnds.right,labelBnds.right)
-min(mercuryBnds.left,labelBnds.left)}
height={max(mercuryBnds.bottom,labelBnds.bottom)
-min(mercuryBnds.top,labelBnds.top)}
/>
</Group>
constmercury=useName(’mercury’);
constlabel=useName(’label’);
<Group>
<Rowspacing={50}alignment="centerY">
<Circlename={mercury}r={15}fill="#EBE3CF"/>
<Circler={36}fill="#DC933C"/>
<Circler={38}fill="#179DD7"/>
<Circler={21}fill="#F1CF8E"/>
</Row>
<Colalignment="centerX"spacing={10}>
<Text
name={label}
contents="Mercury"
/>
<Refselect={mercury}/>
</Col>
<Background>
<Refselect={label}/>
<Refselect={mercury}/>
</Background>
</Group>
3.2. Generalizing UI Components to Elements and Perceptual Relations
|
example |
|
|||
| spatial proximity |  |
Distribute |
|||
| similar attribute |  |
AlignProps |
|||
|
Align |
||||
|
 |
Link, Arrow
|
|||
| common region |
|
As illustrated in Figure 3, Bluefish supports static, data-driven graphic representations with two kinds of user-extensible primitives: elements, the graphical entities that comprise the diagram (e.g., Circle); and perceptual relations that define relationships between elements (e.g., Col, Arrow).
Bluefish surfaces these primitives through JSX, an extension to JavaScript popularized by the React library that emulates XML and HTML syntax.
We map these primitives onto the two kinds of JSX tags: self-closing tags (e.g., <Circle />) for elements, and container tags (e.g., <Arrow>...</Arrow>) for perceptual relations. These tags instantiate components with zero or non-zero children, respectively.
Bluefish provides a base set of elements that reflect native SVG: Circle, Line,
Rect, and Text.
Bluefish also provides a collection of perceptual relations based on Gestalt relations commonly found in static graphics including Distribute for spatial proximity, AlignProps for similar attribute, Align for spatial alignment, Link and Arrow for element connectedness, and Contain and Background for common region. These relations are summarized in Figure 4.
The design of Bluefish’s perceptual relations follows directly from the design goals described above in subsection 3.1. In particular, as research has shown (Tversky, 2001; von Engelhardt, 2002; Richards, 2002), perceptual relations are a fundamental feature of graphic representations regardless of the underlying domain or context. Thus, explicit perceptual relations contribute to vocabulary correspondence. While prior diagramming toolkits have surfaced perceptual relations (Ye et al., 2020; Cruz and Leveille, 2000; Granström, [n. d.]; Yates and Yorgey, 2015), Bluefish’s codification of perceptual relations is more consistent than prior approaches. Some frameworks express perceptual relations indirectly with elements and constraints. For example, Penrose lets users write primitive elements with the shape keyword and primitive constraints and objectives with ensure and encourage, respectively. Others express relations using elements and coordinate systems. For instance, in the Haskell diagrams library, arrowBetween is a component with two children while align modifies the local origin of a single component. In contrast to these approaches, perceptual relations are a first-class concept in Bluefish. This design decision has syntactic and semantic consequences. Syntactically, modeling perceptual relations as components allows for a closeness of mapping (Blackwell et al., 2001): a perceptual relation, which groups elements together, is defined by wrapping a container tag around participating elements, generalizing the notion of a grouping in other languages likely to be familiar to diagram authors including HTML (e.g., <div> tags) and SVG (i.e., <g> tags). Semantically, representing perceptual relations as a single, consistent construct means they can be easily swapped for one another. For example, consider the atomic edits in Figure 3. The compound relation Col is split into separate Align and Distribute relations, and the Distribute relation is retargeted to space the label away from the row of planets. The Background relation can be swapped out for an Arrow without changing the children involved in the relation, and the Background can be moved to encompass the planets instead.
3.3. Overlapping Relations with Scoped Declarative References (<Ref />)
To express overlapping perceptual relations, Bluefish offers a Ref component that works like a declarative query selector. Users can reference elements by their name — a property that must be unique to the local scope of a component, rather than globally across an entire figure as with DOM node IDs — or by specifying a path of names. In the latter case, Bluefish resolves the reference by traversing the path one-by-one, entering a component each time and searching its local scope for the next named element. Scopes support low viscosity by encapsulating names so that changes to names in one component cannot shadow names in another.
A Ref acts like a pointer to another component. Changes induced by a Ref’s parent relation are reflected in the component it points to. Likewise, properties of the referenced component are accessible by the Ref’s parent. We describe this behavior in more detail in subsection 4.2.
We considered using JavaScript’s own variable bindings instead of a separate Ref component for specifying overlaps.
However, we found that this interpretation of bindings competed with users’ mental model of JSX: in JSX, using a component bound to a variable in multiple places creates different copies of a component rather than referencing it, as is needed with Bluefish.
Moreover, using explicit Refs simplifies the implementation of the system, because it allows us to construct a relational scenegraph within the confines of a tree-structured hierarchy. section 4 explains this in more detail.
We leave to future work opportunities
to expand
the expressivity of how elements may be referenced (e.g., via XML query languages such as XPath (Benedikt and Koch, 2009; Clark et al., 1999) and XQuery (Boag et al., 2002), or by generalizing Cicero’s specifiers (Kim et al., 2022) and Atlas’s find function (Liu et al., 2021)).
3.4. User-Extensible Elements and Relations
Users can define new elements by composing existing ones via the affordances of JSX notation. An element can be reused by wrapping it in a function. For example, we might reuse the planets diagram by writing:
PlanetDiagram=()=>(<Group>...</Group>)
The component may then be used like a native tag:
<PlanetDiagram/>
We can parameterize an element by adding arguments to the function. For example, we could make the planets an argument:
PlanetDiagram=({planets})=>(<Group>...</Group>)
We can then call it like this:
<PlanetDiagramplanets={...}/>
When compositions of existing elements and relations is not enough, Bluefish allows users to author their own primitives using a low-level API. Inspired by the Jetpack Compose API (and, 2023), primitive elements and perceptual relations are both described using a special Layout component that registers a node in Bluefish’s scenegraph. In addition to taking an id (which may be provided implicitly by Bluefish), Layout requires a layout function that determines the bounding box and coordinate system of the component and has an opportunity to modify its children’s bounding boxes and coordinate systems as well. Layout also requires a paint function that describes how the component should render given information about its bounding box and its children, which have already been rendered. Here is the basic structure for authoring a new primitive element and a new primitive relation:
functionRect(props){
constlayout=()=>{...}
constpaint=(paintProps)=><rect.../>
return<Layoutlayout={layout}paint={paint}/>
}
functionAlign(props){
constlayout=(childIds)=>{...}
constpaint=(paintProps)=><g...>{paintProps.children}</g>
return(
<Layoutlayout={layout}paint={paint}>
{props.children}
</Layout>
)
}
All of Bluefish’s primitives are written using this API. In the next section we will discuss how layout functions work.
4. The Bluefish Relational Scenegraph
When an end user composes Bluefish elements and perceptual relations, the language runtime compiles this specification into a relational scenegraph: a data structure used to resolve references between elements, propagate shared attributes, and compute layout. Critically, in contrast to tree-based scenegraphs that are standard in UI and visualization toolkits, Bluefish’s relational scenegraph is an instance of a compound graph: a data structure that allows us to maintain the hierarchical information of traditional scenegraphs while allowing individual nodes to have multiple parents in order to support overlapping perceptual groups (subsection 3.3).
4.1. Adapting a Compound Graph Structure
Compound graphs have been explored in research on graph drawing (Sugiyama, 2002) and hierarchical edge bundling (Holten, 2006). They encode not only hierarchical relationships between nodes (i.e., parent-child) but also allow for non-hierarchical relationships called adjacencies. In Bluefish, we instantiate a compound graph as follows:
Nodes. Each node in the scenegraph corresponds to a Layout or Ref node instantiated in JSX. Layout nodes hold information necessary for rendering the corresponding element (e.g., visual styles) as well as computing layout. Layout information includes a partially defined bounding box, a boundary curve for line-like elements, and any transformations needed to position and size this node based on higher-level nodes.
Hierarchy and Adjacencies. Nodes are assembled into a hierarchy following the nesting structured established by the JSX specification. An adjacency relation is established for every Ref element (subsection 3.3): a node is instantiated in the hierarchy for the Ref, and it links to the referenced node as an adjacency. As a result, and unlike general compound graphs where adjacencies can connect any pair of nodes, adjacencies in Bluefish always originate at leaf nodes (i.e., Refs are self-closing components rather than block or container components). Currently, Bluefish does not maintain backwards references (i.e., from nodes to the Refs pointing to them) as this information is not required for resolving references or laying out nodes; however, as shown in section 6, this information can be recovered at runtime. Figure 5 depicts the scenegraph for the UI specification and the relational scenegraph for the Bluefish specification from Figure 2.
4.2. Computing Layout by Conservatively Extending UI Tree-Based Local Propagation
Just as we conservatively extended a UI component language, adding Refs to express overlaps, we extend UI layout architectures to support overlaps. Modern UI layout architectures, including CSS (Kilpatrick, 2022), SwiftUI (Abrahams and Harper, 2019; Lettieri, 2022), and Jetpack Compose (and, 2023), use tree-based local propagation (Steele Jr, 1980). Local propagation has a storied history in UI toolkits (Sannella et al., 1993; Sannella, 1994; Borning et al., 1996; Myers, 1991; Vander Zanden et al., 2001) and is straightforward to implement in reactive dataflow runtimes.
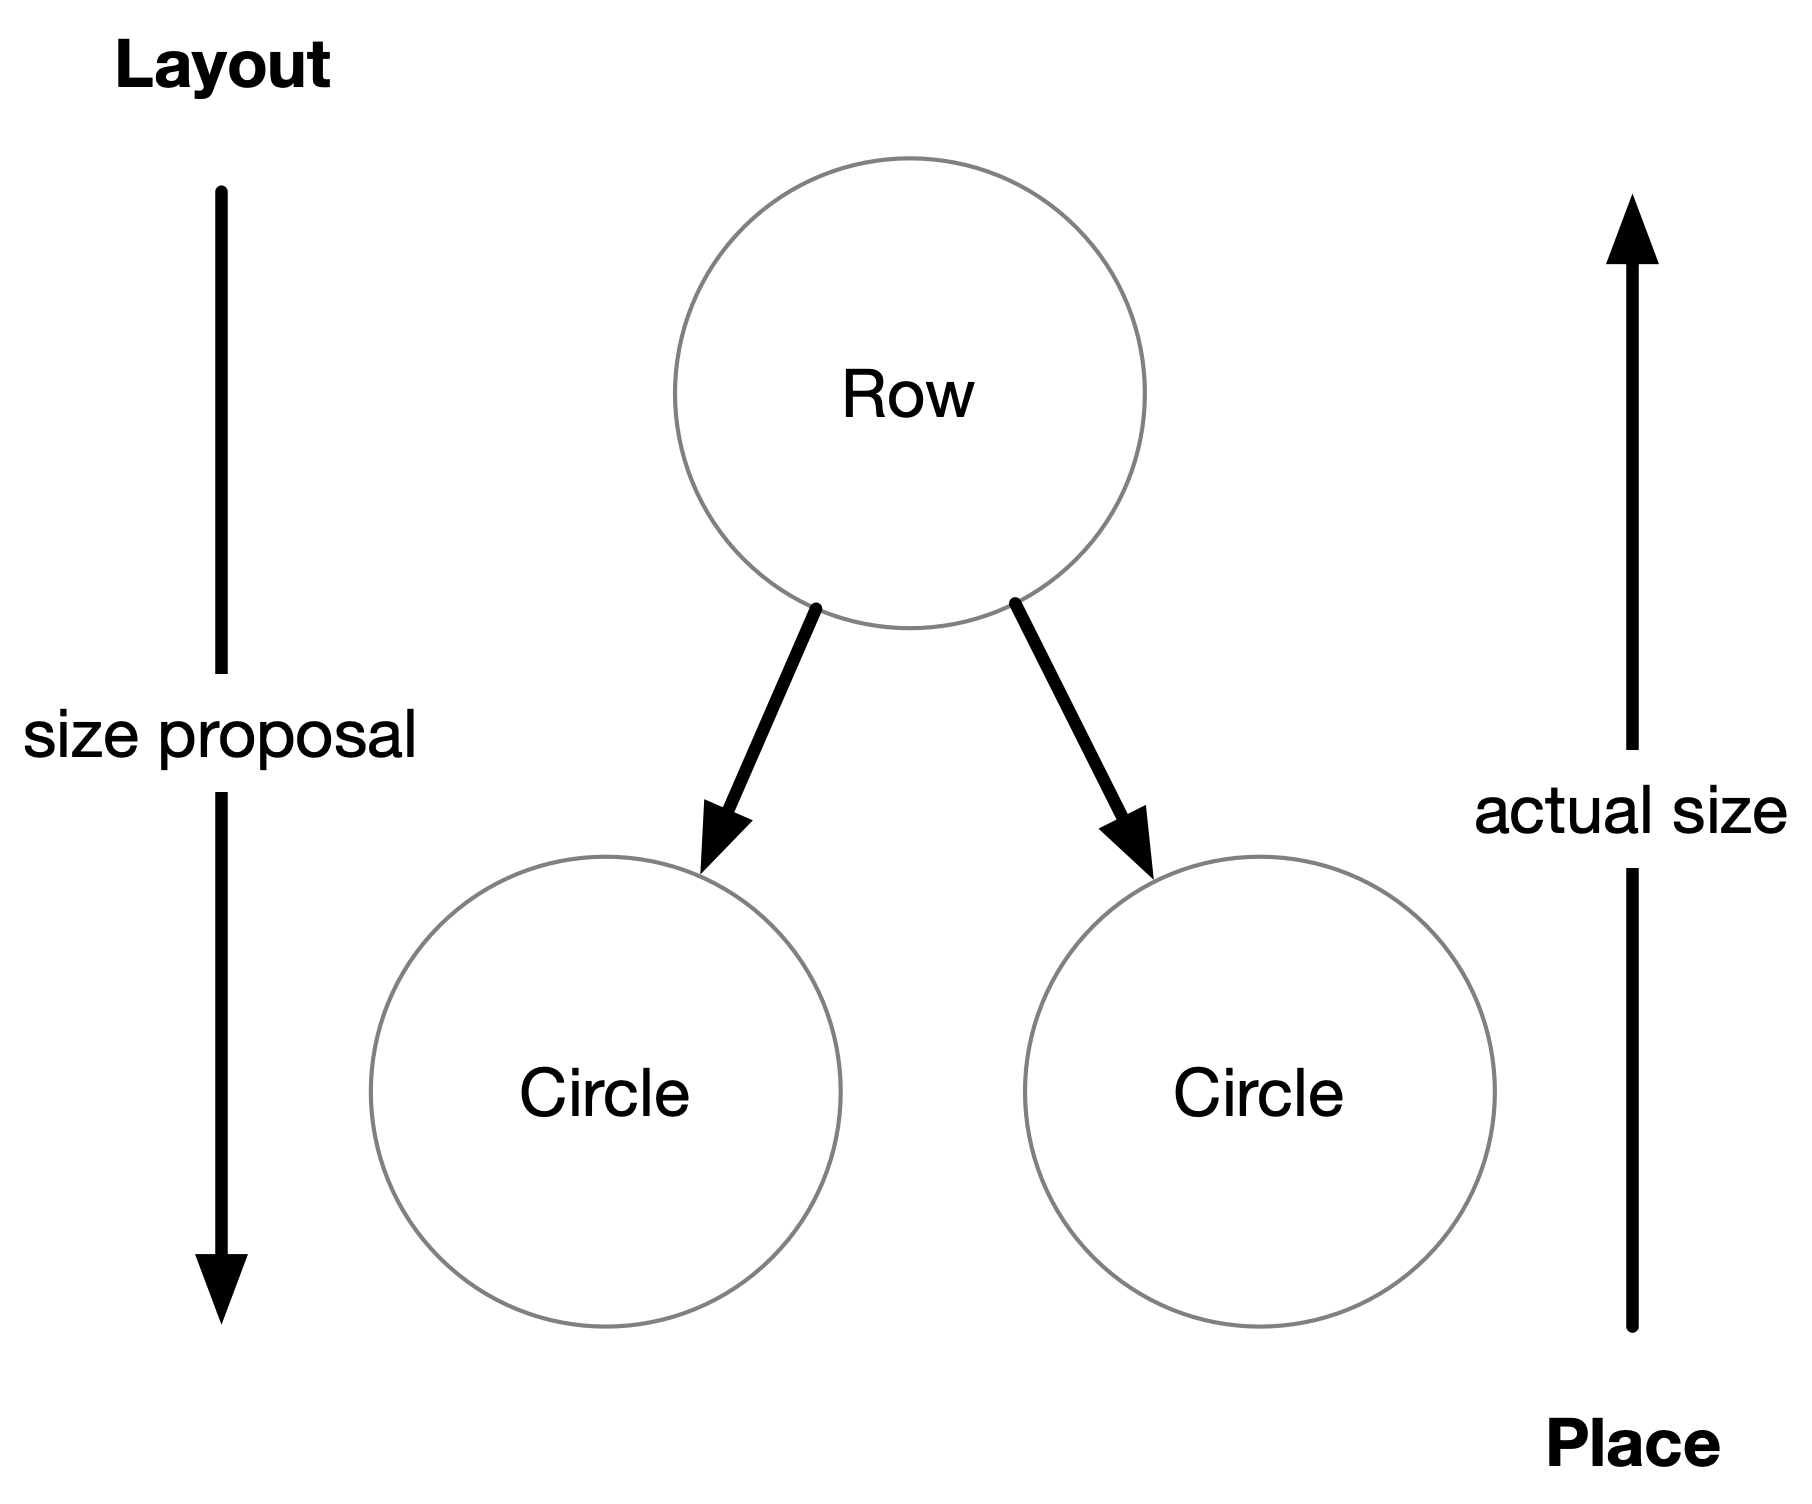
UI layout needs to be fast yet support different, specialized algorithms like flex layout, line-breaking, and grids. To balance performance and expressiveness, UI layouts execute in one pass over the scenegraph, and each node can contain arbitrary code. Figure 6 summarizes this architecture. Each node in the scenegraph has an associated layout algorithm, and layout commences at the scenegraph root. When a node’s layout algorithm is evaluated, it invokes the algorithms of its children by proposing a width and height for each child. Once the children are laid out, they return their actual sizes and the parent may place each child in its local coordinate system. This local information-passing approach can express many kinds of layouts. For example, to implement flex layout each child may optionally specify its flex factor. During layout, the flex node can read its children’s flex factors and distribute its own free space proportionally to each child via the size proposal.
Instead of local propagation, many visualization and diagramming frameworks use a different strategy, a global solver. For instance, SetCoLa (Hoffswell et al., 2018) compiles to WebCoLa, a constraint-based layout engine that uses a mixture of global techniques like quadratic programming and force-directed layout; Charticulator (Ren et al., 2018) and GoTree (Li et al., 2020) use sparse linear programming solvers; and, diagramming tools like Penrose (Ye et al., 2020) use L-BFGS. These tools employ global solvers to support very complex layout problems, and to solve sets of constraints simultaneously, that cannot be solved by local propagation. Indeed, we implemented an early version of Bluefish using the Cassowary linear programming solver (Badros et al., 2001). However, in doing so, we identified a series of tradeoffs at odds with our design goals (subsection 3.1). First, a global solver increases viscosity for diagram authors: it can be difficult to localize layout bugs because the solver reasons about all constraints at once and a node’s layout can, by design, be a function of a highly non-local set of inputs. Second, global solvers limit vocabulary correspondence: domain-specific algorithms (e.g., SmilesDrawer for chemical molecules) rely on custom imperative code that cannot be easily translated to or integrated with a solver’s constraint language. In contrast, with Bluefish, layout problems can be debugged more easily as layout information only flows locally. Moreover, Bluefish is able to integrate any external layout algorithm simply by instantiating it as a node in the scenegraph. These benefits are extended directly from UI layout architectures.
Local propagation does present some limitations — namely, it does not provide special support for continuous optimization problems or complicated simultaneous constraints. Many International Math Olympiad geometry problems, for example, can only be drawn by solving a circular system of geometry constraints (Krueger et al., 2021). And diagrams involving knots are well-suited to gradient-descent schemes (Yu et al., 2021). Nevertheless, such domain-specific solvers could be embedded as a special nodes in the Bluefish architecture. In this way, Bluefish serves more as a layout fabric than a solver itself. It is concerned with the interface between nodes more than the language those nodes’ layouts are written in.
4.2.1. A Running Example: Splitting Col in Two
To make a framework with low viscosity, we want to supporting authoring any given graphic representation in many different ways. This property increases the malleability of the language, because a specification can be rewritten into many equivalent forms where each form may be adjacent to different specifications with new meanings. For example, the first step in Figure 3, splitting a Col, can be decomposed into three steps. The extra two steps are outlined in 8a and do not change the meaning of the diagram. First, the children of the Col can be moved outside it. Then the Col can be split into separate Align and Distribute relations that reference the same children. Finally, back in Figure 3, the Distribute relation can be retargetted to space the label from the planets instead of just Mercury. We work backwards from equivalences like the ones in 8a to design a layout semantics that preserves this property as much as possible.
algorithm 1 (based on one provided by Jetpack Compose (and, 2023)), provides pseudocode for Col’s layout algorithm, which we will split into separate Align and Distribute layouts. Col takes as input an alignment (left, centerX, or right), a spacing between elements in pixels, and a size proposal that is not used in this example. It then calls the layout algorithm of each of its children, who determine their own sizes. These sizes are used later. Next, Col places each of its children in its local coordinate space. The x coordinate refers to the left edge of the child. The y coordinate refers to the top edge of the child and is initialized to 0. Each child is placed horizontally based on the alignment parameter. In each alignment case, 0 is used as the guideline to which all left edges, horizontal centers, or right edges are aligned. (The Col can be moved by its parent. This placement is happening in Col’s local space.) Next, the node is placed and the next left edge is calculated by moving spacing pixels to the right of the previous node. Finally, the width and height of the Col are returned for use by its own parent. Notice that this algorithm can be cleanly separated into a horizontal Align and a vertical Distribute relation by using the lines labeled X and Y, respectively. Though splitting Col’s layout is straightforward, it introduces several architectural problems that we address next.
4.2.2. Relaxing Node Ownership to Bounding Box Dimension Ownership
typeBBox<T>={
left?:T;centerX?:T;right?:T;
top?:T;centerY?:T;bottom?:T;
width?:T;height?:T
};
typeTransform<T>={
translate:{x?:T;y?:T}
};
typeScenegraphNode=
|{
type:"layout";
bbox:BBox<number>;
transform:Transform<number>;
children:Id[];
parent:Id|null;
bboxOwners:BBoxOwners<Id>;
transformOwners:TransformOwners<Id>;
}|{
type:"ref";
refId:Id;
parent:Id|null;
};
In a tree structure, a node is owned by a single parent and only that parent’s layout may modify the node. As a result, the relation established by that parent (such as a Col) can never be mutated. This makes UI specifications declarative: a relation like Col always corresponds to a column in the diagram. This helps ensure a tight vocabulary correspondence (subsection 3.1) between a UI description and its rendering. We want to preserve this correspondence in the presence of overlaps, which can cause a node to have more than one parent. To account for this multiplicity, instead of a parent node owning an entire child node, a parent node owns specific dimensions of a child node’s bounding box. Figure 7 summarizes the modifications to a tree-structured scenegraph datatype required to implement bounding box ownership. Bluefish throws an error if another layout tries to write to a dimension that is already owned, which guards against overconstrained layouts (such as aligning an element to two different elements that have already been placed). Tracking the specific owner allows us to determine the two layouts that conflict. Overconstrained layouts occur frequently when editing a diagram, but problems tend to be easy to localize with access to ownership information and when relations are added one at a time.
4.2.3. Execution Order
Notice that in the UI architecture, a layout node decides the order in which its child node’s layout functions are called. Most nodes call their children’s layouts by looping through them in the order they appear in the tree, but this is not always the case. For example, in flex layout, children that do not have a flex parameter are laid out before flexible children. Since the layout nodes in a Bluefish scenegraph form a tree structure, we can execute them the same way as in a UI layout architecture.
One area for flexibility in execution order is the Group component. This component does not position its children, but merely calls their layout functions. As a result, the logic of Group could be more sophisticated, picking an optimal order to layout its children or even calling a layout more than once. For simplicity, we execute children in a Group in the same order they appear in the tree. This approach is straightforward and seems to work well, but it does have some tradeoffs. Because Group executes its children in a fixed order, the user must be conscious of the order that relations are sequenced so that bounding box dimensions can be properly determined. For example, an Arrow’s children must be positioned before the Arrow is called. In our experience, sequencing relations becomes natural since it mirrors the order in which the diagram might be drawn by hand or in a direct manipulation editor like Figma (e.g., drawing nodes before edges between them). Determining an order automatically is complicated, because a layout can contain arbitrary code and its behavior may depend on which of its children’s bounding box dimensions are already defined. For example, the actual Col implementation in Bluefish checks whether one of its children has already been and then places the rest of its children to line up with that one. If none of the children have been placed, then it defaults to the origin of its parent frame. Future work may consider whether stronger guarantees about the behaviors of layouts could allow for automatic reordering without sacrificing too much layout expressiveness.
Another limitation of this simple approach is that bounding boxes are not updated for older nodes. In our running example, after Align executes its width and horizontal positions are unknown, because its children have not yet been placed along the x-axis. After Distribute executes, their positions are known, but this information does not propagate to the Align component. As a result, if the Align component is referenced it cannot report a width or horizontal position. This issue can be circumvented by referencing a containing Group instead of the relation or else by creating a new Group with the elements of the relation so that dimensions can be determined. In practice, we have found that relations are referenced far less often than Groups, since visual elements are typically Groups composed of several relations.
<Col>
{elms}
</Col>
<Group>
{elms}
<Col>
<Refto={elms}/>
</Col>
</Group>
<Group>
{elms}
<Align>
<Refto={elms}/>
</Align>
<Distribute>
<Refto={elms}/>
</Distribute>
</Group>
4.2.4. Lazy Materialization of Coordinate Transforms
To ensure that Bluefish is a conservative extension of UI architectures, layout algorithms like algorithm 1 must work correctly even when some of their children are references. As with splitting Col into two pieces, the ability to extract a component into a reference allows for additional equivalent specifications that lower authoring viscosity. For example, the specifications shown in 8a(a) and (b) differ in whether the children of the Col are nested or referenced respectively. When the layout method is called on a reference node, it triggers reference resolution to instead return information about the bounding box pointed to by the reference.
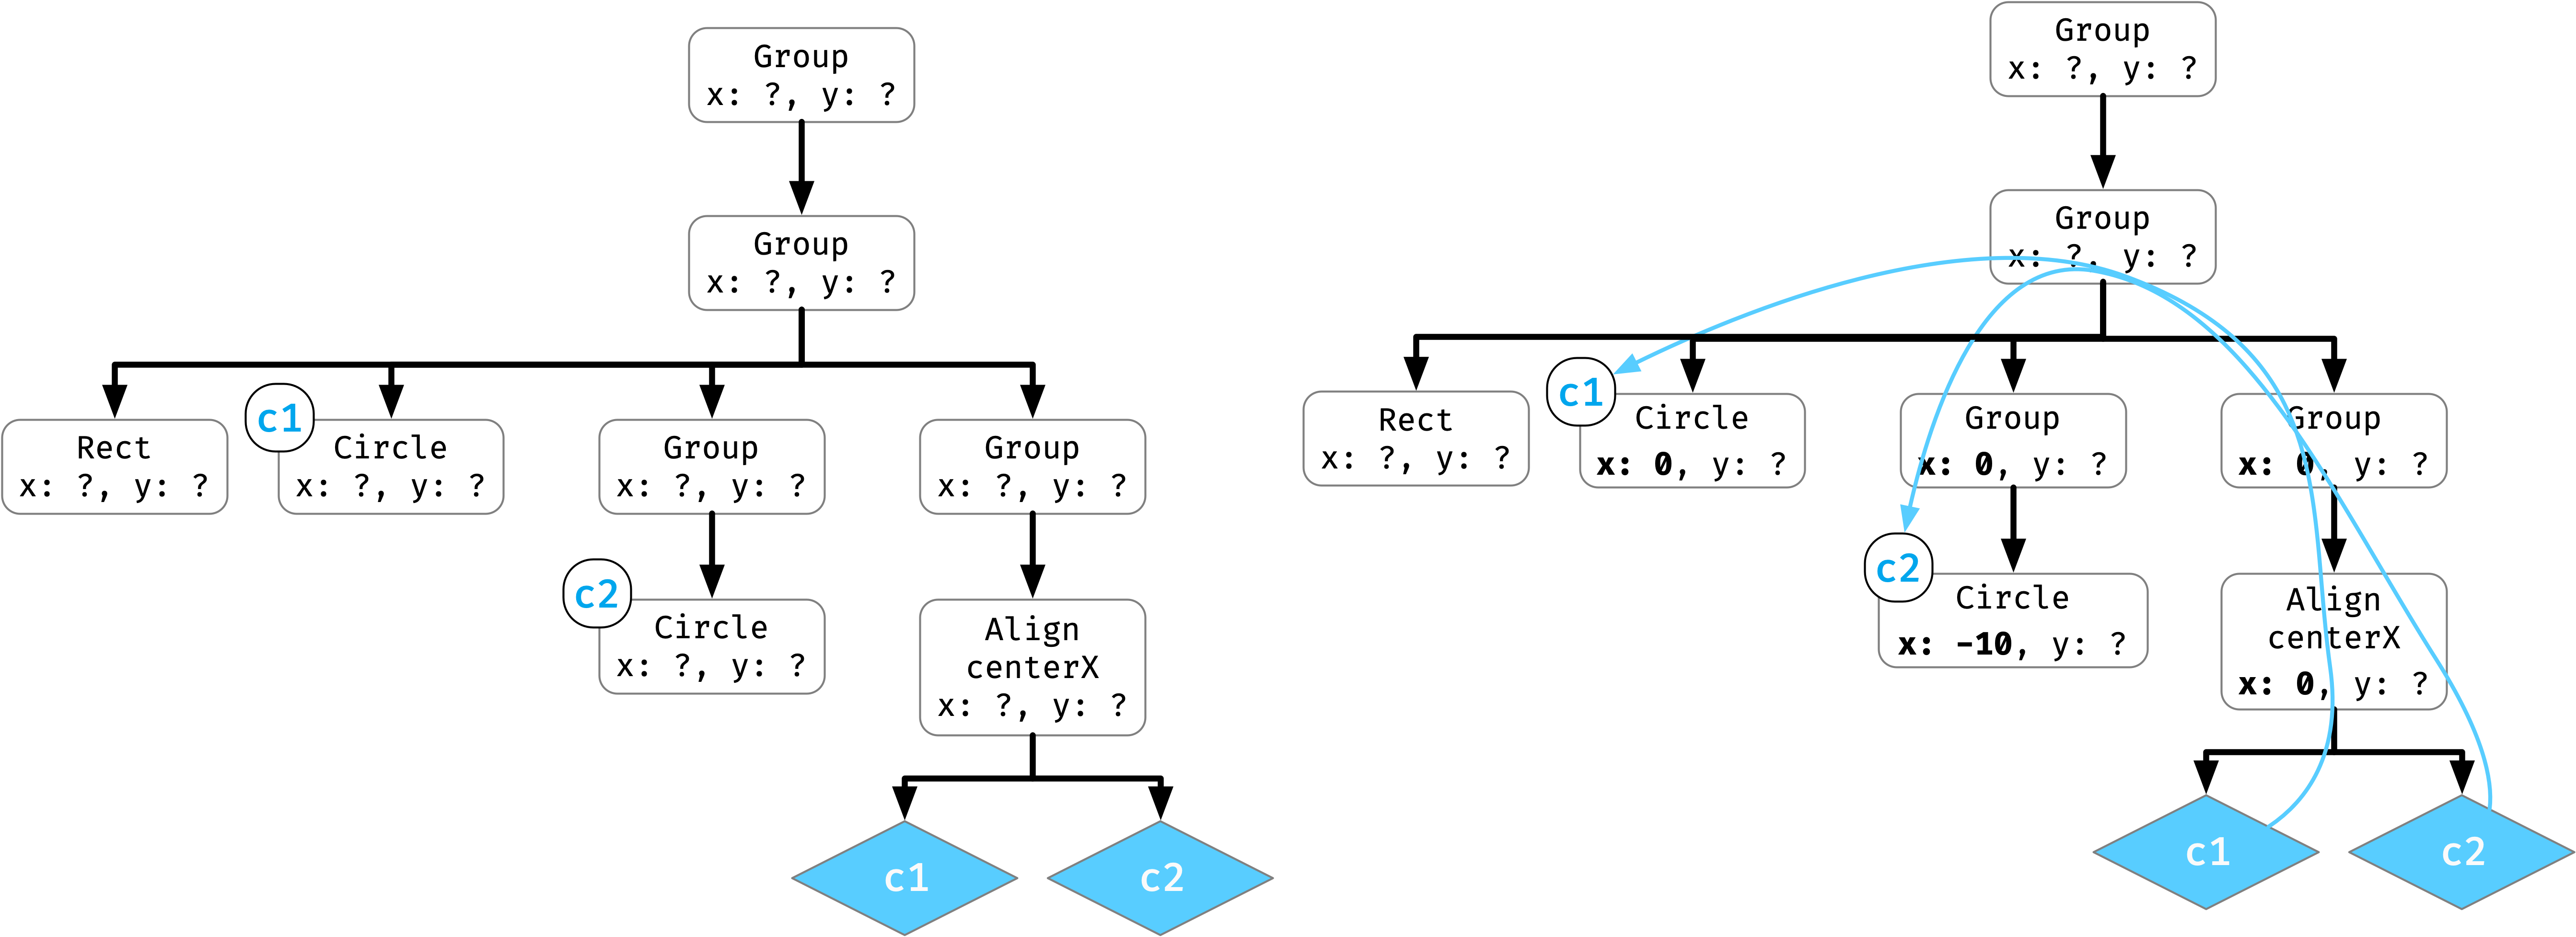
To resolve a reference, we have to transform the bounding box of the referent in to the reference’s coordinate frame. We accomplish this by walking the scenegraph between the reference and the referent through their least common ancestor. This is depicted in Figure 9. However, it is often the case that one or more of these intermediate nodes does not have a defined coordinate transform of its own. In these cases, we must materialize intermediate coordinate transforms. For example consider Figure 9, which depicts coordinate transform materialization during the layout of our running example. When the Align component needs to resolve one of its references, its own coordinate transform is not yet known. When this happens, we default the relevant the coordinate transform to the identity transform along the appropriate dimension. By deferring transform materialization lazily until a value is requested, we help ensure that the specification is as flexible as possible. If transforms were always defaulted, the position of every object would be fixed.
Lazy materialization complements bounding box ownership in several ways. First, where ownership handles overconstrained systems, lazy materialization handles typical underconstrained systems by setting default values for transforms. For example, though none of the elements, the Align, or Distribute were positioned explicitly, the visual elements of the diagram have well-defined positions after materialization. Second, when a transform is materialized, the source of the reference owns that dimension of the transform. This is important for preserving the declarative nature of the specification. For example, if the Align’s y coordinate were not owned, it could be set by a later relation. But this would have to force the circles to move, possibly breaking other relations those circles were involved in.
5. Example Statistical & Diagrammatic Graphics
To evaluate Bluefish’s expressivity, we create a gallery of diverse examples that span the gamut from complex UI layouts to statistical charts expressible with the Grammar of Graphics (GoG) (Wilkinson, 2012), through to diagrammatic graphic representations. These examples demonstrate that Bluefish’s approach to representing overlapping perceptual relations can support many different kinds of graphic representation. They also explore how representing elements and perceptual relations as components facilitates the creation of diagram DSLs as component libraries. Finally, they explain how Bluefish’s layout system integrates with external diagram layout algorithms.
5.1. User Interface: Jetpack Compose Sleep App (Figure 1 & Figure 10)
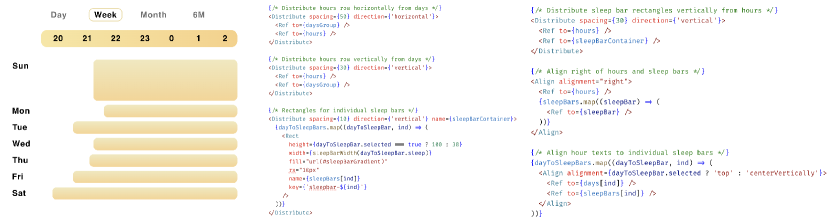
To explain their low-level layout API, the developers of Jetpack Compose present a complex layout problem for a sleep tracker app that cannot be solved in a tree hierarchy and must be accomplished with a fully custom layout (and, 2023). We recreate this example in Bluefish using only the standard library of primitives and taking advantage of overlapping relations.
This layout is presented in Figure 10 and consists of three pieces: an hours header, day labels, and sleep bars. The day labels must appear on the left side of the screen and below the hours header, and the hours header must appear to the right of the day labels. The sleep bars are positioned relative to the hours header, but must be vertically aligned to their corresponding day labels. This layout cannot be easily expressed in a hierarchy, since the horizontal and vertical directions of each component are positioned relative to two different components. With Bluefish, however, we can author this custom layout using Refs to express overlaps. This case demonstrates that, even for user interfaces, support for overlapping relations can improve the authoring process.
5.2. Statistical Graphics
Statistical charts also feature overlapping relations. Like UI frameworks, toolkits built on the Grammar of Graphics (GoG) assume tree-structured hierarchies. While this works well for basic charts, GoG does not support annotations. As a result, chart authors often hard code annotation locations, losing their connection to the data they are annotating (Pu and Kay, 2023).
To evaluate Bluefish’s ability to express statistical charts, we recreate plots that feature mixtures of traditional chart elements (e.g., marks, scales, axes) and relational information (e.g., annotations, links, etc.).
We begin by implementing a prototype GoG library, called Bluefish Plot, on top of the core Bluefish primitive elements and perceptual groups.
Its syntax is based on Observable Plot (Bostock and Rivière, 2020) and Victory Charts (boygirl, 2015) (a React-based charting library). Notably, we replace the need for an ordinal scale with Row and Col to position discrete data (e.g., for bar marks). This turns a data transformation (ordinal scaling) into an explicit perceptual relation.
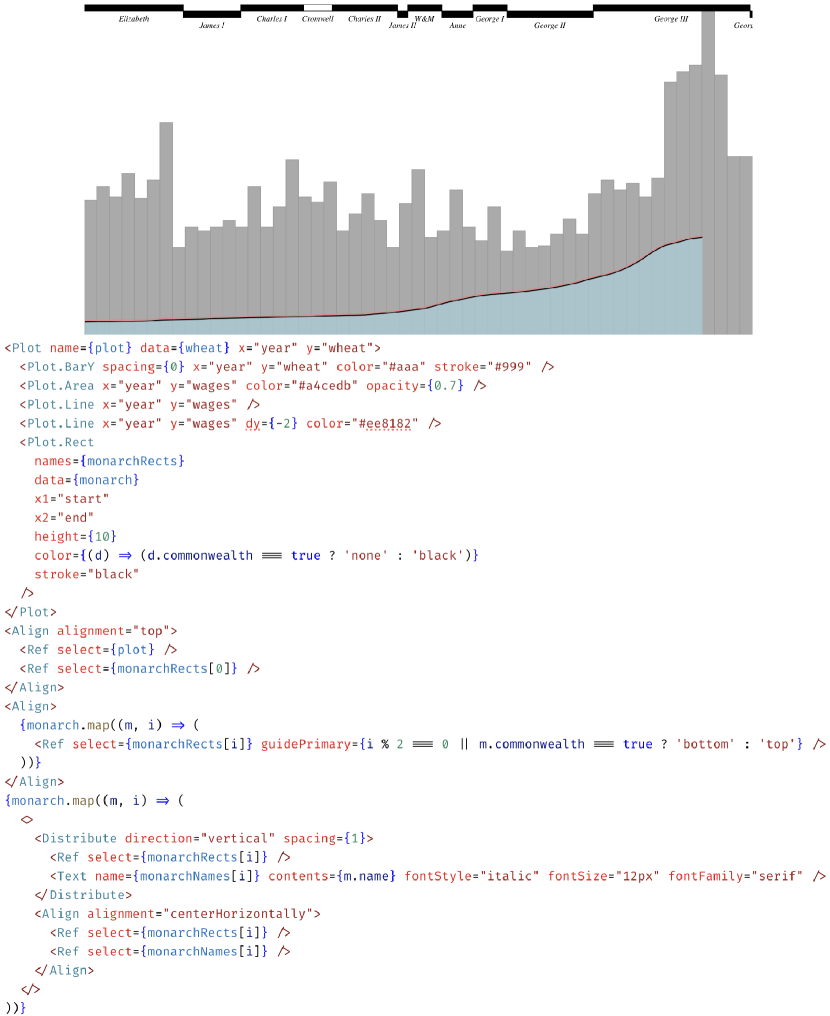
Playfair’s Wheat & Wages (Figure 11) is largely a standard statistical graphic, but it contains one unusual feature: an array of labeled rectangles lists monarchs, sized by the duration of their reign, and alternately offset vertically for legibility (Oliver Cromwell being the sole exception as he ruled as Lord Protector rather than monarch).
Positioning these elements in a GoG-based library (e.g., Protovis111https://mbostock.github.io/protovis/ex/wheat.html (Bostock and Heer, 2009) or Vega-Lite222https://vega.github.io/vega-lite/examples/wheat_wages.html (Satyanarayan et al., 2016)) requires hardcoding coordinates and manually calculating offsets.
For instance, in Vega-Lite, four data transformations are used, with two formula calculations: ((!datum.commonwealth&&datum.index%2)?-1:1)*2+95 to vertically offset the rectangles, and +datum.start+(+datum.end-+datum.start)/2 to horizontally position the labels.
In contrast, with Bluefish, we leave the rectangles’ y-coordinates undefined and, outside the plot, use Aligns and Cols to set the y-coordinate of the bars and place the labels, respectively — no hardcoding or coordinate calculations required.
ChartAccent We recreated a key explanatory figure from Ren et al.’s ChartAccent system (Ren et al., 2017). In particular, the authors identify a two-dimensional design space for annotations: the form the annotation takes (text, shape, highlight, etc.) and its target (data item, coordinate space, chart element). Bluefish’s perceptual relation standard library covers each point along these axes. As Bluefish affords consistent, universal composition, changing the form of an annotation requires only trivial modifications to the specification. Moreover, as all part of the chart are elements, any of them may serve as the target of an annotation — including other annotations or perceptual relations.
Limitations.
Bluefish does not currently represent scales in its relational scenegraph.
As a result, we had to create new scale-aware marks like ScaledRect and ScaledDot that use scale information during layout.
Future versions of Bluefish may integrate scales into the coordinate transform abstraction.
5.3. Data-Driven Diagrams
We also demonstrate that Bluefish can be used to construct data-driven diagrams in different domains.
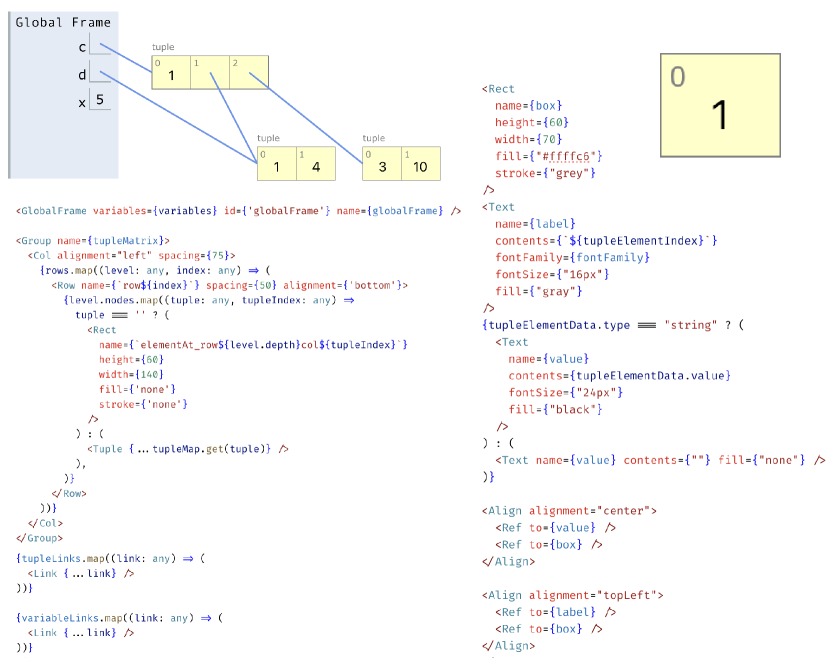
Python Tutor (Figure 1 & Figure 12) is a visualization of program state that has been used by tens of millions of people across the world, and has seeded research publications (Guo, 2013, 2021). It takes as input a program execution trace produced by a debugger (e.g., PDB in Python) serialized as JSON, and constructs the visualization using a mix of jQuery and D3 (Bostock et al., 2011). The resultant visualizations are deeply nested hierarchies: the stack is composed of stack frames which are, in turn, composed of lists of variable-value pairs. Moreover, the visualizations feature many visual links that cross hierarchy boundaries — for instance, from a stack frame to an object on the heap, or between consecutive items in a linked list. To depict these relationships, the original visualization uses HTML tables to lay out the hierarchy and an additional JavaScript library, jsPlumb, to draw connections. In contrast, we are able to express all of these relationships more straightforwardly with Bluefish’s perceptual grouping operators. As these operators can be consistently composed, each level of the hierarchy (and relationships between them) are specified in a similar manner. Moreover, due to our principle of creation by composition, it can be a natural part of the authoring process to abstract these deeply nested, domain-specific groups as custom tags (e.g., GlobalFrame and Tuple in Figure 12). In doing so, these new domain-specific components could be reused or repurposed for new use cases — for instance, to create pedagogical diagrams for classroom use (Whatley et al., 2021).
Pythagorean Theorem (Figure 1) Bluefish’s primitives help us maintain the semantics of the step-by-step construction of Euclidean geometry proof diagrams favored by both paper sketches and software packages like GeoGebra (Kortenkamp, 1999; Sangwin, 2007). For instance, consider Byrne’s colorization of Euclid’s proof of the Pythaagorean Theorem. The proof begins by drawing a right-angled triangle: in Bluefish, we express this as three Point elements, connected by Link groupings and positioned via a custom RightAngle grouping. Next, the three sides are squared: here, one could specify these squares as Rect elements but it is more semantically-aligned to instead express a custom perceptual grouping that Squares four points. The rest of the proof follows these steps with custom Bluefish perceptual groupings to depict Angle, Intersection, and PerpendicularBisector.
This example also provides a helpful point of comparison between Bluefish and the Penrose diagramming tool (Ye et al., 2020). The Penrose specification uses a Disjoint operator to disambiguate which square is drawn (i.e., the square to the “left” or “right” of the line connecting two points). Such an operation is not expressible in Bluefish for two reasons: it separates arguments rather than grouping them together, and it requires a global solver as any one Disjoint requires accounting for all other instances to compute the ultimate position. Instead, in Bluefish, we capture this ambiguity via a flip parameter: by default, the grouping yields a square on the “right”; setting this property to true yields a square on the “left.” More importantly, however, is the separation Penrose enforces between specfying the data or semantics of the diagram, and its visual appearance — a distinction found in HTML and CSS as well as TeX. In contrast, Bluefish is inspired by modern user interface toolkits, which opt to colocate structure, content (data), and styling within individual components. As a result, while Penrose makes it easy to replace the global style of a diagram (akin to replacing the stylesheet of a web page), Bluefish enables a more modular approach where individual components can be reused in new contexts.
5.4. Integrations with External Layout Algorithms
Here, we evaluate how Bluefish’s choice of local propagation layout facilitates integration with external layout algorithms.
Vega-Label (Kittivorawong et al., 2020) is an efficient algorithm for labeling points that first rasterizes the mark to be annotated, and then searches for available nearby space to place labels. Though it implements a general purpose algorithm, its API is specialized to the Vega (Satyanarayan et al., 2015) visualization language. Since Bluefish’s layout API allows arbitrary code, we only needed to change this outer API to read and write Bluefish scenegraph nodes instead of Vega’s. This change also expands the expressive gamut of the layout algorithm: whereas Vega-Label is limited to only using text marks as labels, our Bluefish version allows any element to serve as either the label or target mark, because all components use a shared bounding box interface. We use this adapted Vega-Label in our ChartAccent example to automatically position textual labels on dot marks.
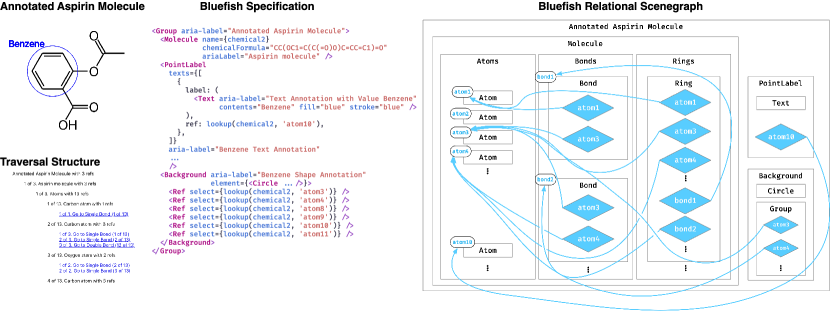
SmilesDrawer (Probst and Reymond, 2018) produces molecule diagrams from textual strings in the Simplified Molecular-Input Line-Entry System (SMILES) format. SmilesDrawer creates an internal, semantically-meaningful representation of the molecule (i.e., identifying which elements correspond to atoms, bonds, and carbon rings). However, this representation is not preserved in the output SVG. To construct the Bluefish adapter, we repurpose this information to create perceptual groups. Moreover, although rings are not technically required to lay out the final diagram (atoms and bonds are sufficient), we preserve this grouping information to facilitate downstream tools (section 6). Figure 13 illustrates specifying a chemical diagram in Bluefish via SmilesDrawer.
5.5. Limitations
Bluefish is not able to express two categories of graphic representations: infographics and scientific illustrations. Infographics typically rely on bespoke manual layouts; as Bluefish’s perceptual groupings and local propagation instantiate an automatic layout strategy, the system is a poor fit for such graphics. Scientific illustrations, on the other hand, make heavy use of drawings. Although drawings do take advantage of perceptual grouping, they often aim to be naturalistic. Thus, perceptual groups are often an emergent property of scientific illustration, rather than being imposed explicitly and economically.
6. Case Study: Retargeting Bluefish’s Scenegraph for Screen Readers
As we demonstrated with our example gallery, Bluefish’s relational scenegraph encodes semantic information about perceptual relations. While the previous section highlighted the importance of this for authoring graphics, in this case study we explore how the relational scenegraph can help downstream tools reason about the semantics of a graphic representation. Surfacing relational information is a central challenge to making graphics accessible to assistive technology such as screen readers (Young, 2020; Elavsky et al., 2023). This relational structure conveys the semantics of the graphic domain, such as part-to-whole relationships and connections between elements but is rarely reflected in the Document Object Model (DOM) — an issue exacerbated by the fact that these relational structures are often only implicitly encoded in the underlying specifications (e.g., those written in UI frameworks or GoG-based libraries) as we discuss in subsection 3.1 and section 5. In contrast, Bluefish’s perceptual groupings and Ref components explicitly express relations, and these structures are preserved in the relational scenegraph and output rendering. In this section, we build a prototype screen reader tool to demonstrate how the relational scenegraph can be traversed in a manner aligned with the graphic domain’s semantics. Our prototype is inspired by Olli (Blanco et al., [n. d.]), an open source library that converts statistical visualizations into hierarchical keyboard-navigable structures following the design space proposed by Zong, Lee, Lundgard et al. (Zong et al., 2022a).
We begin by traversing the SVG output produced by Bluefish to recover the relational scenegraph.
All elements are rendered within a containing <g> tag to reflect hierarchy.
To express adjacency, Bluefish attaches a unique ID to every element, and Ref components are rendered as empty <g> tags with data-to metadata pointing to another ID; for example,
<gid=":r3h9:"class="ref"data-to=":r2v:"></g>
.
Unlike Bluefish’s compound graph, where Refs are unidirectional, this prototype constructs bidirectional links to allow users to jump back-and-forth along adjacencies.
Once the relational scenegraph has been recovered, we build the screen reader navigable structure by traversing the scenegraph’s hierarchy relation. <a> (anchor) are used to hyperlink pairs of nodes that have an adjacency relationship, and textual descriptions are drawn from aria-labels defined in the backing Bluefish specification. A user interacts with a this traversal structure like an Olli structure: pressing the up and down arrow keys moves up and down the hierarchy, while left and right arrow keys move between siblings at the same level. When a user encounters a hyperlink, they can press the Enter key to follow the link and jump to another part of the structure.
ChartAccent. We first apply the prototype to our recreated ChartAccent example, because is it a heavily annotated statistical graphic. In Olli, which uses a tree structure, each annotation is surfaced as an individual branch off the root node of the structure, siloed off from other annotations as well as the visual encodings (Zong et al., 2022a). As a result, users have no way to move between annotations or visual encodings without first ascending to a common ancestor — a potentially cumbersome operation if users are deep within a particular branch. Moreover, ChartAccent features annotations of annotations, and such higher-order annotations do not have a clear location in either the Olli tree or the backing design space (Zong et al., 2022a). In contrast, our prototype allows for more nimble navigation of this richly relational graphic: users can move between annotations and data values by following hyperlinks in addition to traditional vertical and horizontal navigation of the hierarchy. Moreover, since we construct the screen reader structure simply by traversing the relational scenegraph, it is able to account for higher-order annotations without any special casing. Strict adherence to the scenegraph limits our prototype’s ability to build domain-specific traversal structures (e.g., special branches for the x-axis, y-axis, or grid like Olli). This could be addressed by building an Olli-style adapter for the Bluefish Plot grammar, or we could take advantage of Bluefish’s extensible primitives by modeling these domain-specific structures directly in Bluefish as additional perceptual relations.
Chemical Diagrams.
Figure 13 presents an abbreviated Bluefish specification, relational scenegraph, and the traversal output for an annotated Aspirin molecule.
This structure contains a group of atoms, a group of bonds, and a group of rings.
With the default output produced by SmilesDrawer, a screen reader can only focus and narrate the textual SVG elements — an issue for molecules that do not produce any textual output such as a standalone benzene ring.
Although SmilesDrawer embeds the SMILES notation (e.g., CC(OC1=C(C(=O)O)C=CC=C1)=O for Aspirin) as a data attribute in the SVG output, this attribute is not ARIA (Accessible Rich Internet Applications) compatible.
As a result, screen readers ignore it altogether.
However, even if this notation were to be surfaced correctly, it would only allow for a single start-to-end narration of the chemical structure, rather than the richer traversals a sighted reader could perform over the graphical representation.
By contrast, our prototype preserves the hierarchy of rings, bonds, and atoms in the original diagram. Additionally, its structure affords multiple traversal orders. For example, the user can choose to traverse all bonds by entering the bond group, or they may enter a particular bond and follow adjacency links to traverse neighboring atoms and rings, walking incrementally through the entire molecular structure. This relational structure is similar to the one proposed by Sorge et al. for accessible chemical diagrams (Sorge et al., 2015) — a reflection of how the Bluefish relational scenegraph preserves domain semantics. Sorge et al. compute blocks, like carbon rings and functional groups of atoms, and arrange these groups in a tree-like structure that is navigable similar to Olli (Blanco et al., [n. d.]). Their labels for atoms include information about relationships — for example, “Carbon atom shared with Benzene ring, single bonded to oxygen.” This information is reflected similarly in the output of children links of atoms (see Figure 13). Since our prototype is a generic tool and only relies on the information provided by SmilesDrawer, it cannot express the same level of fidelity as Sorge et al.’s work. However, as with ChartAccent, this gap can be addressed via a special adapter for chemical diagrams or by improving the output of the molecule perceptual relations.
Notice how Bluefish helped enable this prototype. By allowing authors to create overlapping perceptual relations, the path of least resistance when authoring a Bluefish specification can lead to higher-fidelity screen reader traversal structures. Moreover, since Bluefish allows users to define domain-specific elements and relations, it is possible for library authors to create domain-specific ARIA labels and traversal structures with the same concepts as the rest of a Bluefish specification.
7. Discussion and Future Work
Interactive and Animated Graphic Representations. In this paper, we have explored formalisms of perceptual relations in static graphics, and an immediate next step might consider how our perceptual relations relate to or inform interaction and animation grammars.
First, there are temporal analogs to perceptual relations. For example, manifesting similar attribute temporally is akin to the principle of common fate (Wagemans et al., 2012).
Similarly, we could think of Bluefish’s Distribute as distributing elements along a time axis to stagger movements in time, and a temporal Align as unifying the start or end of multiple animations.
In fact, these temporal analogs are quite similar to Gemini’s concat and sync operations, respectively (Kim and Heer, 2020).
Animations may also be staged or nested, conveying information similar to common region, as in Canis/CAST (Ge et al., 2020, 2021).
Or an animation may follow a path between two elements to represent a temporal link between them.
There are analogs in interaction as well. Perceptual relations appear to manifest in interactions as on-demand relations. For example, brushing can be thought of as on-demand common region. Just as common regions can be nested, so too can brushes (Chen, 2003). Selections that drive changes in color signify the relation of deselected elements using similar attribute (although one could also argue this is an example of figure-ground separation). Moreover, projected selections (Satyanarayan et al., 2016) may be signified by a user’s intent to select data by similar attribute — reflecting the underlying relationship between the data points.
Inspired by Animated Vega-Lite (Zong et al., 2022b), which proposed a unifying framework for animation and interaction abstractions, we believe a productive line of future work could similarly examine whether perceptual relations across these two modalities and the static relations we covered in this paper could be unified.
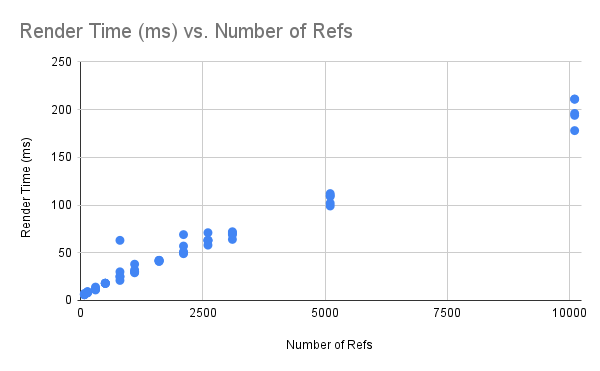
Performance. Though performance was not the primary focus of this work, as we extend the principles of Bluefish to interactive and animated contexts, performance will become more critical. We ran a preliminary performance evaluation to characterize the Bluefish runtime. Our analysis is summarized in Figure 14. As references are Bluefish’s main extension to UI framework runtimes, we tested Bluefish on variations of the Python Tutor example by increasing the number of tuples in the Python Tutor diagram’s heap to increase the number of Refs in the test diagram. We tested the diagrams on Chrome version 117 on an M1 Pro CPU with 32GB of RAM. We used JavaScript’s Date function to measure the time spent in Bluefish’s layout calls. We found that render time scaled linearly with the number of references and took about 200ms to render with 10000 references. These results suggest that Bluefish’s performance is acceptable for authoring static graphics at interactive speeds around 100ms. Moreover, the linear performance scaling suggests optimizations could improve Bluefish’s performance towards sub-16ms rendering without significant changes to our approach of extending UI layout architectures.
Empirical Studies of Effectiveness. A diagram’s effectiveness is closely tied to its relational structure (Norman, 2014; Tversky, 2001). The role of perceptual relations in diagram understanding and use has been explored by various prominent cognitive scientists, some of whom develop relational structures similar to Bluefish’s own relational scenegraph (Pinker, 1990; Larkin and Simon, 1987; Norman, 2014). Inspired by Cleveland & McGill’s perceptual studies on the relative effectiveness of different aspects of visual elements (like size, shape, and color) (Cleveland and McGill, 1984), Bluefish’s formalism of perceptual relations, which brings formal precision to structures identified by cognitive scientists, could serve as a platform for better understanding how different perceptual relations affect diagram comprehension. Such insights could help inform the automatic generation of effective graphic representations as the Draco (Moritz et al., 2019) system formalized design knowledge for statistical charts.
Formalizing Visual Structure and Domain Semantics. While our standard library of perceptual relations covers a large number of use cases, different domains make different choices about the perceptual relations they use to convey domain-specific semantic intent. For example, when developing our Pythagorean Theorem diagram (Figure 1 and subsection 5.3), we found ourselves making new perceptual relations specific to Euclidean geometry such as line-line intersections and perpendicular bisectors. These relations are salient encodings for the specific kinds of data found in Euclidean geometry. Similarly, in hand-drawn maps for routing directions, specific features of a line convey semantic intent (Tversky et al., 2000) — for instance, a straight line means “go down,” a curved line means “follow around,” and a line with a sharp corner can signify a “turn.” The core idea underlying Bluefish is that more powerful formalisms of visual structure lowers authoring viscosity while simultaneously preserving semantic information about a graphic for later analysis and processing. In light of domains like Euclidean geometry and maps, and in the spirit of Mackinlay’s expressiveness principle(Mackinlay, 1986), Tversky’s correspondence principle(Tversky, 2019), and Kindlmann and Scheidegger’s algebraic design process (Kindlmann and Scheidegger, 2014), we believe that in order to speak systematically about the mapping between data and diagram, we ought to formalize salient visual structures.
8. Acknowledgements
Thanks to Josh Horowitz for pointing us to modern UI local propagation layouts. Thanks to Jonathan Zong for invaluable help with the accessibility case study. Thanks to Tom George for his help on a previous iteration of the project. This material is based upon work supported by the National Science Foundation under Grant No. 1745302.
References
- (1)
- app (2022) 2022. Swift Charts. https://developer.apple.com/documentation/charts
- and (2023) 2023. Custom layouts — Jetpack Compose. https://developer.android.com/jetpack/compose/layouts/custom.
- Abrahams and Harper (2019) Dave Abrahams and John Harper. 2019. Building Custom Views with SwiftUI - WWDC19 - Videos - Apple Developer — developer.apple.com. https://developer.apple.com/videos/play/wwdc2019/237 and https://developer.apple.com/documentation/swiftui/building_custom_views_in_swiftui.
- Badros et al. (2001) Greg J Badros, Alan Borning, and Peter J Stuckey. 2001. The Cassowary linear arithmetic constraint solving algorithm. ACM Transactions on Computer-Human Interaction (TOCHI) 8, 4 (2001), 267–306.
- Barth (2016) Adam Barth. 2016. Flutter’s Rendering Pipeline. https://youtu.be/UUfXWzp0-DU?si=5brc7qRrouqK9QCU&t=164.
- Benedikt and Koch (2009) Michael Benedikt and Christoph Koch. 2009. XPath leashed. ACM Computing Surveys (CSUR) 41, 1 (2009), 1–54.
- Bigelow et al. (2014) Alex Bigelow, Steven Drucker, Danyel Fisher, and Miriah Meyer. 2014. Reflections on how designers design with data. In Proceedings of the 2014 International Working Conference on Advanced Visual Interfaces. 17–24.
- Bigelow et al. (2016) Alex Bigelow, Steven Drucker, Danyel Fisher, and Miriah Meyer. 2016. Iterating between tools to create and edit visualizations. IEEE Transactions on Visualization and Computer Graphics 23, 1 (2016), 481–490.
- Blackwell et al. (2001) Alan F Blackwell, Carol Britton, Anna Cox, Thomas RG Green, Corin Gurr, Gada Kadoda, Maria S Kutar, Martin Loomes, Chrystopher L Nehaniv, Marian Petre, et al. 2001. Cognitive dimensions of notations: Design tools for cognitive technology. In Cognitive Technology: Instruments of Mind: 4th International Conference, CT 2001 Coventry, UK, August 6–9, 2001 Proceedings. Springer Berlin Heidelberg, 325–341.
- Blanco et al. ([n. d.]) Matthew Blanco, Jonathan Zong, and Arvind Satyanarayan. [n. d.]. Olli: An Extensible Visualization Library for Screen Reader Accessibility. ([n. d.]).
- Boag et al. (2002) Scott Boag, Don Chamberlin, Mary F Fernández, Daniela Florescu, Jonathan Robie, Jérôme Siméon, and Mugur Stefanescu. 2002. XQuery 1.0: An XML query language. (2002).
- Borning et al. (1996) Alan Borning, Richard Anderson, and Bjorn Freeman-Benson. 1996. Indigo: A local propagation algorithm for inequality constraints. In Proceedings of the 9th annual ACM symposium on User interface software and technology. 129–136.
- Bostock and Heer (2009) Michael Bostock and Jeffrey Heer. 2009. Protovis: A graphical toolkit for visualization. IEEE transactions on visualization and computer graphics 15, 6 (2009), 1121–1128.
- Bostock et al. (2011) Michael Bostock, Vadim Ogievetsky, and Jeffrey Heer. 2011. D3 data-driven documents. IEEE transactions on visualization and computer graphics 17, 12 (2011), 2301–2309.
- Bostock and Rivière (2020) Mike Bostock and Philippe Rivière. 2020. Observable Plot. https://github.com/observablehq/plot.
- boygirl (2015) boygirl. 2015. Victory. https://github.com/FormidableLabs/victory.
- Chen (2003) Hong Chen. 2003. Compound brushing [dynamic data visualization]. In IEEE Symposium on Information Visualization 2003 (IEEE Cat. No.03TH8714). 181–188. https://doi.org/10.1109/INFVIS.2003.1249024
- Clark et al. (1999) James Clark, Steve DeRose, et al. 1999. XML path language (XPath).
- Cleveland and McGill (1984) William S Cleveland and Robert McGill. 1984. Graphical perception: Theory, experimentation, and application to the development of graphical methods. Journal of the American statistical association 79, 387 (1984), 531–554.
- Cruz and Leveille (2000) I.F. Cruz and P.S. Leveille. 2000. Implementation of a constraint-based visualization system. In Proceeding 2000 IEEE International Symposium on Visual Languages. 13–20. https://doi.org/10.1109/VL.2000.874345
- Elavsky et al. (2023) Frank Elavsky, Lucas Nadolskis, and Dominik Moritz. 2023. Data Navigator: An accessibility-centered data navigation toolkit. arXiv:2308.08475 [cs.HC]
- Ellson et al. (2001) John Ellson, Emden Gansner, Lefteris Koutsofios, Stephen C North, and Gordon Woodhull. 2001. Graphviz—open source graph drawing tools. In International Symposium on Graph Drawing. Springer, 483–484.
- Felleisen (1991) Matthias Felleisen. 1991. On the expressive power of programming languages. Science of computer programming 17, 1-3 (1991), 35–75.
- Ge et al. (2021) Tong Ge, Bongshin Lee, and Yunhai Wang. 2021. Cast: Authoring data-driven chart animations. In Proceedings of the 2021 CHI Conference on Human Factors in Computing Systems. 1–15.
- Ge et al. (2020) Tong Ge, Yue Zhao, Bongshin Lee, Donghao Ren, Baoquan Chen, and Yunhai Wang. 2020. Canis: A High-Level Language for Data-Driven Chart Animations. In Computer Graphics Forum, Vol. 39. Wiley Online Library, 607–617.
- Granström ([n. d.]) Pontus Granström. [n. d.]. Diagrammar: Simply Make Interactive Diagrams. YouTube. https://www.youtube.com/watch?v=gT9Xu-ctNqI
- Guo (2021) Philip Guo. 2021. Ten million users and ten years later: Python tutor’s design guidelines for building scalable and sustainable research software in academia. In The 34th Annual ACM Symposium on User Interface Software and Technology. 1235–1251.
- Guo (2013) Philip J Guo. 2013. Online python tutor: embeddable web-based program visualization for cs education. In Proceeding of the 44th ACM technical symposium on Computer science education. 579–584.
- Head et al. (2022) Andrew Head, Amber Xie, and Marti A Hearst. 2022. Math Augmentation: How Authors Enhance the Readability of Formulas using Novel Visual Design Practices. In Proceedings of the 2022 CHI Conference on Human Factors in Computing Systems. 1–18.
- Hoffswell et al. (2018) Jane Hoffswell, Alan Borning, and Jeffrey Heer. 2018. SetCoLa: High-Level Constraints for Graph Layout. In Computer Graphics Forum, Vol. 37. Wiley Online Library, 537–548.
- Holten (2006) Danny Holten. 2006. Hierarchical edge bundles: Visualization of adjacency relations in hierarchical data. IEEE Transactions on visualization and computer graphics 12, 5 (2006), 741–748.
- Hutchins et al. (1985) Edwin L Hutchins, James D Hollan, and Donald A Norman. 1985. Direct manipulation interfaces. Human–computer interaction 1, 4 (1985), 311–338.
- Kilpatrick (2022) Ian Kilpatrick. 2022. CSS Layout API Explained. https://github.com/w3c/css-houdini-drafts/blob/main/css-layout-api/EXPLAINER.md.
- Kim et al. (2022) Hyeok Kim, Ryan Rossi, Fan Du, Eunyee Koh, Shunan Guo, Jessica Hullman, and Jane Hoffswell. 2022. Cicero: A declarative grammar for responsive visualization. In Proceedings of the 2022 CHI Conference on Human Factors in Computing Systems. 1–15.
- Kim and Heer (2020) Younghoon Kim and Jeffrey Heer. 2020. Gemini: A grammar and recommender system for animated transitions in statistical graphics. IEEE Transactions on Visualization and Computer Graphics 27, 2 (2020), 485–494.
- Kindlmann and Scheidegger (2014) Gordon Kindlmann and Carlos Scheidegger. 2014. An algebraic process for visualization design. IEEE transactions on visualization and computer graphics 20, 12 (2014), 2181–2190.
- Kittivorawong et al. (2020) Chanwut Kittivorawong, Dominik Moritz, Kanit Wongsuphasawat, and Jeffrey Heer. 2020. Fast and flexible overlap detection for chart labeling with occupancy bitmap. In 2020 IEEE Visualization Conference (VIS). IEEE, 101–105.
- Kortenkamp (1999) Ulrich H Kortenkamp. 1999. Foundations of dynamic geometry. Ph. D. Dissertation. ETH Zurich.
- Krueger et al. (2021) Ryan Krueger, Jesse Michael Han, and Daniel Selsam. 2021. Automatically Building Diagrams for Olympiad Geometry Problems.. In CADE. 577–588.
- Larkin and Simon (1987) Jill H Larkin and Herbert A Simon. 1987. Why a diagram is (sometimes) worth ten thousand words. Cognitive science 11, 1 (1987), 65–100.
- Lettieri (2022) Paul Lettieri. 2022. Compose custom layouts with SwiftUI - WWDC22 - Videos - Apple Developer — developer.apple.com. https://developer.apple.com/videos/play/wwdc2022/10056/ and https://developer.apple.com/documentation/swiftui/composing_custom_layouts_with_swiftui.
- Lex et al. (2014) Alexander Lex, Nils Gehlenborg, Hendrik Strobelt, Romain Vuillemot, and Hanspeter Pfister. 2014. UpSet: Visualization of Intersecting Sets. IEEE Transactions on Visualization and Computer Graphics (InfoVis) 20, 12 (2014), 1983–1992. https://doi.org/10.1109/TVCG.2014.2346248
- Li et al. (2020) Guozheng Li, Min Tian, Qinmei Xu, Michael J McGuffin, and Xiaoru Yuan. 2020. Gotree: A grammar of tree visualizations. In Proceedings of the 2020 CHI Conference on Human Factors in Computing Systems. 1–13.
- Liu et al. (2021) Zhicheng Liu, Chen Chen, Francisco Morales, and Yishan Zhao. 2021. Atlas: Grammar-based Procedural Generation of Data Visualizations. In 2021 IEEE Visualization Conference (VIS). IEEE, 171–175.
- LYi et al. (2021) Sehi LYi, Qianwen Wang, Fritz Lekschas, and Nils Gehlenborg. 2021. Gosling: A grammar-based toolkit for scalable and interactive genomics data visualization. IEEE Transactions on Visualization and Computer Graphics 28, 1 (2021), 140–150.
- Ma’ayan et al. (2020) Dor Ma’ayan, Wode Ni, Katherine Ye, Chinmay Kulkarni, and Joshua Sunshine. 2020. How domain experts create conceptual diagrams and implications for tool design. In Proceedings of the 2020 CHI Conference on Human Factors in Computing Systems. 1–14.
- Mackinlay (1986) Jock Mackinlay. 1986. Automating the design of graphical presentations of relational information. Acm Transactions On Graphics (Tog) 5, 2 (1986), 110–141.
- McNutt (1912) Andrew M McNutt. 1912. No Grammar to Rule Them All: A Survey of JSON-style DSLs for Visualization. IEEE Transactions on Visualization and Computer Graphics (1912).
- McNutt and Chugh (2021) Andrew M McNutt and Ravi Chugh. 2021. Integrated visualization editing via parameterized declarative templates. In Proceedings of the 2021 CHI Conference on Human Factors in Computing Systems. 1–14.
- Moritz et al. (2019) Dominik Moritz, Chenglong Wang, Gregory Nelson, Halden Lin, Adam M. Smith, Bill Howe, and Jeffrey Heer. 2019. Formalizing Visualization Design Knowledge as Constraints: Actionable and Extensible Models in Draco. IEEE Trans. Visualization & Comp. Graphics (Proc. InfoVis) (2019). http://idl.cs.washington.edu/papers/draco
- Munzner (2014) Tamara Munzner. 2014. Visualization analysis and design. CRC press.
- Myers (1991) Brad A Myers. 1991. Graphical techniques in a spreadsheet for specifying user interfaces. In Proceedings of the SIGCHI Conference on Human Factors in Computing Systems. 243–249.
- Norman (2014) Don Norman. 2014. Things that make us smart: Defending human attributes in the age of the machine. Diversion Books.
- Park et al. (2017) Deokgun Park, Steven M Drucker, Roland Fernandez, and Niklas Elmqvist. 2017. Atom: A grammar for unit visualizations. IEEE transactions on visualization and computer graphics 24, 12 (2017), 3032–3043.
- Pinker (1990) Steven Pinker. 1990. A theory of graph comprehension. Artificial intelligence and the future of testing 73 (1990), 126.
- Probst and Reymond (2018) Daniel Probst and Jean-Louis Reymond. 2018. SmilesDrawer: parsing and drawing SMILES-encoded molecular structures using client-side JavaScript. Journal of chemical information and modeling 58, 1 (2018), 1–7.
- Pu and Kay (2023) Xiaoying Pu and Matthew Kay. 2023. How Data Analysts Use a Visualization Grammar in Practice. In Proceedings of the 2023 CHI Conference on Human Factors in Computing Systems. 1–22.
- Ren et al. (2017) Donghao Ren, Matthew Brehmer, Bongshin Lee, Tobias Höllerer, and Eun Kyoung Choe. 2017. Chartaccent: Annotation for data-driven storytelling. In 2017 IEEE Pacific Visualization Symposium (PacificVis). Ieee, 230–239.
- Ren et al. (2018) Donghao Ren, Bongshin Lee, and Matthew Brehmer. 2018. Charticulator: Interactive construction of bespoke chart layouts. IEEE transactions on visualization and computer graphics 25, 1 (2018), 789–799.
- Richards (2002) Clive Richards. 2002. The fundamental design variables of diagramming. Diagrammatic representation and reasoning (2002), 85–102.
- Sanderson (2018) Grant Sanderson. 2018. Manim. https://github.com/ManimCommunity/manim.
- Sangwin (2007) Chris Sangwin. 2007. A brief review of GeoGebra: dynamic mathematics. MSor Connections 7, 2 (2007), 36.
- Sannella (1994) Michael Sannella. 1994. Skyblue: A multi-way local propagation constraint solver for user interface construction. In Proceedings of the 7th annual ACM symposium on User interface software and technology. 137–146.
- Sannella et al. (1993) Michael Sannella, John Maloney, Bjorn Freeman-Benson, and Alan Borning. 1993. Multi-way versus one-way constraints in user interfaces: Experience with the deltablue algorithm. Software: Practice and Experience 23, 5 (1993), 529–566.
- Satyanarayan et al. (2019) Arvind Satyanarayan, Bongshin Lee, Donghao Ren, Jeffrey Heer, John Stasko, John Thompson, Matthew Brehmer, and Zhicheng Liu. 2019. Critical reflections on visualization authoring systems. IEEE transactions on visualization and computer graphics 26, 1 (2019), 461–471.
- Satyanarayan et al. (2016) Arvind Satyanarayan, Dominik Moritz, Kanit Wongsuphasawat, and Jeffrey Heer. 2016. Vega-lite: A grammar of interactive graphics. IEEE transactions on visualization and computer graphics 23, 1 (2016), 341–350.
- Satyanarayan et al. (2015) Arvind Satyanarayan, Ryan Russell, Jane Hoffswell, and Jeffrey Heer. 2015. Reactive vega: A streaming dataflow architecture for declarative interactive visualization. IEEE transactions on visualization and computer graphics 22, 1 (2015), 659–668.
- Sorge et al. (2015) Volker Sorge, Mark Lee, and Sandy Wilkinson. 2015. End-to-end solution for accessible chemical diagrams. In Proceedings of the 12th International Web for All Conference. 1–10.
- Steele Jr (1980) Guy Lewis Steele Jr. 1980. The Definition and Implementation of a Computer Programming Language Based on Constraints. Technical Report. MASSACHUSETTS INST OF TECH CAMBRIDGE ARTIFICIAL INTELLIGENCE LAB.
- Sugiyama (2002) Kozo Sugiyama. 2002. Graph drawing and applications for software and knowledge engineers. Vol. 11. World Scientific.
- Suwa and Tversky (2002) Masaki Suwa and Barbara Tversky. 2002. External representations contribute to the dynamic construction of ideas. In Diagrammatic Representation and Inference: Second International Conference, Diagrams 2002 Callaway Gardens, GA, USA, April 18–20, 2002 Proceedings 2. Springer, 341–343.
- Sveidqvist and Vinod (2014) Knut Sveidqvist and Sidharth Vinod. 2014. Mermaid. https://github.com/mermaid-js/mermaid.
- Tversky (2001) Barbara Tversky. 2001. Spatial schemas in depictions. In Spatial schemas and abstract thought, Vol. 79. 111.
- Tversky (2019) Barbara Tversky. 2019. Mind in motion: How action shapes thought. Hachette UK.
- Tversky et al. (2000) Barbara Tversky, Jeff Zacks, Paul Lee, and Julie Heiser. 2000. Lines, blobs, crosses and arrows: Diagrammatic communication with schematic figures. In Theory and Application of Diagrams: First International Conference, Diagrams 2000 Edinburgh, Scotland, UK, September 1–3, 2000 Proceedings 1. Springer, 221–230.
- Vander Zanden et al. (2001) Bradley T Vander Zanden, Richard Halterman, Brad A Myers, Rich McDaniel, Rob Miller, Pedro Szekely, Dario A Giuse, and David Kosbie. 2001. Lessons learned about one-way, dataflow constraints in the Garnet and Amulet graphical toolkits. ACM Transactions on Programming Languages and Systems (TOPLAS) 23, 6 (2001), 776–796.
- von Engelhardt (2002) Jörg von Engelhardt. 2002. The language of graphics: A framework for the analysis of syntax and meaning in maps, charts and diagrams. Yuri Engelhardt.
- Wagemans et al. (2012) J. Wagemans, J. H. Elder, M. Kubovy, S. E. Palmer, M. A. Peterson, M. Singh, and R. von der Heydt. 2012. A century of Gestalt psychology in visual perception: I. Perceptual grouping and figure-ground organization. Psychol Bull 138, 6 (Nov 2012), 1172–1217.
- Whatley et al. (2021) Daniel Whatley, Max Goldman, and Robert C Miller. 2021. Snapdown: A Text-Based Snapshot Diagram Language for Programming Education. In 2021 IEEE Symposium on Visual Languages and Human-Centric Computing (VL/HCC). IEEE, 1–9.
- Wilkinson (2012) Leland Wilkinson. 2012. The grammar of graphics. In Handbook of computational statistics. Springer, 375–414.
- Wongsuphasawat (2020a) Krist Wongsuphasawat. 2020a. Encodable: Configurable grammar for visualization components. In 2020 IEEE Visualization Conference (VIS). IEEE, 131–135.
- Wongsuphasawat (2020b) Krist Wongsuphasawat. 2020b. Navigating the Wide World of Data Visualization Libraries. https://medium.com/nightingale/navigating-the-wide-world-of-web-based-data-visualization-libraries-798ea9f536e7
- Yates and Yorgey (2015) Ryan Yates and Brent A Yorgey. 2015. Diagrams: a functional EDSL for vector graphics. In Proceedings of the 3rd ACM SIGPLAN International Workshop on Functional Art, Music, Modelling and Design. 4–5.
- Ye et al. (2020) Katherine Ye, Wode Ni, Max Krieger, Dor Ma’ayan, Jenna Wise, Jonathan Aldrich, Joshua Sunshine, and Keenan Crane. 2020. Penrose: from mathematical notation to beautiful diagrams. ACM Transactions on Graphics (TOG) 39, 4 (2020), 144–1.
- Young (2020) Brennan Young. 2020. ARIA Data Visualisation Module · issue #991 · W3C/aria. https://github.com/w3c/aria/issues/991#issuecomment-668493619
- Yu et al. (2021) Chris Yu, Henrik Schumacher, and Keenan Crane. 2021. Repulsive curves. ACM Transactions on Graphics (TOG) 40, 2 (2021), 1–21.
- Zong et al. (2022a) Jonathan Zong, Crystal Lee, Alan Lundgard, JiWoong Jang, Daniel Hajas, and Arvind Satyanarayan. 2022a. Rich Screen Reader Experiences for Accessible Data Visualization. Computer Graphics Forum (Proc. EuroVis) (2022). http://vis.csail.mit.edu/pubs/rich-screen-reader-vis-experiences
- Zong et al. (2022b) Jonathan Zong, Josh Pollock, Dylan Wootton, and Arvind Satyanarayan. 2022b. Animated Vega-Lite: Unifying Animation with a Grammar of Interactive Graphics. IEEE Transactions on Visualization and Computer Graphics 29, 1 (2022), 149–159.