.gifpng.pngconvert gif:#1 png:\OutputFile \AppendGraphicsExtensions.gif
From binary to singular: the AGN PSO J334.2028+1.4075 under the high-resolution scope
Abstract
Context. PSO J334.2028+1.4075 (PSO J334) is a luminous quasar located at redshift . The source gained attention when periodic flux density variations were discovered in its optical light curve. These variations were initially interpreted as the variability due to the orbital motion of a supermassive black hole binary (SMBHB) residing in a single circumbinary accretion disk. The orbital separation was determined to be pc with an in-spiral time of yr in the rest frame of PSO J334. These findings suggested the quasar could be in the gravitational wave emitting phase of its merger and so extended multi-wavelength observations were commenced. However, subsequent observations provided evidence against the binary hypothesis as no optical periodicity was found on extended time baselines. On the other hand, detailed radio analysis with the Karl G. Jansky Very Large Array (VLA) and the Very Long Baseline Array (VLBA) revealed a lobe-dominated quasar at kpc scales, and possibly a precessing jet, which could retain PSO J334 as a binary SMBH candidate.
Aims. We aim to study both the large- and small-scale radio structures in PSO J334 to provide additional evidence for or against the binary scenario.
Methods. We observed the source at GHz with the European Very Long Baseline Interferometry Network (EVN), and at and GHz with the VLA, at frequencies that complement the previous radio interferometric study.
Results. Our images reveal a single component at parsec scales slightly resolved in the southeast–northwest direction and a lobe-dominated quasar at kiloparsec scales with a complex structure. The source morphology and polarization in our VLA maps suggest that the jet is interacting with dense clumps of the ambient medium. While we also observe a misalignment between the inner jet and the outer lobes, we suggest that this is due to the restarted nature of the radio jet activity and the possible presence of a warped accretion disk rather than due to the perturbing effects of a companion SMBH.
Conclusions. Our analysis suggests that PSO J334 is most likely a jetted AGN with a single SMBH, and there is no clear evidence of a binary SMBH system in its central engine.
Key Words.:
Galaxies: jets – Galaxies: active – Techniques: interferometric – Techniques: high angular resolution – Polarization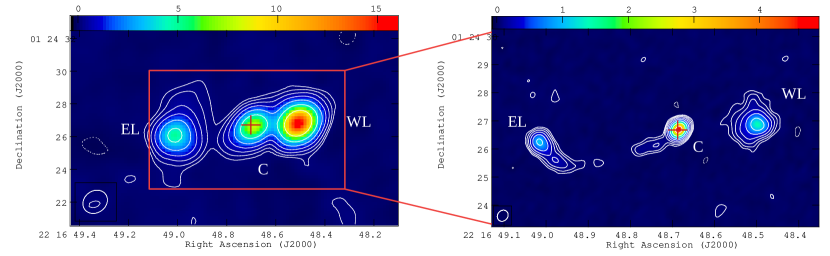
| [GHz]a𝑎aa𝑎aObserving frequency. | Arrayb𝑏bb𝑏bInterferometer array performing the observation. | [mJy]c𝑐cc𝑐cTotal flux density. | [mJy beam-1]d𝑑dd𝑑dPeak brightness. | [mJy beam-1]e𝑒ee𝑒eRms noise. | [mas]f𝑓ff𝑓fBeam major axis. | [mas]g𝑔gg𝑔gBeam minor axis. | PA [°]hℎhhℎhBeam position angle. |
| 1.5 | VLA | 35.41 | 14.7 | 0.04 | 1665 | 1218 | |
| 6.2 | VLA | 11.48 | 4.52 | 0.01 | 422.4 | 340.6 | |
| 1.7 | EVN | 6.8 | 2.1 | 0.035 | 3.4 | 3.4 | |
| 4.38 | VLBA | 4.83 | 2.54 | 0.049 | 5.86 | 2.46 | |
| 7.40 | VLBA | 3.24 | 1.41 | 0.036 | 3.48 | 1.46 | |
| 8.67 | VLBA | 3.45 | 1.56 | 0.06 | 2.13 | 0.86 | |
| 15.37 | VLBA | 1.19 | 0.85 | 0.036 | 1.29 | 0.48 |
1 Introduction
The discovery of PSO J334.2028+1.4075 (FBQS J2216+0124; hereafter denoted as PSO J334) (Liu et al. 2015) as a supermassive black hole binary (SMBHB) candidate attracted significant interest due to the rarity of confirmed SMBHBs. Supermassive black holes are expected to be at the center of most galaxies. Since galaxies evolve hierarchically, SMBHBs are believed to be abundant, especially at small separations (An et al. 2018). However, confirming the existence of such objects has so far been mostly unsuccessful, with a few exceptions. The most notable examples are the dual AGN system in NGC 6240 (Komossa et al. 2003), which resides in an ultraluminous infrared galaxy, and 0402+379, which was detected with the Very Long Baseline Array (VLBA) and has two radio cores separated by a projected distance of pc (Rodriguez et al. 2006).
The SMBHB candidate quasar PSO J334 was discovered through a systematic search in the Pan-STARSS1 Medium Deep Survey (Liu et al. 2015). Based on an observed day period in the variation of the optical flux density and an estimated total black hole mass of (with a mass ratio between and ), an orbital separation of pc was inferred. According to this, the coalescence of the SMBHB would occur in approximately yr in the rest frame of the quasar. Unfortunately, current astronomical instruments are not capable of resolving the two components at such a small separation, so evidence for the existence of a second component could only be indirect, such as the detected periodic variability in the optical flux density. This variability could be caused by a secondary black hole passing through the primary black hole’s accretion disk, as proposed for OJ 287 (Lehto & Valtonen 1996). A similar explanation has been suggested in the case of the recently discovered SMBHB candidate SDSS J143016.05+230344.4 as well, which shows a periodic optical variability with a decay in both period and amplitude (Jiang et al. 2022; An et al. 2022). However, the detected cycles of the putative periodicity are likely insufficient to claim sinusoidal variations (Vaughan et al. 2016), and other processes, such as quasi-periodic eruptions (Miniutti et al. 2019) and quasi-periodic oscillations (Gierliński et al. 2008) may also explain the periodic flux density variability observed in PSO J334. Indeed, subsequent observations with extended time baselines of the optical monitoring failed to find any evidence of periodic variability in PSO J334 (Liu et al. 2016).
The radio structure of PSO J334 has been investigated in a multi-frequency study with the Karl G. Jansky Very Large Array (VLA) and the VLBA by Mooley et al. (2018). In the VLBA images obtained at four frequencies from to GHz, the quasar is resolved into two components, a compact core and a jet. Their separation is milliarcsec (mas), corresponding to a projected linear separation of pc. The VLA images at and GHz reveal a lobe-dominated structure extending kpc from opposite sides of the core. In addition, the difference between the position angles of the outer lobes and the inner jet is significant enough to suggest a perturbation of the jet by the second SMBH (Begelman et al. 1980), or alternatively a restarted double-double source. Thus, despite the results from the recent optical light curve, PSO J334 can still be considered as a SMBHB candidate (Mooley et al. 2018). Multi-wavelength observations aimed at determining the accretion mode of the quasar by Foord et al. (2017) have not found any feature that would convincingly distinguish PSO J334 from a single active galactic nucleus (AGN). However, there are still untested scenarios that would allow the object to retain its SMBHB status.
We study the radio structure of PSO J334 using the technique of very long baseline interferometry (VLBI) with the European VLBI Network (EVN) at GHz and with the VLA at and GHz. Here we present our results and compare them with those obtained with the VLBA at higher frequencies by Mooley et al. (2018). In Sect. 2, we describe the observations and the data reduction process. We then discuss our results in Sect. 3. Finally, a summary is given in Sect. 4. In this paper we assume a CDM cosmological model with km s-1 Mpc-1, =0.73, and =0.27. At the redshift of the object, (Becker et al. 2001), of angular distance in the sky corresponds to kpc of projected linear distance (Wright 2006).
2 Observations and data reduction
2.1 VLA data
Observations with the VLA (project code AG980, PI: K.É. Gabányi) were carried out at and GHz (L and S/C bands) on 2016 October 28 and 2016 October 26, respectively. The VLA was observing in its most extended A configuration with antennas. The on-source time was h in both bands. The primary flux density calibrator in both experiments was 3C 48, and the polarization D-term calibrator was J2355+4950. The secondary calibrators were J2212+0152 ( GHz) and J2218$-$0335 ( GHz). The GHz data were recorded in spectral windows between and GHz with channels, each with a bandwidth of MHz. The GHz data contained spectral windows, but the first were only used to set up the observations, so the target and calibrators were observed between and GHz frequencies in spectral windows, each with channels and a bandwidth of MHz.
Data reduction was performed in the Common Astronomy Software Applications (CASA, McMullin et al. 2007; The CASA Team 2022) package version . First, phase, delay, bandpass, and gain calibrations were derived for the primary calibrator. Then, to calibrate polarization, we determined cross-hand delays, solved antenna-based D-terms for the unpolarized calibrator, and finally calibrated the polarization angle for the primary calibrator. We then used the calibration tables generated in the previous steps to transfer the solutions to the secondary calibrator and then to our target source222For the calibration, we followed this VLA tutorial: https://casaguides.nrao.edu/index.php/VLA_Continuum_Tutorial_3C391-CASA5.5.0. As 3C 48 was undergoing an active phase during 2016333https://science.nrao.edu/facilities/vla/docs/manuals/obsguide/modes/pol, we inspected the polarimetric calibration carefully, imaged all calibrators to determine the polarization angle and fractional polarization values, and compared them to those available in the literature. In the case of the D-term calibrators, we found no significant polarization signatures and fractional polarization values were close to . In the case of 3C , polarization angles and fractional polarization values in the two bands differ by less than % compared to the values in the literature3.
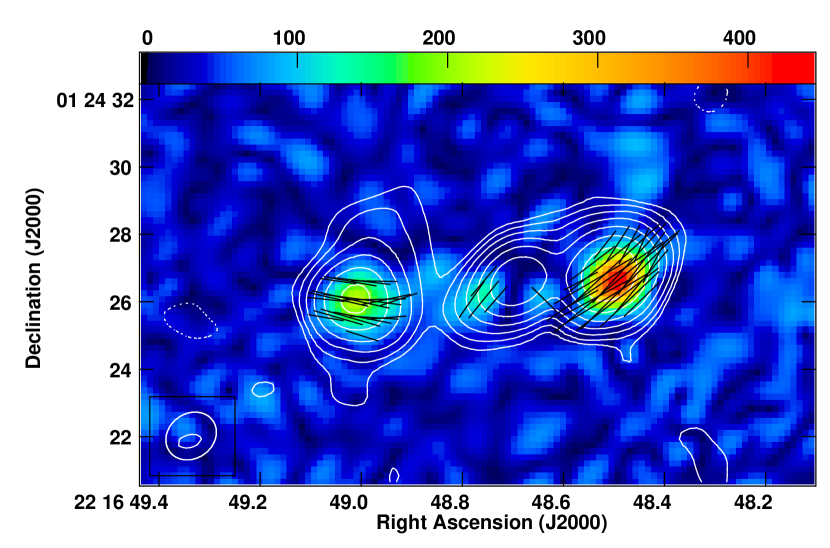
Hybrid imaging was performed by iterating tclean and self-calibration, while imaging all four Stokes parameters together, and then deriving polarized intensity and polarization fraction images from the Stokes IQU images. The and GHz VLA images are shown in Fig. 1, and the polarized intensity and electric vector position angle (EVPA) images are shown in Fig. 2.
2.2 EVN data
Our EVN observation (project code RSG08, PI: S. Frey) at GHz was performed on 2015 October 18, with the participation of eleven radio telescopes: Jodrell Bank Lovell Telescope (United Kingdom), Westerbork (single dish; the Netherlands), Effelsberg (Germany), Medicina (Italy), Onsala (Sweden), Sheshan (China), Toruń (Poland), Hartebeesthoek (South Africa), Svetloe, Zelenchukskaya, and Badary (Russia). The data were recorded at a Gbit s-1 rate in left and right circular polarizations, with 8 basebands (IFs) per polarization, each divided into thirty-two -kHz wide spectral channels. The total bandwidth was MHz per polarization. The correlation was performed at the Joint Institute for VLBI ERIC (Dwingeloo, the Netherlands) with s integration time. The observation lasted for a total of h. We used phase-referencing to a nearby (separated by ) compact calibrator source, J2217+0220, with duty cycles of min, including min s scans spent on the target. The total accumulated observing time on PSO J334 was h.
The data were calibrated with the U.S. National Radio Astronomy Observatory (NRAO) Astronomical Image Processing System (AIPS, Greisen 2003), following the usual procedures. The amplitudes of the raw correlated visibility data were calibrated using the antenna gain curves and measured system temperatures (where available), as provided by the participating stations. Nominal system temperature values were used for Jodrell Bank, Sheshan, Svetloe, Zelenchukskaya, and Badary. The data were then corrected for the dispersive ionospheric delay by invoking the task TECOR that uses total electron content maps derived from global navigation satellite systems data. Phase changes due to the time variation of the source parallactic angle were also corrected for azimuth–elevation mounted radio telescopes in the network. Global fringe-fitting was performed using the task FRING on the phase-reference calibrator J2217+0220 and the bright fringe-finder source J2148+0657 also observed for a -min scan at the beginning of the experiment. These calibrated visibility data were exported to Difmap (Shepherd 1997) for imaging. Conventional hybrid mapping with several iterations of the clean algorithm (Högbom 1974) and phase-only self-calibration was performed. Then antenna-based gain correction factors were determined. These values were within for the compact bright fringe-finder source, suggesting a reliable initial amplitude calibration. The clean component model obtained for the phase-reference source J2217+0220 in Difmap was fed back to AIPS, before repeating fringe-fitting, now taking the calibrator source structure into account for determining visibility phases. The fringe-fit solutions obtained for J2217+0220 were interpolated to the target source, PSO J334, within the atmospheric coherence time using the task CLCAL. The final calibrated visibility data file for PSO J334 was then transferred to Difmap for imaging and brightness distribution modeling.
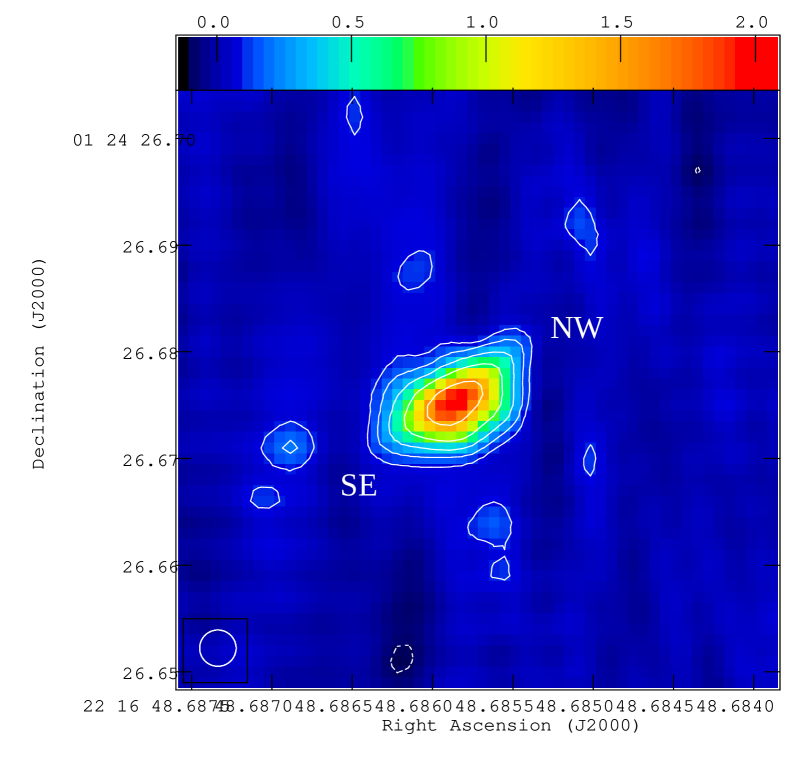
The peak of the dirty image was offset by about from the center because of an inaccurate a-priori position used for radio telescope pointing. Therefore we started the imaging by shifting the phase center to the actual brightness peak. Because PSO J334 is relatively weak with mJy total flux density, and it appeared slightly resolved at GHz with the EVN, self-calibration in general was not attempted during hybrid imaging in Difmap, except for phase self-calibration for the European stations (Effelsberg, Jodrell Bank, Onsala, Westerbork, Medicina, and Toruń). We used gradually decreasing solution intervals from to min. Amplitude self-calibration was not made at all. The naturally weighted clean image of PSO J334 is shown in Fig. 3. A circular two-dimensional Gaussian brightness distribution model component fitted directly to the self-calibrated visibility data in Difmap can adequately describe the source, allowing us to quantitatively characterize its size and flux density (Table 2). Neither an elliptical Gaussian, nor a two-component circular Gaussian model could significantly improve the goodness of fit.
2.3 Archival VLBA data
To be able to perform brightness distribution model fitting in the visibility domain, we downloaded from the NRAO data archive444https://data.nrao.edu/, re-calibrated, and imaged the VLBA data of Mooley et al. (2018) measured at , , , and GHz (project code BM438, PI: K.P. Mooley). For details on the observations, we refer to the original paper (Mooley et al. 2018). Calibration was carried out in AIPS. After loading the data with FITLD, we performed parallactic angle and digital sampling corrections, corrected for the Earth orientation parameters, and applied ionospheric corrections that are especially important for phase-referenced observations performed at low frequencies and low source declination. At first, fringe-fitting was performed on the phase-reference calibrator, J2217+0220, using the task FRING. After applying the calibration tables and writing the data out of AIPS, we performed hybrid imaging in Difmap, in a similar way as described in Sect. 2.2 for the EVN data. Since the gain corrections for all the VLBA antennas were within 5%, we did not perform any additional antenna-based amplitude correction in AIPS. The clean image of J2217+0220 was then loaded into AIPS and used during the second round of fringe-fitting. Delay and rate solutions were applied to both the calibrator and the target, PSO J334. The calibrated visibility data of the target source were written out. Imaging again was carried out in Difmap by only using clean iterations without self-calibration. The total flux densities, i.e. the sum of the individual clean components, and peak brightnesses agree with the values published in Mooley et al. (2018) within 10% (see image properties in Tab. 1). Gaussian brightness distribution model components (Table 2) were fitted to the visibility data using the modelfit command in Difmap.
3 Results and discussion
3.1 Source structure and polarization
The -GHz EVN image of PSO J334 (Fig. 3) restored with a -mas circular Gaussian beam (full width at half maximum, FWHM) shows a single component that is slightly resolved in roughly the southeast–northwest direction. The structure is consistent with the higher-frequency VLBA images (Mooley et al. 2018), where two components – a southeastern synchrotron self-absorbed core and a northwestern jet – were identified with mas separation along the position angle of . (Position angles are conventionally measured from north through east.) The misalignment in position angles between the VLA and VLBA jets led Mooley et al. (2018) to restore the SMBHB status of PSO J334, however, alternative interpretations are still viable to explain the observations. Double-double radio sources, such as B0925+420 and B1450+333 (Schoenmakers et al. 2000), that retain signs of several active phases show similar morphology to PSO J334. In this case, the lobes seen on kpc scales with the VLA would be relics of past activity, and the compact, mas-scale core–jet morphology was formed more recently. The change in jet position angle can be interpreted as precession either due to interaction with a companion SMBH (Begelman et al. 1980) or caused by a warped accretion disk changing the orientation of the jet (Pringle 1997).
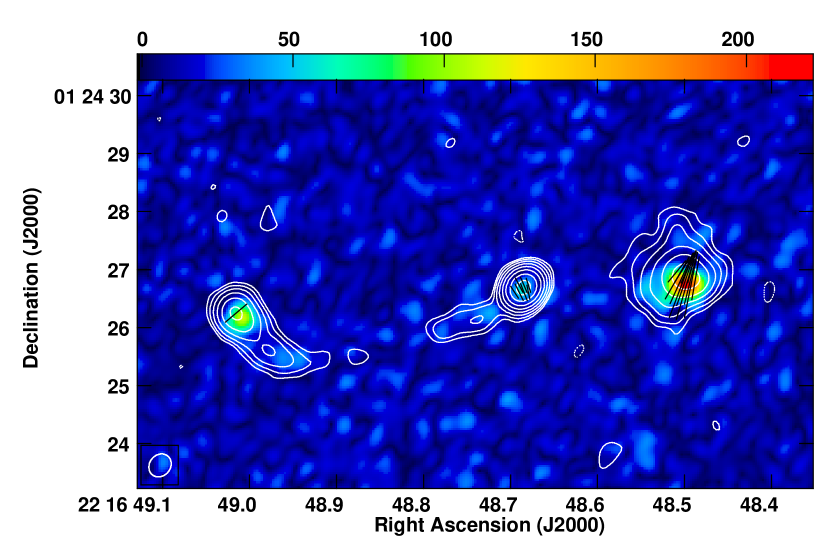
Our VLA observations at and GHz show details of the complex structure of PSO J334 (Fig. 1). The source, as shown in the -GHz VLA B-configuration Caltech–NRAO Stripe Survey (CNSS) image of Mooley et al. (2018), is a lobe-dominated quasar oriented at a large angle with respect to our line of sight. The projected linear size of the object is approximately kpc, which is typical of AGN (Blundell et al. 1999). The lengths of the arms are unequal, with the eastern arm being longer at both frequencies. However, contrary to expectations that the longer arm is pointing towards the observer and is brighter due to Doppler boosting (Longair & Riley 1979), here the western, shorter arm appears brighter in both images. In addition, the eastern arm shows a sharp turn before ending in a hotspot, which suggests an interaction with the surrounding interstellar medium (ISM), similarly as, e.g., in the high-redshift radio galaxy 4C (Gurvits et al. 1997). However, we do not detect polarized emission at the turning point as, e.g., in PKS 0637752 (Lovell et al. 2000), where the highly polarized bent jet region also gives rise to bright X-ray emission (Schwartz et al. 2000). By inspecting the polarimetric images, we also see that the polarized intensity is higher in the western lobe and that EVPAs are close to perpendicular to the jet propagation on both sides, indicating the presence of a termination shock where the lobe material interacts with the ambient medium. The asymmetric structure together with the polarimetric results suggest that PSO J334 is embedded in a large-scale environment that is not intrinsically symmetric, and the jet interacts with clumps of the ISM that are disrupted upon contact with the jet material.
Inspecting the inner in our -GHz VLA image (Fig. 1), we see a remarkably straight jet that cannot be described with any precession model. Jet precession itself would be revealed by a helical jet shape that is physically external or intrinsic to the jet. In the first case, the main driver might be e.g. binary motion (e.g. Kun et al. 2014), Lense–Thirring precession (e.g. Lense & Thirring 1918; Liska et al. 2018), or disk precession induced by a secondary black hole (e.g. Caproni & Abraham 2004). In this case, the jet components move more or less on straight or ballistic paths, and the pitch of the jet is constant. The helical pattern simply reflects the periodic ejection direction of the newborn jet components. The second case appears, e.g., due to instabilities in the jet (e.g. Perucho et al. 2006) and components actually move along helical path. In this case, the spatial wavelength of the jet along its symmetry axis is increasing with increasing core separation. The jet appearing in the -GHz VLA image (Fig. 1) has no resemblance to any of these scenarios. However, we cannot rule out the possibility that more sensitive images with higher angular resolution could recover jet structures indicative of precession or the presence of instabilities (see, e.g., the case of 3C , Fuentes et al. 2023). This structure seems hard to reconcile with the jet precession suggested by Mooley et al. (2018) based on lower-resolution VLA data, and rules out the last argument supporting the binary nature of the source.
3.2 Spectral analysis
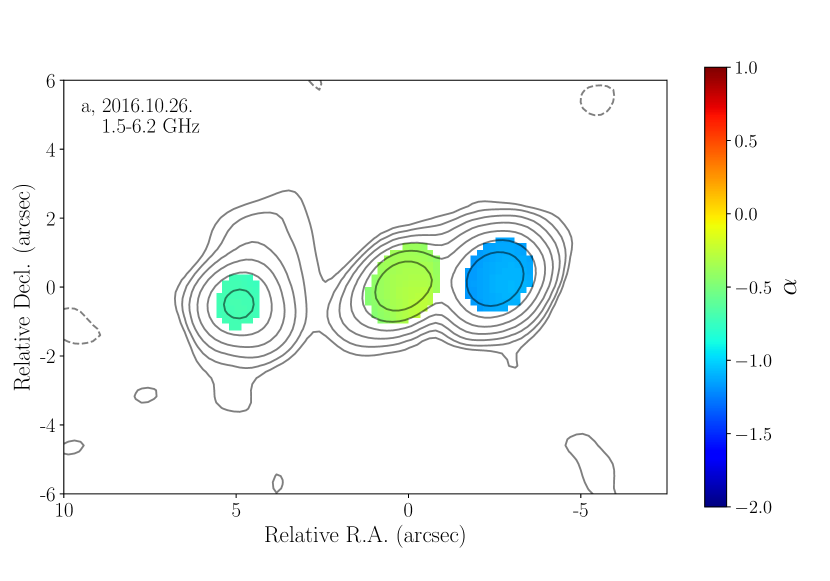
Spectral index maps () were created between our two VLA images at and GHz, as well as between our -GHz EVN image and the -GHz VLBA image of Mooley et al. (2018), plotted with black contours in Fig. 6. To align the images on the optically thin jet components, we used 2D cross-correlation.
The image pairs had the same restoring beam, map and pixel size, as well as the same minimum and maximum distance. The resulting spectral index maps are shown in Fig. 4. Due to the low signal-to-noise ratio outside of the peaks of the core and lobe regions, we do not recover spectral index solutions there.
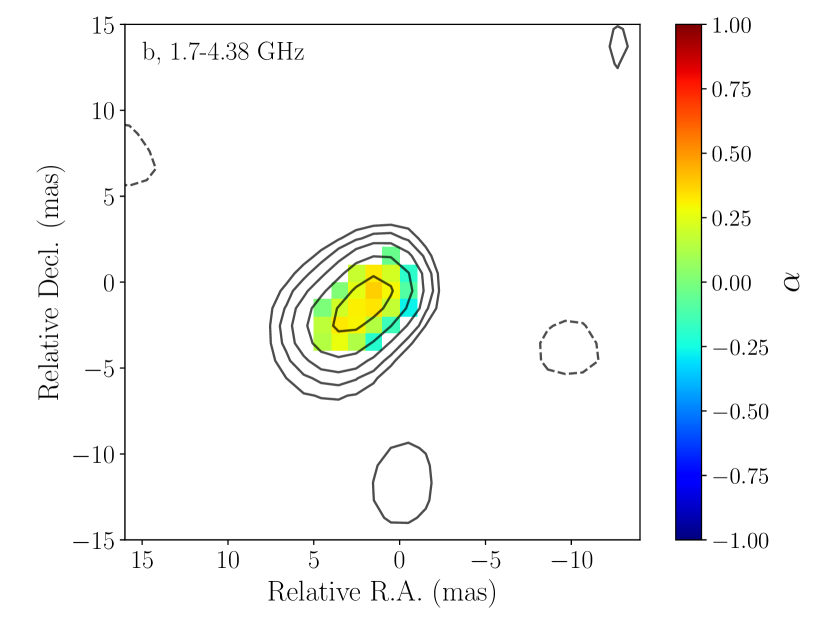
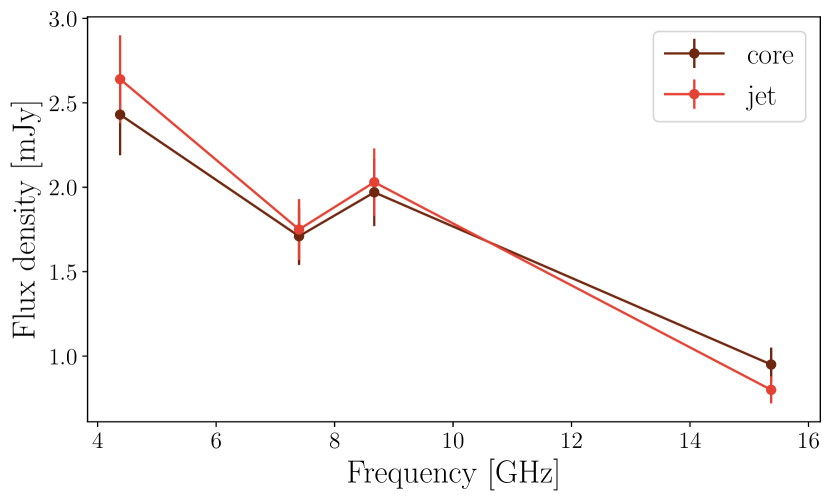
Spectra are flat in the VLA core, i.e. the central component, and the eastern lobe, however, values indicating a steeper spectrum are measured in the western lobe (Fig. 4). The flat spectrum of the eastern lobe might indicate a shock region, which is supported by the bending seen in the -GHz VLA image (Fig. 1), possibly happening due to the interaction with the ISM. The steeper spectrum of the western lobe, however, can be explained by an older population of electrons present in this region. The VLBI spectral index map created between and GHz shows a flat spectrum both for the core and the northwestern jet component. Since we assume that the amplitude calibration is accurate within , spectral index errors are estimated to be . See also figure of Mooley et al. (2018) for the spectral index map between and GHz that show steep spectra in both VLBI components. We also plot the spectra of the core and jet components of the VLBI images in Fig. 5, where both the core and the jet components show a steep spectrum between and GHz. In addition, the steepening towards the jet edge might be an artifact due to the low brightness of the component. While our results confirm the southeastern component as the core (Mooley et al. 2018), here we must note that the observations used to create the spectral index map were made half a year apart, so these results must be interpreted cautiously because of possible flux density variability.
The radio spectrum compiled in Benke et al. (2018), as well as the broadband spectral energy distribution (SED) in Foord et al. (2017) show no deviation from single AGN spectra. The two models investigated by Foord et al. (2017) are the mini-disk and cavity models that represent different stages of the binary evolution and manifest in the SED as missing emission at different frequencies. However, they found that the optical to X-ray bands are well modeled with a composite non-blazar SED (Shang et al. 2011) and the radio emission falls between what is expected from radio-loud and radio-quiet sources.
| [GHz]a𝑎aa𝑎aFrequency of the observation | Array | Component | [mJy]b𝑏bb𝑏bFlux density of the component | [mas]c𝑐cc𝑐cSize of the component (FWHM) | [ K]d𝑑dd𝑑dBrightness temperature |
|---|---|---|---|---|---|
| 1.7 | EVN | ||||
| 4.38 | VLBA | SE | |||
| NW | |||||
| 7.40 | VLBA | SE | |||
| NW | |||||
| 8.67 | VLBA | SE | |||
| NW | |||||
| 15.37 | VLBA | SE | ∗*∗*Component is unresolved based on eq. from Kovalev et al. (2005) | ∗*∗*Component is unresolved based on eq. from Kovalev et al. (2005) | |
| NW |
3.3 Brightness temperatures
To study the brightness temperature of the compact radio emitting features in the VLBI images (Figs. 3 and 6, also Mooley et al. 2018), we fitted circular Gaussian components in the visibility domain with modelfit in Difmap. Characteristics of the modelfit components are summarized in Table 2. We assume flux density errors to be 10% and the error in component size to be 20% (Lister et al. 2009). We calculate the observed brightness temperature as
| (1) |
where and are the minor and major axis (FWHM) of the component. The resolution limit was computed based on eq. in Kovalev et al. (2005). For the one component for which the size fell below this limit, we can only calculate a lower limit of its brightness temperature. values fall between K. This confirms that the emission originates from AGN activity and not from spatially extended star formation in the host galaxy (Condon et al. 1991). The measured brightness temperatures are lower than the average core brightness temperatures of blazars in the MOJAVE sample666https://www.cv.nrao.edu/MOJAVE/ of K (Homan et al. 2021). This indicates that the emission of PSO J334 is likely not beamed and the jets are probably inclined at a large angle to our line of sight.
3.4 VLBI and Gaia astrometry
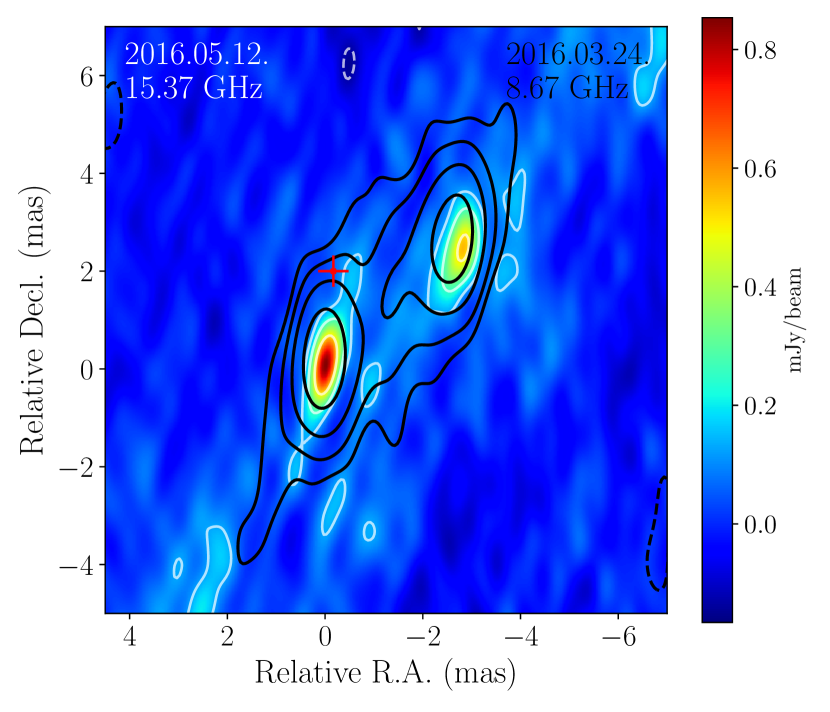
Both the EVN and VLBA observations were carried out in phase-referencing mode, enabling precise relative astrometric measurements. We determined the position of the brightness peak in the VLBI images using MAXFIT in AIPS. Since we expect that the optical emission originates from the vicinity of the central engine, i.e., the accretion disk and the inner jet (Kovalev et al. 2017), we can use Gaia data (Gaia Collaboration et al. 2016) from the third data release (DR3, Gaia Collaboration et al. 2023) to identify the nucleus position. The standard error of the optical position is mas in right ascension and mas in declination based on Gaia DR3. VLBI astrometric errors are comparable and estimated to be mas for low declinations with the VLBA based on the analysis of Pradel et al. (2006). We also take into account the uncertainty of the position of the calibrator, J2217+0220. The source is in the 3rd realization of the International Celestial Reference Frame (ICRF3, Charlot et al. 2020), and the formal position errors are mas and mas in right ascension and declination, respectively. We add these error estimates in quadrature, and estimate errors to be mas in right ascension and mas in declination. We find that the southeastern component at GHz is closer to the optical position of the source (see black contours in Fig. 6). We also see that the differences in right ascension are within the expected uncertainties, except at GHz where mas offset was found between the Gaia and the VLBI core positions. However, the optical–radio differences in declination reach up to mas, but show no frequency dependence.
We suspect that these differences in declination arise from uncorrected tropospheric and ionospheric effects. The contribution of the ionosphere to phase errors is significant at low frequencies, and since its rapid changes are difficult to model, we expect that this affects the measurement of the source position considerably. Based on GHz VLBA observations, Petrov (2023) determined that the ionospheric effects contribute around mas to the error budget both in right ascension and declination for northern hemisphere sources. However, for southern hemisphere targets, the accuracy of ionospheric corrections in declination is only mas. In addition, at low elevations, errors from the wet tropospheric component were shown to dominate over other systematic errors, and affect the precise measurement of source declination far more seriously than of the right ascension (Pradel et al. 2006). In order to be able to account for the ionospheric and tropospheric effects on VLBI astrometry more accurately, we need more extended studies such as in Brisken et al. (2002), Pradel et al. (2006), and Petrov (2023), to explore how these effects influence the error budget of our measurements for various VLBI arrays (see e.g. the Long Basline Array and the VLBI Exploration of Radio Astrometry, Petrov et al. 2019; Honma et al. 2008) and to develop methods to correct for them in the most effective way.
4 Summary
Liu et al. (2015) originally proposed that PSO J334 might be a SMBHB based on the periodic variability observed in the optical light curves. The scenario was later disfavored as extended time baselines revealed no sinusoidal periodicity in the optical flux (Liu et al. 2016), and SED reconstruction did not show any signatures expected from a binary AGN system (Foord et al. 2017). The only remaining indication of a companion SMBH was the possible precession inferred from multi-frequency radio observations of Mooley et al. (2018), where the large misalignment of between the pc- and kpc-scale structures led the authors to reinstate PSO J334 as a SMBHB candidate.
Our high-resolution radio observations carried out with the VLA at and GHz reveal a lobe-dominated quasar (in agreement with the findings of Mooley et al. 2018), likely oriented at a large angle to our line of sight. Based on polarimetric imaging and the analysis of the arm length and brightness ratios, we suggest that the source is embedded in an asymmetric environment and similarly to the high-redshift radio galaxy 4C 41.17 (Gurvits et al. 1997), its morphology is affected by the surrounding ISM, creating a bending in the eastern jet. PSO J334 also shows remarkably straight jets at 6.2 GHz, that disfavor jet precession, the only argument left to support the SMBHB status of the object. In addition, our GHz EVN observations confirm the significant misalignment between the outer lobes and the inner jet observed by Mooley et al. (2018). We suggest that this misalignment can be explained by a newer phase of AGN activity where the orientation of the component ejection has changed. In conclusion, we find no evidence to support the binary nature of PSO J334, and it should be considered an ordinary quasar.
Acknowledgements.
The authors would like to thank the anonymous referee for their useful suggestions. We thank J. Livingston for his valuable comments to the manuscript. The EVN is a joint facility of independent European, African, Asian, and North American radio astronomy institutes. Scientific results from data presented in this publication are derived from the following EVN project code: RSF08. The National Radio Astronomy Observatory is a facility of the National Science Foundation operated under cooperative agreement by Associated Universities, Inc. This research was supported through a PhD grant from the International Max Planck Research School (IMPRS) for Astronomy and Astrophysics at the Universities of Bonn and Cologne. This work was supported by the Hungarian National Research, Development and Innovation Office (NKFIH, grant number OTKA K134213).References
- An et al. (2018) An, T., Mohan, P., & Frey, S. 2018, Radio Science, 53, 1211
- An et al. (2022) An, T., Zhang, Y., Wang, A., et al. 2022, A&A, 663, A139
- Arshakian et al. (2006) Arshakian, T. G., Ros, E., & Zensus, J. A. 2006, A&A, 458, 397
- Becker et al. (2001) Becker, R. H., White, R. L., Gregg, M. D., et al. 2001, ApJS, 135, 227
- Begelman et al. (1980) Begelman, M. C., Blandford, R. D., & Rees, M. J. 1980, Nature, 287, 307
- Benke et al. (2018) Benke, P., Frey, S., Gabányi, K., et al. 2018, 14th European VLBI Network Symposium & Users Meeting (EVN 2018), 98
- Blundell et al. (1999) Blundell, K. M., Rawlings, S., & Willott, C. J. 1999, AJ, 117, 677
- Brisken et al. (2002) Brisken, W. F., Benson, J. M., Goss, W. M., et al. 2002, ApJ, 571, 906
- Caproni & Abraham (2004) Caproni A. & Abraham Z., 2004, MNRAS, 349, 1218
- Charlot et al. (2020) Charlot, P., Jacobs, C. S., Gordon, D., et al. 2020, A&A, 644, A159
- Condon et al. (1991) Condon, J. J., Huang, Z.-P., Yin, Q. F., et al. 1991, ApJ, 378, 65
- Foord et al. (2017) Foord, A., Gültekin, K., Reynolds, M., et al. 2017, ApJ, 851, 106
- Fuentes et al. (2023) Fuentes, A., Gómez, J., Martí, J., et al. 2023, in prep.
- Gaia Collaboration et al. (2016) Gaia Collaboration, Prusti, T., de Bruijne, J. H. J., et al. 2016, A&A, 595, A1
- Gaia Collaboration et al. (2023) Gaia Collaboration, Vallenari, A., Brown, A. G. A., et al. 2023, A&A, in press
- Gierliński et al. (2008) Gierliński, M., Middleton, M., Ward, M., et al. 2008, Nature, 455, 369
- Giovannini et al. (2001) Giovannini, G., Cotton, W. D., Feretti, L., et al. 2001, ApJ, 552, 508
- Greisen (2003) Greisen, E. W. 2003, Information Handling in Astronomy - Historical Vistas, 285, 109
- Gurvits et al. (1997) Gurvits, L. I., Schilizzi, R. T., Miley, G. K., et al. 1997, A&A, 318, 11
- Homan et al. (2021) Homan, D. C., Cohen, M. H., Hovatta, T., et al. 2021, ApJ, 923, 67
- Honma et al. (2008) Honma, M., Tamura, Y., & Reid, M. J. 2008, PASJ, 60, 951
- Högbom (1974) Högbom, J. A. 1974, A&AS, 15, 417
- Jiang et al. (2022) Jiang, N., Yang, H., Wang, T., et al. 2022, arXiv:2201.11633
- Komossa et al. (2003) Komossa, S., Burwitz, V., Hasinger, G., et al. 2003, ApJ, 582, L15
- Kovalev et al. (2005) Kovalev, Y. Y., Kellermann, K. I., Lister, M. L., et al. 2005, AJ, 130, 2473
- Kovalev et al. (2017) Kovalev, Y. Y., Petrov, L., & Plavin, A. V. 2017, A&A, 598, L1
- Kun et al. (2014) Kun E., Gabányi, K. É ., Karouzos, M. et al. 2014, MNRAS, 445, 1370
- Lense & Thirring (1918) Lense, J. & Thirring, H., 1918, Phys. Z., 19, 156
- Liska et al. (2018) Liska, M., Hesp, C., Tchekhovskoy, A. et al. 2018, MNRAS, 474, 81
- Lehto & Valtonen (1996) Lehto, H. J. & Valtonen, M. J. 1996, ApJ, 460, 207
- Liu et al. (2015) Liu, T., Gezari, S., Heinis, S., et al. 2015, ApJ, 803, L16
- Liu et al. (2016) Liu, T., Gezari, S., Burgett, W., et al. 2016, ApJ, 833, 6
- Lister et al. (2009) Lister, M. L., Cohen, M. H., Homan, D. C., et al. 2009, AJ, 138, 1874
- Longair & Riley (1979) Longair, M. S. & Riley, J. M. 1979, MNRAS, 188, 625
- Lovell et al. (2000) Lovell, J. E. J., Tingay, S. J., Piner, B. G., et al. 2000, Astrophysical Phenomena Revealed by Space VLBI, 215
- McMullin et al. (2007) McMullin, J. P., Waters, B., Schiebel, D., et al. 2007, Astronomical Data Analysis Software and Systems XVI, 376, 127
- Miniutti et al. (2019) Miniutti, G., Saxton, R. D., Giustini, M., et al. 2019, Nature, 573, 381
- Mooley et al. (2018) Mooley, K. P., Wrobel, J. M., Anderson, M. M., et al. 2018, MNRAS, 473, 1388
- Perucho et al. (2006) Perucho, M., Lobanov, A. P., Martí, J. M., et al. 2006, A&A, 456, 493
- Petrov et al. (2019) Petrov, L., de Witt, A., Sadler, E. M., et al. 2019, MNRAS, 485, 88
- Petrov (2023) Petrov, L. 2023, AJ, 165, 183
- Pradel et al. (2006) Pradel, N., Charlot, P., & Lestrade, J.-F. 2006, A&A, 452, 1099
- Pringle (1997) Pringle, J. E. 1997, MNRAS, 292, 136.
- Rodriguez et al. (2006) Rodriguez, C., Taylor, G. B., Zavala, R. T., et al. 2006, ApJ, 646, 49
- Schoenmakers et al. (2000) Schoenmakers, A. P., de Bruyn, A. G., Röttgering, H. J. A., et al. 2000, MNRAS, 315, 371
- Schwartz et al. (2000) Schwartz, D. A., Marshall, H. L., Lovell, J. E. J., et al. 2000, ApJ, 540, 69
- Shang et al. (2011) Shang, Z., Brotherton, M. S., Wills, B. J., et al. 2011, ApJS, 196, 2
- Shepherd (1997) Shepherd, M. C. 1997, Astronomical Data Analysis Software and Systems VI, 125, 77
- The CASA Team (2022) The CASA Team, Bean, B., Bhatnagar, S., et al. 2022, PASP, 134, 114501
- Vaughan et al. (2016) Vaughan, S., Uttley, P., Markowitz, A. G., et al. 2016, MNRAS, 461, 3145
- Walker et al. (1994) Walker, R. C., Romney, J. D., & Benson, J. M. 1994, ApJ, 430, L45
- Wright (2006) Wright, E. L. 2006, PASP, 118, 1711