A new redback pulsar candidate 4FGL J2054.2+6904
Abstract
The Fermi catalogue contains about 2000 unassociated -ray sources. Some of them were recently identified as pulsars, including so called redbacks and black widows, which are millisecond pulsars in tight binary systems with non- and partially-degenerate low-mass stellar companions irradiated by the pulsar wind. We study a likely optical and X-ray counterpart of the Fermi source 4FGL J2054.26904 proposed earlier as a pulsar candidate. We use archival optical data as well as Swift/XRT and SRG/eROSITA X-ray data to clarify its nature. Using Zwicky Transient Facility data in and bands spanning over 4.7 years, we find a period of 7.5 h. The folded light curve has a smooth sinusoidal shape with the peak-to-peak amplitude of 0.4 mag. The spectral fit to the optical spectral energy distribution of the counterpart candidate gives the star radius of 0.50.1 R⊙ and temperature of 5500300 K implying a G2–G9-type star. Its X-ray spectrum is well fitted by an absorbed power law with the photon index of 1.00.3 and unabsorbed flux of erg s-1 cm-2. All the properties of 4FGL J2054.26904 and its presumed counterpart suggest that it is a member of the redback family.
keywords:
binaries: close – stars: individual: 4FGL J2054.2+6904 – stars: neutron – X-rays: binaries1 Introduction
Spider millisecond pulsars (MSPs) represent a class of pulsar binaries with low-mass companions and tight orbital periods of d (Roberts, 2013). The side of the companion star facing the pulsar is illuminated, heated and evaporated by the pulsar wind. The ablated material often lead to extensive eclipses of the pulsar emission. Spider pulsars are divided into redbacks (RBs) and black widows (BWs). The former has non-degenerate companions with masses 0.1–1 M⊙ while companions of the latter are very low-mass, M⊙, partially degenerate stars (Roberts, 2013). Studying spider systems can provide information about the mass of the hosted neutron star (NS), which in such systems can exceed 2 M⊙ (e.g. Romani et al., 2022). This is important for constraining the equation of state of the superdense matter inside NSs.
To date, about 40 RBs and 70 BWs has been discovered. A half of them are located in the Galactic disc (Swihart et al., 2022; Strader et al., 2019) and a half – in globular clusters111See http://www.naic.edu/~pfreire/GCpsr.html. Among them, there are three RBs, PSRs J1023+0038, J18242452I and J12274853, that show transitions between accretion-powered and rotation-powered pulsar states (Archibald et al., 2009; Papitto et al., 2013; Bassa et al., 2014; Roy et al., 2015). This provides a link between MSPs and low-mass X-ray binaries (LMXBs) supporting the recycling scenario according to which MSPs are spun-up due to accretion of matter from the secondary star (Bisnovatyi-Kogan & Komberg, 1974; Alpar et al., 1982). Nevertheless, there are still many unanswered questions about details of formation and evolution of spider systems (e.g. Chen et al., 2013; Benvenuto et al., 2014; Ablimit, 2019; Ginzburg & Quataert, 2021; Guo et al., 2022).
A great success in uncovering spider pulsars has been achieved thanks to the Fermi Gamma-ray Space Telescope. About two tens of promising RB and BW candidates are proposed through identifications of possible optical and/or X-ray counterparts to -ray sources (Strader et al., 2019, 2021; Miller et al., 2020; Swihart et al., 2020; Swihart et al., 2021, 2022; Au et al., 2023). However, the Data Release 3 of the fourth Fermi Large Area Telescope (LAT) catalog (4FGL-DR3) contains more than 2000 unassociated -ray sources (Abdollahi et al., 2022). Some of them were classified as binary pulsar candidates (Kerby et al., 2021). Among them is 4FGL J2054.2+6904 (hereafter J2054). Its flux in the 0.1–100 GeV band is erg s-1 cm-2 and its -ray spectrum can be fitted with a logParabola model (Abdollahi et al., 2022). Its possible X-ray and optical counterpart was found with Swift (Kerby et al., 2021). In the second Swift X-ray Point Source (2SXPS) catalog (Evans et al., 2020) it is designated as 2SXPS J205359.0+690518 with coordinates R.A. = 20h53m5910 and Dec. = +69∘05′185.
To better understand the nature of J2054 and its putative optical and X-ray counterparts, we used various archival multi-epoch optical observations and X-ray data from Swift/XRT, as well as from eROSITA (Predehl et al., 2021) aboard the Spectrum-RG (SRG) orbital observatory (Sunyaev et al., 2021). Here we present analysis of these data. Optical data are described in Sec. 2, their timing analysis – in Sec. 3 and optical spectrum is studied in Sec. 4. The description of the X-ray data is presented in Sec. 5. We discuss and summarise the results in Sec. 6.
2 X-ray and optical data
| Parameters from the catalogues | |
|---|---|
| R.A. (J2000) | 20h53m5899298(7) |
| Dec. (J2000) | +69∘05′19′′.7063(5) |
| Galactic longitude , deg | 104.365 |
| Galactic latitude , deg | 15.312 |
| P.m. in R.A. direction cos, mas yr-1 | 5.4(5) |
| P.m. in Dec. direction , mas yr-1 | 5.5(5) |
| Distance , kpc | 1.5–5.3 |
| -ray flux , erg s-1 cm-2 | |
| Effective temperature , K | |
| Reddening , mag | |
| Parameters derived in this paper | |
| Orbital period , h | 7.4666(9) |
| Maximum reddening , mag | 0.37 |
| Effective temperature , K | |
| X-ray flux , erg s-1 cm-2 | |
| X-ray Luminosity , erg s-1 | 0.4–7.4 |
| -ray luminosity , erg s-1 | 0.1–1.6 |
-
•
Hereafter numbers in parentheses denote 1 uncertainties relating to the last significant digit quoted.
-
•
The coordinates are obtained from the Gaia catalogue as well as the proper motion (p.m.).
-
•
∗Parameters from the TIC catalogue.
-
•
†Maximum reddening in the source direction according to the dust map of Green et al. (2019).
-
•
is the unabsorbed flux in the 0.5–10 keV range and is the flux in the 0.1–100 GeV range.
| Pan-STARRS (AB system), ID 19090313495683735 | ||||
| 20.82(3) | 20.12(3) | 19.71(4) | 19.56(3) | 19.37(4) |
| Gaia, ID 2271107409667918080 | ||||
| 20.142(9) | 20.96(11) | 19.50(8) | ||
| TIC, ID 1981395694 | ||||
| 19.55(3) | ||||
| UVOTSSC (AB system), ID 5624088 | ||||
| 23.23(15) | 21.77(16) | 20.52(12) | ||
-
ID is an object identifier in the catalogue.
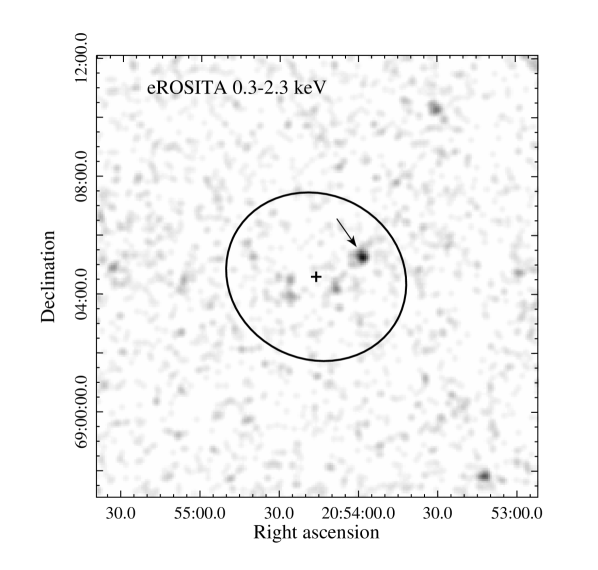
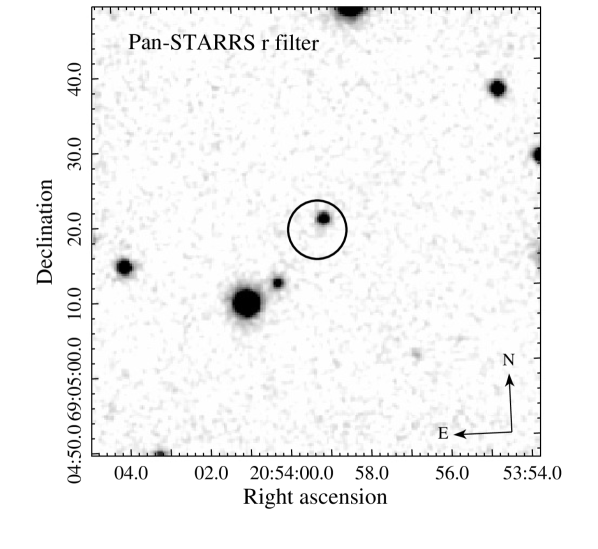
The J2054 was observed by SRG/eROSITA in the course of 5 all-sky surveys in 2020–2022 with the total exposure time of 5.6 ks (vignetting corrected exposure of ks). The eROSITA raw data were processed by the calibration pipeline at IKI based on the eROSITA Science Analysis Software System (eSASS) and using pre- and in-flight calibration data. The image of the J2054 field is presented in the top panel of Fig. 1, where the likely X-ray counterpart is marked. The eROSITA coordinates of the latter are in agreement with the 2SXPS J205359.0+690518 ones, obtained with Swift.
Kerby et al. (2021) identified the possible optical counterpart of J2054 coinciding by position with 2SXPS J205359.0+690518 using only Swift/UVOT data. Investigating deeper images from the Panoramic Survey Telescope and Rapid Response System survey (Pan-STARRS, Flewelling et al. 2020), we confirmed that there is only one optical source, PSO J313.4958+69.0888, within the position uncertainty circle of 2SXPS J205359.0+690518 (see Fig. 1, bottom). Its parameters are shown in Table 1 and magnitudes – in Table 2. There are indications of the source variability of about 0.3 mag but the small number of observations did not allow us to perform any informative timing analysis using Pan-STARRS data.
We also identified PSO J313.4958+69.0888 in the Gaia catalogue (Gaia Collaboration et al., 2016, 2023), Transiting Exoplanet Survey Satellite (TESS) Input Catalog (TIC v.8.2, Paegert et al. 2021) (see Table 2) and Zwicky Transient Facility (ZTF, Masci et al. 2019) catalogue. The source parallax of 0.270.44 mas is still poorly defined by Gaia. Nevertheless, Bailer-Jones et al. (2021) based on the Gaia data provide two different estimates of the distance: in their terminology, one is the geometric distance kpc, and the other is the photogeometric distance kpc. In the following, to estimate the parameters of the source, we will use the distance range of 1.5–5.3 kpc covering both estimates with their uncertainties. The proper motion of the source is rather small (see Table 1), mas yr-1, which corresponds to a transverse velocity of about 50–200 km s-1 for the accepted distance range. The ZTF data confirms the PSO J313.4958+69.0888 variability and contains enough measurements to search for periodicity.
3 Optical light curves and the orbital period
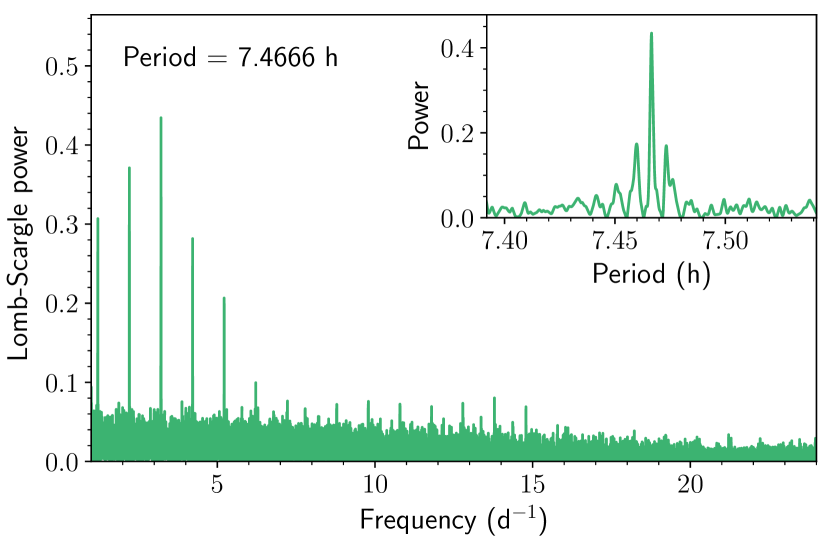
The ZTF DR16 archive contains about six hundreds brightness measurements of the PSO J313.4958+69.0888 in the band covering about 4.7 yr (MJD 58217–59937). We used the Lomb-Scargle method (Lomb, 1976; Scargle, 1982), to search for periodic brightness variation in the range of 1–24 h. The resulting periodogram is plotted in Fig. 2. It shows a number of highly statistically significant peaks caused by aliasing effects due to a 1 day windowing of ground-based ZTF observations (see, e.g., VanderPlas, 2018). The peaks are equally spaced with h-1 around the main peak : , where is an integer. The highest amplitude has the peak at the period h. Its 1 uncertainty quoted in the parentheses is calculated as the half width at half maximum of the peak. The signal to noise ratio of the peak, computed using scripts developed by Malanchev et al. (2023) for ZTF data222https://ztf.snad.space/, is . The amplitude of any of the peaks of the lower amplitude is at least by lower. We therefore conclude that the h is the true period.
We also searched for periodicity in the ZTF data in the band. Though the number of measurements is about 2.5 times smaller than in the band and the power spectrum is more noisy, we found a statisitcally significant peak at the same period .
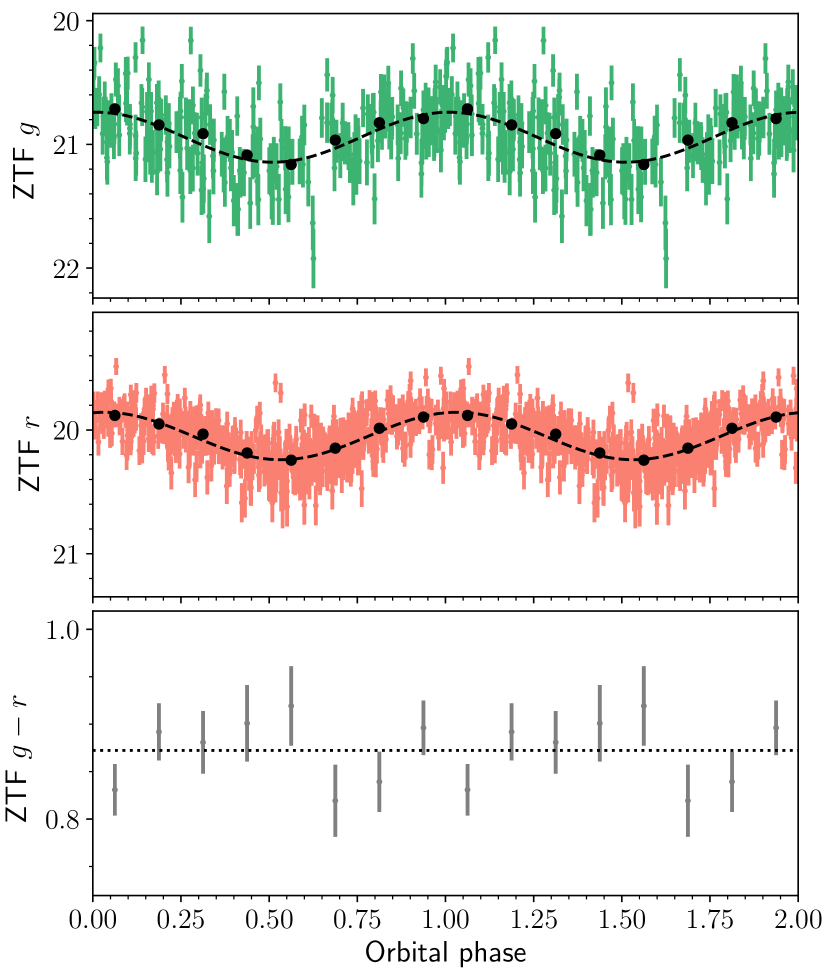
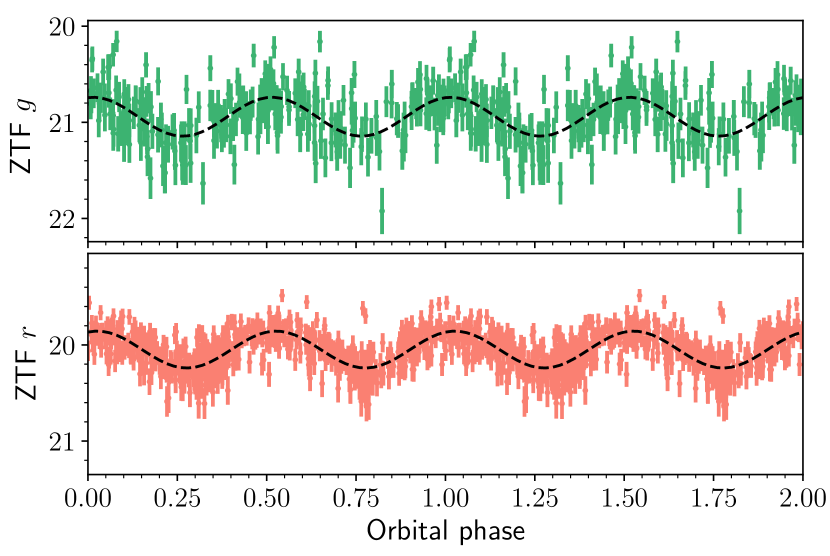
The ZTF light curves in and bands folded with the period are shown in the top and middle panels of Fig. 3. They have a roughly sinusoidal form with a single broad peak per period. To estimate the amplitudes of brightness variations, we fitted the folded light curves with functions of the form , where is the orbital phase and is a constant. As a result, the peak-to-peak amplitude (the difference between the maximum and minimum values, i.e. ) is about 0.4 mag for both bands (see Fig. 3). We thus concluded that the J2054 is a binary system with the likely orbital period of h. We also binned the light curves in both bands and calculated the colour curve. The latter is presented in the bottom panel of Fig. 3. No statistically significant variations of the colour are seen. We fitted the colour with a constant function and obtained the mean colour of about 0.9 and the reduced for 7 degrees of freedom.
4 Optical spectral energy distribution
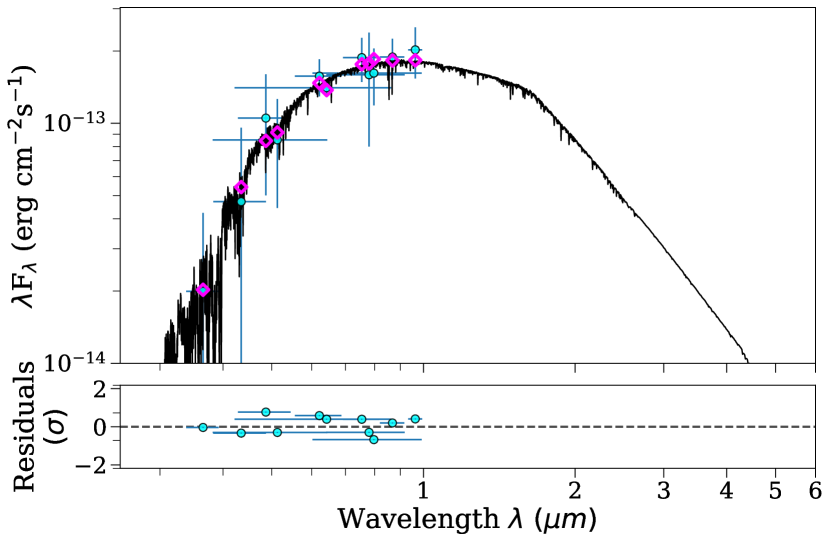
We constructed the spectral energy distribution (SED) of PSO J313.4958+69.0888 using magnitude measurements from the Pan-STARRS, Gaia, TESS and UVOT data (see Table 2 ). The latter were obtained from the Swift/UVOT Serendipitous Source Catalog (UVOTSSC, Yershov 2014; Page et al. 2014).
We fitted the SED with the spectral energy distribution Bayesian model averaging fitter (ariadne) package (Vines & Jenkins, 2022). The model has the following parameters: reddening, distance, surface gravity, radius, temperature and metallicity. According to the 3D dust map of Green et al. (2019) the reddening in the PSO J313.4958+69.0888 direction reaches its maximum value of 0.37333We note, that this value is in agreement with provided in the TIC catalogue (see Table 1). at about 1.2 kpc while the source is located at the larger distance, in the range of 1.5–5.3 kpc. Thus, we fixed at this value. Applying a uniform prior for the distance, we obtained the best-fitting effective stellar temperature = 5500300 K and radius = 0.50.1 R⊙. The best-fitting model is plotted in the top panel of Fig. 4. The temperature is compatible with 5820412 K obtained by Paegert et al. (2021). In the absence of spectral data, it is impossible to derive the metallicity and the gravitational mass of the star. We also obtained the distance of 3.70.7 kpc which is in agreement with the distance range provided by Gaia. Nevertheless, we used the whole range mentioned above to calculate J2054 luminosities to obtain most conservative estimates.
5 J2054 properties in X-rays
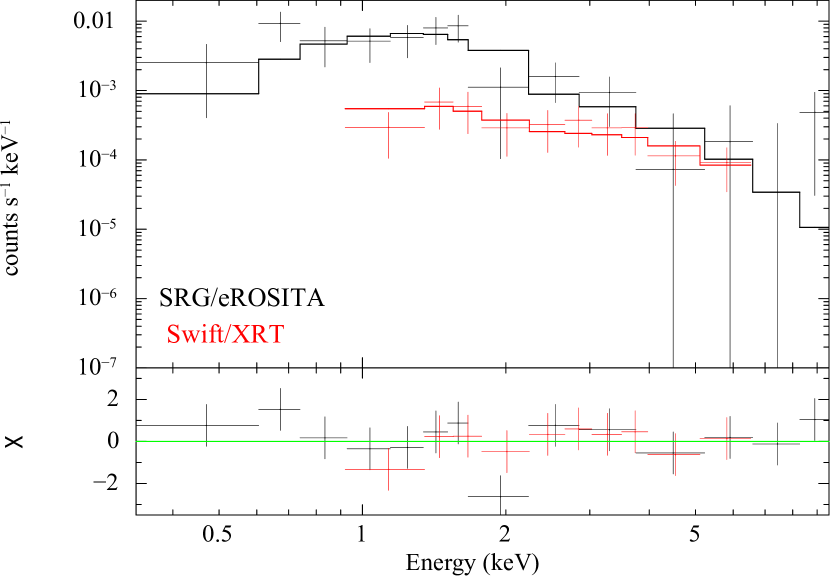
The X-ray spectrum of the J2054 counterpart candidate was studies using archival Swift/XRT data and SRG/eROSITA all-sky survey data.
The Swift spectrum was extracted with the Swift-XRT data products generator444https://www.swift.ac.uk/user_objects/ (Evans et al., 2009). We used observations carried out in 2009 and 2015. This resulted in the total effective exposure time of about 21 ks with 32 counts from the source in the 0.3–10 keV band. The spectrum was grouped to ensure at least 1 count per energy bin.
The eROSITA source spectra were extracted in a circular region with a radius of 60 arcsec centered at the source position. An annulus region with the inner and outer radii of 150 and 300 arcsec around the source was used for the background extraction. As the source is fairly faint, we used the data of all 7 telescope modules. No statistically significant variability was detected between five individual sky surveys, although the statistical accuracy achieved in an individual survey is rather low, with typically 10–15 source counts registered in each surveys. About 64 source counts were obtained in total. The spectrum was grouped to ensure at least 3 counts per energy bin.
We fitted the two spectra in the 0.3–10 keV band with the X-Ray Spectral Fitting Package (xspec) v.12.11.1 (Arnaud, 1996) applying the absorbed power law (PL) model. The tbabs model with the wilm abundances (Wilms, Allen & McCray, 2000) was used to account for the interstellar absorption. We transformed the reddening found above to the absorbing column density cm-2 utilising the relation from Foight et al. (2016). We fixed this value during the fitting procedure. Due to the low number of counts we used the -statistics (Cash, 1979). We found that the best-fitting parameters obtained for eROSITA and Swift spectra are in agreement within uncertainties indicating that there is no statistically significant variability of the source flux between Swift and eROSITA observations. Therefore, as a next step we fitted the spectra simultaneously and obtained the photon index , the unabsorbed flux in the 0.5–10 keV band erg s-1 cm-2 (uncertainties correspond to 1 confidence intervals) and per 77 degrees of freedom. The spectra and the best-fitting model are shown in Fig. 5.
6 Discussion and conclusions
We examined the nature of the possible X-ray and optical counterpart of the unassociated Fermi source 4FGL J2054.26904. We found that the source is variable in the optical with a likely period of about 7.5 h (Fig. 2). This value lies within a range of orbital periods measured for spider systems. The small peak-to-peak amplitude of the light curves 0.4 mag (Fig. 3) suggests that the source might belong to the RB class whose brightness variations typically do not exceed 1 mag. In contrast, most BWs have peak-to-peak amplitudes of 2–4 mag (e.g. Draghis et al., 2019). On the other hand, light curves of the majority of RBs show two peaks per orbital period as a consequence of an ellipsoidal shape of the star due to its tidal distortion. However, in some RB systems as well as in BW ones, the heating of the companion face side by the pulsar wind dominates over the tidal effect which leads to single-peaked light curves (Strader et al., 2019; Swihart et al., 2019, 2022; Kandel et al., 2020; Linares et al., 2018).
Domination of the tidal effect in J2054 implies that the true orbital period can be twice larger than the derived one, h. In this case, the orbital light curves can have two peaks and show no colour modulation, reflecting an ellipsoidal shape of the star. The observed colour curve appears to support this interpretation, while the colour uncertainties are too large to completely exclude its modulation (Fig. 3, bottom). At the same time, including two Fourier terms in the Lomb-Scargle algorithm, we indeed found two harmonics in the periodogram but the highest peak remained at 7.5 h. Typically, double-peaked light curves of RBs have two unequal minima due to contribution of the heating effect. We thus tried to fold the J2054 light curves with and did not find any evidence of this feature (see Fig. 6). However, it can be hidden in the noisy data since the difference between the companion day-side and night-side temperatures can be rather low, 100–200 K, as was derived for, e.g., PSRs J14314715 and J21290429 (Strader et al., 2019; Bellm et al., 2016). We also did not reveal any difference between the shapes of the two peaks due to, e.g., hot spots or off-centre heating by the pulsar wind, which would be a strong argument for the 15 h period. In addition, the observed variations of RBs brightness due to the ellipsoidal modulation are usually very low, 0.3 mag (Kaluzny et al., 2003; Bellm et al., 2016; Shahbaz et al., 2017; Sanpa-arsa, 2016; Strader et al., 2019), while J2054 shows stronger variability of 0.4 mag which might indicate significance of the irradiation effect. It is impossible to make any definite conclusions about that at current data stage. To distinguish the true orbital period of J2054, one need either the radio, X-ray or radial velocity data. Supplemented with a higher quality photometry, this would also solve the irradiation dominated vs ellipsoidal modulation problem discussed above.
The SED (Fig. 4) and the estimated best-fitting effective temperature corresponds to a G2–G9-type star. Its radius of 0.50.1 R⊙ is too large for the very-low mass BW companions, whose typical radii are in the range of R⊙ (Zharikov et al., 2019). This supports the RB interpretation of the source.
The X-ray spectrum of the J2054 counterpart candidate can be well described by the PL model which is typical for spider pulsars (Al Noori et al., 2018; Strader et al., 2019; Swihart et al., 2022). The X-ray and -ray luminosities of the source are erg s-1 and erg s-1. For the accepted distance range of 1.5–5.3 kpc provided by Gaia, erg s-1 and erg s-1. The latter value is similar to those observed either for BW or RB pulsars, while the former better agrees with the RB interpretation of J2054 (Strader et al., 2019; Swihart et al., 2022). The photon index is also more typical for RBs than for BWs.
To conclude, according to -ray, X-ray and optical data J2054 is a promising RB candidate. Its relative optical and X-ray brightness makes it a good target for further studies. Knowledge of the binary period would be helpful in further searches for pulsations with the period of the presumed pulsar in the radio, X- and -rays. Optical spectroscopy would allow one to measure its radial velocity curve and to better constrain the spectral type of the companion star and other parameters of the system. Modelling of multi-band brightness and radial velocity variations with the orbital period would provide fundamental parameters of J2054 including masses of the binary components, the companion temperature distribution over its surface and the irradiation efficiency by the pulsar wind, the distance to the suggested binary system and its inclination. New dedicated X-ray observations could reveal the orbital modulation of the X-ray emission which is often observed for spider pulsars and allow one to constrain the system properties.
Acknowledgements
The Pan-STARRS1 Surveys (PS1) and the PS1 public science archive have been made possible through contributions by the Institute for Astronomy, the University of Hawaii, the Pan-STARRS Project Office, the Max-Planck Society and its participating institutes, the Max Planck Institute for Astronomy, Heidelberg and the Max Planck Institute for Extraterrestrial Physics, Garching, The Johns Hopkins University, Durham University, the University of Edinburgh, the Queen’s University Belfast, the Harvard-Smithsonian Center for Astrophysics, the Las Cumbres Observatory Global Telescope Network Incorporated, the National Central University of Taiwan, the Space Telescope Science Institute, the National Aeronautics and Space Administration under Grant No. NNX08AR22G issued through the Planetary Science Division of the NASA Science Mission Directorate, the National Science Foundation Grant No. AST-1238877, the University of Maryland, Eotvos Lorand University (ELTE), the Los Alamos National Laboratory, and the Gordon and Betty Moore Foundation.
This work is based on observations with eROSITA telescope onboard SRG observatory. The SRG observatory was built by Roskosmos in the interests of the Russian Academy of Sciences represented by its Space Research Institute (IKI) in the framework of the Russian Federal Space Program, with the participation of the Deutsches Zentrum für Luft- und Raumfahrt (DLR). The SRG/eROSITA X-ray telescope was built by a consortium of German Institutes led by MPE, and supported by DLR. The SRG spacecraft was designed, built, launched and is operated by the Lavochkin Association and its subcontractors. The science data are downlinked via the Deep Space Network Antennae in Bear Lakes, Ussurijsk, and Baykonur, funded by Roskosmos. The eROSITA data used in this work were processed using the eSASS software system developed by the German eROSITA consortium and proprietary data reduction and analysis software developed by the Russian eROSITA Consortium.
DAZ thanks Pirinem School of Theoretical Physics for hospitality. The work of DAZ and AVK was supported by the Russian Science Foundation project 22-12-00048, https://rscf.ru/project/22-12-00048/.
The authors are grateful to anonymous referee for useful and constructive comments.
Data Availability
The Swift/XRT data are available through the archive https://www.swift.ac.uk/swift_portal/, ZTF data – https://irsa.ipac.caltech.edu/Missions/ztf.html and eROSITA data – on request.
References
- Abdollahi et al. (2022) Abdollahi S., et al., 2022, ApJS, 260, 53
- Ablimit (2019) Ablimit I., 2019, ApJ, 881, 72
- Al Noori et al. (2018) Al Noori H., et al., 2018, ApJ, 861, 89
- Alpar et al. (1982) Alpar M. A., Cheng A. F., Ruderman M. A., Shaham J., 1982, Nature, 300, 728
- Archibald et al. (2009) Archibald A. M., et al., 2009, Science, 324, 1411
- Arnaud (1996) Arnaud K. A., 1996, in Jacoby G. H., Barnes J., eds, Astronomical Society of the Pacific Conference Series Vol. 101, Astronomical Data Analysis Software and Systems V. p. 17
- Au et al. (2023) Au K.-Y., et al., 2023, ApJ, 943, 103
- Bailer-Jones et al. (2021) Bailer-Jones C. A. L., Rybizki J., Fouesneau M., Demleitner M., Andrae R., 2021, AJ, 161, 147
- Bassa et al. (2014) Bassa C. G., et al., 2014, MNRAS, 441, 1825
- Bellm et al. (2016) Bellm E. C., et al., 2016, ApJ, 816, 74
- Benvenuto et al. (2014) Benvenuto O. G., De Vito M. A., Horvath J. E., 2014, ApJ, 786, L7
- Bisnovatyi-Kogan & Komberg (1974) Bisnovatyi-Kogan G. S., Komberg B. V., 1974, Soviet Astronomy, 18, 217
- Cash (1979) Cash W., 1979, ApJ, 228, 939
- Chen et al. (2013) Chen H.-L., Chen X., Tauris T. M., Han Z., 2013, ApJ, 775, 27
- Draghis et al. (2019) Draghis P., Romani R. W., Filippenko A. V., Brink T. G., Zheng W., Halpern J. P., Camilo F., 2019, ApJ, 883, 108
- Evans et al. (2009) Evans P. A., et al., 2009, MNRAS, 397, 1177
- Evans et al. (2020) Evans P. A., et al., 2020, ApJS, 247, 54
- Flewelling et al. (2020) Flewelling H. A., et al., 2020, ApJS, 251, 7
- Foight et al. (2016) Foight D. R., Güver T., Özel F., Slane P. O., 2016, ApJ, 826, 66
- Gaia Collaboration et al. (2016) Gaia Collaboration et al., 2016, A&A, 595, A1
- Gaia Collaboration et al. (2023) Gaia Collaboration et al., 2023, A&A, 674, A1
- Ginzburg & Quataert (2021) Ginzburg S., Quataert E., 2021, MNRAS, 500, 1592
- Green et al. (2019) Green G. M., Schlafly E., Zucker C., Speagle J. S., Finkbeiner D., 2019, ApJ, 887, 93
- Guo et al. (2022) Guo Y., Wang B., Han Z., 2022, MNRAS, 515, 2725
- Kaluzny et al. (2003) Kaluzny J., Rucinski S. M., Thompson I. B., 2003, AJ, 125, 1546
- Kandel et al. (2020) Kandel D., Romani R. W., Filippenko A. V., Brink T. G., Zheng W., 2020, ApJ, 903, 39
- Kerby et al. (2021) Kerby S., et al., 2021, ApJ, 923, 75
- Linares et al. (2018) Linares M., Shahbaz T., Casares J., 2018, ApJ, 859, 54
- Lomb (1976) Lomb N. R., 1976, Ap&SS, 39, 447
- Malanchev et al. (2023) Malanchev K., et al., 2023, PASP, 135, 024503
- Masci et al. (2019) Masci F. J., et al., 2019, PASP, 131, 018003
- Miller et al. (2020) Miller J. M., et al., 2020, ApJ, 904, 49
- Paegert et al. (2021) Paegert M., Stassun K. G., Collins K. A., Pepper J., Torres G., Jenkins J., Twicken J. D., Latham D. W., 2021, arXiv e-prints, p. arXiv:2108.04778
- Page et al. (2014) Page M. J., et al., 2014, in Proceedings of Swift: 10 Years of Discovery (SWIFT 10. p. 37 (arXiv:1503.06597), doi:10.22323/1.233.0037
- Papitto et al. (2013) Papitto A., et al., 2013, Nature, 501, 517
- Predehl et al. (2021) Predehl P., et al., 2021, A&A, 647, A1
- Roberts (2013) Roberts M. S. E., 2013, in van Leeuwen J., ed., Vol. 291, Neutron Stars and Pulsars: Challenges and Opportunities after 80 years. pp 127–132 (arXiv:1210.6903), doi:10.1017/S174392131202337X
- Romani et al. (2022) Romani R. W., Kandel D., Filippenko A. V., Brink T. G., Zheng W., 2022, ApJ, 934, L17
- Roy et al. (2015) Roy J., et al., 2015, ApJ, 800, L12
- Sanpa-arsa (2016) Sanpa-arsa S., 2016, PhD thesis, University of Virginia, https://libraetd.lib.virginia.edu/public_view/0k225b07h
- Scargle (1982) Scargle J. D., 1982, ApJ, 263, 835
- Shahbaz et al. (2017) Shahbaz T., Linares M., Breton R. P., 2017, MNRAS, 472, 4287
- Strader et al. (2019) Strader J., et al., 2019, ApJ, 872, 42
- Strader et al. (2021) Strader J., et al., 2021, ApJ, 917, 69
- Sunyaev et al. (2021) Sunyaev R., et al., 2021, A&A, 656, A132
- Swihart et al. (2019) Swihart S. J., Strader J., Chomiuk L., Shishkovsky L., 2019, ApJ, 876, 8
- Swihart et al. (2020) Swihart S. J., et al., 2020, ApJ, 892, 21
- Swihart et al. (2021) Swihart S. J., Strader J., Aydi E., Chomiuk L., Dage K. C., Shishkovsky L., 2021, ApJ, 909, 185
- Swihart et al. (2022) Swihart S. J., Strader J., Chomiuk L., Aydi E., Sokolovsky K. V., Ray P. S., Kerr M., 2022, ApJ, 941, 199
- VanderPlas (2018) VanderPlas J. T., 2018, ApJS, 236, 16
- Vines & Jenkins (2022) Vines J. I., Jenkins J. S., 2022, MNRAS, 513, 2719
- Wilms et al. (2000) Wilms J., Allen A., McCray R., 2000, ApJ, 542, 914
- Yershov (2014) Yershov V. N., 2014, Ap&SS, 354, 97
- Zharikov et al. (2019) Zharikov S., Kirichenko A., Zyuzin D., Shibanov Y., Deneva J. S., 2019, MNRAS, 489, 5547