UV Spectral Characterization of Low-Mass Stars With AstroSat UVIT for Exoplanet Applications: The Case Study of HIP 23309
Abstract
Characterizing rocky exoplanet atmospheres is a key goal of exoplanet science, but interpreting such observations will require understanding the stellar UV irradiation incident on the planet from its host star. Stellar UV mediates atmospheric escape, photochemistry, and planetary habitability, and observations of rocky exoplanets can only be understood in the context of the UV SED of their host stars. Particularly important are SEDs from observationally favorable but poorly understood low-mass M-dwarf stars, which are the only plausible targets for rocky planet atmospheric characterization for the next 1-2 decades. In this work, we explore the utility of AstroSat UVIT for the characterization of the UV SEDs of low-mass stars. We present observations of the nearby M0 star HIP 23309 in the FUV and NUV gratings of UVIT. Our FUV spectra are consistent with contemporaneous HST data and our NUV spectra are stable between orbits, suggesting UVIT is a viable tool for the characterization of the SEDs of low-mass stars. We apply our measured spectra to simulations of photochemistry and habitability for a hypothetical rocky planet orbiting HIP 23309 and elucidate the utility and limitations of UVIT in deriving UV SEDs of M-dwarf exoplanet hosts. Our work validates UVIT as a tool to complement HST in the characterization of exoplanet host stars and carries implications for its successor missions like INSIST.
1 Introduction
Temperate, rocky planets orbiting other stars are abundant, and upcoming facilities will have the ability to characterize their atmospheres (Dressing & Charbonneau, 2015; Bryson et al., 2021; Rodler & López-Morales, 2014; Morley et al., 2017; Lustig-Yaeger et al., 2019). Characterization of rocky exoplanet atmospheres will probe their surface processes including potentially constraining the presence or absence of life (Schwieterman et al., 2018), and such constraints are high priorities for the astronomical community (National Academies of Sciences Engineering and Medicine, 2018, 2021). However, interpreting measurements of rocky exo-atmospheres requires understanding the UV spectral energy distribution (SED) of their host stars. Stellar UV is a first-order control on the surface-atmosphere system of rocky planets, and mediates atmospheric escape, photochemistry, and habitability, meaning that observations of rocky exo-atmospheres can only be understood in the context of the SED of their host star (Teal et al., 2022). This observation has motivated observational and theoretical work aimed at constraining the high-energy emission of exoplanet host stars (e.g., France et al. 2013; Viswanath et al. 2020).
Characterization of the UV emission of low-mass () M-dwarf stars is of particular importance to the quest to characterize rocky exo-atmospheres. Most stars are M-dwarfs, and planets orbiting M-dwarfs are uniquely accessible to characterization (Scalo et al., 2007; Shields et al., 2016). Consequently, M-dwarf planets are the only plausible targets for in-depth atmospheric characterization and biosignature search with near-term facilities such as JWST and the ELTs (Cowan et al., 2015; Morley et al., 2017; Batalha et al., 2018; Tremblay et al., 2020). However, M-dwarf UV emission is very different from the UV emission of higher-mass stars. These differences are predicted to impact atmospheric escape, atmospheric photochemistry, and habitability relative to Sun-like stars (Segura et al., 2005; Ramirez & Kaltenegger, 2014; Luger & Barnes, 2015; Rugheimer et al., 2015; Dong et al., 2017; Rimmer et al., 2018; Wordsworth et al., 2018; Harman et al., 2018; Tilley et al., 2019; Schwieterman et al., 2022), motivating observational efforts to characterize the SEDs of M-dwarf stars both directly (e.g., France et al. 2013, 2016; Pineda et al. 2021) and by using measurements to calibrate models (e.g., Peacock et al. 2019a; Duvvuri et al. 2021; Diamond-Lowe et al. 2021). Such observations must be done from space due to telluric absorption, and to-date are primarily executed on the Hubble Space Telescope (HST) (e.g., France et al. 2016). However, the energetic emission of M-dwarfs remains underconstrained, in part because of the need to use extremely scarce HST time, and in part, because the considerable diversity of M-dwarfs necessitates a large number of observations to constrain their emission as a function of parameters such as mass and age (Loyd et al., 2021; Pineda et al., 2021). Efforts have been made to predict M-dwarf UV SEDs from more tractably-measured emission lines (Youngblood et al., 2017; Melbourne et al., 2020), but the use of such approximations may lead to significant inaccuracies in models of rocky exoplanet atmospheres. It remains preferred to characterize the UV SEDs of planet-hosting M-dwarf stars to accurately model the atmospheres of their orbiting planets (Teal et al., 2022).
The UltraViolet Imaging Telescope (UVIT) on the Indian Space Research Organization (ISRO) Astronomy Satellite (AstroSat) mission is in principle well-suited to the characterization of the UV SEDs of M-dwarf stars. UVIT is composed of two 38-cm telescopes with a field of view of 28′ in diameter. One telescope is dedicated to observations in the FUV region (130-180 nm), while the other one is for NUV (200-300 nm) and visible regions (320-550 nm). The UVIT operates in photon counting mode and observes simultaneously with both the telescopes with a spatial resolution (FWHM) 1.′′5 (Tandon et al., 2020), better than the resolution of GALEX (). Both FUV and NUV channels incorporate multiple narrow to broad-band filters. UVIT also has a facility for low-resolution slit-less spectroscopy in both NUV and FUV bands: one grating is mounted in the NUV wheel (now inoperative) and two gratings (with orthogonal dispersions axis) in the FUV wheel. The maximum efficiency is achieved in the 2 order of the FUV gratings with a spectral resolution of 15 Å and 1 order of the NUV grating with a spectral resolution of 33 Å (Tandon et al., 2020; Dewangan, 2021). The NUV channel is now inoperative and only archival studies are possible; the FUV channel remains operative.
In this paper, we explore the utility of UVIT to constrain the SEDs of M-dwarf stars using HIP 23309 as a case-study. HIP 23309 is a young ( Myr), rapidly rotating, early-type M-dwarf star (Pineda et al. 2021; Table 1). The age estimate for HIP 23309 is based on its membership in the Pictoris moving group (Messina et al., 2010; Pineda et al., 2021), which is Myr old (Bell et al., 2015). We secure spectrally resolved observations of HIP 23309 in the UVIT FUV ( nm) and NUV ( nm) gratings. Standard UVIT calibration pipelines are able to extract resolved spectra of HIP 23309 with no modification (Dewangan, 2021). We compare our FUV data to contemporaneous HST measurements and find agreement at levels that we consider satisfactory for use in exoplanet photochemistry studies. We perform atmospheric and surficial photochemical modeling to elucidate the utilities and limitations of such measurements for studying the atmospheres of rocky planets and assessing their habitability. We close by commenting on the potential of UVIT for studies of M-dwarfs and their exoplanets, and recommendations for future facilities like INSIST (Subramaniam, 2022).
| Parameter | Value | Reference |
|---|---|---|
| Spectral Type | M0 | Torres et al. (2006); Pineda et al. (2021) |
| Effective Temperature | K | Pineda et al. (2021) |
| Mass | Pineda et al. (2021) | |
| Radius | Pineda et al. (2021) | |
| Luminosity | erg s-1 | Pineda et al. (2021) |
| Rotation Period | days | Messina et al. (2010) |
2 Observations and Data Reduction
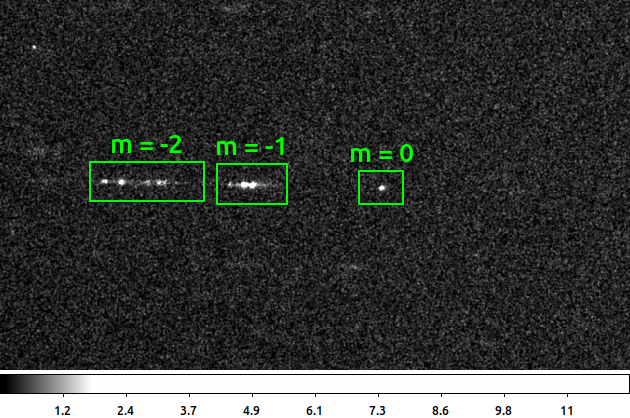
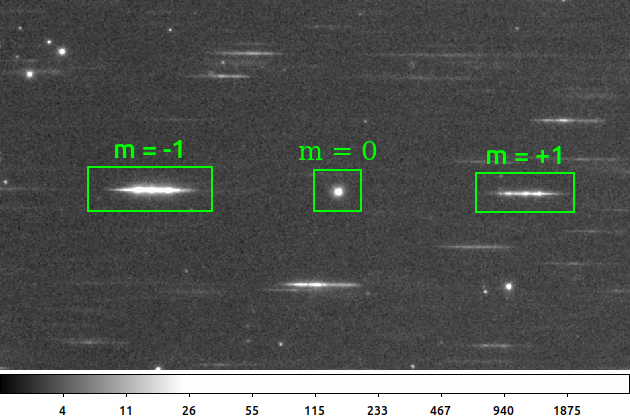
We observed HIP 23309 with the FUV-Grating1 (FUV-G1) and NUV-Grating of UVIT as a part of the AO-1 proposal (PI: Lalitha Sairam) on 24-11-2017 with an exposure time of 12 ksec in each channel. The observations were completed in multiple orbits. We applied corrections for spacecraft drift, flat-field, and distortion, using the software CCDLAB (Postma & Leahy, 2017) and created images for each orbit. Then, the orbit-wise images were co-aligned and combined to generate final science-ready images in each grating. Astrometry on the images was also performed using CCDLAB by comparing the Gaia-DR2 source catalogue. The zoomed-in FUV and NUV grating images are shown in Figure 1, with boxes indicating the different spectral orders. We extracted the source spectrum of 2 order from FUV-G1 image and order from the NUV image with a cross-dispersion width of 50 pixels (1 pixel ). Background regions are selected exactly in the same pixel range above the source spectrum along the dispersion axis for both gratings. We used the UVITTools package written in the Julia language by Dewangan 2021 to extract spectral files for a given grating order and cross-dispersion width. Wavelength and flux calibration to the spectra are done using standard UVIT source calibrators: HZ4 and NGC40. We re-ran the pipeline on the raw HZ4 and NGC40 data and recovered results consistent with IUE measurements and Dewangan (2021), confirming that we were not using the pipeline erroneously. We show the FUV and NUV spectra of HIP 23309 in Figure 2.
3 Measured Spectra of HIP 23309
3.1 UVIT Measurements of HIP 23309
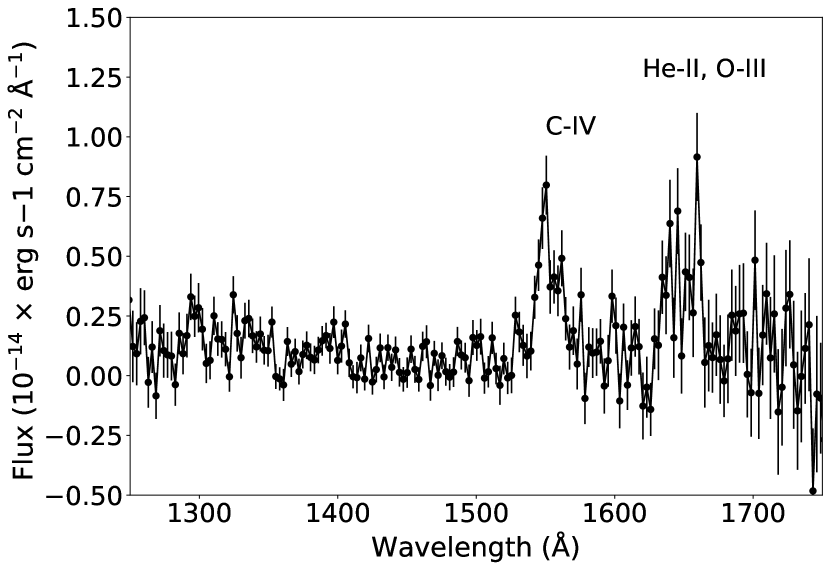
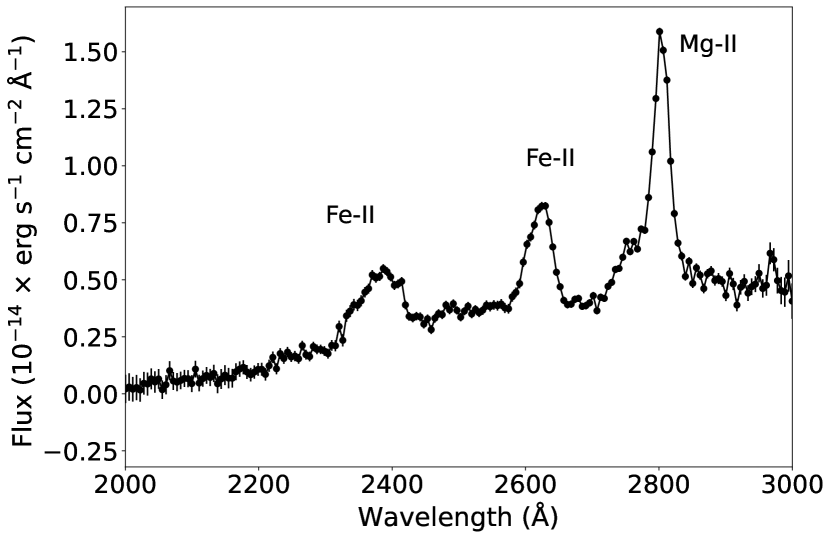
In the NUV spectrum (right panel of Figure 2), we can clearly identify three peaks: one at 2800 Å due to strong Mgii h and k lines, and the other two peaks at 2400 Å and 2600 Å due to strong Feii lines. The strong Mgii h and k lines emissions indicate that the star is chromospherically active (Blanco et al., 1979; Doherty, 1985). In the FUV spectrum (left panel of Figure 2), comparative poor signal-to-noise (SNR) makes it difficult to identify emission lines. We can clearly identify the strong Civ line at 1560 Å despite low SNR, however, the identification of Heii and Oiii are less reliable for further analysis.
3.2 Robustness of UVIT M-dwarf Spectra
We next assess the accuracy of our spectra of HIP 23309 from UVIT. For the far-UV wavelength regime, we are able to directly compare our UVIT observations to contemporaneous FUV measurements collected by HST within 1 day of this work. (Table 2). For the near-UV data, we evaluate the orbit-by-orbit stability of our measured spectrum.
3.2.1 FUV Spectrum: Comparison to HST Data
We coordinated our UVIT observations of HIP 23309 with HST STIS observations of HIP 23309 collected as part of the FUMES survey (PI: J. S. Pineda; Pineda et al. 2021; Youngblood et al. 2021). The spectral coverage of the UVIT FUV Grating1 and the HST STIS overlap from 130-170 nm, enabling us to compare spectra derived from the two facilities.
| Facility | Instrument | Grism/Grating | Orbits | Observation Start Time (UT) | Total Integration Time | Reference |
|---|---|---|---|---|---|---|
| HST | STIS | G140L (115-173 nm) | 1 | 2017-11-24 01:15:22 | 2350 s | Pineda et al. (2021) |
| AstroSat | UVIT | FUV Grating1 (130-180 nm)aaTandon et al. (2017) | 7 | 2017-11-24 10:16:44 | 11967 s | This Work |
| AstroSat | UVIT | NUV (200-300 nm)aaTandon et al. (2017) | 7 | 2017-11-24 10:16:44 | 12027 s | This Work |
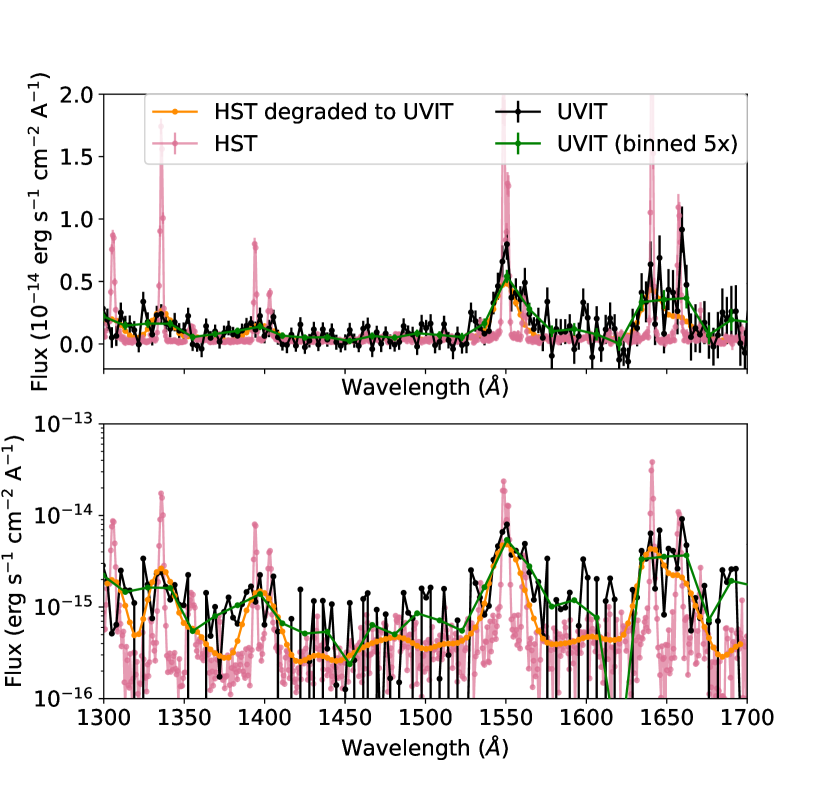
The UVIT FUV and STIS measurements of HIP 23309 broadly agree to within a factor of , but the UVIT measurements systematically exceed the STIS measurements (Figure 3). The 130-170 nm continuum flux measured by UVIT is erg s-1 cm-2, compared to erg s-1 cm-2. This corresponds to a 40% overestimate by UVIT and 4.63 tension relative to STIS. To compare the STIS data to the UVIT data spectrally, we (1) convolve the STIS data against a Gaussian with full-width at half-max of 14.63, corresponding to the resolution of the UVIT FUV grating (Dewangan, 2021), and (2) rebin the smoothed spectrum to the same wavelength scale as the UVIT data using the coronograph package and conserving total SNR in each bin (Robinson et al., 2016; Lustig-Yaeger et al., 2019). The synthetic spectrum derived from the HST data is in tension with the UVIT spectrum by an average of 1.46 (Figure 3). The disagreement is strongest in the continuum region between lines, where HIP 23309 emits very little flux ( erg s-1 cm-2 Å-1 in FUV; Pineda et al. 2021). For example, integrated from 1410-1510 Å, the flux measured by UVIT is erg cm-2 s-1 Å-1, whereas the flux measured by HST is erg cm-2 s-1 Å-1, a tension of 1.9. The agreement between HST and UVIT is better for major lines, i.e. Civ. The Civ line emission from UVIT is erg cm-2 s-1, compared to erg cm-2 s-1 from HST (Pineda et al., 2021). We conclude that the UVIT FUV data broadly reproduce the HST data to within a factor of 2, but that there is the potential for uncorrected systematic error in the UVIT data, including potentially an offset of erg s-1 cm-2 Å-1.
3.2.2 NUV Spectrum: Stability of Measurement
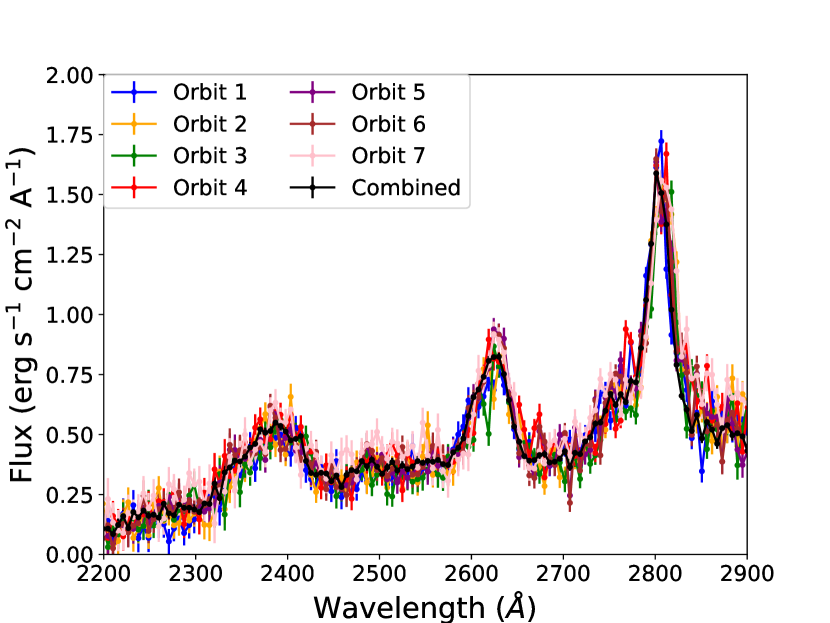
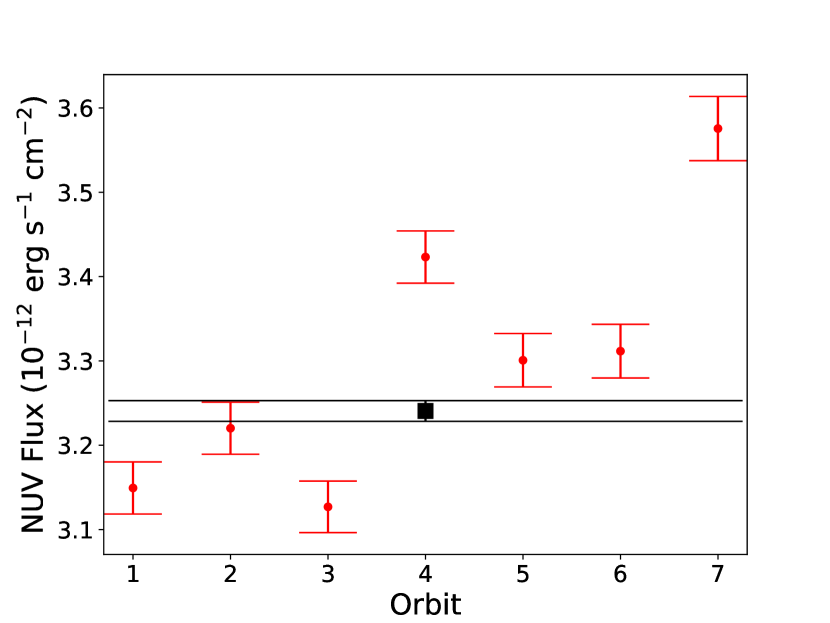
The SNR of the NUV data is high enough to support orbit-by-orbit decomposition (Figure 4). The band-integrated (220-290 nm) orbit-by-orbit NUV data are consistent with the mean to within 10% but vary from it by as much as . We first consider potential systematic effects within our data before discussing physical interpretations.
It is possible that the measurement errors are underestimated, e.g. due to an uncharacterized source of red noise. Indeed, the orbit-by-orbit band-integrated fluxes display a weak increase with orbit number, a potential systematic effect with the observatory. Comparing the orbit-by-orbit data to the mean on a spectral basis, we find that the average deviation from the mean :
| (1) |
has values ranging from to . This indicates that the errors are could be underestimated by a factor of a few.
Alternately, our measurements may reflect variations in stellar flux due to activity (Loyd & France, 2014; Loyd et al., 2018; Duvvuri et al., 2023). We do not detect evidence of large flares (variation in total flux of ) on minute timescales. Stochastic variability on short timescales in the Ca ii K line for HIP 23309 is on the order of 5% (Duvvuri et al., 2023), simultaneous with our FUV data set, several hours prior to the start of our NUV data. Loyd et al. (2018) also demonstrate 10% broadband quiescent FUV variability in their young M-dwarf sample, with one object displaying up to 50% variations relative to the median, which can translate to factors of a few from minimum to maximum. Our observed NUV variability is consistent with these data as we expect the NUV variability to fall between the optical and FUV measurements. We also note that the fractional stochastic variability may not be correlated with absolute activity (Duvvuri et al., 2023).
However, our NUV data show a clear trend over time (Figure 4. This might be explained through rotational variation as an active region comes into view, enhancing the total NUV flux. To test this idea, we fit a simple sinusoidal model () to the 7 NUV data points, with for d. We find that the best solution places our data points at the rising part of the sinusoidal trough, with 50-70% fractional variation about the model median total NUV flux. This result appears to be similar to that of the most quiescent variable target in Loyd et al. (2018). Although, we cannot confirm an astrophysical origin for the observed NUV variability, it is plausible.
3.3 HIP 23309 SED in Context
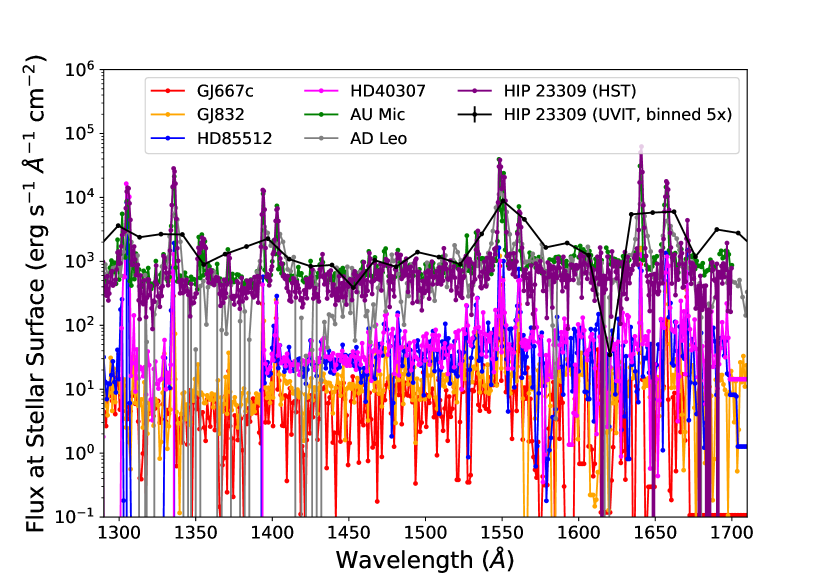
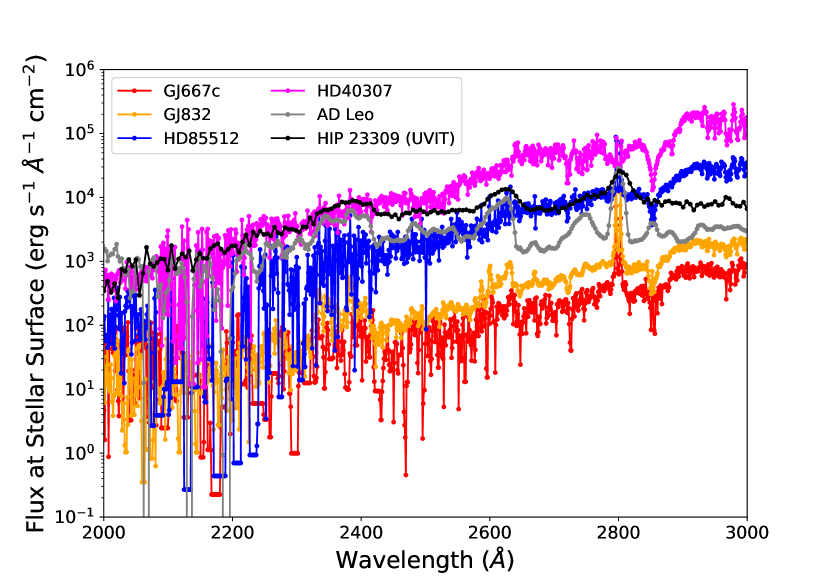
We compare our FUV and NUV spectra of HIP 23309 to spectra of other low-mass stars to assess whether our measurements are sensible in context (Figure 5). We specifically compare the spectral flux at the stellar surface of HIP 23309 to MUSCLES M-dwarf and K-dwarf spectra (v2.2, France et al. 2016; Youngblood et al. 2016; Loyd et al. 2016), to the composite VPL spectrum of AD Leo (Segura et al., 2005) and to StarCAT measurements of AU Mic in the FUV (Ayres, 2010). The MUSCLES targets chosen are mature stars which bracket HIP 23309 in spectral type, whereas AD Leo is a highly active M-dwarf and AU Mic is a young pre-main sequence (22 Myr, Mamajek & Bell 2014; Plavchan et al. 2020) early M-dwarf star similar to HIP 23309. HIP 23309’s FUV emission is similar to AU Mic’s, which is sensible in that AU Mic is of similar spectral type and age to HIP 23309. HIP 23309 is brighter in the FUV and NUV compared to main-sequence M-dwarfs of similar spectral type, consistent with the finding that pre-main sequence M-dwarfs display elevated UV emission compared to main-sequence M-dwarfs due to enhanced stellar activity and larger radii (Shkolnik & Barman, 2014). This additional activity flattens the slope of the spectrum across the entire NUV band, as seen in the most active M-dwarfs (Segura et al., 2005; Walkowicz et al., 2008), with much stronger emissions at short wavelengths relative to the main-sequence M-dwarfs. At longer wavelengths in the NUV, the HIP 23309 stellar flux begins to converge with main-sequence stars of similar spectral type, which is consistent with the increasing importance of photospheric emission at longer wavelengths. We conclude that to zeroth order, our measured NUV and FUV spectra of HIP 23309 are sensible in the context of other measured spectra of low-mass stars.
4 Applications of UV SEDs to Rocky Exoplanet Modeling
In this section, we explore the implications of our measured SED of HIP 23309 for a hypothetical temperate terrestrial planet orbiting HIP 23309. Our intent is to illustrate the utility of M-dwarf SEDs for studying rocky exoplanets, and particularly for questions of astrobiological interest.
4.1 Implications of HIP 23309 SED for UV-Dependent Prebiotic Chemistry
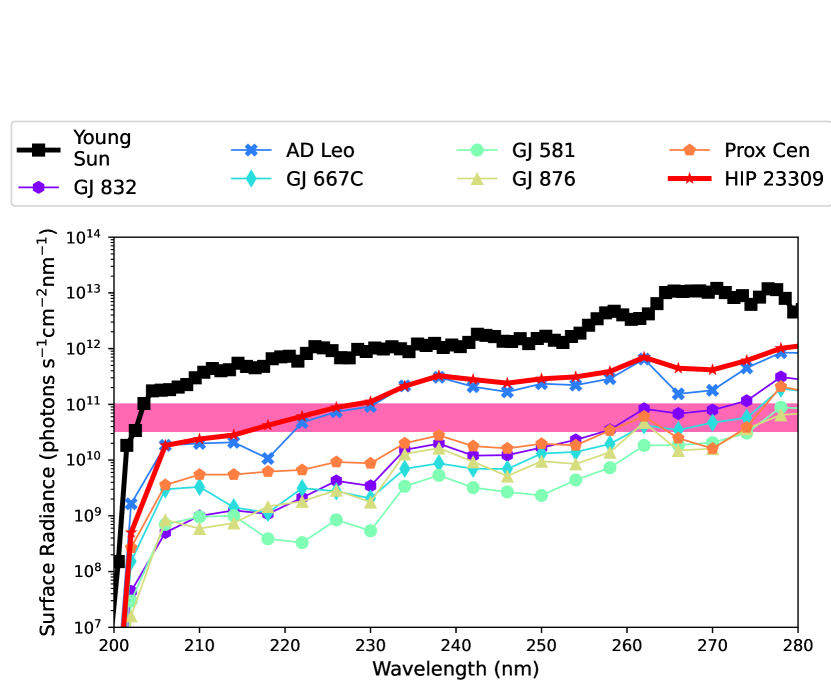
UV light has been proposed as necessary to the origin of life, but the surfaces of habitable M-dwarf planets are low-UV environments (Ranjan et al., 2017). Rimmer et al. (2018) showed that HCN photohomologation chemistry used in proposed prebiotic pathways for ribonucleotide synthesis (Xu et al., 2018, 2020; Rimmer et al., 2021b) require cm-2 s-1 nm-1 to function, where is the surface flux averaged from 200-280 nm. This means that if HCN photohomologation is required for the emergence of life, then life cannot emerge on planets that have access to less than this critical flux of UV. Rimmer et al. (2018) find that the quiescent emission from known M-dwarfs is insufficient to meet this criterion and that HCN photohomologation chemistry can only proceed on planets orbiting M-dwarfs if enabled by transiently enhanced UV from flares. Laboratory efforts to experimentally determine if flare UV can substitute for quiescent UV in HCN photohomologation are now under way111https://www.mrao.cam.ac.uk/~pbr27/resources.html, accessed 12/7/2022. If flares cannot compensate for low-steady state UV, then life search on M-dwarf exoplanets may enable tests of theories the origin of life (Rimmer et al., 2021a; Rimmer, 2023).
We consider whether the UV emission from HIP 23309 meets the Rimmer et al. (2018) criterion. We assembled an FUV-NIR SED of HIP 23309 by concatenating our UVIT-measured FUV and NUV fluxes to the low-resolution GAIA spectrum of HIP 23309 (Gaia Collaboration et al., 2022). We set the stellar flux at wavelengths shorter than the limits of the measured SED to 0. We scale these observed fluxes to the flux that would be experienced by a hypothetical Earth-like planet orbiting HIP 23309 by multiplying them by , where pc is the distance to HIP 23309 (Malo et al., 2014; Gaia Collaboration et al., 2022), is the distance such that the bolometric flux received at distance is equivalent to the bolometric flux received by Earth, corrected by to account for the redder emission from M-dwarf stars (Segura et al., 2005), and erg s-1 (Pineda et al., 2021). We then calculated the hemispherically-integrated surface actinic flux (“surface radiance”) for an early Earth-like planet with a clear-sky 0.9 bar N2, 0.1 bar CO2 atmosphere as in Ranjan et al. (2017). We find that HIP 23309 comfortably meets the Rimmer et al. (2018) criterion, with cm-2 s-1 nm-1. Interestingly, we also find that the quiescent flux from the extremely active M-dwarf AD Leo also meets the Rimmer et al. (2018) criterion ( cm-2 s-1 nm-1), and that quiescent flux from early (high-mass) M-dwarfs like GJ 832 also marginally meet this criterion. This contradiction with Rimmer et al. (2018) is due to their assignment of a ceiling on single-scattering albedo of 0.9222P. Rimmer, personal communication, 12/7/2020 when calculating two-stream radiative transfer, which underestimates surface UV in the unique regime unveiled on anoxic early Earth-like planets (Ranjan & Sasselov, 2017; Rimmer et al., 2021b). We instead find that planets orbiting young or active M-dwarf stars, as well as some quiescent early M-dwarf stars, can meet the Rimmer et al. (2018) criterion, illustrating the necessity of measuring and constraining the evolution of NUV SEDs of individual planet-hosting M-dwarfs to understand the habitability of their worlds (Rimmer et al., 2021a).
4.2 Implications of HIP 23309 SED for Atmospheric Photochemistry
In this section, we explore the utility and limitations of AstroSat UVIT for constraining the UV SEDs of exoplanet host stars for atmospheric photochemistry applications. UV photochemistry controls the trace gas composition of temperate terrestrial planet atmospheres, and accurate UV SEDs are necessary for accurate predictions of atmospheric composition and inferences derived thereof (Rugheimer et al., 2015; Teal et al., 2022). We assess the impact of UV SEDs on predicted atmospheric trace gas concentrations using a procedure established first by Kasting et al. (1997) and subsequently extensively deployed (e.g., Segura et al. 2005; Rauer et al. 2011; Teal et al. 2022): We run a photochemical model with a fixed planetary scenario, varying only the UV irradiation between model runs, and examine the implications for predicted atmospheric composition. Our calculations are solely sensitivity tests aimed at constraining the utility and limitations of using AstroSat UVIT to constrain M-dwarf SEDs for photochemical modeling applications, as opposed to self-consistent predictions of the atmospheric composition of temperate terrestrial planets orbiting young M-dwarf stars.
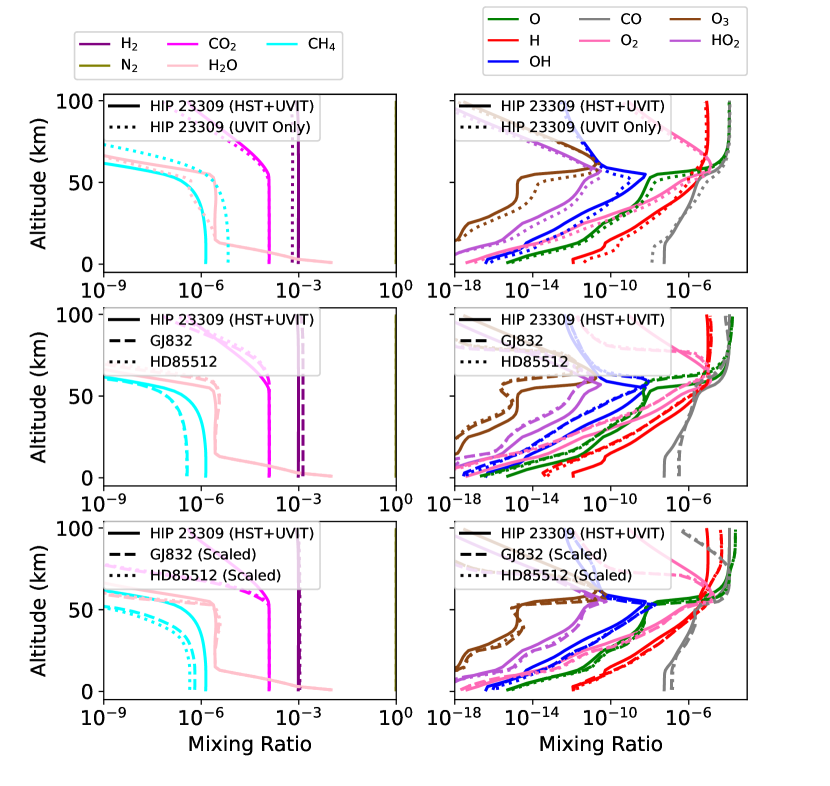
To conduct this sensitivity test, we use the MIT Exoplanet Atmospheric Chemistry model (MEAC, Hu et al. 2012), as updated by Ranjan et al. (2022). We apply MEAC to the N2-dominated abiotic temperate terrestrial planet benchmark scenario from Hu et al. (2012), which simulates a planet geologically similar to Earth in the absence of life. We explore the effects of different estimates of the HIP 23309 SED on the abundances of key HCO species which dominate the atmosphere and whose remote detection could constrain surfaces processes like the carbon cycle and the presence or absence of life (Bean et al., 2017; Schwieterman et al., 2019; Wogan & Catling, 2020; Lehmer et al., 2020; Thompson et al., 2022).
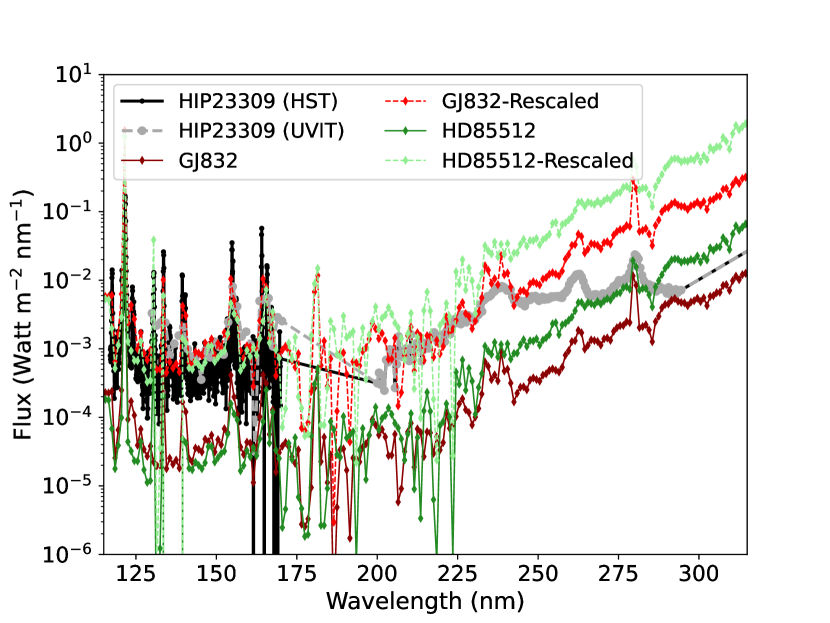
We begin by showing that the UVIT-measured SED alone can achieve order-of-magnitude accuracy at best in the photochemical modeling of rocky exoplanet atmospheres. We formulate a UVIT-only input SED for HIP 23309 as in Section 4.1, except that we do not include the luminosity correction factor of 0.9 to maintain consistency with similar past sensitivity tests conducted with MEAC (e.g., Seager et al. 2013). We formulate a second SED as the UVIT SED, except that we replace the UVIT FUV measurements with the FUMES HST measurements (Figure 7). Calculating the trace gas composition under irradiation by each of these SEDs (Figure 8), we find that the use of the UVIT-only SED leads to overpredictions of CH4 by and underprediction of CO by relative to the UVIT+HST SED (Table 3). Two factors drive model inaccuracy when using the UVIT-only SED. First, the UVIT SED systematically overestimates the continuum flux due to its lower sensitivity. This leads to overestimates of H2O photolysis and accounts for the variation in pCO and some of the variation in pCH4. The effects of this overestimate are amplified by the large wavelength gap between reliable measurements in the FUV and NUV gratings, which is interpolated in the model. The importance of the UV continuum has been affirmed in other studies (Teal et al., 2022; Peacock et al., 2022). Second, the UVIT SED does not reliably cover the Lyman-alpha line, where M-dwarfs emit a substantial fraction of their flux and which is particularly relevant to CH4 photolysis in anoxic atmospheres (France et al., 2013; Ranjan et al., 2022). Peacock et al. (2022) reported the predicted atmospheric composition of M-dwarf planets to be insensitive to the degree of self-reversal in the stellar Ly line, and we reproduced this finding with our model. However, omitting Ly entirely results in a much bigger change in irradiating flux than variations in the degree of self-reversal in the Ly line, and we find this omission to result in significant variations in predicted pCH4.
| SED | ||
|---|---|---|
| HIP 23309 HST FUV | ||
| HIP 23309 UVIT FUV | ||
| GJ 832 (MUSCLES) | ||
| HD85512 (MUSCLES) | ||
| GJ 832 (Scaled) | ||
| HD85512 (Scaled) |
We next consider how the UVIT-only SED performs in comparison to proxy SEDs from stars of similar spectral type, which are sometimes employed when accurate SEDs of planet-hosting stars are not available (e.g., Hu et al. 2020, 2021). We consider SEDs from GJ832 (M1.5) and HD 85512 (K6), which are well-characterized by the MUSCLES survey (v2.2, France et al. 2016; Loyd et al. 2016; Youngblood et al. 2016), as proxies for HIP 23309 (M0). We normalize their SEDs to the solar constant as for HIP 23309, and apply these SEDs to our planetary scenario (Figure 7). We find that use of proxy SEDs matches the HST+UVIT SED calculation better than the UVIT-only SED (Figure 8, Table 3).
We finally consider whether UVIT data can be used to calibrate other techniques for estimating M-dwarf UV SEDs. For example, partial SED measurements have been used to calibrate full-SED estimates derived from stellar models (Peacock et al., 2019a, b, 2020). Such sophisticated estimates are beyond the scope of this work; as proof-of-concept, we instead utilize our UVIT measurements to crudely calibrate our use of similar stellar spectra as proxies. Specifically, we scale our GJ832 and HD85512 SEDs by a constant factor, such that they have the same flux integrated from 130-170 nm as our UVIT-only HIP 23309 SED (Figure 7). We do not utilize the NUV data because the UVIT NUV grating is no longer operative, and so it is of limited utility to determine its utility at calibrating other estimates. For simplicity we scale the SEDs across all wavelengths, but only the UV wavelengths have any impact on our models since our photochemistry-only sensitivity test neglects climate adjustments. We find that use of scaled proxy SEDs to marginally improve agreement with the HIP 23309 UVIT+HST SED compared to unscaled proxy SEDs, in the case of GJ832 reproducing the predicted surface concentrations of CO and CH4 to within a factor of 2 (Figure 8, Table 3). That even an extremely crude calibration with UVIT can marginally improve agreement suggests that it is possible that more sophisticated calibrations with UVIT can significantly improve agreement; we advocate such work.
5 Discussion & Conclusions
Constraining the UV SEDs of low-mass stars is crucial to interpreting atmospheric measurements of the exoplanets they host, and to understanding the habitability and urability of those planets (Deamer et al., 2022). The primary instrument used for such studies, HST, is oversubscribed and well past its designed lifetime. Here, we have examined the potential of AstroSat UVIT to carry out such studies through spectrally resolved NUV and FUV grating observations of the young M0 star HIP 23309. We robustly detect stellar lines of Civ in the FUV and Feii and Mgii in the NUV. We find UVIT can reproduce contemporaneous HST measurements in the FUV to within a factor of 2 and that its orbit-by-orbit NUV measurements are stable to 10%, but that its errors may be underestimated by a factor of a few. The UVIT-measured HIP 23309 SED displays trends in the context of other measured M-dwarf SEDs that are consistent with zeroth-order expectations. Taken together, the example of HIP 23309 suggests AstroSat UVIT is a viable tool for characterizing the UV SEDs of bright, nearby low-mass stars to within a factor of a few.
We have demonstrated the utility of such measurements for planetary applications using HIP 23309 as a case study. Archival measurements of stellar UV from the UVIT NUV grating can inform studies of planetary habitability because they constrain emission at the nm wavelength range relevant to habitable planet surfaces (Ranjan & Sasselov, 2017). For example, HIP 23309 meets the Rimmer et al. (2018) criterion for sufficient UV output to power HCN photohomologation in its habitable zone, demonstrating the necessity of characterizing the detailed evolution of M-dwarf SEDs to understand the potential of biosignature search on M-dwarf planets to test theories of the origin of life (Rimmer et al., 2021a; Rimmer, 2023). Our FUV and NUV spectra of HIP 23309 on their own permit limited accuracy in photochemical modeling of planetary atmospheres, because the UVIT FUV grating does not reliably cover the crucial Lyman alpha line and because the limited sensitivity and wavelength coverage of the FUV grating leads to overestimates of the continuum flux. However, our sensitivity tests suggest that UVIT FUV observations can be used to calibrate estimates of M-dwarf SEDs, thereby supporting photochemical modeling. Our work suggests a role for archival NUV observations and archival and future FUV observations in supporting studies of exoplanet habitability and photochemistry.
Our study bears implications for the proposed Indian Spectroscopic and Imaging Space Telescope (INSIST; Subramaniam, 2022). The INSIST mission design features a 1m mirror ( the size of UVIT), suggesting a factor of 7 improvements in signal-to-noise relative to UVIT, and continuous wavelength coverage from the FUV to the NUV (150-300 nm). This means that INSIST would likely outperform UVIT at characterizing the important UV continuum. However, the termination of its wavelength coverage at 150 nm means that INSIST would not be able to directly constrain the 121.6 nm Lyman alpha line which can be important to temperate exoplanet photochemistry. We advocate for the extension of INSIST’s spectral coverage to 120 nm or shorter, to enable direct characterization of the full wavelength range relevant to exoplanet photochemistry. However, higher resolution modes () may be necessary to accurately measure Lyman alpha fluxes accounting for the impact of the intervening ISM (Youngblood et al., 2021). Precise measurements of chromospheric and transition region lines like Mgii, Civ, Siiv, and/or Nv can provide useful proxies within potential INSIST data to estimate the total FUV flux of interesting stellar targets (Pineda et al., 2021). Nevertheless, even if INSIST is unable to directly measure full exoplanet host star UV SEDs, measurements from INSIST will still be able to calibrate other estimates of M-dwarf SEDs like stellar models (Peacock et al., 2019a, b), and its coverage of NUV wavelengths will enable planetary habitability studies (e.g., Rugheimer et al. 2015; Ranjan et al. 2017; Rimmer et al. 2018; O’Malley-James & Kaltenegger 2019).
References
- Ayres (2010) Ayres, T. R. 2010, ApJS, 187, 149, doi: 10.1088/0067-0049/187/1/149
- Batalha et al. (2018) Batalha, N. E., Lewis, N. K., Line, M. R., Valenti, J., & Stevenson, K. 2018, ApJ, 856, L34, doi: 10.3847/2041-8213/aab896
- Bean et al. (2017) Bean, J. L., Abbot, D. S., & Kempton, E. M. R. 2017, ApJ, 841, L24, doi: 10.3847/2041-8213/aa738a
- Bell et al. (2015) Bell, C. P. M., Mamajek, E. E., & Naylor, T. 2015, MNRAS, 454, 593, doi: 10.1093/mnras/stv1981
- Blanco et al. (1979) Blanco, C., Catalano, S., & Marilli, E. 1979, Nature, 280, 661, doi: 10.1038/280661a0
- Bryson et al. (2021) Bryson, S., Kunimoto, M., Kopparapu, R. K., et al. 2021, AJ, 161, 36, doi: 10.3847/1538-3881/abc418
- Cowan et al. (2015) Cowan, N. B., Greene, T., Angerhausen, D., et al. 2015, PASP, 127, 311, doi: 10.1086/680855
- Deamer et al. (2022) Deamer, D., Cary, F., & Damer, B. 2022, Astrobiology, 22, 889, doi: 10.1089/ast.2021.0173
- Dewangan (2021) Dewangan, G. C. 2021, Journal of Astrophysics and Astronomy, 42, 49, doi: 10.1007/s12036-021-09691-w
- Diamond-Lowe et al. (2021) Diamond-Lowe, H., Youngblood, A., Charbonneau, D., et al. 2021, AJ, 162, 10, doi: 10.3847/1538-3881/abfa1c
- Doherty (1985) Doherty, L. R. 1985, MNRAS, 217, 41, doi: 10.1093/mnras/217.1.41
- Dong et al. (2017) Dong, C., Lingam, M., Ma, Y., & Cohen, O. 2017, ApJ, 837, L26, doi: 10.3847/2041-8213/aa6438
- Dressing & Charbonneau (2015) Dressing, C. D., & Charbonneau, D. 2015, Astrophysical Journal, 807, 45, doi: 10.1088/0004-637X/807/1/45
- Duvvuri et al. (2023) Duvvuri, G. M., Pineda, J. S., Berta-Thompson, Z. K., France, K., & Youngblood, A. 2023, AJ, 165, 12, doi: 10.3847/1538-3881/ac9b49
- Duvvuri et al. (2021) Duvvuri, G. M., Sebastian Pineda, J., Berta-Thompson, Z. K., et al. 2021, ApJ, 913, 40, doi: 10.3847/1538-4357/abeaaf
- France et al. (2013) France, K., Froning, C. S., Linsky, J. L., et al. 2013, The Astrophysical Journal, 763, 149
- France et al. (2016) France, K., Parke Loyd, R. O., Youngblood, A., et al. 2016, Astrophysical Journal, 820, 89, doi: 10.3847/0004-637X/820/2/89
- Gaia Collaboration et al. (2022) Gaia Collaboration, Vallenari, A., Brown, A. G. A., et al. 2022, arXiv e-prints, arXiv:2208.00211. https://arxiv.org/abs/2208.00211
- Harman et al. (2018) Harman, C. E., Felton, R., Hu, R., et al. 2018, ApJ, 866, 56, doi: 10.3847/1538-4357/aadd9b
- Hu et al. (2021) Hu, R., Damiano, M., Scheucher, M., et al. 2021, ApJ, 921, L8, doi: 10.3847/2041-8213/ac1f92
- Hu et al. (2020) Hu, R., Peterson, L., & Wolf, E. T. 2020, ApJ, 888, 122, doi: 10.3847/1538-4357/ab5f07
- Hu et al. (2012) Hu, R., Seager, S., & Bains, W. 2012, Astrophysical Journal, 761, 166, doi: 10.1088/0004-637X/761/2/166
- Kasting et al. (1997) Kasting, J. F., Whittet, D. C. B., & Sheldon, W. R. 1997, Origins of Life and Evolution of the Biosphere, 27, 413, doi: 10.1023/A:1006596806012
- Lehmer et al. (2020) Lehmer, O. R., Catling, D. C., & Krissansen-Totton, J. 2020, Nature Communications, 11, 6153, doi: 10.1038/s41467-020-19896-2
- Loyd & France (2014) Loyd, R. O. P., & France, K. 2014, ApJS, 211, 9, doi: 10.1088/0067-0049/211/1/9
- Loyd et al. (2018) Loyd, R. O. P., Shkolnik, E. L., Schneider, A. C., et al. 2018, ApJ, 867, 70, doi: 10.3847/1538-4357/aae2ae
- Loyd et al. (2016) Loyd, R. O. P., France, K., Youngblood, A., et al. 2016, Astrophysical Journal, 824, 102, doi: 10.3847/0004-637X/824/2/102
- Loyd et al. (2021) Loyd, R. O. P., Shkolnik, E. L., Schneider, A. C., et al. 2021, ApJ, 907, 91, doi: 10.3847/1538-4357/abd0f0
- Luger & Barnes (2015) Luger, R., & Barnes, R. 2015, Astrobiology, 15, 119, doi: 10.1089/ast.2014.1231
- Lustig-Yaeger et al. (2019) Lustig-Yaeger, J., Meadows, V. S., & Lincowski, A. P. 2019, AJ, 158, 27, doi: 10.3847/1538-3881/ab21e0
- Lustig-Yaeger et al. (2019) Lustig-Yaeger, J., Robinson, T. D., & Arney, G. 2019, Journal of Open Source Software, 4, 1387, doi: 10.21105/joss.01387
- Malo et al. (2014) Malo, L., Doyon, R., Feiden, G. A., et al. 2014, ApJ, 792, 37, doi: 10.1088/0004-637X/792/1/37
- Mamajek & Bell (2014) Mamajek, E. E., & Bell, C. P. M. 2014, MNRAS, 445, 2169, doi: 10.1093/mnras/stu1894
- Melbourne et al. (2020) Melbourne, K., Youngblood, A., France, K., et al. 2020, AJ, 160, 269, doi: 10.3847/1538-3881/abbf5c
- Messina et al. (2010) Messina, S., Desidera, S., Turatto, M., Lanzafame, A. C., & Guinan, E. F. 2010, A&A, 520, A15, doi: 10.1051/0004-6361/200913644
- Morley et al. (2017) Morley, C. V., Kreidberg, L., Rustamkulov, Z., Robinson, T., & Fortney, J. J. 2017, ApJ, 850, 121, doi: 10.3847/1538-4357/aa927b
- National Academies of Sciences Engineering and Medicine (2018) National Academies of Sciences Engineering and Medicine. 2018, Exoplanet Science Strategy (Washington, DC: The National Academies Press), doi: 10.17226/25187
- National Academies of Sciences Engineering and Medicine (2021) —. 2021, Pathways to Discovery in Astronomy and Astrophysics for the 2020s (Washington, DC: The National Academies Press), doi: 10.17226/26141
- O’Malley-James & Kaltenegger (2019) O’Malley-James, J. T., & Kaltenegger, L. 2019, MNRAS, 485, 5598, doi: 10.1093/mnras/stz724
- Peacock et al. (2019a) Peacock, S., Barman, T., Shkolnik, E. L., Hauschildt, P. H., & Baron, E. 2019a, ApJ, 871, 235, doi: 10.3847/1538-4357/aaf891
- Peacock et al. (2019b) Peacock, S., Barman, T., Shkolnik, E. L., et al. 2019b, ApJ, 886, 77, doi: 10.3847/1538-4357/ab4f6f
- Peacock et al. (2020) —. 2020, ApJ, 895, 5, doi: 10.3847/1538-4357/ab893a
- Peacock et al. (2022) Peacock, S., Barman, T. S., Schneider, A. C., et al. 2022, ApJ, 933, 235, doi: 10.3847/1538-4357/ac77f2
- Pineda et al. (2021) Pineda, J. S., Youngblood, A., & France, K. 2021, ApJ, 911, 111, doi: 10.3847/1538-4357/abe8d7
- Plavchan et al. (2020) Plavchan, P., Barclay, T., Gagné, J., et al. 2020, Nature, 582, 497, doi: 10.1038/s41586-020-2400-z
- Postma & Leahy (2017) Postma, J. E., & Leahy, D. 2017, PASP, 129, 115002, doi: 10.1088/1538-3873/aa8800
- Ramirez & Kaltenegger (2014) Ramirez, R. M., & Kaltenegger, L. 2014, Astrophysical Journall, 797, L25, doi: 10.1088/2041-8205/797/2/L25
- Ranjan & Sasselov (2017) Ranjan, S., & Sasselov, D. D. 2017, Astrobiology, 17, 169, doi: 10.1089/ast.2016.1519
- Ranjan et al. (2022) Ranjan, S., Seager, S., Zhan, Z., et al. 2022, ApJ, 930, 131, doi: 10.3847/1538-4357/ac5749
- Ranjan et al. (2017) Ranjan, S., Wordsworth, R., & Sasselov, D. D. 2017, The Astrophysical Journal, 843, 110. http://stacks.iop.org/0004-637X/843/i=2/a=110
- Rauer et al. (2011) Rauer, H., Gebauer, S., Paris, P. V., et al. 2011, A&A, 529, A8, doi: 10.1051/0004-6361/201014368
- Rimmer (2023) Rimmer, P. B. 2023, Conflicting Models for the Origin of Life, 407
- Rimmer et al. (2021a) Rimmer, P. B., Ranjan, S., & Rugheimer, S. 2021a, Elements, 17, 265. https://arxiv.org/abs/2108.08388
- Rimmer et al. (2021b) Rimmer, P. B., Thompson, S. J., Xu, J., et al. 2021b, Astrobiology, 21, 1099, doi: 10.1089/ast.2020.2335
- Rimmer et al. (2018) Rimmer, P. B., Xu, J., Thompson, S. J., et al. 2018, Science Advances, 4, eaar3302, doi: 10.1126/sciadv.aar3302
- Robinson et al. (2016) Robinson, T. D., Stapelfeldt, K. R., & Marley, M. S. 2016, PASP, 128, 025003, doi: 10.1088/1538-3873/128/960/025003
- Rodler & López-Morales (2014) Rodler, F., & López-Morales, M. 2014, Astrophysical Journal, 781, 54, doi: 10.1088/0004-637X/781/1/54
- Rugheimer et al. (2015) Rugheimer, S., Kaltenegger, L., Segura, A., Linsky, J., & Mohanty, S. 2015, The Astrophysical Journal, 809, 57
- Rugheimer et al. (2015) Rugheimer, S., Segura, A., Kaltenegger, L., & Sasselov, D. 2015, Astrophysical Journal, 806, 137, doi: 10.1088/0004-637X/806/1/137
- Scalo et al. (2007) Scalo, J., Kaltenegger, L., Segura, A. G., et al. 2007, Astrobiology, 7, 85, doi: 10.1089/ast.2006.0125
- Schwieterman et al. (2019) Schwieterman, E. W., Reinhard, C. T., Olson, S. L., et al. 2019, ApJ, 874, 9, doi: 10.3847/1538-4357/ab05e1
- Schwieterman et al. (2018) Schwieterman, E. W., Kiang, N. Y., Parenteau, M. N., et al. 2018, Astrobiology, 18, 663, doi: 10.1089/ast.2017.1729
- Schwieterman et al. (2022) Schwieterman, E. W., Olson, S. L., Pidhorodetska, D., et al. 2022, ApJ, 937, 109, doi: 10.3847/1538-4357/ac8cfb
- Seager et al. (2013) Seager, S., Bains, W., & Hu, R. 2013, ApJ, 777, 95, doi: 10.1088/0004-637X/777/2/95
- Segura et al. (2005) Segura, A., Kasting, J. F., Meadows, V., et al. 2005, Astrobiology, 5, 706, doi: 10.1089/ast.2005.5.706
- Shields et al. (2016) Shields, A. L., Ballard, S., & Johnson, J. A. 2016, ArXiv e-prints. https://arxiv.org/abs/1610.05765
- Shkolnik & Barman (2014) Shkolnik, E. L., & Barman, T. S. 2014, AJ, 148, 64, doi: 10.1088/0004-6256/148/4/64
- Subramaniam (2022) Subramaniam, A. 2022, Journal of Astrophysics and Astronomy, 43, 80, doi: 10.1007/s12036-022-09870-3
- Tandon et al. (2017) Tandon, S. N., Subramaniam, A., Girish, V., et al. 2017, AJ, 154, 128, doi: 10.3847/1538-3881/aa8451
- Tandon et al. (2020) Tandon, S. N., Postma, J., Joseph, P., et al. 2020, AJ, 159, 158, doi: 10.3847/1538-3881/ab72a3
- Teal et al. (2022) Teal, D. J., Kempton, E. M. R., Bastelberger, S., Youngblood, A., & Arney, G. 2022, arXiv e-prints, arXiv:2201.08805. https://arxiv.org/abs/2201.08805
- Thompson et al. (2022) Thompson, M. A., Krissansen-Totton, J., Wogan, N., Telus, M., & Fortney, J. J. 2022, Proceedings of the National Academy of Science, 119, e2117933119, doi: 10.1073/pnas.2117933119
- Tilley et al. (2019) Tilley, M. A., Segura, A., Meadows, V., Hawley, S., & Davenport, J. 2019, Astrobiology, 19, 64, doi: 10.1089/ast.2017.1794
- Torres et al. (2006) Torres, C. A. O., Quast, G. R., da Silva, L., et al. 2006, A&A, 460, 695, doi: 10.1051/0004-6361:20065602
- Tremblay et al. (2020) Tremblay, L., Line, M. R., Stevenson, K., et al. 2020, AJ, 159, 117, doi: 10.3847/1538-3881/ab64dd
- Viswanath et al. (2020) Viswanath, G., Narang, M., Manoj, P., Mathew, B., & Kartha, S. S. 2020, AJ, 159, 194, doi: 10.3847/1538-3881/ab7d3b
- Walkowicz et al. (2008) Walkowicz, L. M., Johns-Krull, C. M., & Hawley, S. L. 2008, ApJ, 677, 593, doi: 10.1086/526421
- Wogan & Catling (2020) Wogan, N. F., & Catling, D. C. 2020, ApJ, 892, 127, doi: 10.3847/1538-4357/ab7b81
- Wordsworth et al. (2018) Wordsworth, R. D., Schaefer, L. K., & Fischer, R. A. 2018, AJ, 155, 195, doi: 10.3847/1538-3881/aab608
- Xu et al. (2018) Xu, J., Ritson, D. J., Ranjan, S., et al. 2018, Chemical Communications
- Xu et al. (2020) Xu, J., Chmela, V., Green, N. J., et al. 2020, Nature, 582, 60, doi: 10.1038/s41586-020-2330-9
- Youngblood et al. (2021) Youngblood, A., Pineda, J. S., & France, K. 2021, ApJ, 911, 112, doi: 10.3847/1538-4357/abe8d8
- Youngblood et al. (2016) Youngblood, A., France, K., Loyd, R. O. P., et al. 2016, ApJ, 824, 101, doi: 10.3847/0004-637X/824/2/101
- Youngblood et al. (2017) —. 2017, ApJ, 843, 31, doi: 10.3847/1538-4357/aa76dd