Light and colour of cirrus, translucent and opaque dust
in the high-latitude area of LDN 1642
††thanks: Based on observations collected at the European Organisation for Astronomical
Research in the Southern Hemisphere; and based on observations with ISO, an ESA project with
instruments funded by ESA member states(especially the PI countries: France, Germany,
the Netherlands and the United Kingdom) and with the participation of ISAS and NASA.
Abstract
We have performed a 5-colour surface photometric study of the high-galactic-latitude area of dark nebula LDN 1642. Scattered light properties are presented of diffuse, translucent and opaque dust over the range of 3500 – 5500 Å . Far infrared absolute photometry at 200 m improves the precision of and provides a zero point to the extinction. The intensity of the scattered light depends on dust column density in a characteristic way: for optically thin dust the intensity first increases linearly, then turns to a saturation value; at still larger extinctions the intensity turns down to a slow decrease. The value of the saturated intensity maximum shifts in a systematic way, from mag at 3500 Å to mag at 5500 Å . The intensity curves offer a straight-forward explanation for the behaviour of the scattered-light colours. At the intensity peak the colour agrees with the integrated starlight colour, while it is bluer at the low- and redder at the high-column-density side of the peak, respectively. These colour changes are a direct consequence of the wavelength dependence of the extinction. We have compared the colours of the LDN 1642 area with other relevant observational studies: high-latitude diffuse/translucent clouds, wide-field cirrus dust; and externally illuminated AGB-star envelopes. For extragalactic low-surface-brightness sources cirrus is an unwanted foreground contaminant. Our results for cirrus colours can help to distinguish cases where a diffuse plume or stream, apparently associated with a galaxy or a group or cluster, is more likely a local cirrus structure.
keywords:
ISM: dust, extinction – ISM: clouds, individual LDN 1642 – Galaxy: solar neighbourhood – Astronomical instruments, methods and techniques: methods – Physical data and processes: scattering1 Introduction
With the growing interest in low-surface-brightness objects and phenomena in recent years also the sky background brightness studies have gained new impetus (Valls-Gabaud, Trujillo & Okamoto, 2019). The dominant sky background components for an observer based in the inner Solar System or on the ground are the zodiacal light and the airglow. In the outer solar system and beyond, the sky background is dominated by scattered light off the omnipresent dust particles. Clearly, it is important to know both the brightness and colour of this ’Galactic sky background’. Several aspects of the intensity of the scattered light have been analysed previously (see for example Witt et al. 2008; Brandt & Draine 2012; Mattila et al. 2018, and references therein). In the present paper one of the main aims is to study besides intensity also the colour of the scattered light in cirrus, translucent and dense areas of interstellar dust.
The colour gives clues on the properties of the dust particles and the surrounding interstellar radiation field (ISRF) to which the dust particles are exposed. It is also important because at low surface brightness levels the question frequently arises what is the nature of a plume or loop of diffuse light seen in the outskirts of a galaxy, or towards the ’empty’ intra-galactic space of a group or a cluster of galaxies (see e.g. Arp 1965). Is it an accumulation of unresolved stars stripped off by an interacting galaxy; or an enhanced-density clump in the diffuse intra-cluster medium? Alternatively, it may just be a local dust feature in the Solar neighbourhood. Difference of colour between extragalactic plumes and foreground dust clouds can be of help. Recent studies based on low-dust-opacity regions indicate that foreground cirrus exhibits bluer colours as compared to galaxies and their associated structures. Román, Trujillo & Montes (2020) have discussed the colour differences between galaxies and foreground cirrus using and vs colours. Rudick et al. (2010) and Mihos et al. (2017), on the other hand, have detected in the Virgo cluster centre colour differences between intra-cluster light and foreground cirrus dust. Our study in the present paper makes use of both the and colours. As compared to the and vs diagrams, our vs analysis allows us to better identify the low-opacity cirrus structures; they show, especially, a substantial blue excess of their colours. We will also study how the colours change over different ranges of dust opacity, from cirrus to translucent and dense areas.
Instrumental progress has enabled the observations to penetrate ever deeper into the realm of the low-surface-brightness sky components. The CCD detectors have been the essential technical aid, first of all for studies of individual objects or fields with a limited angular size. Single-channel surface photometry with photomultiplier as detector has, however, still some advantages over the CCD imaging. The relatively small field of view of most telescope/CCD systems makes it hard to survey dark nebulae or other targets of large angular size. Deep surface photometry is also made difficult because accurate flat-fielding is needed over degree-scales. Special methods, appropriate for accurate low-surface-brightness photometry over large field sizes, have been utilized in those cases. A thorough discussion of our methods is presented in Appendix A of this paper.
In the present paper we will analyse the surface-photometric results in the high-galactic-latitude area around LDN 1642. Our five-colour intermediate-band photometry covers the range 3500 - 5500 Å . An important ingredient of the present analysis is that 200 m absolute photometry is available for all our positions. These data provide a zero point for the dust column densities in our target area and, in addition, considerably improve the precision of the extinction estimates.
LDN 1642 has been chosen for our detailed surface photometric study mainly for two reasons: firstly, its surrounding sky has exceptionally low extinction, mag, which means that the scattered light contribution is low there. LDN 1642 and its surroundings provide a representative test area to study the scattered light from dust over a wide range, covering areas from diffuse/cirrus dust over translucent up to very high extinction areas. Secondly, the dense core of the cloud with mag, is expected to provide substantial obscuration of the extragalactic background light.
A dark nebula acts as a foreground screen that blocks the light along the line of sight (LOS) from stars and the background sky, including also the extragalactic background light (EBL). The attenuation of the EBL is strong towards the opaque central core while very little shadowing occurs in the transparent outer areas. Because the intensity of the the scattered starlight is higher than that of the EBL, the EBL has only a minor effect on the observed surface brightnesses. Previously, we have used medium-resolution spectroscopic observations of the surface brightness of LDN 1642 for a measurement of the EBL. This approach has enabled the scattered-light subtraction by means of the depths of strong Fraunhofer lines and the 4000 Å discontinuity in the integrated starlight (ISL) spectrum (Mattila et al., 2017b; Mattila & Väisänen, 2019). Based on these and other current results, the EBL would, however, make only a marginal effect on intermediate-band photometric observations, such as for LDN 1642 as in the present paper.
This paper is composed as follows. The observational data are briefly described in Section 2, while more details on methods and data reductions are given in Appendices A and B. In Section 3 we present the basic analysis and results, the extinction dependence of the intensity, colour and SED of the scattered light, from diffuse over translucent to opaque dust. In Section 4 we first discuss the reasons for the colour and SED variations in terms of the SED of the incident radiation field and the illumination geometry. We then compare our results for the LDN 1642 area with the colours of a cirrus/translucent cloud sample and some circumstellar AGB-star envelopes. Finally we ask whether the colours could be used to tell whether some of the diffuse plumes, apparently associated with a galaxy or a cluster, might actually be foreground cirrus features.
2 The data used for the analysis
2.1 Optical surface brightness data
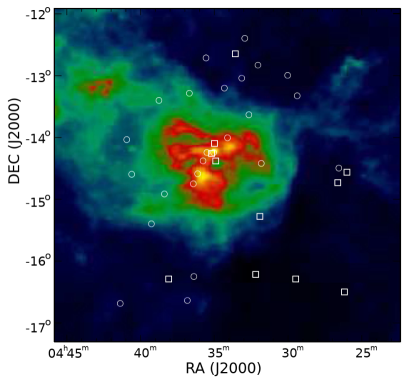
Our five-colour surface photometry covers an area of centered on LDN 1642. Within this area 35 selected positions with aperture , free of stars down to mag, were measured differentially relative to a standard reference position in the centre of the cloud. The area includes a wide range of dust environments, from the high opacity core with mag over translucent regions ( mag) to the cirrus-like outskirts with mag. Aided by its location at high galactic latitude, deg, and seen towards the anticentre, deg, and at a -distance of 65-100 pc (Hearty et al., 2000), the surroundings of LDN 1642 are relatively free of dust. The coordinates of the observed positions are given in table L1642_AV+5colour+titleNEW.txt and are shown in Fig. 1. (For the table, see Supporting information; for the VYSOS band image, see Mattila et al. (2018) Section 2.3 and Fig. 3).
The observations were carried out in five intermediate band filters, namely the standard (3500Å ), (4670 Å ) and (5550 Å ) Strömgren filters and two custom-made ones with centre wavelengths and FWHPs of 3840 Å (175Å ) and 4160 Å (140Å ). The latter two were tailored for measurement of the 4000 Å jump. The ESO 1-m and 50-cm telescopes at La Silla were used in parallel simultaneous observations; both telescopes were equipped with closely identical filters; the 50-cm telescope was used for monitoring the airglow variations.
The foreground surface brightness components were differentially removed: instrumental stray light from stars, the spatial gradients of airglow, tropospheric scattered light and zodiacal light. In addition, the emission from ionized gas was estimated and subtracted using H line measurements. Using the 200 m emission intensities the surface brightnesses were referred to a zero background intensity level in the following way: In each filter band the background intensity level was determined by means of a 3-dimensional fit where besides the coordinates R.A. and Dec. the third variable was . At small and moderate opacities is proportional to the dust column density; thus, by extrapolation to = 0 we were able to set the optical surface brightnesses to a system where their zero level corresponds to zero dust column density. For a detailed description of the surface brightness observations and reductions, see Väisänen (1994) and Appendix A.111The data reductions and analysis are largely based on the MSc thesis of P. Väisänen (Väisänen, 1994)
2.2 Optical extinction from photometry
Using 2MASS colour excesses of stars and the nicer method (Lombardi & Alves, 2001) we have derived extinctions for most of our positions, see Lehtinen et al. (2007). In the outer areas ( from centre) the extinctions were derived by using a FWHM Gaussian as weighting function for the extinction values of individual stars. In the inner areas ( from centre) where the extinction may change substantially over , FWHM was adopted. Because of the relatively low number density of 2MASS stars in the direction of L 1642 the extinction values had substantial statistical errors, ca. mag and mag for and FWHM, respectively.
The two highest opacity positions in the centre of the cloud have no 2MASS stars within from the position centre. For these two positions we have made use of and band photometry with ESO’s NTT/SOFI instrument. The mean extinction in a area encompassing the two positions was found to be mag. A detailed description is given in Appendix B.
2.3 Extinction and its zero point from 200 m absolute photometry
The ISOPHOT instrument (Lemke et al., 1996) aboard the satellite (Kessler et al., 1996) was used to observe the surface brightness positions in and around LDN 1642 in the absolute photometry mode at 200 m. The zero point of was corrected for a zodiacal emission (ZE) intensity of MJy sr-1 and a cosmic infrared background (CIB) of MJy sr-1 (Hauser et al., 1998). At time of the 200 m observations (1998-03-19/20) the longitude difference was (LDN 1642)-; the ZE intensity at 200 m was estimated using a 270 K blackbody fit to the ZE intensities at 100, 140 and 240 m. They were interpolated from the weekly DIRBE Sky and Zodi Atlas (DSZA)222https://lambda.gsfc.nasa.gov/product/…/dirbe_dsza_data_get.cfm maps based on the Kelsall et al. (1998) interplanetary dust distribution model. The sum of these two corrections amounted to MJy sr-1, in agreement with the value based on extrapolation of the vs Hi 21-cm relationship to zero Hi intensity (for the method see Juvela et al. 2009).
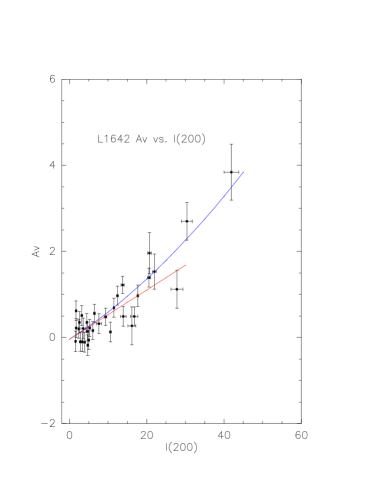
For low-to-moderate column densities the 200 m intensities are well correlated with the optical extinctions, , (see e.g. Lehtinen et al. 2007). A linear fit of values from 2MASS JHK photometry vs gave at 28 MJy sr-1 the relationship (see Fig. 2).
In spite of the substantial uncertainties of the 2MASS-based values the slope and the zero point of the relationship are obtained with good precision. The precision of of the values has been estimated using the intrinsic errors given by the ISOPHOT Interactive Analysis programme PIA (Gabriel et al., 1997) on the one, and the differences between adjacent low-intensity points in the LDN L1642 area on the other hand. These error estimates amounted to for each of the two methods. The above relation enables, thus, a precision of mag to be reached for the individual values; this is clearly better than that reached with 2MASS. Therefore, visual extinctions for our low-to-moderate extinction positions, mag, were determined using the 200 m observations as an intermediate step.
Because the zero point of the 200 m intensities has been corrected for ZE and CIB, also the resulting extinctions are free of these offsets and refer to the dust extinction only. The uncertainty of the CIB+ZE correction of MJy sr-1 and of the zero-level term of the vs. relationship of mag introduce a systematic zero-point error of mag to the whole set of values.
For the positions with 30 MJy sr-1 ( mag) the
points clearly deviate from the linear relationship (see Fig. 2). This is a well-known effect caused by
the decreasing heating power of the UV-optical-NIR radiation
towards the inner parts of an optically thick cloud (see e.g. Lehtinen et al. 2007).
For these positions
we have adopted the extinction values as they resulted from the 2MASS
and NTT/SOFI colour excesses of stars.
The observational material used in this analysis consists of the following data for 35 positions in the LND 1642 area:
(1) differential surface brightnesses in the five optical filter bands plus absolute surface
brightness at FIR 200 m, see table
Final2020JUL9N.txt;
(2) coordinates of the positions and extinction values for the five filter bands, see table
L1642_AV+5colour+titleNEW.txt.
The tables are given in Supplementary information.
For the locations of the 35 positions, see also Fig. 1.
3 Analysis and results
3.1 Scattered light intensity vs extinction
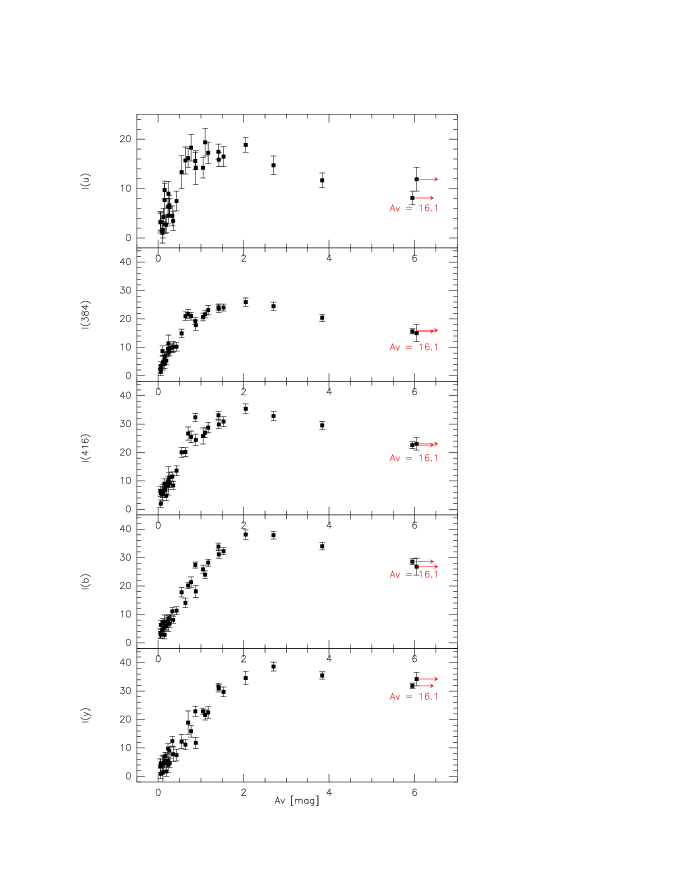
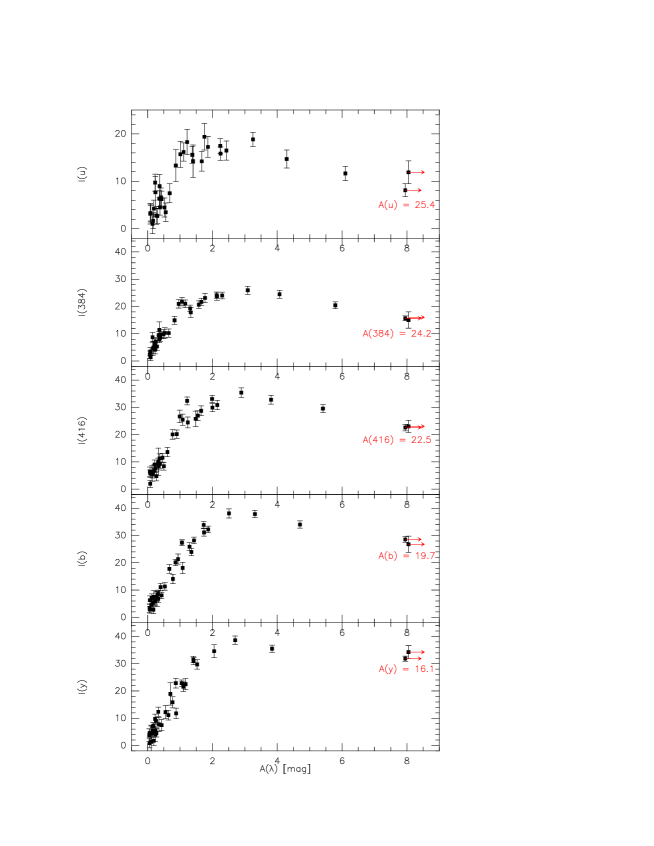
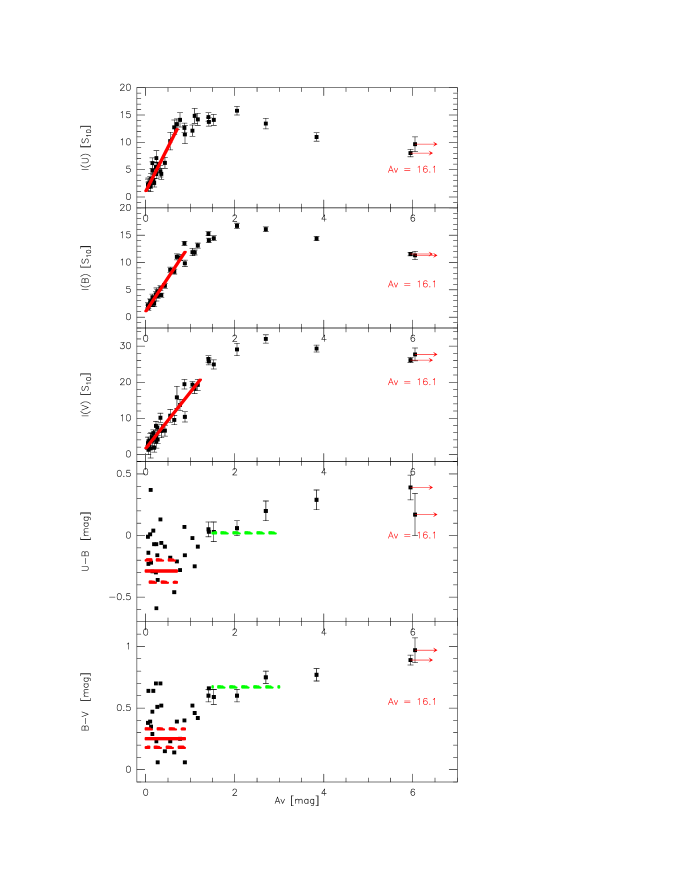
In Fig. 3 the scattered light intensities, , for the five filter bands from to are shown as function of . In Fig. 4 values of are shown as function of , that is the extinction for the wave band in question. By using the FIR absolute photometry at 200 m and its zero point we have been able to set the zero point also for the optical extinction, and .
For the darkest background positions in the outermost periphery of LDN 1642 the intensity range of is 1.7 to 5.2 MJy sr-1. Applying the vs relationship the mean value of extinction for these 16 positions is mag or mag; correspondingly, the mean of the scattered light intensities is erg cm-2s-1sr-1Å-1 . Although the observed surface photometry values are differential, representing the difference between on-cloud and off-cloud positions, the intensities in Figs. 3 and 4 are absolute values relative to zero dust column density as set by the 200 m absolute photometry.
As shown by Figs. 3 and 4 the general shapes of the vs extinction curves are very similar in all five bands, both for and as x-axis. There are, however, significant differences, as well. In Fig. 3 one sees that the maximum of the curve shifts in a systematic way from to mag when passing from the ultraviolet to the yellow band. The other parts of the curve are shifted correspondingly.
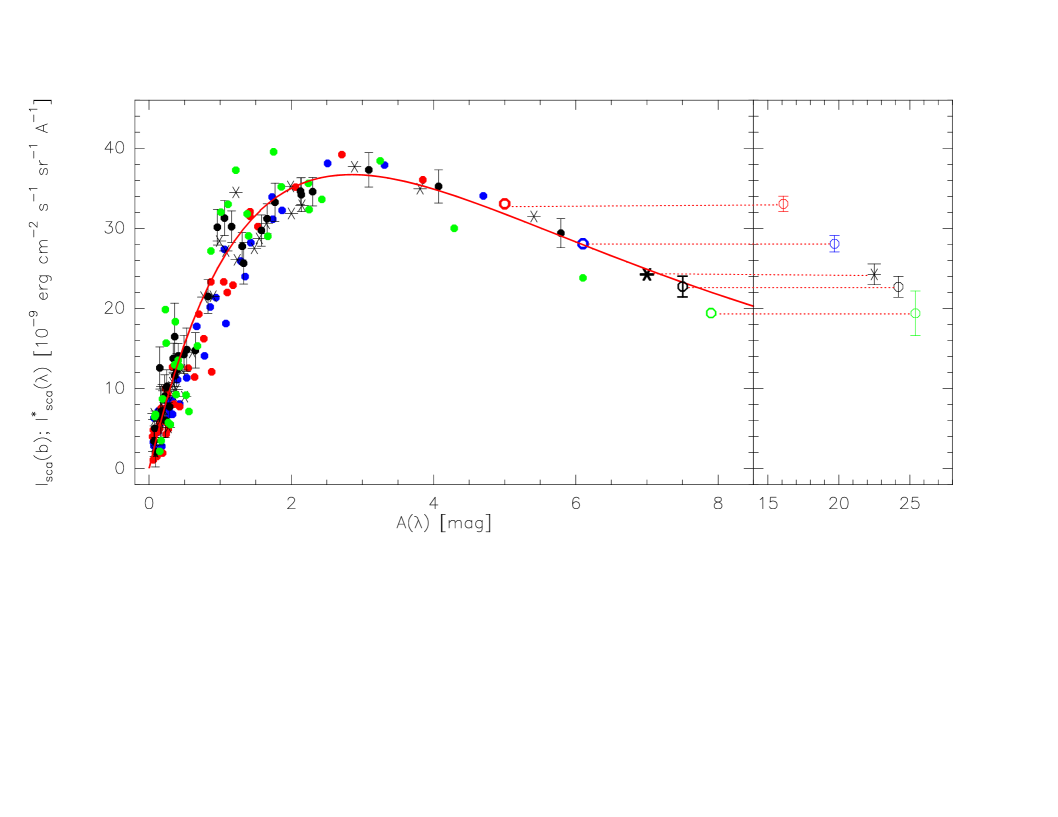
On the other hand, when using for each band its ’own’ extinction, , the maximum occurs at closely the same x-axis position, 2.5-3 mag (Fig. 4). This agreement between the different bands is even more clearly demonstrated by Fig. 5 where the data points vs have been overplotted in the same diagram. Here, the intensities have been adjusted by scaling factors so that an optimum agreement is obtained. These scaling factors mainly reflect the band-to-band differences of the illumination source, the ISRF of starlight in the Solar neighbourhood. To a lesser degree they also reflect the wavelength dependence of dust albedo; this is, however, only a smaller effect as compared to the ISRF. The dominance of the ISRF for the band-to-band differences is also demonstrated by the values of the scaling factors: there is an almost perfect agreement of the (inverse) scaling factors, 0.501 (), 0.726 (384 nm), 0.961 (416 nm), 1.000 () and 1.008 (), with the ISRF model spectrum; see Fig. 10 lower panel.
Considering the low surface brightnesses we are here dealing with, the precision of our vs and vs curves is remarkably good. This is demonstrated both by the good position-to-position agreement of the individual curves as shown in Figs. 3 and 4 as well as by the good band-to-band agreement as seen in Fig. 5.
The shape of the vs extinction curve is well understood. For it can be approximated by the ansatz:
| (1) |
where is a constant determined by the strength of the ambient starlight radiation field and is the albedo of the dust; the LOS optical depth is given by , where the extinction coefficients are according to the Cardelli et al. (1989) extinction law for . The second term describes the optically thin and the saturated part of the curve up to mag. The third term, , becomes effective only at larger optical depths, , and describes the slow decline beyond the maximum of the vs curve.
’Scattering-equivalent’ extinctions. When modelling the scattered light intensity at low and moderate opacities, , the same opacity accounts for both extinction and scattering, that is . This is not valid for the highest opacity positions in the core, however. In that case, the scattering is not determined by the total extinction through the dense core but by the dust shell around it, and . In Fig. 5 we demonstrate this concept: we have moved the dark-core data points to their best-fitting ’scattering-equivalent’ extinctions in the left-hand part of the diagram. A choice of mag and the corresponding values for the other bands, resulting from the Cardelli et al. (1989) extinction law, brings them to a good alignment with the mag data points.
A least-squares fit to the 384 nm data points was performed using equation (1) and the mpfitfun333www.physics.wisc.edu/graigm/idl/fitting.html fitting program. The resulting curve is shown as the red line in Fig. 5 and it is seen to be a good representation for the bands 416 nm, and as well. The curve for the band, on the other hand, deviates slightly from the other curves. When adjusted to the 384 nm ’standard curve’ at low and intermediate extinctions, mag, the band curve falls below the other curves at mag. A possible explanation for this is that, while the dust albedo over nm, both observations and modelling suggest that is lower in the band ( nm), see e.g. Mattila et al. (2018); Togi, Witt & St. John (2017); Hensley & Draine (2023). Scattered light from high-extinction sight lines, mag, has suffered multiple scatterings (and absorptions). At each scattering event the intensity is reduced by a factor of . The intensity of the scattered light escaping from the cloud is thus proportional to , where , the number of scatterings, increases with increasing optical depth . A smaller albedo in the -band thus causes the scattered light intensity at large optical depths to drop below the ’standard curve’. For numerical modelling results, see Mattila et al. (2018), Fig. A.2.
The different sections of the curve can be understood as follows:
(1) For low optical thickness, ,
increases linearly with the LOS dust column density; the slope is determined
by the product of the ambient starlight radiation field intensity, the albedo and the
extinction coefficient,
,
all of them being wavelength dependent. The observed slopes are given in Table 1.
(2) When the LOS reaches 2 to 3 magnitudes becomes saturated and levels off to a maximum intensity value which depends on the albedo and the ambient radiation field but not on the extinction.
(3) For still higher optical depths, mag, decreased slowly. This is due to the internal extinction and increasing number of multiple scatterings of photons off dust particles. Because the dust albedo is smaller than 1 () photons are increasingly being lost in every additional scattering event.
| Slope vs | Colour | |||
| (mag) | ||||
| (mag) | ||||
3.2 Colour of scattered light in diffuse, translucent and dense areas
The colours of the scattered light were calculated in two ways:
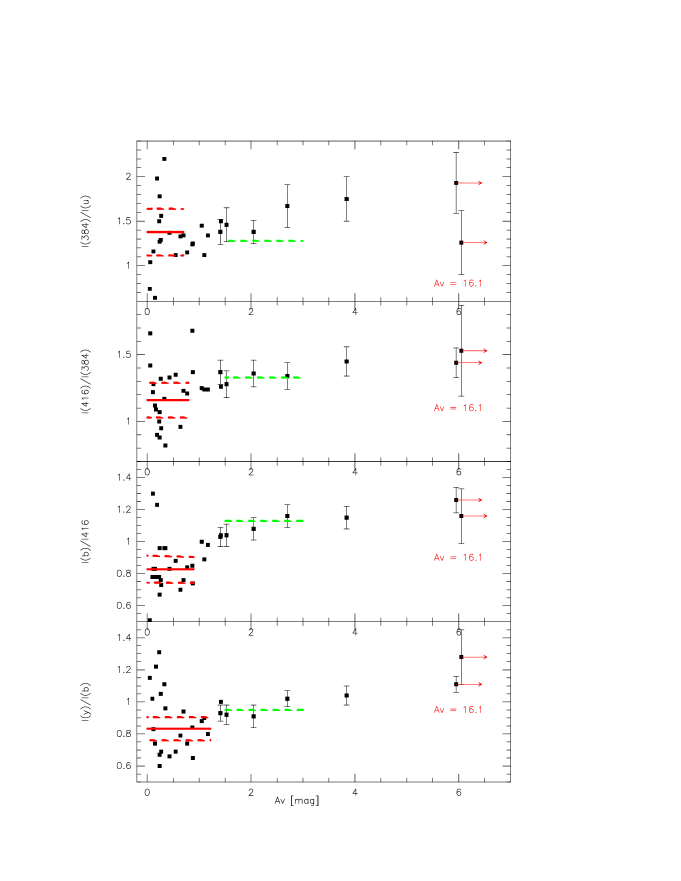
(1) for all 35 observed positions the intensity ratios and were calculated together with their statistical errors; they are plotted in Fig. 6.
(2) at low the relative errors of the ratios became disturbingly large; therefore, for the sample with mag, representing the ’diffuse dust’, the colours were derived from the slopes of vs relationships; they are given in Table 1. From these slopes we obtain the colours, etc, as given in the Table. They are also shown in Fig. 6 as the red horizontal bars, together with their error limits as dashed bars.
The broadband intensities can be composed as weighted sums of the
5-colour intensity values:
The 5-colour intensities are in erg cm-2s-1sr-1Å-1 and the resulting UBV intensities
in S10 units (see Mattila, Väisänen, & von Appen-Schnur 1996).
The resulting intensities together with the colour indices and are shown in Fig. 7. In the linear range at small optical depths the slopes were again determined and used to derive the colour indices mag, and mag, as given in Table 1. They are also shown in Fig. 7 as the red horizontal bars together with their errors limits as dashed bars.
The observed colours from both the five-band as well as the photometry follow, qualitatively, the
same trends:
(1) at small and moderate optical depths, mag, representative of cirrus and
diffuse dust areas the colours are at the blue end of their range; with increasing they turn redder
up to mag;
(2) in the translucent dust range, mag, the colours reach saturation values which
change only little over this range; this reflects the behaviour of the vs curves
which also reach their saturation (and maximum) level in this range (see Fig. 3);
(3) moving towards the dense/opaque dust dust areas, mag, the colours continue to redden,
though very slowly in most cases.
The background light in the interstellar space outside our solar system is dominated by starlight scattered off interstellar dust along the LOS. Our results in the LDN 1642 area demonstrate that, depending on the LOS dust opacity, the background can assume a colour from a wide range of values.
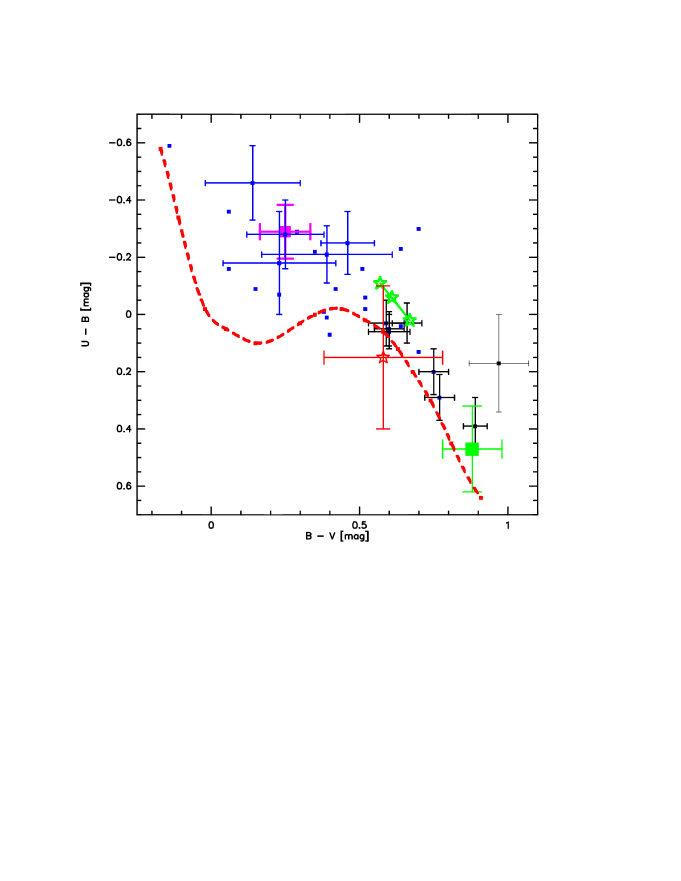
A convenient way to demonstrate this further is by means of the versus Colour-Colour diagram, commonly used for illustration of the colours of stars. We have plotted in Fig. 8 the vs values of all our observed positions in the LDN 1642 area. The black dots with error bars are for positions with S10 ( mag); the blue dots with error bars are for S10 ( mag ); the blue dots without error bars are for positions with S10 ( mag); these are positions for which the colours of individual positions cannot be accurately derived. The magenta square with error bars corresponds to the colours derived from the slopes for mag.
The three green asterisks indicate the colours of integrated starlight derived using a synthetic model of the local Galactic environment (Mattila, 1980a, b; Lehtinen & Mattila, 2013); the ’observer’ is at pc, corresponding to the location of LDN 1642; the asterisks from upper left to lower right indicate the values for the northern Galactic hemisphere (), the whole sky, and the southern hemisphere (). For comparison, also the location of the main sequence of stars is schematically indicated with red dashed curve. The colours of the mean integrated starlight for are also shown in Fig. 7 by the dashed green lines. The red asterisk with error bars indicates the colours of the carbon star envelope IRC +10216 (Mauron, de Laverny, & Lopez 2003, and Mauron 2022, private communication). These comparisons, along with others, will be discussed in section 4.1.
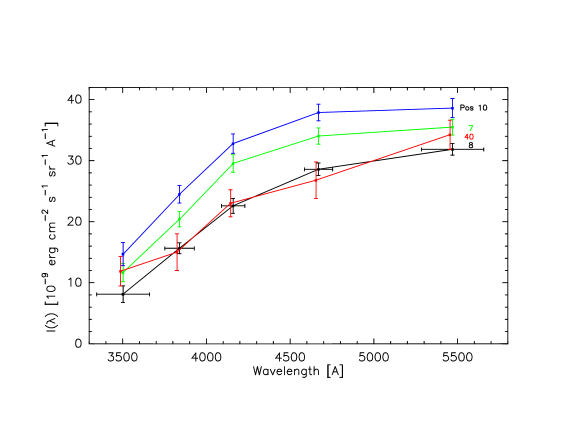
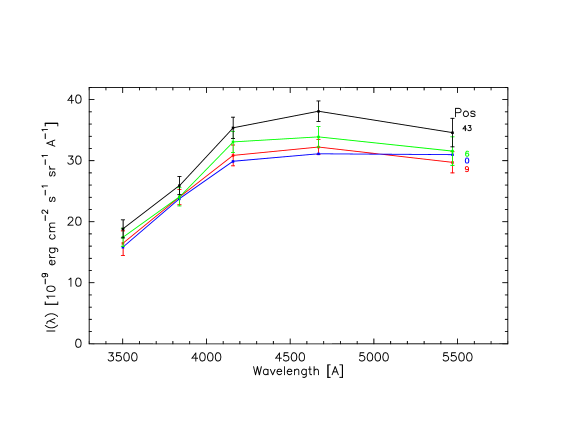
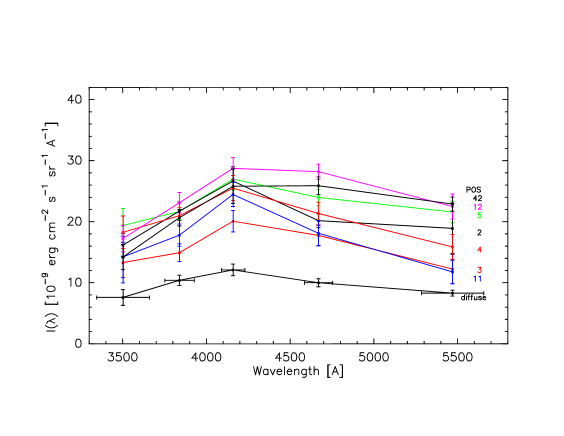
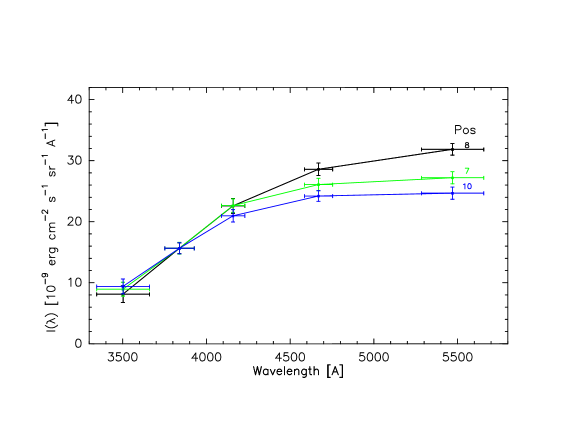
3.3 Spectral energy distributions of scattered light
Based on our five-colour photometry we present in Fig. 9 spectral
energy distributions, vs , over the wavelength range nm.
Three groups of SED’s are shown; they cover four LOS extinction ranges:
(1) positions 7, 8 10 and 40 with
mag (top panel);
(2) positions 0, 6, 9 and 43 with mag (middle panel); and
(3) positions 2, 3, 4, 5, 11, 12, and 42 with mag (bottom panel).
(4) In addition, the SED for low-opacity diffuse dust is shown in the bottom panel. In this case,
instead of using individual positions, the SED is based on the slopes of the vs
relations (see Table 1).
The values have been scaled to erg cm-2s-1sr-1Å-1 .
A qualitative look at the SEDs shows a systematic behaviour: the SED’s become increasingly redder as the LOS extinction increases.
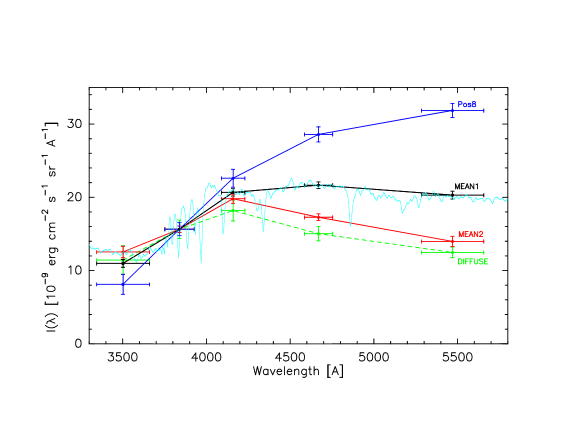
In Fig. 10 upper panel we compare the SEDs for the three high-opacity positions which have been normalized to the value of Pos 8 at 384 nm. For the lower-opacity positions we show in Fig. 10 lower panel averages of the SEDs for two groups, mag and mag, which are designated as MEAN1 and MEAN2. (see Fig. 9). Also shown are the statistical errors, calculated from the errors of the individual SEDs included in each mean. For comparison, we show also the SEDs for Pos 8 and the diffuse dust. The spectrum of the ambient integrated starlight radiation field is shown as the blue dotted line; it is the synthetic spectrum, mean over the sky, as calculated for an observer’s location 50 pc off the Galactic plane (see Lehtinen & Mattila 2013). It is seen to agree closely with the SED of MEAN1.
As demonstrated by Fig. 10 the shape of the SED is influenced by the LOS extinction. For a given position, the cloud’s optical thickness decreases towards longer wavelengths. Thus, for the small optical depth positions with , the scattered light intensity decreases towards longer wavelengths. On the other hand, for large-optical-depth positions with , becomes saturated at shorter wavelengths while it still is on the increasing branch at the longer wavelengths.
In the presence of a surface brightness contribution from beyond the cloud, such as the EBL, another effect will enter that influences the SED. For a wavelength slot where has a strong discontinuity, such as the 4000 Å break, the observed SED is expected to differ from the scattered light SED in a marked way. This effect can be partly the reason for an increase of the 4000 Å jump with increasing extinction (see Figs. 6 and 10).
4 DISCUSSION
4.1 Intensity and colour of scattered light in LDN 1642
The vs curves as shown in Figs. 3, 4, 5 and 7 are characterized by the three sections: linear rise at mag, saturation and maximum at mag, and a slow decrease toward higher extinctions at mag. This curve form is physically well understood and has been discussed already in Mattila (1970) and de Vries & Le Poole (1985). First part: cloud is optically thin whereby is proportional to the LOS optical depth; second part: the cloud is becoming optically thick; third part: the impinging photons experience multiple absorption/scattering events before escaping from the cloud, causing decrease of the surface brightness.
This surface brightness distribution corresponds also to the structure seen in globules (Witt, Oliveri & Schild, 1990; FitzGerald, Stephens & Witt, 1976): a dark core coinciding with the opacity maximum, a bright regular rim with elliptical or spherical shape at a LOS opacity of 2; and a gradually falling, optically thin outer halo. The angular size of the bright rim increases towards longer wavelengths, corresponding to the outwards shift of the maximum with increasing wavelength, as seen in Fig. 3.
For a quantitative modelling of the vs curves the two basic input ingredients are the impinging Galactic radiation field, and a radiative transfer code including multiple scattering. Dust grain models with given scattering properties, characterized by the albedo and the asymmetry parameter of the scattering function (Henyey & Greenstein, 1941), can then be tested against the observations. Such modelling results, based partly on the same photometric data as in this paper, have already been presented for LDN 1642 (Laureijs, Mattila, & Schnur, 1987; Mattila et al., 2018). The results indicate that , depending on the adopted value of in the range 0.6 - 0.8.
In Table 2 the mean values of the colours and are given for five extinction slots in the LDN 1642 area, ranging from cirrus ( mag) up to dense areas ( mag). The individual positions are also shown in Fig. 7. There is a clear trend, seen both in the table as well as in Fig. 7, indicating that the colours become systematically redder with increasing extinction.
In Fig. 8
the colours have been plotted in the conventional vs Colour-Colour diagram.
The diffuse dust positions (blue dots) have blue colours and are located in the upper left hand section whereas the
translucent and high-opacity positions (black points with error bars) have red colours and are located
in the lower right hand section of the diagram.
For reference, also the location of the main sequence for stars is shown as the dashed red curve.
4.1.1 Colour of the radiation field and the illumination geometry
The interstellar radiation field (ISRF) of the Solar neighbourhood is a composite of the light of common stars and is dominated by the spectral types A to F. We use the synthetic spectrum of integrated starlight as presented in Mattila (1980a, b); Lehtinen & Mattila (2013). Full range of spectral types and a clumpy interstellar dust distribution were included in the model. The location of the ’observer’ was put at pc corresponding to the location of LDN 1642. The resulting mean colours over the entire sky were , ; they are indicated with the middle green asterisk in Fig. 8; the upper and lower asterisks are for the northern and southern hemispheres, respectively.
In addition to the synthetic starlight models, the colour of the impinging ISRF has been evaluated
also by using the and band background starlight mapping, carried out by
the Pioneer 10 and 11 space probes at heliocentric distance of 3 – 5 A.U. (Weinberg et al., 1974; Toller, 1981).
All-sky maps have been published by Gordon et al. (1998); see also his web page444
http://www.stsci.edu/~kgordon~
pioneer_ipp/Pioneer_10_11_IPP.html.
We have adopted from this web page the data files ‘Reformated data with all stars’ which,
according to the README file, “give the measurements *including* all the stars”,
that is, the stars brighter than subtracted by Toller (1981) have been returned.
In order to mimic the illumination geometry for a dust cloud observed in the direction we have determined the average and band background intensities in and around the direction . We used a virtual telescope with an ‘instrumental beam’ given by the Henyey-Greenstein scattering function for . This beam has a FWHP of . After transforming Pioneer colour to the standard photometric system, the colour of the Milky Way background starlight in the direction of LDN 1642 was found to have the value , in good agreement with the all-sky colour estimate derived from the synthetic model. In Table 2 this value towards LDN 1642, together with values for other cloud directions, is given in column (7).
4.1.2 Scattered light colour depends on dust column density
The colours of the translucent dust with mag are seen to best agree with the ISRF colours (Figs. 6 and 7). This is because the curves become saturated at mag and then, according to equation (1), the intensities are given by . For a constant albedo, , the scattered-light colours will agree with the colours of the ISRF.
In the range mag, that is for diffuse/cirrus dust, the scattered light
intensity can, according to equation (1), be expressed as
where
the LOS layer thickness does not depend on . Assuming a constant albedo,
the colours of the diffuse/cirrus dust will be given by:
and
.
For the standard extinction law according to Cardelli et al. (1989) with =3.1,
and , and
the and colour indices will be shifted by -0.18 and -0.31 mag relative to the ISRF values.
As seen from Fig. 8, this amount of bluening is to a good approximation indeed the case
for the observed colours of the diffuse/cirrus dust.
The positions with large extinctions, mag, as displayed in Figs. 7 and 8, show reddening relative to the ISRF colours, both in and . Similarly as the bluening in the cirrus areas this reddening can qualitatively be explained in terms of the dust extinction law: While the (normalized) vs curves as shown in Figs. 4 and 5 are almost indistinguishable, there are distinct differences when using the wavelength-independent optical depth indicator as the x-axis, see Figs. 3, 7. According to Fig. 7 the vs curve has its maximum at mag. Correspondingly, the maximum in the B band occurs at mag, which according to the standard extinction law (Cardelli et al., 1989) corresponds to mag. This is also confirmed by Fig. 7. Beyond this point the curve starts to drop whereas the still continues to rise up to mag; and, all the way beyond this maximum point its decline lags behind the more rapidly dropping curve. This obviously leads to the increase of the colours, and the same is happening with . Unlike for the bluening in the case of cirrus dust, the amount of the reddening cannot be readily derived from the extinction law alone.
| Cloud | 555Milky background starlight colour from Pioneer 10/11 maps, averaged with ’dust scattering beam’ or over a area | Ref. | |||||
| (1) | (2) | (3) | (4) | (5) | (6) | (7) | (8) |
| Dark and translucent clouds | |||||||
| LDN 1642 | 211.0 | -36.5 | 0.0-1.0 | 0.61 | 1 | ||
| 0.55-0.88 | 0.61 | 1 | |||||
| 1.05-1.17 | 0.61 | 1 | |||||
| 1.41-1.53 | 0.61 | 1 | |||||
| 2.05-3.84 | 0.61 | 1 | |||||
| Draco Nebula | 90.0 | 39.0 | b | b | 0.79 | 2 | |
| LDN 1780 | 359.0 | 37.5 | 666using vs slopes | 0.89 | 2 | ||
| MBM 25 | 173.8 | 31.5 | 0.9 | 0.72 | 5 | ||
| MBM 30 | 142.2 | 38.2 | 0.5 | 0.75 | 5 | ||
| MBM 32 | 147.2 | 40.7 | 0.6 | 0.75 | 5 | ||
| MBM 41A (=Draco Nebula) | 90.0 | 39.0 | 0.6 | 0.79 | 5 | ||
| MBM 41D | 92.3 | 37.5 | 0.5 | 0.79 | 5 | ||
| Ring Nebula | 183.3 | 25.1 | 0.71 | 6 | |||
| Virgo/NGC4435 plume | 280.2 | 74.9 | 0.5 - 0.75 | 0.78 | 3 | ||
| Thumbprint bright rim | 302.6 | -15.9 | 777estimated from map of Kainulainen et al. (2007) | 0.78 | 4 | ||
| Widely distributed cirrus | |||||||
| SDSS cirrus | 888estimated from Fig. 4 in Brandt & Draine (2012) | 0.86 | 9 | ||||
| -90…+90 | e | 0.94 | 9 | ||||
| SDSS Stripe82 | 0.2 - 0.4 | 999using Cook et al. (2014) colour transformations from SDSS to Johnson-Cousins photometry for nearby galaxies | 0.86101010for | 10 | |||
| 0.4 - 1.3 | f | 0.68111111for | 10 | ||||
| Dust envelopes of AGB stars | |||||||
| IRC+10216 | 221.4 | 45.1 | 0.72 | 11 | |||
| IRAS16029-3041 | 345 | 16 | 1.00121212corrected for foreground reddening using http://ned.ipac.caltec.edu | 0.94 | 11 | ||
| IRAS17319-6234 | 330 | -16 | 1.06h | 0.89 | 11 | ||
References: (1) this paper; (2) Mattila et al. (2018); (3) Rudick et al. (2010); (4) FitzGerald, Stephens & Witt (1976);
4.2 Comparison with a cirrus/translucent cloud sample
To compare with LDN 1642, we have collected in Table 2 colour data for a sample of diffuse and translucent clouds. All but one of these clouds are at high galactic latitudes, . Besides , also the colours are available in a few cases.
For Draco Nebula and LDN 1780, the colours were determined using slopes fitted to vs curves in the diffuse dust domain, mag. For the sample of five MBM catalogue clouds the values are based on the mean surface brightnesses in two bands, and , averaged over several positions in each cloud (Witt et al., 2008). The corresponding mean extinction, column (4), puts them into the optically thin dust domain, as well. The TPN bright rim represents a case with a clearly larger optical depth. From deep band photometry Kainulainen et al. (2007) found that the bright rim follows approximately the mag extinction contours. The TPN rim can, therefore, be compared with the translucent dust areas in LDN 1642.
We have included in Table 2 two wide-field studies of high-galactic-latitude diffuse/cirrus clouds (Brandt & Draine, 2012; Román, Trujillo & Montes, 2020). They are both based on archival Sloan Digital Sky Survey (SDSS) data.
The colour of the scattered light from a dust cloud depends on the colour of the ISRF light impinging on it. Since all the clouds, except perhaps for the Draco Nebula (= MBM 41D), are nearby, they are embedded in the Solar neighbourhood ISRF. Because of the forward-throwing scattering function of the dust grains their received illumination depends on the direction in which the cloud is seen. Using the Pioneer 10/11 data base we have calculated for each cloud the colour of the background starlight, , which is taken to be the average over a 25°diameter area of the Milky Way, centered on , the direction of the cloud. The values are given in column (7). For the two wide-field cirrus surveys, mean values corresponding to their sky coverage have been estimated.
Are there any general trends to be seen in the colours? One expects that the clouds become redder towards the Galactic centre where the contribution by the red central bulge increases (Toller, 1981). To test this trend there is one cloud, LDN 1780, that is located at . It is, indeed, substantially redder () than its anti-centre counterparts LDN 1642 (), MBM 25 () and Ring Nebula (). Also the SDSS cirrus data of Brandt & Draine (2012) show this effect: towards the central section () as compared to for the stripe at over all longitudes.
The colours of the ’SDSS cirrus’ and the ’SDSS Stripe 82’ appear to behave similarly as the optically thin dust in LDN 1642, that is, is smaller than .
4.3 Comparison with circumstellar envelopes of AGB-stars
High mass-loss rates of some asymptotic giant branch (AGB) stars have created around them extended envelopes of gas and dust that completely obscure the central star in the optical. Such envelopes are externally illuminated by the Galactic radiation field. The best known object in this class is IRC +10216 (Mauron, de Laverny, & Lopez, 2003); currently, some 20 such envelopes are known (Mauron & Huggins 2006; Mauron, Huggins & Leung 2013).
We have listed in Table 2 three AGB envelopes for which the colours have been determined. IRC +10216, for which also the colour is known (Mauron, de Laverny, & Lopez, 2003), is marked with a red asterisk in Fig. 8; its colours agree with the local ISRF model and with LDN 1642 in the range mag. Like LDN 1642 and the other clouds in Table 2, IRC +10216, with its distance of 120 pc, is exposed to the local ISRF.
The two other AGB stars, IRAS16029-3041 and IRAS17319-6234, are more distant, at 1900 pc and 1200 pc, respectively. Being located towards the Galactic bulge direction these two objects are exposed, like LDN 1780, to a radiation field redder than the other objects in the sample. Their red colours, = 1.0 and 1.06 mag, may partly reflect this radiation field property. Their colours are redder than the Milky Way background starlight colours of = 0.94 and 0.89, which is as expected for an optical thickness of .
The difference in colour between the IRAS16029-3041 and IRAS17319-6234 envelopes on one side, and IRC +10216 on the other, may also reflect the difference of their dust compositions. The first two have silicate dust while for IRC +10216 the dust is carbon rich.
The illumination geometry of IRAS16029-3041 and IRAS17319-6234 differs from the other objects in our sample: because of their large -distances of 520 and -330 pc they are located outside of the Galactic layer of young stars and dust. From their vantage points they ’see’ a wider Galactic area than the local clouds do. Because of the forward-throwing scattering function of dust they scatter toward us mostly light from the outer Galactic disk and halo, substantially redder than the inner disk. Another, intriguing factor is that these two AGB stars ’see’ the bright and red light from the Galactic central area, un-obscured by the massive intervening extinction that prevents our view. They scatter light from the Galactic centre toward us at the favorably small scattering angles of and , respectively. This view is supported also by the finding of Mauron, Huggins & Leung (2013) that these two envelopes have the highest band surface brightnesses in their whole sample, namely 23.8 and 23.9 mag/, respectively.
Another reason for the higher surface brightness of the IRAS16029-3041 and IRAS17319-6234 envelopes may well be their location closer to the Galactic centre, at 6.2 and 7 kpc, where the ISRF is expected to be enhanced relative to the local ISRF at kpc (see Mauron, Huggins & Leung 2013 section 4.1.2 and Fig. 9).
4.4 Extragalactic debris or Galactic foreground cirrus: can optical colours decide?
Occasionally a low-surface-brightness plume appears to be associated with a galaxy or is seen towards ’empty’ space in a cluster or a group of galaxies. Then, the question arises whether it is an accumulation of unresolved stars stripped off a galaxy or just a randomly located foreground cirrus cloud in the Solar neighbourhood.
A classical example is Arp’s Loop associated with M 81 (Arp, 1965). Recent far infrared observations with Spitzer/MIPS (Sollima et al., 2010) and Herschel (Davies et al., 2010) strongly suggest an interpretation as part of the Galactic cirrus structures that are prominently present in the M 81/M 82 area (Barker et al., 2009; Sun et al., 2005). Not all regions in sky are covered by high-resolution far-IR observations. In such cases optical colours of the plume may offer a viable alternative (see, e.g. Román, Trujillo & Montes 2020).
Morphologically similar loops, apparently associated with the nearby galaxies, have been detected (Martínez-Delgado et al., 2023). The nature of the stellar stream around NGC 5907 (Shang et al., 1998) is well established as debris of a tidally disrupted globular cluster or a minor galaxy (Laine et al., 2016). For the brightest eastern section of the stream the colour is mag (Laine et al. 2016; van Dokkum et al. 2019) corresponding to (Jester et al., 2005). A ’simple stellar populations’ model predicts the colours and (Laine et al., 2016). The position in the vs diagram in Fig. 8 is shown as a green square.
As discussed in section 4.1.2 above and demonstrated also by Fig. 8, the colour of a local Galactic dust cloud can be predicted in two steps: (1) get the colour of the Milky Way background starlight in the direction of the cloud, and ; (2) estimate the optical depth of the cloud; assuming that it is a cirrus cloud, mag, the colours are predicted to be by and mag bluer in and , respectively; this bluening makes the cirrus colours sufficiently different from the expected colours of galactic loops or intra-cluster patches which mostly consist of old stellar population. More seldom, a foreground cloud would fall into the optically thick domain, mag. In such a case its colours would be similar or even redder than and ; then the colour test would not help to discern it from an extragalactic light patch consisting of old stellar population stars.
This ’litmus test’ does not take into account that the dust scattering properties may differ from one cirrus cloud to another in the local Galaxy. In view of the relatively constant and predictable colours as compiled in Table 2, this does not appear a strong drawback, however.
5 Summary and conclusions
For an observer beyond the zodiacal dust cloud the sky background light is dominated by the diffuse Galactic light (DGL), that is the scattered light off interstellar dust particles illuminated by the combined radiation of Galactic stars (integrated starlight, ISL) plus contributions by ionized gas. The DGL covers the entire sky with a wide range of different environments, from optically thin cirrus dust over translucent to completely opaque dark clouds.
In the present paper we have studied the intensity and colour of the scattered light from dust in a representative high-galactic-latitude area towards a low-extinction direction in the Galactic anti-centre. The area contains the opaque cloud core of LDN 1642 ( mag) and its translucent periphery ( mag), and an area around it with typical diffuse cirrus dust with mag. Surface brightness was measured at 35 positions in five intermediate band filters covering the wavelength range 3500 - 5500 Å . Because of the large size, , of the area covered, methods were developed for the elimination of airglow and zodiacal light gradients. Time variations of airglow were corrected for by using simultaneous measurements with a monitor telescope in parallel with the main telescope (Appendix A). The extinction was determined by setting up the scaling with 2MASS colour excesses, and by using dedicated 200 m absolute photometry measurements for improving its precision and for setting the extinction zero point. In the cloud core deep dedicated photometry was used (Appendix B).
The basic observational results are the following: The intensity of the scattered light, , depends on dust column density in a characteristic way: For optically thin dust the intensity first increases linearly for mag, then turns to a saturation value at mag; at still larger extinctions, mag, the intensity turns down to a slow, approximately linear decrease. The value of the intensity maximum shifts in a systematic way from mag at 3500 Å to mag at 5500 Å (see Fig. 3).
Instead of using as the common column density measure for all five wave bands, we can alternatively use for each wave band its ’own’ extinction, . In this case all five vs curves are closely similar (see Figs. 4); their maxima now occur at closely the same same wavelength-specific extinction, mag; after multiplication by a suitable scaling factor all curves are brought to a close agreement with the others (see Fig. 5).
The vs curves offer a straight-forward explanation for the behaviour of the scattered-light colours as function of . The colour of the scattered light depends, naturally, in the first place on the ISRF colour. For a wavelength-independent albedo the colour at the peak of the curve agrees with the ISRF colour. At the low-column-density side of it the scattered light is bluer and at the high-column density side redder than the ISRF (Figs. 6-7). These colour changes are a direct consequence of the wavelength dependence of the extinction. Fig. 8 illustrates the extinction dependence of the scattered light colour by means of the conventional vs Colour-Colour diagram.
We have compared the colours of scattered light in the LDN 1642 area with the and colours obtained in a number of other relevant observational studies: a sample of high-latitude diffuse/translucent clouds; two wide-field studies of high-latitude cirrus dust; and three AGB star envelopes externally illuminated by the ISL radiation field (see Table 2).
Besides being an interesting observational resource for interstellar dust studies, the cirrus/DGL is an unwanted foreground contaminant for extragalactic low-surface-brightness sources. Its elimination is crucial especially for objects like outskirts of galaxies, intra-cluster light, or the extragalactic background light. Our results for the colours of diffuse/cirrus dust suggest that optical colours can be useful to distinguish cases where a diffuse plume or stream, apparently associated with a galaxy or a group or cluster, is more likely a local cirrus structure.
Data availability statement
The data underlying this article are available in the article and its online summplementary material as specified in the Supporting information section.
References
- Arp (1965) Arp, H., 1965, Science, 148, 363
- Barker et al. (2009) Barker, M. et al., 2009, AJ, 138, 1469
- Beckers (1995) Beckers J. M., 1995, in International Symposium on the Scientific and Engineering Frontiers for 8 - 10 m Telescopes, p. 303
- Boumis et al. (2001) Boumis, P., Dickinson, C., Meaburn, J. et al. , 2001, MNRAS, 320, 61
- Brandt & Draine (2012) Brandt,T. D., Draine, B. T., 2012, ApJ , 744, 129
- Cardelli et al. (1989) Cardelli, J. A., Clayton, G. C., & Mathis, J. S. 1989, ApJ , 345, 245
- Cook et al. (2014) Cook, D. O. et al., 2014, MNRAS 445, 890
- Davies et al. (2010) Davies, J.I., Wilson, C.D., Auld, R., Barlow, M.J., Bendo, G.J. et al., 2010, MNRAS, 409, 102
- de Vries & Le Poole (1985) de Vries, C.P., Le Poole, R.S., 1985, A&A, 145, L7
- FitzGerald, Stephens & Witt (1976) FitzGerald, M.P. Stephens, T.C. & Witt, A.N. 1976, ApJ 208, 709
- Gabriel et al. (1997) Gabriel, C., Acosta-Pulido, J., Heinrichsen, I., et al., 1997 in Proc. of the ADASS VI conference, ed. G. Hunt, & H.E. Payne, ASP Conf. Ser., 125, 108
- Gordon et al. (1998) Gordon, K. D., Witt, A. N., & Friedmann, B. C. 1998, ApJ , 498, 522
- Hauser et al. (1998) Hauser M. G., Arendt, R. G., Kelsall, T. et al., 1998, ApJ, 508, 25
- Hearty et al. (2000) Hearty T., Fernández M., Alcalá J. M., Covino E., Neuhäuser R., 2000, A&A, 357, 681
- Hensley & Draine (2023) Hensley, B. S., Draine, B. T., 2023, ApJ, 948, 55
- Henyey & Greenstein (1941) Henyey, L. G., & Greenstein, J. L. 1941, ApJ , 93, 70
- Hg et al. (2000) Hg, E., et al., 2000, A&A, 355, L27
- Jester et al. (2005) Jester, S., Schneider, D.B., Richards, G.T.,2005, AJ, 130, 873
- Juvela et al. (2009) Juvela M., Mattila K., Lemke D., Klaas U., Leinert C., Kiss C., 2009, A&A, 500, 763
- Kainulainen et al. (2007) Kainulainen, J., Lehtinen, K., Väisänen P., Bronfman, L., Knude, J., 2007, A&A, 463, 1029
- Kelsall et al. (1998) Kelsall, T., Weiland, J. L., Franz, B. A. et al., 1998, ApJ, 508, 44
- Kessler et al. (1996) Kessler M. F., et al., 1996, A&A, 315, L27
- King (1971) King I. R., 1971, PASP, 83, 199
- Kurucz et al. (1984) Kurucz R. L., Furenlid I., Brault J., Testerman L., 1984, Solar Flux Atlas from 296 to 1300 nm
- Laine et al. (2016) Laine, S., Grillmair, C. J., Capak, P., et al., 2016, ApJ , 152, 72
- Laureijs, Mattila, & Schnur (1987) Laureijs R. J., Mattila K., Schnur G., 1987, A&A, 184, 269
- Lehtinen et al. (2007) Lehtinen K., Juvela M., Mattila K., Lemke D., Russeil D., 2007, A&A, 466, 969
- Lehtinen & Mattila (2013) Lehtinen K., Mattila K., 2013, A&A, 549, A91
- Lemke et al. (1996) Lemke D., et al., 1996, A&A, 315, L64
- Lombardi & Alves (2001) Lombardi M., Alves J., 2001, A&A, 377, 1023
- Martínez-Delgado et al. (2023) Martínez-Delgado, D. Cooper, A.P., Román, J. et al., 2023, A&A, 671, A141
- Mattila (1970) Mattila, K. 1970, A&A, 8, 273
- Mattila (1980a) Mattila K., 1980a, A&A, 82, 373
- Mattila (1980b) Mattila K., 1980b, A&AS, 39, 53
- Mattila, Väisänen, & von Appen-Schnur (1996) Mattila K., Väisänen P., von Appen-Schnur G. F. O., 1996, A&AS, 119, 153
- Mattila et al. (2007) Mattila, K., Juvela, M., Lehtinen, K., 2007, ApJ , 654, L 131
- Mattila et al. (2017a) Mattila K., Lehtinen K., Väisänen P., von Appen-Schnur G., Leinert C., 2017a, MNRAS, 470, 2133
- Mattila et al. (2017b) Mattila K., Väisänen P., Lehtinen K., von Appen-Schnur G., Leinert C., 2017b, MNRAS, 470, 2152
- Mattila et al. (2018) Mattila K., Haas, M., Haikala, L., Lehtinen K., Leinert C., Väisänen P., 2018, A&A, 617, A42
- Mattila & Väisänen (2019) Mattila K. & Väisänen P., 2019, Contemp. Phys.60, 23
- Mauron, de Laverny, & Lopez (2003) Mauron N., de Laverny,P., Lopez B., 2003, A&A, 401, 985
- Mauron & Huggins (2006) Mauron N., Huggins, P.J., 2003, A&A, 452, 257
- Mauron, Huggins & Leung (2013) Mauron N., Huggins, P.J., Cheung, C.-L., 2013, A&A, 551, A110
- Mihos et al. (2017) Mihos, J. C., Harding, P., Feldmeier, J. et al., 2017, ApJ 834, 16
- Ochsendorf et al. (2015) Ochsendorf, B.B., Brown, G.A., Bally, J., Tielens, A.G.G.M., 2015, ApJ, 808, 111
- Reynolds, Haffner & Madsen (2002) Reynolds,R.J., Haffner, L.M.,& Madsen, G.J. 2002, in ASP Conf. Ser. 282, 31
- Rudick et al. (2010) Rudick, G. S., Mihos, J. C., Harding, P., Feldmeier, J., Janowieck, S., Morrison, H., 2010, ApJ, 720, 569
- Román, Trujillo & Montes (2020) Román, J.; Trujillo, I.; Montes, M., 2020, A&A, 644, A42
- Shang et al. (1998) Shang,Z., Zheng, Z. & Brinks, E., et al., 1998, ApJL 504, L23
- Sollima et al. (2010) Sollima, A., Gil de Paz, A., Martinez-Delgado, D. et al., 2010, A&A, 516, A83
- Sun et al. (2005) Sun, W.H. et al., 2005, ApJ, 630, L133
- Togi, Witt & St. John (2017) Togi, A., Witt, A. N., & St. John, D., 2017, A&A, 605, A99
- Toller (1981) Toller, G. N. 1981, Ph.D. Thesis, SUNY Stony Brook
- Román, Trujillo & Montes (2020) Román, J., Trujillo, I., Montes, M., 2020, A&A 644, A42
- Väisänen (1994) Väisänen, P., 1994, Ekstragalaktinen taustavalo – havainto pimeän sumun menetelmällä sekä malli galaksien yhteenlasketusta säteilystä, MSc Thesis, University of Helsinki
- Valls-Gabaud, Trujillo & Okamoto (2019) Valls-Gabaud,D., Trujillo, I. & Okamoto, S., eds., 2019, IAU Symposium No. 355, The Realm of Low-Surface-Brightness Universe, in prep.
- van Dokkum et al. (2019) van Dokkum, P., Gilhuly, C., Bonaca, A. et al., 2019, ApJ,
- Weinberg et al. (1974) Weinberg, J. L., Hanner, M. S., Beeson, D. E., DeShields, L. M., II, & Green, B. A. 1974, Journal of Geophys. Res., 79, 3665
- Witt, Oliveri & Schild (1990) Witt, A., Oliveri, M. V., Schild, R.E., 1990, AJ, 99, 888
- Witt et al. (2008) Witt, A. N., Mandel, S., Sell, P. H., Dixon, T., & Vijh, U. P. 2008, ApJ , 679, 497-51
- Witt et al. (2010) Witt, A. N., Gold, B., Barnes, F.S. et al. 2010, ApJ , 724, 1551 - 1560
- Wood & Reynolds (1999) Wood, K, & Reynolds,R.J., 1999, ApJ , 525, 799
- Zacharias et al. (2004) Zacharias N., Monet D. G., Levine S. E., Urban S. E., Gaume R., Wycoff G. L., 2004, AAS, 36, 1418
- Zacharias et al. (2005) Zacharias N., Monet D. G., Levine S. E., Urban S. E., Gaume R., Wycoff G. L., 2005, yCat, 1297, 0
- Zhang et al. (2020) Zhang, W., Yang, F., Wu, H., et al., 2020, ApJ , 893, 120
Acknowledgements
We dedicate this paper to the memory of of Gerhard von Appen-Schnur (formerly Schnur, 9.3.1940 – 13.2.2013). He initiated with KM this project and was the key expert of the observing sessions at La Silla in all runs. In 1980 D. Schallwich and in 1987 and 1988 KM was the other observer. KL was the observer for the NTT/SOFI programme. We thank the ESO staff at La Silla for their excellent service. We thank N. Mauron for his comments and clarifications concerning the envelopes of the AGB stars. We thank an anonymous referee for several useful improvements. KM and KL acknowledge the support from the Research Council for Natural Sciences and Engineering (Finland); PV acknowledges the support from the National Research Foundation of South Africa and MH the support from the Deutsche Forschungsgemeinschaft grant DFG CH71/33-1. This research has made use of the USNOFS Image and Catalogue archive operated by the United States Naval Observatory, Flagstaff Station (http://www.nofs.navy.mil/data/fchpix/).
Supporting information
Supplementary data are available at online.
The coordinates of the observed 35 positions are given in table
L1642_AV+5colour+titleNEW.txt.
The differential surface brightnesses relative to the standard position Po8
in the five optical filter bands, plus the absolute surface
brightness at FIR 200 m, are given in table
Final2020JUL9N.txt
Appendix A Surface photometry in LDN 1642 area: methods and reductions
The data reductions and analysis as presented in this appendix are largely based on the MSc thesis of Väisänen (1994).
Surface photometry of extended sources differs in several aspects from the stellar photometry: (1) in addition to the atmospheric line-of-sight extinction correction, specific methods are required for eliminination of the atmospheric surface brightness contaminants, including the airglow (AGL) and the atmospheric scattered light; (2) the AGL shows substantial time variations which are crucial when ON and OFF source measuments are not simultaneous; (3) instumental straylight from off-aperture stars.
The photometry was carried out in five filters, centred at 360 nm , 384 nm, 416 nm, 470 nm and 555 nm , using the ESO 1-m and 50-cm telescopes at La Silla. The 50-cm telescope monitored the airglow variations. The observations were made differentially, relative to a standard position (Pos 8) in the centre of the cloud. Subsequently, the zero level was set by fitting in RA, Dec coordinates a plane through the darkest positions well outside the bright cloud area.The observations were carried out in three sessions: 1980 Dec 06-10, 1987 Dec 15-20, and 1988 Dec 02-11. The coordinates of the observed 35 positions are given in table L1642_AV+5colour+titleNEW.txt (see section Supporting information). and are shown in Fig. 1.
A.1 Elimination of airglow time variations: two-telescope technique
In order to eliminate the influence of the airglow time variations we used a two-telescope technique. The 50-cm telescope was used as a monitor and was pointed towards a fixed position in the dark nebula area during the whole measuring cycle. The large diaphragm size of gave a large signal as compared to the 88″diaphragm of the 1-m photometer. The integration times were synchronized with those of the 1-m telescope within 1 second. The 1-m telescope was used to measure several individual positions within or outside the dark cloud boundaries in an area of 4.5°– 4°in size. One position in the centre of the cloud was chosen as a standard position.
For each observation, be it standard or program position, the five-colour phototometry was run according to an automatic sequence of integrations and filter changes. The ratio of the signals from the fixed 50-cm position and the 1-m telescope standard position was formed:
| (2) |
remained very stable during a whole night despite the temporal variations of the airglow. The typical variations in sky brightness over one night were 10 – 30 per cent. The ratio varied typically by no more than 2 per cent. The ratio was fitted with a Chebysev polynomial of low order; normally an order of up to 3 was sufficient to give a good fit to observations. After removal of the fitted polynomial the residuals were of the order of 1 per cent. The sligth variation of can be understood because: the zenith distance difference between the 50-cm and 1-m positions (being apart) changed in a systematic way over the night; in addition, spatial airglow variations, or ’airglow clouds’, can cause small sporadic changes.
Between the standard position observations, normally one to two program positions were observed. The goal of the differential surface phototometry was to determine the differences of the program positions, PosN, relative to the standard position Pos8:
| (3) |
Because the standard position observations are, necessarily, at a different time, t, from the program positions we use the polynomial fit to the ratio, , to obtain an interpolated value of at time t:
| (4) |
Here, as explained above, the 50-cm monitor telescope signal was taken, for each PosN, at exactly the same time as the 1-m observation.
A.2 Correction for the airmass dependence of airglow and tropospheric scattered light
In differential surface photometry of an extended sky area the atmospheric and interplanetary components are eliminated as far as they are constant over the target area. We need to consider only the differential effects caused by the spatial differences over the studied area of 4°.
The total diffuse sky brightness for Position N observed at airmass is given by
| (5) |
where and are the Diffuse Galactic and the Zodiacal Light intensity, respectively, outside the atmosphere; the atmospheric total and Rayleigh extinction coeffiecient is denoted by and . The atmospheric diffuse light (ADL) intensity, , is the sum of the airglow (AGL) and the tropospheric scattered light, , that is the sum of the three components, with AGL, ZL and ISL as the sources of illumination for the scattered light
| (6) |
Because the observations of the standard position, Pos 8, and a program position, PosN, are taken at slightly different zenith distances, a systematic effect arises due to the zenith distance dependence of the ADL. Near the zenith the atmosphere can be approximated as plane parallel, and at airmasses the ADL intensity can be approximated by the linear relationship
| (7) |
where is the ADL intensity in zenith ().
The ADL difference between airmasses and is thus given by
| (8) |
where . We have estimated the values of empirically by observing a pair of positions from a small to a large airmass difference, up to 0.4.
We obtained the values = 0.19, 0.24, 0.34, 0.50 and 0.46 at = 350(u), 384, 416, 480(b) and 550 nm (y), respectively.
Using equation (A4) and recognizing that at high galactic latitudes is much smaller that we obtain for the ADL correction, referred to outside the atmosphere, the expression
| (9) |
For typical airglow differences, , the corrections for the five filter bands ranged up to , and erg cm-2s-1sr-1Å-1 in and , respectively.
A.3 Instrumental straylight from off-axis stars
The surface brightness observed towards blank areas of sky, even if the photometer aperture is devoid of any resolved stars, still contains instrumental straylight from off-axis stars outside the aperture.
A.3.1 Measurement of straylight profile of a star
The stray radiation profile of a star, , in the range of is thought to be caused mainly by scattering from the telescope main mirror micro-ripple and dust contamination (see e.g. Beckers 1995).
Sirius was used as light source and the straylight was measured over the angular offset range of = 89″–2000″ . OFF positions were located at 1° North and 0.8° NE. The airmass was 1.1 - 1.2. The closely linear form of log vs. log enabled a safe fitting over 200″- 3000″ . The straylight intensities were divided by the Sirius fluxes, adopted from Kurucz et al. (1984), at the corresponding centre wavelengths of the five filters. They were corrected for the atmospheric extinction to correspond to the ’below the atmosphere’ values of the straylight.
For the 5 bands we have obtained the following fits:
log = -1.553 log ; for
log = -1.484 log ; for 384/416/
log = -1.538 log ; for
For the Tycho and magnitudes we adopted the relations obtained for 384/416/470 nm and 555 nm, respectively. Compared with the ’canonical’ (photographic) King (1971) profile our levels at 10′ offset are by a factor of 1.30 lower, and our slopes are shallower than that (2.0) of King.
The straylight vs angular distance profiles were applied to complete sets of stars adopted from comprehensive star catalogs to calculate the straylight in 5 colours for each target position.
A.3.2 Straylight correction for the observed positions
The straylight intensities were calculated in the and bands for each target position in the LDN 1642 cloud area. For stars with 11.5 mag we adopted and magnitudes from the Tycho-2 catalogue131313http://archive.eso.org/skycat/servers/ASTROM (Hg et al., 2000) up to a radius of 180 arcmin ; for the fainter stars with mag we adopted the and magnitudes of The Naval Observatory Merged Astrometric Dataset (NOMAD) catalogue141414http://www.nofs.navy.mil/nomad/ (Zacharias et al. 2004, 2005) and calculated their straylight contributions up to a radius of 50 arcmin .
The straylight from Tycho-2 stars was and S10 for the bands and , respectively. The range for the Nomad stars was , and S10 in , and , respectively.
Our 35 positions were selected using the SRC Southern Sky Survey plates to exclude all stars above the limiting magnitude of . In order to check whether any fainter stars are found inside the ⌀86.55″photometer diaphragm area, we have used the GAIA data base. Because of possible slight setting errors or (unlikely) drifting of the telescope positioning during the exposure, we have also looked for stars in a annulus around the diaphragm, that is within from the centre. In a few cases faint stars were detected that could have contributed mostly no more that 0.5 S10 to the surface brightness.
The straylight consists of the sum of contributions from a large number of individual stars. In no case was it caused by a single or a few stars near the observed position. Thus, we have adopted the spectral energy distribution (SED) of the integrated starlight (ISL) at galactic latitude (Mattila et al., 2018) to calculate the transformation factors from and to our five photometric bands.
The differential straylight corrections, Pos N minus Standard Pos 8, were typically in the range and erg cm-2s-1sr-1Å-1 in and , respectively.
| Area | (tot) | (sca) | (sca) | (sca) | (bcg)151515] | |
|---|---|---|---|---|---|---|
| (sca) | rel. to Pos 8 | |||||
| (1) | (2) | (3) | (4) | (5) | (6) | (7) |
| Centre161616area includes positions 0, 1, 5, 6, 7, 8, 9, 10, 11, 12, 13, 40, 42, 43 | 4.20.1171717Derived from differential spectrum Pos 9/42 minus Pos 8 (Mattila et al., 2017b) | 28.71.0 | 4.25 | 0.0 | 0.90 | 10.30.3 |
| North181818Positions 14,15,16,17,18,19,39,48 | 9.70.7 | 7.00.7 | 1.04 | -3.21 | 0.25 | 16.51.2 |
| South191919Positions 20,21,22,24,25,26,32 | 3.90.8 | 5.81.1 | 0.86 | -3.39 | 0.20 | 8.91.2 |
| East202020Position 3 | 6.53.0 | 18.21.7 | 2.69 | -1.56 | 0.53 | 13.86.3 |
| West212121Positions 34,35,36 | 5.91.4 | 5.530.8 | 0.81 | -3.44 | 0.160.12 | 10.92.4 |
| (2) | (3) | (4) | (5) | (6) | (7) | |
| Filter | Pos 203222222Coordinates (J2000): Pos 203 04:01:39.9.0 +02:19:08; Pos 206 04:02:38.4 +02:46:46;
Off 201 03:56:06.4 +02:28:20; Off 209 04:07:4.2 +01:44:01; Off 211 04:07:55.1 +02:40:25 |
Pos 206a | Mean 203,206 | - | Mean,de-extincted | |
| Off 201, Off 209 | Off 211 | norm. | norm. | |||
| u | 17.61.8 | 11.23.2 | 16.21.6 | 1.59 | 0.43 | 24.12.4 |
| 384 | 6.42.1 | 6.13.3 | 6.31.8 | 1.51 | 0.35 | 8.82.4 |
| 416 | 7.02.2 | 3.83.2 | 6.31.9 | 1.41 | 0.25 | 7.92.4 |
| b | 3.61.4 | 4.62.7 | 3.71.2 | 1.23 | 0.07 | 3.91.3 |
| y | 4.42.4 | 1.47.1 | 4.02.2 | 1.00 | -0.16 | 3.51.8 |
| 106.41.5 | 76.75.5 | 100.01.4 | 1.16 | 0.00 | 100.01.4 |
A.4 Correction for ionized gas emission
Ionized gas along the line of sight contributes via line and, to a smaller part, also via continuum emission to the signal in all five filter bands. Its presence in the background radiation all over the sky is well demonstrated by the H emission line, see e.g. Reynolds, Haffner & Madsen 2002. Behind LDN 1642 there is an enhanced background from the Orion-Eridanus bubble. Besides the ’direct’ emission from ionized gas along the line of sight in front, (fgr), and behind of LDN 1642, (bgr), the ionized gas emission contributes also indirectly, via scattering off dust grains (Mattila et al., 2007; Wood & Reynolds, 1999; Witt et al., 2010). The total ionized gas emission towards a position in the LDN 1642 area can be expressed as
| (10) |
where is the optical depth of dust through the cloud.
A.4.1 Measurements of H emission line
As measure of the ionized gas emission we have used the H emission line. We have measured the line intensity through a narrow band filter (ESO 326, Å , Å ), and used the Strömgren band filter (ESO 324, Å , = 169 Å ) as reference filter. For each position N, the surface brightness differences relative to the standard position 8 were measured in both filters:
Then, the H emission line intensities, relative to Pos. 8, were calculated from
Because of the relatively large scatter of the values for individual positions we have defined five larger areas, Centre, North, South, East and West, see Table A1. The positions included into each of these areas are listed in the footnotes of the table. The distribution of ionized gas emission in the LDN 1642 area is relatively smooth (see Mattila et al. 2007). It is, therefore, justified to use the mean values of (tot) as an approximation for the individual positions in each of the five areas. The mean values of for each of these five areas are given in column (2) of the table.
A.4.2 Correcting H emission for dust-scattered component
In the direction of LDN 1642 most of the H emission comes from the ionized background gas in the Ori-Eri bubble. The ionized foreground gas is assumed to be evenly distributed over the cloud area; its contribution has thus been omitted in the differential measurements of the present study. The observed intensities (tot) contain also the component (sca), which is the H light scattered off the dust grains in the cloud, see equation (A9); for the purpose of deriving the LOS background component, (bgr), a correction is needed for it. The scattered H line contribution can be estimated using the band scattered light intensity.
In the Centre area, instead of using narrow/broad band filter photometry, we have adopted the value of (tot) from Mattila et al. (2017b) (see their Fig. 1) where it was determined using the difference spectrum between the translucent positions 9 and 42 ( mag and the opaque standard position 8. The scattered light intensities for Pos 9/42 and Pos 8 in the band are closely the same (see Fig. 6 in Mattila et al. 2017a); the same is true also for the scattered H line contributions and, therefore, the value of (tot) does not need a scattered light correction.
In the North, South, East and West areas the intensity of the scattered H line is taken to be (sca) = (sca). The proportionality factor is derived as follows: Using a large spectroscopic data set obtained from the SDSS background positions, Brandt & Draine (2012) have derived a spectrum of the Diffuse Galactic (scattered) Light (DGL). This spectrum represents at the same time the incident Galactic background light spectrum. The Balmer lines H and H appear as emission lines. The observed H emission line equivalent width is 4.0 Å . For the standard position 8 the continuum intensity near H is erg cm-2s-1sr-1Å-1 . For = 27 Å filter the equivalent width of 4.0 Å corresponds to an intensity of ) = erg cm-2s-1sr-1Å-1 . For observed positions with different amounts of scattered continuum light, (sca), the H scattered light intensity varies accordingly, that is (sca) = (sca). These values are given in column (4) of Table A1.
According to equation (A9) the observed H line intensities for Area A and Pos 8 are given by
, and
Because and , the H background intensity for Area A, corrected for scattered light, is given by:
The values and are given in columns (5) and (7) of Table A1. As can be seen from Table A1 there is a substantial gradient in the H background emission, with increasing values from South to North. This same behaviour is seen also in the H intensities (Mattila et al., 2007): in the Northern area is ca. twice the value in the South.
A.4.3 Subtraction of the ionized-gas contribution from the 5-colour photometry bands
Emission by the ionized background gas contributes to the surface brightness signal in all five bands of our photometry. The contributions are proportional to the (bcg) values as given in column (7) of Table A1. In order to determine the proportionality factors we have observed a bright filament, called Arc A, in the Eridanus superbubble area, 18°distant from LDN 1642. (see e.g. Boumis et al. 2001; Ochsendorf et al. 2015). In this filament erg cm-2s-1sr-1Å-1 , that is times brighter than in the LDN 1642 area; this enabled a measurement dominated by the ionized gas emission, even though some dust scattered light may be present. The observations were made using the same equipment, differential observing method, and way of analysis as for LDN 1642 cloud area. The observed intensities are given in Table A2. The observed lines of sight have modest extinction caused by the foreground translucent cloud LDN 1569. We give in column (7) the extinction-corrected intrinsic intensities, normalized to erg cm-2s-1sr-1Å-1 .
The ionized-gas corrections are now done as follows: the background intensities, ), are assumed to be constant in each of the areas, Centre, North, South, East and West; the effect of the foreground extinction is corrected individually for each position and each filter band. The resulting ionized-gas corrections are small, remaining below 3.1, 1.1, 1.0, 0,5, 0.5 erg cm-2s-1sr-1Å-1 in the filters u, 384 nm, 416 nm, b, and y, respectively.
A.5 Correction for zodiacal light gradient
The zodiacal light shows a substantial gradient over the angular extension, , of our target area. The area is centered at the ecliptic coordinates = 64.5, = -35.8 (J2000). The helioecliptic longitude of the area was in the range and varied substantially during an observing period of a week. The zodiacal light gradients over the latitude and longitude ranges were 5 and erg cm-2s-1sr-1Å-1 , respectively.
The outermost positions in the LDN 1642 outskirts are almost free of scattered light from dust. In addition, a number of positions have only small or moderate scattered-light contributions and can be utilized for the ZL gradient removal. Their far-IR emission is used as measure of the dust content. All positions in the target area have been observed at 200 m using the absolute photometry mode of the ISOPHOT instrument aboard the Infrared Space Observatory ISO (see Section 2.3) . At small and moderate optical depths with mag, corresponding to MJy sr-1 in and , and MJy sr-1 in /384/416 nm, a linear relationship between these quantities has been found, see Section 2.3 and Fig. 2.
| Filter | A | B | C | D | rms |
|---|---|---|---|---|---|
| (2) | (3) | (4) | (5) | (6) | |
| u | 0.480.45 | 1.830.29 | 1.270.22 | -8.121.37 | 1.818 |
| 384 | -0.390.32 | 1.240.20 | 1.750.14 | -15.650.89 | 1.288 |
| 416 | 0.160.45 | 1.560.31 | 2.030.16 | -22.601.22 | 2.081 |
| b | 0.580.44 | 1.560.35 | 1.680.11 | -28.591.03 | 2.575 |
| y | 0.300.51 | 1.880.37 | 1.400.08 | -31.850.95 | 2.280 |
The observed differential surface brightnesses in this paper have so far been referred to a zero point as defined by Pos 8, (Pos 8)= 0. We want to refer them to a zero level corresponding to zero dust column density. The absolute photometry at 200 m, corrected for CIRB and ZL, makes this approach possible, see Section 2.3. For this pupose, and also for the purpose of subtracting the ZL foreground gradient over the observed area, we have made a least-squares fit to the surface brightnesses for each of the five optical filters of the following form:
| (11) |
The two spatial coordinates are and where and are the coordinates of the standard position, Pos 8; the third coordinate is the far-IR intensity . A large number of OFF positions with almost none or only little dust were selected. These positions were complemented with a few positions with mag in order to improve the accuracy of the coefficient C and that of the zero point D. The number of positions used for the fit was 23 for and 384, 25 for 416, 28 for and 31 for . The resulting values and standard errors of the coefficients and , as well as the mean rms of the fitted data points are given in Table A3.
The zero point and the ZL foreground gradient correction are thus given by
| (12) |
These corrections are subtracted from
the five intensities, , , ,
and at each observed position .
The corrected values for the standard position Pos 8, located at , will thus be
(Pos 8) = .
Appendix B Extinction in the centre of LDN 1642 from NTT/SOFI photometry
Positions 8 and 40, in the centre of the cloud have no 2MASS stars within the surface-photometry aperture area and not even within . For these positions we have made use of NTT/SOFI H and Ks band imaging data (Programme 077.C-0338(A), observing dates 2006-08-11 - 2006-08-13). Using the colour excesses of 11 stars located within a area encompassing both these closeby ( apart) positions we found a mean extinction of mag. As for the 2MASS data we used the conversion ratio corresponding to .