Periodic Radio Emission from the T8 Dwarf WISE J062309.94045624.6
Abstract
We present the detection of rotationally modulated, circularly polarized radio emission from the T8 brown dwarf WISE J062309.94045624.6 between 0.9 and 2.0 GHz. We detected this high proper motion ultracool dwarf with the Australian SKA Pathfinder in GHz imaging data from the Rapid ASKAP Continuum Survey. We observed WISE J062309.94045624.6 to have a time and frequency averaged Stokes I flux density of mJy beam-1, with an absolute circular polarization fraction of , and calculated a specific radio luminosity of erg s-1 Hz-1. In follow-up observations with the Australian Telescope Compact Array and MeerKAT we identified a multi-peaked pulse structure, used dynamic spectra to place a lower limit of kG on the dwarf’s magnetic field, and measured a periodicity which we concluded to be due to rotational modulation. The luminosity and period we measured are comparable to those of other ultracool dwarfs observed at radio wavelengths. This implies that future megahertz to gigahertz surveys, with increased cadence and improved sensitivity, are likely to detect similar or later-type dwarfs. Our detection of WISE J062309.94045624.6 makes this dwarf the coolest and latest-type star observed to produce radio emission.
1 Introduction
T-dwarfs are a subclass of low mass ( ) sub-stellar objects with effective temperatures between – K (Kirkpatrick, 2005; Kirkpatrick et al., 2012). T-dwarfs and other spectral types later than M7 are referred to collectively as ultracool dwarfs (UCDs). UCDs are fully convective and do not possess an intermediate tachocline shearing region like more massive stars (Chabrier et al., 2000; Hughes et al., 2021). Tachocline shearing is thought to be a key component in the dynamo process that powers the magnetic fields of partially convective, higher-mass stars (Brandenburg & Subramanian, 2005). Nonetheless, radio observations have resulted in strong evidence for G magnetic fields in T-dwarfs (e.g., Route & Wolszczan, 2012; Kao et al., 2016), despite the lack of a tachocline region, requiring the operation of an alternative dynamo mechanism for UCDs (e.g., Christensen et al., 2009). Hence the investigation of magnetic field production in UCDs is important for improving our understanding of stellar evolution and dynamo theory.
The chromospheric and coronal activity generally associated with radio bursts from earlier type stars (M6) weakens with later spectral types. Rodríguez-Barrera et al. (2015) found that UCDs later than L4 dwarfs ( K) cannot sustain the ionization levels necessary for the atmospheric current system that produces typical stellar radio emission. The standard practice, therefore, is to use the processes that drive auroral emission in solar system gas giant planets (e.g., Hill, 1979) to model the magnetic activity for brown dwarfs in the L/T transition regime (L4–T4) and later (Williams, 2018). Much of the literature focuses primarily on these late-type UCDs as the radio pulse morphology, and possibly the astrophysical generator, are different for earlier-type (L4) UCDs (Pineda et al., 2017).
The generation of strong dipole fields in UCDs is thought to be tied to their fast rotation (Kao et al., 2018). UCDs have projected rotational velocities of km s-1 though their rotational periods can range from to upwards of (Tannock et al., 2021, and references therein). T-dwarfs on average rotate more rapidly than other UCDs, reaching projected velocities up to km s-1 (Zapatero Osorio et al., 2006; Tannock et al., 2021). Rapid rotation plays a critical role in the co-rotational breakdown between UCD magnetic fields and ionospheric plasma which produces the electrical currents responsible for generating auroral emission (Cowley & Bunce, 2001; Nichols et al., 2012).
Electron-cyclotron maser instability (ECMI) is the dominant mechanism producing coherent emission from UCDs, including the auroral emission which is understood to be modulated by the star’s rotational period (Hallinan et al., 2006, 2008). ECMI converts the free plasma energy in the auroral region – from the perpendicular component of the cyclotron motion around the magnetic field lines – into circularly polarized emission (Melrose & Dulk, 1982) at the electron cyclotron frequency: Hz (Dulk, 1985), where is the electron charge, is the magnetic field strength in gauss, is the electron mass, and is the speed of light (Williams, 2018). Analysis of radio emission from T-dwarfs therefore allows us to measure the strength and structure of their magnetic fields. Auroral ECMI is rotationally modulated and thus the emission can be also be used to measure rotational velocities. This can be difficult to measure through Zeeman Doppler Imaging for late-type UCDs, which tend to be faster rotators than earlier-type M-dwarfs. Studying these magnetic and rotational properties help us improve upon existing models of stellar dynamo theory as well as the evolution of giant exoplanets and late-type stars (e.g., Schrijver, 2009; Williams & Berger, 2015; Route, 2016; Pineda et al., 2017).
The first radio detection of a UCD was reported by (Berger et al., 2001) who identified both quiescent and flaring radio emission from the M9-dwarf LP94420. Radio observations conducted in the megahertz to gigahertz range have since resulted in detections of late-type L-dwarfs and T-dwarfs (Route & Wolszczan, 2012; Williams & Berger, 2015; Kao et al., 2018). Vedantham et al. (2020) made the first radio detection of a UCD that had not been previously identified in optical or infrared. Vedantham et al. (2020) used the Low-Frequency Array (LOFAR; Shimwell et al., 2022) to identify BDR J17503809 which they then spectroscopically classified as a T6.51 dwarf with the near-infrared SpeX instrument on NASA’s Infrared Telescope Facility (IRTF; Rayner et al., 2003). The latest-type UCD detected in the radio to date is part of the T-dwarf binary discovered by Vedantham et al. (2023), which is composed of T5.50.5 and T7.00.5 dwarfs.
Targeted radio surveys of UCDs at – GHz have been conducted with the Karl G. Janksy Very Large Array (VLA; Perley et al., 2011) and the Australian Telescope Compact Array (ATCA; Wilson et al., 2011) (e.g., Berger, 2006; Lynch et al., 2016). These surveys targeted a range of known UCDs and detected radio emission from % of them (Route & Wolszczan, 2016a). Kao et al. (2016) conducted a targeted VLA survey of UCDs that had exhibited signs of auroral activity at other wavelengths (H, optical, and infrared). They detected four out of the five dwarfs which had not previously been observed to produce radio emission.
LOFAR and the Australian SKA Pathfinder (ASKAP; Hotan et al., 2021) have come online with high sensitivity widefield capabilities at megahertz to low-gigahertz frequencies. Stokes V (circular polarization) searches with the LOFAR Two-metre Sky Survey (LoTSS; Shimwell et al., 2019) and the Rapid ASKAP Continuum Survey (RACS; McConnell et al., 2020) have already found new UCDs which had not previously been observed to produce radio emission (e.g., Pritchard et al., 2021; Callingham et al., 2023). UCD dynamo modeling by Christensen et al. (2009) predicts magnetic fields of order G for Y-dwarfs and G for T-dwarfs. Given the relationship between magnetic field strength and the electron cyclotron frequency, this would imply that megahertz and low-gigahertz observations are well placed to detect radio emission from late T-dwarfs and potentially even Y-dwarfs — which remain undetected at radio wavelengths (Kao et al., 2019).
T-dwarfs are the coolest sub-stellar spectral type observed to produce radio emission and there are currently only six such systems that have been detected (Pineda et al., 2017; Vedantham et al., 2020, 2023). In this paper we present the detection and analysis of an ultracool T8 dwarf found in a new untargeted gigahertz survey conducted with ASKAP. The source, WISE J062309.94045624.6, is the coolest and latest-type UCD detected at radio wavelengths to date. Our detection of radio emission from WISE J062309.94045624.6 adds to the small population radio-active T-dwarfs and is the first example of multiple, high duty cycle pulses from a T-dwarf. The clear periodicity and strong spectral features of these pulses inform our understanding of the rotational and magnetospheric properties of WISE J062309.94045624.6, while also providing more general insights into the astrophysical mechanism responsible for producing detectable radio emission in late-type ultracool dwarfs.
2 Observations and Results
2.1 ASKAP Detection
We performed a search for highly circularly polarized objects in the RACS mid-band ( GHz) data (RACS-mid; Duchesne et al., 2023). The RACS-mid observations cover the whole sky south of Dec (covering deg2) with a median angular resolution of and a median sensitivity of – mJy beam-1. We used the circular polarization method presented by Pritchard et al. (2021) to identify interesting sources. We identified ASKAP J062309.20456227 for further investigation because we did not find a nearby () positional cross-match to any known astronomical objects.
ASKAP J062309.20456227 was detected in RACS-mid on with a time and frequency averaged Stokes I flux density of mJy beam-1, with a beam size of , and an absolute fractional circular polarization of . There was no source detected within of these coordinates in the RACS-low survey ( GHz) with a flux density limit of mJy beam-1; see Table 1 for details of these radio observations.
2.2 ATCA Observations
We observed ASKAP J062309.20456227 with ATCA in L-band (– GHz) on for using the hybrid H168 array configuration and an additional on in the extended 6C configuration (C3363). For both observations we used the ATCA calibrator source PKS 1934-638 as the primary flux calibrator and the calibrator source [HB89] 0607-157 for phase calibration scans.
We reduced the data from these observations using the Miriad software (Sault et al., 1995) and imaged using the Common Astronomy Software Application software (CASA; CASA Team et al., 2022). We used tclean with briggs weighting and a robust parameter of , with the multi-scale multi-term multi-frequency synthesis (mtmfs) deconvolver and clean scales of and pixels. The observation had limited uv coverage due to the hybrid array configuration and the source’s proximity to the celestial equatorial, resulting in an extended PSF which confused ASKAP J062309.20456227 with nearby sources. This observation was dominated by artifacts from bright off-axis emission. These artifacts are the result of bright sources in the field, as well as a resolved source from WISE J062309.94045624.6. The observation produced more extensive coverage of uv space and did not suffer from the same PSF and source confusion issues as the observation.
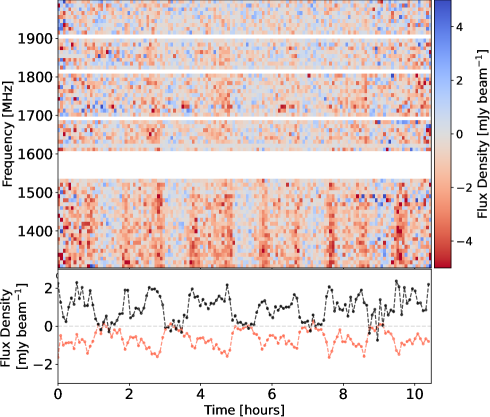
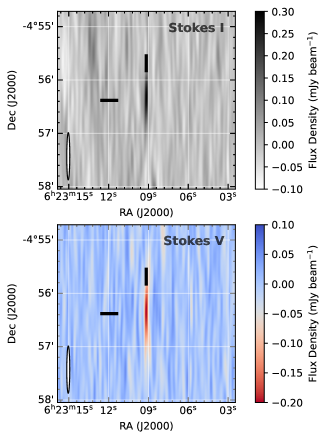
In the ATCA observation we detected a time and frequency averaged Stokes I emission mJy beam-1, with a beam size of , and marginal evidence of periodicity identified in the dynamic spectrum of the observation. We did not measure a clear Stokes V flux for the ATCA observation. Our observation produced a source detection with a time and frequency averaged Stokes I flux density of mJy beam-1, with a beam size of , and an absolute fractional circular polarization of . Figure 1 shows the Stokes V dynamic spectrum as well as Stokes I and V lightcurves from the ATCA observation. We see clear evidence of highly circularly polarized periodic pulsed emission.
2.3 MeerKAT Observations
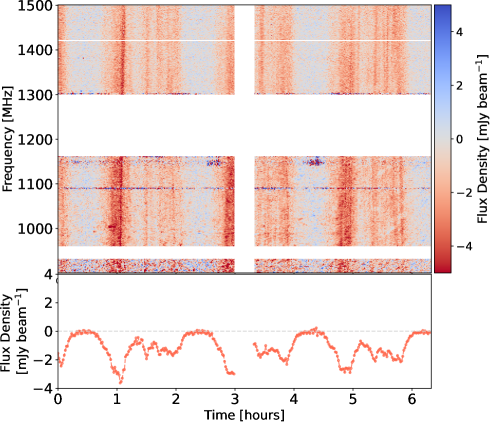
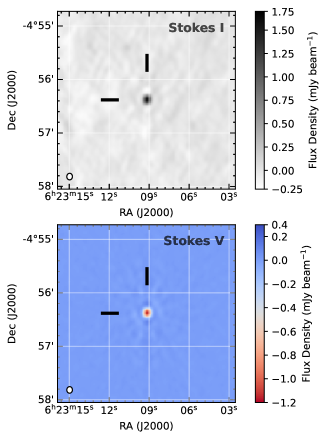
We observed ASKAP J062309.20456227 with MeerKAT (Jonas & MeerKAT Team, 2016) in L-band (– GHz) on in the c856M4k configuration with the standard integration time. We used the source PKS J0408-6544 as the primary flux calibrator, PKS J0521+1638 as the polarization calibrator, and the source PKS J0609-1542 for phase calibration scans. We reduced and imaged the data from this observation with the oxkat pipeline (Heywood, 2020) and used the IDIA (Inter-University Institute for Data Intensive Astronomy) processMeerKAT pipeline (Collier et al., 2021) for cross polarization calibration. We used tclean with briggs weighting and a robust parameter of , with the multi-scale multi-term multi-frequency synthesis (mtmfs) deconvolver and clean scales of and pixels. The MeerKAT observation produced a source detection with a time and frequency averaged Stokes I flux density of mJy beam-1, with a beam size of , and an absolute fractional circular polarization of . Figure 2 shows the Stokes V dynamic spectrum and lightcurve from the MeerKAT observation. We see strong evidence of repeating, highly circularly polarized pulses with multiple intra-pulse peaks.
2.4 Multi-wavelength Identification
In RACS-mid, ASKAP J062309.20456227 has coordinates , (, ) on , with uncertainties of in both RA and Dec (McConnell et al., 2020; Duchesne et al., 2023). We extended our cross-match radius and found WISE J062309.94045624.6, with an on-sky separation of from ASKAP J062309.20456227 in the SIMBAD astronomical database (Wenger et al., 2000). WISE J062309.94045624.6 has a proper motion of and in RA and Dec, respectively, in the CatWISE2020 catalog (Marocco et al., 2021). Propagating the WISE object coordinates to the RACS-mid epoch resulted in an offset of from ASKAP J062309.20456227.We therefore identified WISE J062309.94045624.6 as the source of the radio emission.
WISE J062309.94045624.6 is a high proper motion T8 dwarf discovered and spectroscopically confirmed (with IRTF/SpeX) by Kirkpatrick et al. (2011). This UCD has an effective temperature of K and is located pc away (Kirkpatrick et al., 2019). Zhang et al. (2021) derived constraints on the age, radius, and mass of WISE J062309.94045624.6 with Sonora-Bobcat models (Marley et al., 2021): , , .
WISE J062309.94045624.6 was not detected in the VLA Sky Survey (VLASS; Lacy et al., 2020) epochs 1.1 and 2.1, with limits of mJy and mJy respectively. Looking at the lower MHz of the ATCA observing band (see Figure 1), the pulsed emission stops at a cutoff frequency – GHz. This is likely the reason for the GHz VLA non-detections listed in Table 1, though the lack of detection could also be due to the short duration observations in the VLASS on-the-fly observing mode. This also explains the lower time and frequency averaged flux density measured with ATCA compared to ASKAP and MeerKAT, which have narrower bandwidths that are below the cutoff frequency.
We did not identify archival radio observations of WISE J062309.94045624.6 from ATCA, ASKAP, the Atacama Large Millimeter/submillimeter Array (ALMA; Wootten & Thompson, 2009), or the National Radio Astronomy Observatory (NRAO) VLA Sky Survey (NVSS; Condon et al., 1998). Nor were there detections with the ROentgen SATellite (ROSAT; Truemper, 1982) or other X-ray telescopes.
| Date | Obs. Length | Bandwidth | RMSI | RMSV | Telescope | |||
|---|---|---|---|---|---|---|---|---|
| OTF | … | … | VLA | |||||
| 0.25 | ASKAP | |||||||
| OTF | … | … | VLA | |||||
| 0.25 | ASKAP | |||||||
| 6 | … | ATCA (H168) | ||||||
| 11 | ATCA (6C) | |||||||
| 6.5 | MeerKAT |
Note. — The ASKAP non-detection is from RACS-low (SBID 8592) while the ASKAP detection, originally named ASKAP J062309.20456227, is from RACS-mid (SBID 21060). VLA limits are from the VLASS epochs 1.1 and 2.1, which were observed on-the-fly (OTF). is the central observing frequency in gigahertz and , are the peak Stokes I and Stokes V continuum flux densities at that frequency. The flux density errors are the quadrature addition of the fitted error, RMS, and brightness uncertainty scaling — % for ASKAP and % for MeerKAT and ATCA.
aWe follow the IAU/IEEE convention (Hamaker & Bregman, 1996) where corresponds to right-handed circular polarization and to left-handed circular polarization.
3 Analysis
3.1 Pulse Periodicity
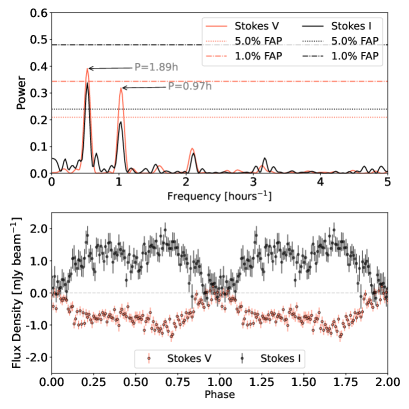
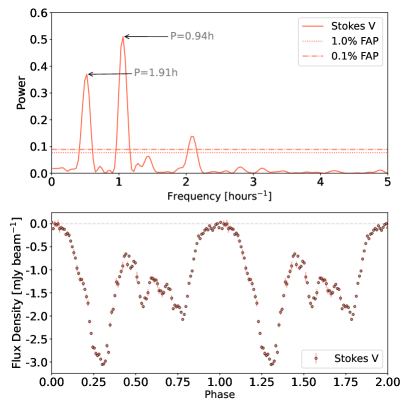
We used a Lomb-Scargle periodogram to identify the dominant period in the Stokes V emission from the ATCA observation. The pulsed emission has a double-peaked structure (as seen in the lower left panel of Figure 1), which repeats with a period of at a false alarm probability of (VanderPlas, 2018). Peaks within the pulses are separated by , approximately half the pulse period, which appears as a less prominent peak in the Lomb-Scargle power spectrum. We used similar Lomb-Scargle analysis to find a pulse perodicity of , at a false alarm probability of (VanderPlas, 2018), in the MeerKAT data. The pulsed emission has a complex pulse profile with multiple peaks (as seen in the lower left panel of Figure 2). The leading and trailing peaks of the pulse are separated by , approximately half the pulse period. False alarm probabilities were calculated using bootstrap resampling (VanderPlas, 2018) of the (ATCA) and (MeerKAT) time-averaged data. We calculated the period uncertainties using the method presented in equation 52 of VanderPlas (2018), which assumes that the periods are physical and not aliases. The pulse periodicities observed with ATCA and MeerKAT (see lower panel of Figure 2) are consistent with a period. Figure 3 shows the Lomb-Scargle periodograms and phase-folded lightcurves from the ATCA Stokes I and Stokes V data and from the MeerKAT Stokes V data. Two phase cycles are shown for clarity and the folded lightcurves are cumulatively binned. Both plots in Figure 3 show that is the dominant period in both the Stokes I and Stokes V emission. A less prominent peak is visible in both periodograms at . This peak appears to be a harmonic corresponding to a quarter of the period.
3.2 Radio Luminosity
Based on modeling of WISE J062309.94045624.6 by Zhang et al. (2021) we assume an upper limit of for the emission region. Using the RACS-mid flux density we obtain a lower limit for the brightness temperature of K, which requires a coherent emission mechanism.
Using a distance of pc (Kirkpatrick et al., 2019), the measured RACS-mid flux density corresponds to an isotropic radio luminosity of erg s-1 Hz-1. The peak radio luminosities of UCDs presented by Pineda et al. (2017) range from – erg s-1 Hz-1. The isotropic radio luminosity we calculate for WISE J062309.94045624.6 is comparable to the most luminous UCDs of similar spectral types (see Table 2).
| Name | SpT | Band | Ref. | ||||
|---|---|---|---|---|---|---|---|
| [ erg s-1 Hz-1] | [ erg s-1 Hz-1] | [GHz] | |||||
| 2MASS J042348580414035 | L6 | – | Kao et al. (2016, 2018) | ||||
| 2MASS 104307582225236 | L8 | – | Kao et al. (2016, 2018) | ||||
| SIMP J013656.5093347.3 | T2.5 | – | Kao et al. (2016, 2018) | ||||
| WISEP J112254.73255021.5a | T6 | … | – | Route & Wolszczan (2016b) | |||
| 2MASS J104753852124234b | T6.5 | – | Williams & Berger (2015) | ||||
| 2MASS J123739196526148 | T6.5 | – | Kao et al. (2016, 2018) | ||||
| BDR J17503809 | T6.5 | … | … | – | Vedantham et al. (2020) | ||
| WISEP J101905.63652954.2c | T7+T5.5 | … | … | – | Vedantham et al. (2023) | ||
| WISE J062309.94045624.6 | T8 | – | This Work |
Note. — We include average and peak radio luminosities, arranged by spectral type (SpT), for dwarfs at the L/T transition (L4–T4) and cooler from Pineda et al. (2017); Vedantham et al. (2020, 2023), and references therein. We list the observing bands the UCDs have been detected.
a WISEP J112254.73255021.5 was first detected in radio by Route & Wolszczan (2016b) in the – GHz band and then by Williams et al. (2017) in the – GHz band.
b 2MASS J104753852124234 was detected in the – GHz and – GHz bands by Williams & Berger (2015), – GHz by Route & Wolszczan (2016a), and – GHz by Kao et al. (2018).
c The latest-type radio-emitting UCD prior to this work is the T7+T5.5 binary detected by Vedantham et al. (2023) at MHz.
4 Discussion
4.1 Model-dependent Source Parameters
The detected emission from WISE J062309.94045624.6 has a brightness temperature beyond the K coherent limit, implying that it is generated either by plasma radiation or by ECMI. ECMI is the primary source of coherent emission in UCDs which is both highly circularly polarized and rotationally modulated (Hallinan et al., 2006, 2008). Because the WISE J062309.94045624.6 emission is strongly circularly polarized and periodic, we favor the ECMI interpretation. This implies that the observed periodicity corresponds to the dwarf’s rotation period.
Using a conservative emission upper cutoff of GHz from the ATCA observation, the minimum magnetic field strength in the emission region is kG (Dulk, 1985). However, the ECMI mechanism could be operating at the first harmonic of the cyclotron frequency rather than the fundamental, in which case the magnetic field lower limit would instead be kG. The upper cutoff for ECMI emission is typically interpreted to represent the magnetic field strength at the base of the emission region, where the plasma density becomes sufficient to drive the local plasma frequency above the cyclotron frequency , and in principle provides a lower limit to the maximum stellar magnetic field strength at the photosphere. Because we detect radio emission up to GHz in the ATCA observation, we used the electron plasma frequency relation: Hz (Dulk, 1985) to calculate an upper limit of cm-3 on the local electron density at the base of the emission region. The spectral cutoff may also be due to the plasma frequency, which is dependent on the electron density, reaching the order of the cyclotron frequency at a higher altitude void in the dwarf’s magnetosphere. This would cut off the emission at a lower magnetic field strength and the true maximum magnetic field strength would be larger.
Using the upper limit radius (Zhang et al., 2021) we can use the period to constrain the rotational velocity to km s-1. This projected rotational velocity is relatively high for a UCD but is still slower than the fastest known rotating T-dwarfs found by Tannock et al. (2021) and Vos et al. (2022). The rotational period is reasonable as it is above the empirical lower limit for UCD rotation periods (Tannock et al., 2021) and well above the break-up period lower limit . We calculated this break-up limit by taking the parallax mas and the Starfish-based values for the surface gravity dex and solid angle dex from Zhang et al. (2021). We then computed the breakup period as by using a Monte Carlo estimate for the uncertainty, drawing the values for , , and from independent Gaussians and computing the distribution in values of that resulted.
4.2 Source of ECMI Emission
The pulse profile detected in both ATCA and MeerKAT observations of WISE J062309.94045624.6 has a dominant period of which we interpret as the stellar rotation period, and a duty cycle of . Each pulse profile features a multi-peaked structure with strong leading and trailing pulses separated by a phase of , multiple weaker pulses inbetween, and an apparent “off” period for the remaining phase. ECMI radio emission is beamed into a hollow cone aligned with the local magnetic field and with half-angle that is dependent upon the nature of the instability in the electron velocity distribution, typically near perpendicular to the magnetic field (Treumann, 2006). Emission from an extended region of the stellar magnetosphere such as an auroral oval is a superposition of individual ECMI sources with complex, overlapping beaming geometry.
The phase separation of the strongest pulse peaks in our data can then be explained by the leading and trailing edges of an extended ECMI source analogous to Jupiter’s main auroral oval (e.g., Cowley & Bunce, 2001). This is the expected ECMI source distribution for aurorae that are powered by co-rotation breakdown between the stellar magnetosphere and ionosphere, which is a plausible scenario given the rapid rotation period. Alternatively, a localized ECMI source with perpendicular beaming angle may produce strong leading and trailing pulses separated by phase (e.g., Hallinan et al., 2007), and extension of the source over a small range of stellar longitudes can then explain the weaker intermediate pulses as separate ECMI cones are swept into the line of sight (e.g., Bastian et al., 2022). The pulse duty cycle of is much larger than most previously detected UCD auroral pulses, with only a few similar examples such as the L3.5 dwarf 2M J0036+1821 (Hallinan et al., 2008) and the T6 dwarf WISE J1122+2550 (Williams et al., 2017) with duty cycles of and respectively, which may be explained by unresolved sub-pulse structure as shown in Figure 2. Modeling of the time-frequency structure of pulses in the dynamic spectra will inform the interpretation of the ECMI source configuration and electrodynamic engine powering the aurorae, and can provide constraints on the rotation and magnetic axis inclinations, which will be the subject of a future publication.
4.3 Volumetric Rate Analysis
WISE J062309.94045624.6 is the only T-dwarf detected in our untargeted RACS-mid circular polarization search, which will be presented in an upcoming publication. While the radio luminosity distribution of T-dwarf auroral pulses is still poorly constrained, to determine an order of magnitude estimate of the expected number of T-dwarf detections we assume the observed value of erg s-1 Hz-1 is representative of the population. With a limiting flux density of mJy beam-1 in RACS-mid, this corresponds to a detection horizon of pc. Best et al. (2021) used a volume-limited pc sample of T-dwarfs to calculate a space density of T-dwarfs (T0–T8) per cubic parsec. We therefore expect a total of T-dwarfs within the sampled pc RACS-mid sensitivity horizon, accounting for the RACS-mid sky coverage.
However not all T-dwarfs in a given volume are necessarily radio-active. Williams (2018) suggested that the detection fraction for UCDs in targeted radio surveys (Route & Wolszczan, 2016a) may be due to a similarly small fraction of UCDs having the necessary magnetospheric conditions to produce detectable radio emission. Another factor contributing to the detection fraction is the beaming geometry (Pineda et al., 2017), where some fraction of T-dwarfs will have rotation and magnetic axes that are unfavorably aligned for the rotationally modulated ECMI beam to cross our line of sight. The overall fraction of radio pulsing UCDs implies that T-dwarfs within the RACS-mid sensitivity horizon are producing detectable auroral radio pulses.
Finally, radio-pulsing T-dwarfs whose emission is favorably beamed may have been missed due to the short duration of RACS-mid observations, which are not capable of sampling the full rotational phase of these systems. Measured T-dwarf rotational periods typically range from to (Tannock et al., 2021, and references therein), while the RACS-mid observations cover each candidate radio-loud T-dwarf for , implying a rotation phase coverage of as little as for slowly rotating T-dwarfs to for rapidly rotating T-dwarfs. As discussed in Section 4.2, the duty cycle of auroral ECMI emission is dependent on multiple factors including magnetic and rotation axis orientation and the distribution of auroral sources in altitude and longitude. While the distribution of these factors in the T-dwarf population are still poorly constrained, most auroral pulses detected to date have duty cycles of less than (e.g., Kao et al., 2016; Pineda et al., 2017; Williams, 2018). Using the average measured T-dwarf rotation period of and assuming a typical duty cycle of , we expect a significant number of the estimated detectable aurorally active T-dwarfs in RACS-mid would be undetected due to limited rotation phase coverage. While a quantitative estimate of the expected detection rates would require stronger constraints on the population parameters of auroral T-dwarf activity, we find that the expected number of detections in RACS-mid is of order unity. This is consistent with WISE J062309.94045624.6 being the only T-dwarf we found in our circular polarization search of RACS-mid.
5 Conclusions
This work described our methods of discovery and analysis of WISE J062309.94045624.6. We detected rotationally modulated coherent emission with a periodicity of . This detection provides additional evidence of complex magnetic field activity in late-type UCDs, and further validation for using the auroral-planet framework to model UCD radio emission. Because their observed flux is relatively faint compared to other radio sources, we see that circular polarization searches are a useful method of identifying late-type UCDs in widefield untargeted surveys. Future deep surveys such as the ASKAP Evolutionary Map of the Universe (EMU; Norris et al., 2011, 2021) will enable the discovery of more nearby auroral pulsing UCDs through greater coverage of their rotational phase, while the improved instantaneous sensitivity of future surveys with the low and mid-band SKA1 (Braun et al., 2019) will push the detection horizon outwards, and perhaps enable detection of the first radio-active Y-dwarf.
We would like to thank the anonymous referee for reviewing this manuscript and providing us with helpful and constructive feedback. The authors would like to thank James K. Leung and Yuanming Wang for their suggestions and helpful discussions. We would also like to express our gratitude towards Ben Montet for their efforts to find additional data for this work. The authors would like to thank SARAO staff for scheduling our DDT observation. The MeerKAT telescope is operated by the South African Radio Astronomy Observatory, which is a facility of the National Research Foundation, an agency of the Department of Science and Innovation. This scientific work uses data obtained from Inyarrimanha Ilgari Bundara / the Murchison Radio-astronomy Observatory. We acknowledge the Wajarri Yamaji People as the Traditional Owners and native title holders of the Observatory site. CSIRO’s ASKAP radio telescope is part of the Australia Telescope National Facility (ATNF). Operation of ASKAP is funded by the Australian Government with support from the National Collaborative Research Infrastructure Strategy. ASKAP uses the resources of the Pawsey Supercomputing Research Centre. Establishment of ASKAP, Inyarrimanha Ilgari Bundara, the CSIRO Murchison Radio-astronomy Observatory and the Pawsey Supercomputing Research Centre are initiatives of the Australian Government, with support from the Government of Western Australia and the Science and Industry Endowment Fund. The Australia Telescope Compact Array is part of the ATNF which is funded by the Australian Government for operation as a National Facility managed by CSIRO. We acknowledge the Gomeroi people as the Traditional Owners of the Observatory site. This publication makes use of data products from the Wide-field Infrared Survey Explorer (WISE), which is a joint project of the University of California, Los Angeles, and the Jet Propulsion Laboratory/California Institute of Technology, funded by the National Aeronautics and Space Administration. DK is supported by NSF grant AST-1816492. MC acknowledges support of an Australian Research Council Discovery Early Career Research Award (project number DE220100819) funded by the Australian Government and the Australian Research Council Centre of Excellence for All Sky Astrophysics in 3 Dimensions (ASTRO 3D), through project number CE170100013. This research has made use of the CIRADA cutout service, operated by the Canadian Initiative for Radio Astronomy Data Analysis (CIRADA). CIRADA is funded by a grant from the Canada Foundation for Innovation 2017 Innovation Fund (Project 35999), as well as by the Provinces of Ontario, British Columbia, Alberta, Manitoba and Quebec, in collaboration with the National Research Council of Canada, the US National Radio Astronomy Observatory and Australia’s Commonwealth Scientific and Industrial Research Organisation. This research has made use of the VizieR catalogue access tool, CDS, Strasbourg, France. The original description of the VizieR service was published in Ochsenbein et al. (2000). This research has made use of the SIMBAD database, operated at CDS, Strasbourg, France (Wenger et al., 2000). This research has made use of NASA’s Astrophysics Data System (ADS) Bibliographic Services. This research made use of Astropy, a community-developed core Python package for Astronomy (Astropy Collaboration et al., 2013, 2018).
References
- Astropy Collaboration et al. (2013) Astropy Collaboration, Robitaille, T. P., Tollerud, E. J., et al. 2013, A&A, 558, A33, doi: 10.1051/0004-6361/201322068
- Astropy Collaboration et al. (2018) Astropy Collaboration, Price-Whelan, A. M., Sipőcz, B. M., et al. 2018, AJ, 156, 123, doi: 10.3847/1538-3881/aabc4f
- Bastian et al. (2022) Bastian, T., Cotton, W., & Hallinan, G. 2022, The Astrophysical Journal, 935, 99, doi: 10.3847/1538-4357/ac7d57
- Berger (2006) Berger, E. 2006, ApJ, 648, 629, doi: 10.1086/505787
- Berger et al. (2001) Berger, E., Ball, S., Becker, K. M., et al. 2001, Nature, 410, 338, doi: 10.48550/arXiv.astro-ph/0102301
- Best et al. (2021) Best, W. M. J., Liu, M. C., Magnier, E. A., & Dupuy, T. J. 2021, AJ, 161, 42, doi: 10.3847/1538-3881/abc893
- Brandenburg & Subramanian (2005) Brandenburg, A., & Subramanian, K. 2005, Phys. Rep., 417, 1, doi: 10.1016/j.physrep.2005.06.005
- Braun et al. (2019) Braun, R., Bonaldi, A., Bourke, T., Keane, E., & Wagg, J. 2019, arXiv e-prints, arXiv:1912.12699, doi: 10.48550/arXiv.1912.12699
- Callingham et al. (2023) Callingham, J. R., Shimwell, T. W., Vedantham, H. K., et al. 2023, A&A, 670, A124, doi: 10.1051/0004-6361/202245567
- CASA Team et al. (2022) CASA Team, Bean, B., Bhatnagar, S., et al. 2022, PASP, 134, 114501, doi: 10.1088/1538-3873/ac9642
- Caswell et al. (2023) Caswell, T. A., Lee, A., de Andrade, E. S., et al. 2023, matplotlib/matplotlib: REL: v3.7.1, v3.7.1, Zenodo, doi: 10.5281/zenodo.7697899
- Chabrier et al. (2000) Chabrier, G., Baraffe, I., Allard, F., & Hauschildt, P. 2000, ApJ, 542, 464, doi: 10.1086/309513
- Christensen et al. (2009) Christensen, U. R., Holzwarth, V., & Reiners, A. 2009, Nature, 457, 167, doi: 10.1038/nature07626
- Collier et al. (2021) Collier, J. D., Frank, B., Sekhar, S., & Taylor, A. R. 2021, in 2021 XXXIVth General Assembly and Scientific Symposium of the International Union of Radio Science (URSI GASS), 1–4, doi: 10.23919/URSIGASS51995.2021.9560276
- Condon et al. (1998) Condon, J. J., Cotton, W. D., Greisen, E. W., et al. 1998, AJ, 115, 1693, doi: 10.1086/300337
- Cowley & Bunce (2001) Cowley, S. W. H., & Bunce, E. J. 2001, Planet. Space Sci., 49, 1067, doi: 10.1016/S0032-0633(00)00167-7
- Duchesne et al. (2023) Duchesne, S. W., Thomson, A. J. M., Pritchard, J., et al. 2023, arXiv e-prints, arXiv:2306.07194. https://arxiv.org/abs/2306.07194
- Dulk (1985) Dulk, G. A. 1985, ARA&A, 23, 169, doi: 10.1146/annurev.aa.23.090185.001125
- Hallinan et al. (2006) Hallinan, G., Antonova, A., Doyle, J. G., et al. 2006, ApJ, 653, 690, doi: 10.1086/508678
- Hallinan et al. (2008) —. 2008, ApJ, 684, 644, doi: 10.1086/590360
- Hallinan et al. (2007) Hallinan, G., Bourke, S., Lane, C., et al. 2007, ApJ, 663, L25, doi: 10.1086/519790
- Hamaker & Bregman (1996) Hamaker, J. P., & Bregman, J. D. 1996, A&AS, 117, 161
- Harris et al. (2020) Harris, C. R., Millman, K. J., van der Walt, S. J., et al. 2020, Nature, 585, 357, doi: 10.1038/s41586-020-2649-2
- Heywood (2020) Heywood, I. 2020, oxkat: Semi-automated imaging of MeerKAT observations, Astrophysics Source Code Library, record ascl:2009.003. http://ascl.net/2009.003
- Hill (1979) Hill, T. 1979, Journal of Geophysical Research: Space Physics, 84, 6554, doi: https://doi.org/10.1029/JA084iA11p06554
- Hotan et al. (2021) Hotan, A. W., Bunton, J. D., Chippendale, A. P., et al. 2021, PASA, 38, e009, doi: 10.1017/pasa.2021.1
- Hughes et al. (2021) Hughes, A. G., Boley, A. C., Osten, R. A., White, J. A., & Leacock, M. 2021, AJ, 162, 43, doi: 10.3847/1538-3881/ac02c3
- Jonas & MeerKAT Team (2016) Jonas, J., & MeerKAT Team. 2016, in MeerKAT Science: On the Pathway to the SKA, 1, doi: 10.22323/1.277.0001
- Kao et al. (2019) Kao, M. M., Hallinan, G., & Pineda, J. S. 2019, MNRAS, 487, 1994, doi: 10.1093/mnras/stz1372
- Kao et al. (2016) Kao, M. M., Hallinan, G., Pineda, J. S., et al. 2016, ApJ, 818, 24, doi: 10.3847/0004-637X/818/1/24
- Kao et al. (2018) Kao, M. M., Hallinan, G., Pineda, J. S., Stevenson, D., & Burgasser, A. 2018, ApJS, 237, 25, doi: 10.3847/1538-4365/aac2d5
- Kirkpatrick (2005) Kirkpatrick, J. D. 2005, ARA&A, 43, 195, doi: 10.1146/annurev.astro.42.053102.134017
- Kirkpatrick et al. (2011) Kirkpatrick, J. D., Cushing, M. C., Gelino, C. R., et al. 2011, ApJS, 197, 19, doi: 10.1088/0067-0049/197/2/19
- Kirkpatrick et al. (2012) Kirkpatrick, J. D., Gelino, C. R., Cushing, M. C., et al. 2012, ApJ, 753, 156, doi: 10.1088/0004-637X/753/2/156
- Kirkpatrick et al. (2019) Kirkpatrick, J. D., Martin, E. C., Smart, R. L., et al. 2019, ApJS, 240, 19, doi: 10.3847/1538-4365/aaf6af
- Lacy et al. (2020) Lacy, M., Baum, S. A., Chandler, C. J., et al. 2020, PASP, 132, 035001, doi: 10.1088/1538-3873/ab63eb
- Lebigot (2018) Lebigot, E. O. 2018, Uncertainties: a Python package for calculations with uncertainties, v3.1.7. https://pythonhosted.org/uncertaintie
- Lynch et al. (2016) Lynch, C., Murphy, T., Ravi, V., et al. 2016, MNRAS, 457, 1224, doi: 10.1093/mnras/stw050
- Marley et al. (2021) Marley, M. S., Saumon, D., Visscher, C., et al. 2021, ApJ, 920, 85, doi: 10.3847/1538-4357/ac141d
- Marocco et al. (2021) Marocco, F., Eisenhardt, P. R. M., Fowler, J. W., et al. 2021, ApJS, 253, 8, doi: 10.3847/1538-4365/abd805
- McConnell et al. (2020) McConnell, D., Hale, C. L., Lenc, E., et al. 2020, PASA, 37, e048, doi: 10.1017/pasa.2020.41
- Melrose & Dulk (1982) Melrose, D. B., & Dulk, G. A. 1982, ApJ, 259, 844, doi: 10.1086/160219
- Nichols et al. (2012) Nichols, J. D., Burleigh, M. R., Casewell, S. L., et al. 2012, ApJ, 760, 59, doi: 10.1088/0004-637X/760/1/59
- Norris et al. (2011) Norris, R. P., Hopkins, A. M., Afonso, J., et al. 2011, PASA, 28, 215, doi: 10.1071/AS11021
- Norris et al. (2021) Norris, R. P., Marvil, J., Collier, J. D., et al. 2021, PASA, 38, e046, doi: 10.1017/pasa.2021.42
- Ochsenbein et al. (2000) Ochsenbein, F., Bauer, P., & Marcout, J. 2000, A&AS, 143, 23, doi: 10.1051/aas:2000169
- pandas development team (2023) pandas development team, T. 2023, pandas-dev/pandas: Pandas, v2.0.2, Zenodo, doi: 10.5281/zenodo.7979740
- Perley et al. (2011) Perley, R. A., Chandler, C. J., Butler, B. J., & Wrobel, J. M. 2011, ApJ, 739, L1, doi: 10.1088/2041-8205/739/1/L1
- Pineda et al. (2017) Pineda, J. S., Hallinan, G., & Kao, M. M. 2017, ApJ, 846, 75, doi: 10.3847/1538-4357/aa8596
- Pritchard et al. (2021) Pritchard, J., Murphy, T., Zic, A., et al. 2021, MNRAS, 502, 5438, doi: 10.1093/mnras/stab299
- Rayner et al. (2003) Rayner, J. T., Toomey, D. W., Onaka, P. M., et al. 2003, PASP, 115, 362, doi: 10.1086/367745
- Rodríguez-Barrera et al. (2015) Rodríguez-Barrera, M. I., Helling, C., Stark, C. R., & Rice, A. M. 2015, MNRAS, 454, 3977, doi: 10.1093/mnras/stv2090
- Route (2016) Route, M. 2016, ApJ, 830, L27, doi: 10.3847/2041-8205/830/2/L27
- Route & Wolszczan (2012) Route, M., & Wolszczan, A. 2012, ApJ, 747, L22, doi: 10.1088/2041-8205/747/2/L22
- Route & Wolszczan (2016a) —. 2016a, ApJ, 830, 85, doi: 10.3847/0004-637X/830/2/85
- Route & Wolszczan (2016b) —. 2016b, ApJ, 821, L21, doi: 10.3847/2041-8205/821/2/L21
- Sault et al. (1995) Sault, R. J., Teuben, P. J., & Wright, M. C. H. 1995, in Astronomical Society of the Pacific Conference Series, Vol. 77, Astronomical Data Analysis Software and Systems IV, ed. R. A. Shaw, H. E. Payne, & J. J. E. Hayes, 433, doi: 10.48550/arXiv.astro-ph/0612759
- Schrijver (2009) Schrijver, C. J. 2009, ApJ, 699, L148, doi: 10.1088/0004-637X/699/2/L148
- Shimwell et al. (2019) Shimwell, T. W., Tasse, C., Hardcastle, M. J., et al. 2019, A&A, 622, A1, doi: 10.1051/0004-6361/201833559
- Shimwell et al. (2022) Shimwell, T. W., Hardcastle, M. J., Tasse, C., et al. 2022, A&A, 659, A1, doi: 10.1051/0004-6361/202142484
- Tannock et al. (2021) Tannock, M. E., Metchev, S., Heinze, A., et al. 2021, AJ, 161, 224, doi: 10.3847/1538-3881/abeb67
- Treumann (2006) Treumann, R. A. 2006, Astronomy and Astrophysics Review, 13, 229, doi: 10.1007/s00159-006-0001-y
- Truemper (1982) Truemper, J. 1982, Advances in Space Research, 2, 241, doi: 10.1016/0273-1177(82)90070-9
- VanderPlas (2018) VanderPlas, J. T. 2018, ApJS, 236, 16, doi: 10.3847/1538-4365/aab766
- Vedantham et al. (2020) Vedantham, H. K., Callingham, J. R., Shimwell, T. W., et al. 2020, ApJ, 903, L33, doi: 10.3847/2041-8213/abc256
- Vedantham et al. (2023) Vedantham, H. K., Dupuy, T. J., Evans, E. L., et al. 2023, arXiv e-prints, arXiv:2301.01003, doi: 10.48550/arXiv.2301.01003
- Virtanen et al. (2020) Virtanen, P., Gommers, R., Oliphant, T. E., et al. 2020, Nature Methods, 17, 261, doi: 10.1038/s41592-019-0686-2
- Vos et al. (2022) Vos, J. M., Faherty, J. K., Gagné, J., et al. 2022, ApJ, 924, 68, doi: 10.3847/1538-4357/ac4502
- Wenger et al. (2000) Wenger, M., Ochsenbein, F., Egret, D., et al. 2000, A&AS, 143, 9, doi: 10.1051/aas:2000332
- Williams (2018) Williams, P. K. G. 2018, in Handbook of Exoplanets, ed. H. J. Deeg & J. A. Belmonte (Springer Nature), 171, doi: 10.1007/978-3-319-55333-7_171
- Williams & Berger (2015) Williams, P. K. G., & Berger, E. 2015, ApJ, 808, 189, doi: 10.1088/0004-637X/808/2/189
- Williams et al. (2017) Williams, P. K. G., Gizis, J. E., & Berger, E. 2017, ApJ, 834, 117, doi: 10.3847/1538-4357/834/2/117
- Wilson et al. (2011) Wilson, W. E., Ferris, R. H., Axtens, P., et al. 2011, MNRAS, 416, 832, doi: 10.1111/j.1365-2966.2011.19054.x
- Wootten & Thompson (2009) Wootten, A., & Thompson, A. R. 2009, IEEE Proceedings, 97, 1463, doi: 10.1109/JPROC.2009.2020572
- Zapatero Osorio et al. (2006) Zapatero Osorio, M. R., Martín, E. L., Bouy, H., et al. 2006, ApJ, 647, 1405, doi: 10.1086/505484
- Zhang et al. (2021) Zhang, Z., Liu, M. C., Marley, M. S., Line, M. R., & Best, W. M. J. 2021, ApJ, 921, 95, doi: 10.3847/1538-4357/ac0af7