figurec
Kinetics of the xanthophyll cycle and its role in photoprotective memory and response
Abstract
Efficiently balancing photochemistry and photoprotection is crucial for survival and productivity of photosynthetic organisms in the rapidly fluctuating light levels found in natural environments. The ability to respond quickly to sudden changes in light level is clearly advantageous. In the alga Nannochloropsis oceanica we observed an ability to respond rapidly to sudden increases in light level which occur soon after a previous high-light exposure. This ability implies a kind of memory. In this work, we explore the xanthophyll cycle in N. oceanica as a short-term photoprotective memory system. By combining snapshot fluorescence lifetime measurements with a biochemistry-based quantitative model, we show that short-term “memory” arises from the xanthophyll cycle. In addition, the model enables us to characterize the relative quenching abilities of the three xanthophyll cycle components. Given the ubiquity of the xanthophyll cycle in photosynthetic organisms the model described here will be of utility in improving our understanding of vascular plant and algal photoprotection with important implications for crop productivity.
I Introduction
In high-intensity light photosynthetic organisms are unable to utilize all available energy for photochemistry. In order to minimize the formation of damaging reactive oxygen species, the excess energy is dissipated as heat through non-photochemical quenching (NPQ) pathways[1, 2]. The eustigmatophyte alga Nannochloropsis oceanica has a relatively simple NPQ system[3, 4] in comparison to vascular land plants. It consists of two main components: a pH-sensing protein, potentially LHCX1, and the xanthophyll cycle. The xanthophyll cycle in N. oceanica is a shared feature with higher plants, but this alga lacks additional features like state transitions or pigments like lutein and chlorophyll-b.[5, 6, 7] This simplistic nature makes N. oceanica an ideal model organism for studying the essential components of NPQ.
The xanthophyll cycle in N. oceanica consists of the same de-epoxidation steps, from violaxanthin (V) to antheraxanthin (A) to zeaxanthin (Z), and reverse epoxidation steps, as seen in green algae and plants.[6, 8] The enzyme violaxanthin de-epoxidase (VDE), located in the thylakoid lumen, converts V to A to Z upon protonation under high-light (HL) stress. Simultaneously, zeaxanthin epoxidase (ZEP), which is found in the stroma and thought to be constitutively active, reverses the VAZ cycle by epoxidizing Z to A to V[9, 10, 11] (Fig. 1). It is now well-established that the VAZ cycle correlates with activation of energy-dependent quenching, qE, in both N. oceanica[3, 4] and more complex organisms.[12, 13, 14] The fast activating, pH-dependent quenching, qE, in N. oceanica also depends on the protein LHCX1.[4] The mechanism of sensing changes in the thylakoid membrane pH-gradient and whether or not LHCX1 can bind pigments is still under investigation,[15, 16, 4, 17, 18, 19] however the vital role of Z together with a pH-sensing protein in qE is widely achknowledged.[8, 14] The accumulation of A and Z has been observed to correlate with an increase in NPQ throughout a diurnal cycle in plants,[10, 11] and it has been proposed that an additional, slower activating and slow deactivating Z-dependent quenching process also operates in the absence of a pH-gradient sensing protein, termed qZ.[12, 13] However the precise roles of the three xanthophylls and the kinetics of their interconversion in NPQ is not well understood, which is surprising given the prevalence of this widespread three-state photoprotective system in photosynthetic organisms.
In previous work,[20] we utilized a simplified kinetic model of the VAZ cycle that did not include the intermediate A to understand NPQ in N. oceanica. Despite this simplification, the model gave useful insights into the time-scales of processes involved in NPQ activation, and it could quantitatively predict the quenching response, as well as qualitatively predict changes in V and Z concentrations, in response to a variety of regular and irregular light/dark illumination sequences. However, when exploring how the response changed when the dark period was progressively lengthened, it became clear that N. oceanica has short-term “memory” of previous HL exposure which could not be captured by the simplified two-xanthophyll model. This type of memory of previous exposure to stressor events, wherein some organisms remain primed for an extended period to quickly respond to further stress, has been observed for other stressors such as in drought conditions.[21] Various plant species, including Smilax australis, Monstera deliciosa, Vinca minor and Vinca major, have been shown to possess a long-term memory of growth light conditions, which is strongly species dependent. This long-term memory manifests in xanthophyll pool size and composition as well as maximum NPQ levels,[22, 23] an effect we also found evidence for previously in N. oceanica.[20] It has also been shown that in phytoplankton and algae possessing a simpler two-state xanthophyll cycle, the xanthophylls can act as a long-term memory of growth light conditons.[24, 25, 26] In this work we aim to explore the details of short-term photoprotective memory (operating on time-scales hour), complementing existing studies on connections between longer-term light exposure memory and the xanthophyll cycle.
We hypothesise that in response to light stress, the VAZ cycle, and the kinetics of the different de-epoxidation/epoxidation steps, may act as a memory of previous HL exposure.[27] Specifically we propose that the presence of A in a system could keep plants and algae primed to respond to further HL stress, due to the slow rates of transforming A back to V. The role of the partially de-epoxidised xanthophyll A in photoprotection has been difficult to investigate directly, however work on plants has suggested that both A and Z correlate with NPQ in plants,[22, 28] but in this work we also aim to further elucidate its role in photoprotection. Previous work has shown the ratio of the rates from AZ to VA ranges from 4.5–6.3 times faster in various plant species, [29, 30, 31] and the rate of epoxidation has been measured to be 1.4 times faster for Z than A.[11] However precise measurements of these rates in N. oceanica and their functional significance in NPQ and short-term memory of light stress have not been fully explored.
In this work, we aim to fully understand the role of xanthophyll cycle kinetics in photoprotective memory by considering the full VAZ cycle in modelling NPQ, and we show that differential rates of interconversion between the three xanthophylls are responsible for the multiple timescales of photoprotective memory. In a further step towards a comprehensive understanding of NPQ in N. oceanica, the full VAZ model allows us to assess the relative quenching abilities of the three xanthophylls in the qE process, estimate the relative abundance of quenchers in the thylakoid membrane, and also quantify the relative contributions of LHCX1-dependent qE quenching and zeaxanthin-dependent qZ quenching in NPQ. In what follows, we start by briefly presenting our expanded model, then show how it accurately describes the HL stress responses of N. oceanica, and how it encodes the functional role of the VAZ cycle in photoprotection.
II Results
II.1 Kinetic model of xanthophyll-mediated photoprotection
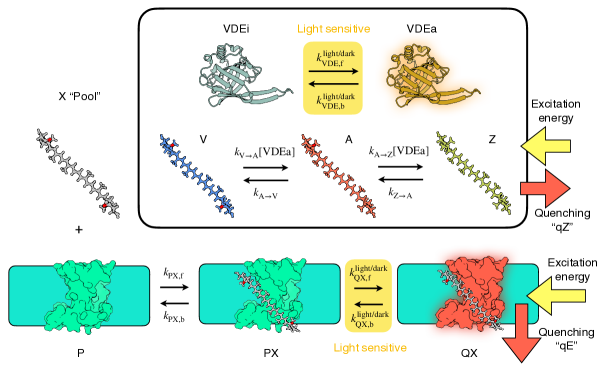
Motivated by measurements of xanthophyll concentrations and NPQ in response to light exposure (as presented in the next section), we have developed a new model for the coupled LHCX1-xanthophyll cycle photoprotection system in N. oceanica, as is summarised schematically in Fig. 1. Before presenting any results, we briefly summarise the features of the model (details of the kinetic equations are given in the SI). In the predecessor to this model,[20] we neglected several important features that are included in the new model presented here, such as the intermediate A, which we will show plays an essential role in photoprotective memory, and the capability of each xanthophyll to act as a quencher, facilitated by LHCX1, which will be important for understanding the immediate response of N. oceanica to light stress. Furthermore, we will show that the new model can quantitatively describe xanthophyll concentrations in cells, enabling us to estimate the absolute abundance of quenching sites in N. oceanica and estimate its absolute quenching rate.
Overall the model involves 12 chemical species: the protein P, the three “pool” xanthophylls X = V, A and Z, three xanthophyll bound complexes PX in the non-quenching state and three in the quenching state QX, and the active (protonated) VDEa and inactive (unprotonated) VDEi forms of the VDE enzyme. Within the model, the protein P, binds the xanthophylls, X=V,A,Z, reversibly to form a complex PX. For simplicity we assume a single labile xanthophyll binding site per P, which we have found that this is sufficient to interpret the available experimental data. This PX complex is activated under HL (high light) conditions to reversibly form an active quencher, establishing the \cePX ¡=¿ QX equilibrium, which we assume arises due to protonation and conformational changes. Previous work has identified LHCX1 as an essential component in activating the protein P, in the qE quenching mechanism,[20, 4, 11] although the actual active quencher PX/QX could involve other proteins, especially since it is not known if LHCX1 binds pigments, and alternatively LHCX1 may just induce the conformational changes in P to activate quenching. Thus the precise identity of PX/QX is open to interpretation. The total fluorescence decay rate of chlorophylls in the membrane at a given time in the experiment is assumed to be related linearly to the concentration of the QX species,
| (1) |
where is the intrinsic fluorescence decay rate of chlorophyll (arising from both the dominant non-radiative and minor radiative pathways), and is the quenching rate constant for the QX complexes which mediate the LHCX1 and pH dependent qE quenching. We also incorporate zeaxanthin-dependent quenching, qZ, into the model by adding a quenching contribution which solely depends on the concentration of zeaxanthin in the “pool”. The quenching rate constant for Z is denoted . We assume that qE and qZ mechanisms are non-radiative, dissipating chlorophyll excitation energy as heat into the environment. From this we can obtain the experimentally measured . We assume that whilst the extent to which PX converts to QX under HL conditions is dependent on X, the quenching rate of each complex in the chloroplast is the same. With the available data we found that it is not possible to ascertain whether the differences in total quenching capacity of the different QX species arise due to differences in quenching rate, or the positions of the \cePX ¡=¿ QX equilibrium under HL conditions. Therefore, for simplicity we treat the quenching rate as being identical for all QX, and we also assume that the equilibrium constant for this process is zero in the dark.
The interconversion of the xanthophylls is assumed to occur after unbinding of X from P, \cePX ¡=¿ P + X. The X species in the model should be regarded as X in the pool on xanthophylls not bound to P. For example, X could be bound to other light-harvesting proteins from which it can unbind rapidly and reversibly. The xanthophylls in the pool can be de-epoxidised sequentially, from \ceV →A and then \ceA →Z, by VDEa, where the maximum turnover rate for the VDE enzyme is different for the two de-epoxidation steps. VDE is assumed to interconvert between VDEa and VDEi forms depending on light conditions. We model this as a simple two-state equilibrium with first-order rate laws for the activation and deactivation. We also treat the epoxidation steps as sequential, first from \ceZ →A then from \ceA →V, and we assume that each epoxidation by the ZEP enzyme can be treated as a first-order rate process, with different epoxidation rates for Z and A.
II.2 Dynamical response of xanthophyll concentrations to light stress
| Rate constant (min-1) | HL conditions | Dark conditions |
|---|---|---|
| 1.3 | 1.0 |
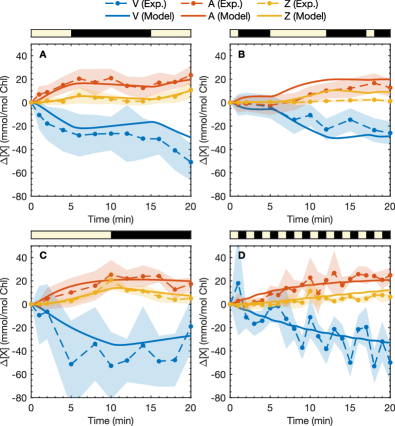
In order to investigate the response of the xanthophyll cycle to fluctuating light conditions, we have measured the changes in concentrations of these pigments in N. oceanica in response to four sequences of high-intensity light exposure: 5 HL- 10 D- 5 HL, 1 HL- 4 D- 7 HL- 5 D- 1 HL- 2 D, 10 HL- 10 D, and 1 HL-1 D, where HL denotes HL, D denotes darkness, and numbers indictate the duration of the exposure in minutes. The HPLC data showed a significant fraction of xanthophylls, particularly V, that remained constant over the time-scale of the experiment, which we believe corresponds to xanthophylls strongly bound to proteins other than LHCX1. The samples were dark-acclimated for 30 min prior to HL exposure to ensure minimal inital amounts of A and Z. Figure 2 shows the change in VAZ cycle carotenoids relative to their initial dark-acclimated values (at ), i.e. and is the concentration of X at . The experimental data show that was greater than [Z] during HL exposures; [A] remained relatively constant during dark periods (Fig. 2), which shows a more rapid dynamical response to reduction in light exposure. In the 5 HL- 10 D- 5 HL sequence (Fig. 2.A), during the 10-minute dark period [Z] decreased almost entirely back to its dark-acclimated value whilst [A] remained constant for the first five minutes of darkness before it began to diminish. Both [A] and [Z] increased in response to the second HL exposure, and the rate of Z accumulation was greater than during the first HL period. Similarly in the 10 HL-10 D sequence (Fig. 2.C), [A] remained at a constant level compared to [Z], which decreased more rapidly back to its dark-acclimated concentration. In the 5 HL- 10 D - 5 HL and 10 HL - 10 D sequences, there was a small amount of continued accumulation of A and Z in the first dark phase for min, indicating a delayed deactivation of the de-epoxidation process, as we found previously in modelling the response of N. oceanica.[20]
Rate constants for xanthophyll interconversion in the model were parameterised based on a reduced form of the full model, fitted to the experimental HPLC data, as detailed in the supporting information. The full model predictions for the HPLC data are also shown in Fig. 2, where we see the model mostly predicts the HPLC data within the experimental fluctuations, although in the 1 HL- 4 D- 7 HL- 5 D- 1 HL- 2 D sequence the model slightly overestimates and after 1 min of light exposure (it should be noted that the fluctuations in xanthophyll concentrations in Fig. 2 D do not correlate with the periodicity of light exposure on close inspection). In Table 1 we summarise the maximum rates for the de-epoxidation processes, defined as , and the epoxidation rates in the light and dark phases, and the rate constant for activation/deactivation (i.e. formation of VDEa from VDEi). We see that VDE activity increases by a factor of around 1000 in HL conditions, and that the VDE de-epoxidises A slightly faster than V, although the difference is small. Conversely for the epoxidation we see that Z is epoxidised nearly twice as fast as A. In our model we find that the VDE enzyme takes just over 1 min to activate and deactivate in both the light and dark phases, which is consistent with the continuing increase in A and Z concentrations observed at the start of the dark phases in the HPLC experiments.
II.3 Modelling NPQ response of N. oceanica to light exposure
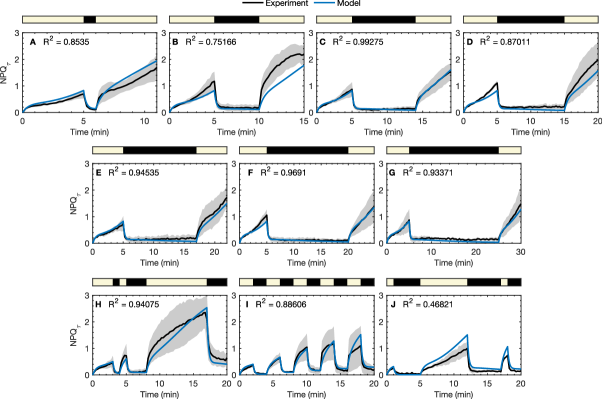
Time correlated single photon counting (TCSPC) experiments were also performed on N. oceanica to measure in response to sequences of HL/dark exposure. In addition to 20 minute regular and irregular light sequences that were utilized in previous work,[20] seven new HL/dark cycles were utilized to ascertain how long algae retain their “photoprotective memory” of previous HL exposure. The sequences had increasing dark durations ( = 1, 5, 9, 10, 12, 15, 20 min) between two five-minute HL periods. The model was employed to describe dynamics of N. oceanica in response to various HL/dark exposure sequences, with parameters determined by fitting a subset of the the sequences, namely the 5 HL-9 D-5 HL, 5 HL-15 D-5 HL, 3 HL-1 D-1 HL-3 D-9 HL-3 D, 1 HL-2 D-7 HL-5 D-1 HL-2 D, 2 HL-2 D sequences [Fig. 3 C,F,H,J]. Further details of this fitting procedure are given in the Methods section and supporting information.
The experimental data are shown in Fig. 3. We see rapid NPQ activation and deactivation in response to changes in light levels, occurring on a timescale of less than 1 min, together with a slower increase in during light exposure. The rapid component of activation and deactivation arising from the pH-sensing protein corresponds to the equilibration rate for the \cePX ¡=¿ QX equilibrium in the model, given by . This equilibration rate is 2.1 min-1 under light conditions and 4.7 min-1 in the dark which gives an activation time of s and a deactivation time of s. Experimental data for the 5 HL- D-5 HL sequences, Fig. 3A–G, show how recovers after various dark durations, directly probing the photoprotective memory of N. oceanica. The component recovered to its value at the end of the initial light period ( min) within 1 min upon secondary light exposure when dark durations were up to min, and even with a 20 min dark duration the recovered within 3 min.
In addition to the HPLC data in Fig. 2, the model is able to predict the average levels for all the sequences as shown in Fig. 3, including sequences other than those in the training datasets. Differences between the model predictions and experiments were generally comparable to the variability between experimental runs. For example at the end of the first five minutes of light exposure, in the 5 HL- D- 5HL sequences (Fig. 3.A-G) the experimental varies between around 0.8 and 1.4, although some discrepancies may be attributed to shortcomings of the model. Specifically the over-prediction of for the 1 HL-2 D-7 HL-5 D-1 HL-2 D, 2 HL-2 D sequence [Fig. 3.J] in the second light phase could be attributed to VDE activating too fast, as is seen in both the HPLC data and modelling [Fig. 2.B].
| X | Violaxanthin | Antheraxanthin | Zeaxanthin |
|---|---|---|---|
In the model the position of the \cePX ¡=¿ QX equilibrium under HL conditions determines how well each of the xanthophylls can act as a quencher in qE. The maximum fraction of P-bound X that can exist in the QX state under HL conditions, denoted , determines the quenching capacity of each xanthophyll within our model. This can be expressed as
| (2) |
where is the equilibrium constant for the \cePX ¡=¿ QX process under HL conditions determined from fitting the model to the experimental data. In Table 2 we list these values for our model under light and dark conditions, obtained from fitting the model to the experimental curves. From the values we find that A is approximately three times more effective a quencher than V, and Z is nearly 10 times more effective than V. From the model we can also quantify the relative contributions of qE and qZ to the overall quenching, by the ratio of to , which is found to be .
II.4 NPQ in N. oceanica mutants
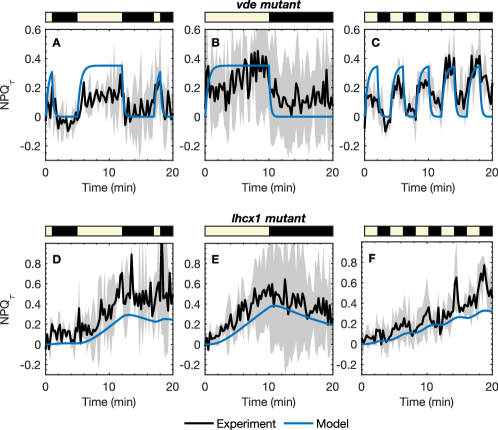
To further test the model, we have modified the wild type (WT) N. oceanica parameterised model to predict the NPQ response of two N. oceanica mutants: the vde and lhcx1 mutants. The response of the vde mutant, which has VDE knocked out preventing the accumulation of Z, was modeled utilizing parameters obtained from the WT model with and to zero. The response was measured for three HL/D sequences, shown in Fig. 4.A–C together with model predictions. Even in the absence of A and Z, increases near-instantaneously to around 0.3 in response to light, demonstrating the relevant role of LHCX1 in the vde mutant. However, because of V’s low quenching capacity, the response is significantly smaller than that seen in WT, and there is no steady increase of over the duration of the experiment, unlike in the WT N. oceanica. The model captures the response of the vde mutant remarkably well, despite not being parameterised with these data.
We have also modelled the response of the lhcx1 mutant, in which LHCX1 is not expressed and only zeaxanthin-mediated qZ quenching operates. This was modelled by simply setting , removing the qE quenching process, while holding the total xanthophyll concentration constant. The experimental data and model predictions are shown in Fig. 4.D–F, where we see the model accurately captures the slow rise of in the light phases, arising from the build-up of Z during light exposure, and the slower decay in the dark phases due to slow epoxidation of Z. The success of the model in predicting the NPQ response of the lhcx1 mutant strongly supports the interpretation of the kinetic model species “P” as involving or at least requiring LHCX1 to function.
III Discussion
Our combined experimental and kinetic model results suggest that photoprotective memory in N. oceanica can be explained qualitatively with a simple three-state model. The three-state system should consist of a poor quencher (V), a modest quencher (A), and a good quencher (Z). After a sample has sufficiently accumulated the good quencher, during brief dark/low-light periods, Z remains before being converted back to the modest quencher (A), acting as short-term memory. However, during extended dark durations, Z will be converted almost entirely to A. Whilst A is also converted back to V, the AV transition occurs at a slower rate such that during another HL exposure occurs, the Z pool can form more rapidly from the reservoir of A. We can also see this dynamic represented in the HPLC data (Fig. 2). By adding the intermediate step in the VAZ cycle, the model not only more accurately reflects the biochemical processes but also allows for the short-term photoprotective memory, over time-scales between 1 min to min, to be modelled and understood.
From our experiments and modeling, we have also been able to determine the relative quenching capacities of the different xanthophylls. We find that V facilitates a weak but rapid response to changes in HL. The vde mutant demonstrates that even without an effective quencher like Z, there is still an response to fluctuating light. In very short bursts of HL, V may act as the main quencher but the switch between its roles in photochemistry and photoprotection is determined by the pH gradient, as suggested previously.[32]
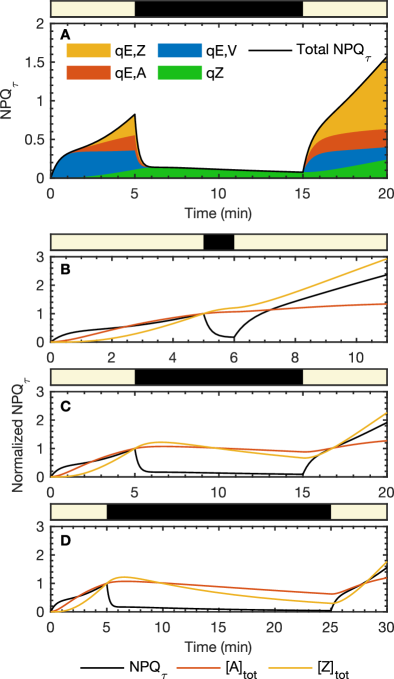
As the intermediate step in the VAZ cycle, A’s role as a potential quencher in qE is often overlooked. With a quenching capacity of around 30%, it is 3.5 times less efficient than Z (95%) at dissipating excess energy. However, it plays a crucial role in photoprotection in facilitating NPQ recovery after long dark durations. In Fig. 5 we show a breakdown of the response predicted by the model for the 5 HL-10 D-5 HL sequence, where we see at short times the main quencher in qE is actually V complexed with LHCX1, with contributions from A emerging at min and Z at min. After light exposures of more than 2 min, Z functions as the primary quencher, with small, but not insignificant, contributions from V and A. Whilst LHCX1-dependent qE makes the largest contribution to , qZ also makes a small contribution, and within the model this is the sole contributor to the long-lived response in the dark. Even for very long-time light exposure, the model predicts that LHCX1-dependent qE dominates over qZ, with qZ making up only of the total in this limit, whilst the LHCX1-Zeaxanthin qE accounts for the majority () of the limiting . It should be noted that this limit is based on extrapolating the model to light exposure times beyond those which we have investigated, which may not be reliable, and we also expect the relative contributions of qE and qZ to depend strongly on species and growth conditions, as has been found in studies of plants.[22, 33, 34] We have not suggested a microscopic model for the qZ process, although in the SI, Sec. S.4, we show how a quenching process depending on some other zeaxanthin binding protein (or protein complex) P’ would be consistent with our simple model. Zeaxanthin binding to some other protein could activate qZ by directly quenching excitation energy, potentially via charge transfer, or inducing conformational changes in the protein that promote other quenching mechanisms.[35, 36, 37]
An essential element of the three-state photoprotective memory system observed in N. oceanica is the kinetics of xanthophyll cycle, which together with the quenching capacities of the xanthophylls creates an effective photoprotective system. Upon the first exposure to light, NPQ activation is limited by moving through two steps before Z, the primary quencher, is accumulated, where VDE activation and the VA step (with a half life of min) control the initial rate of NPQ activation. Z may still function as a moderate quencher in the dark through qZ, so fast conversion of ZA by ZEP (half life min) in the dark is necessary to facilitate efficient photosynthesis under low light conditions. The slower kinetics of AV in the dark (with a half life min) enables A to function as a buffer, facilitating rapid NPQ reactivation if light levels fluctuate again to damaging levels. The fast AZ conversion by VDE on light exposure (with a half-life of min) also plays an essential role in photoprotective memory by enabling the buffer of A to be rapidly converted to an active quencher. Previous work in plants found the rate of de-epoxidation of A to be about 4 times faster than that of V,[29, 30, 31] which is a much larger difference compared to the de-epoxidation rates that we have found, with de-epoxidation of A being only about 1.5 times faster than that of V. However, VDE activity is influenced by the thylakoid lumen acidity, availability of ascorbate, and potentially unique species-specific differences, any of which could explain this discrepancy. Furthermore, because VDE is not active in the dark, the relative activity of ZEP on Z and A is far more relevant to photoprotective memory than the relative activity of VDE on V and A. On top of the slower time-scale kinetics of the VAZ cycle, which control the maximum quenching capacity of the system, very rapid responses to light fluctuations, on time-scales of around 1 min or less, are facilitated by protonation and subsequent conformational changes of the quenching protein which binds the xanthophylls.
From the model we can directly probe how the total A and Z concentrations vary during the 5 HL- D- 5HL sequences to demonstrate the functional role of xanthophyll cycle kinetics in photoprotective memory. Here we show in Fig. 5 the model and the total A and Z concentrations normalized by their values at min. For very short dark phase ( min, Fig. 5.B) Z continues to accumulate (due to the finite deactivation time of VDE in our model), acting as short-term light exposure memory and the recovers very rapidly upon re-illumination. For intermediate and longer lengths of dark duration ( min, Fig. 5.C and min, Fig. 5.D), the quencher Z decreases but A remains steady, presumably acting as a buffer, and thus as a short-term memory for excess light exposure, and facilitating a fast response to HL in the second light phase. In these cases, that the response in the second HL phase correlates most strongly with the A concentration, and not the Z concentration. In the supporting information, Fig. S2, we show the experimental and model recovery, averaged over the first minute of HL, in the second light phase for the 5 HL- D- 5HL sequences, as a function of dark duration . From this we have extracted (see SI for details) an memory time-scale of min, which matches the model time-scale given by min. This strongly suggests that antheraxanthin acts as a short-term memory for light exposure, with the step of the xanthophyll cycle controlling the effective memory time-scale. It has previously been observed that xanthophyll composition correlates with photoprotection, long- and medium-term light-exposure memory and light-levels during growth in plants[34, 23], phytoplankton[24, 25] and algae.[26] We can now however add to this picture that the kinetics of the xanthophyll cycle also plays an important role in short-term photoprotective memory.
One important quantity we can estimate from this study is the lifetime of Chl-a excitations on the active quenching complexes QX. Firstly from the HPLC data and model we obtain an estimate of the total concentration of P (possibly LHCX1 or LHCX1 in a complex with other proteins) in the system as approximately 0.6 mmol/mol Chl. Assuming roughly ten Chl-a molecules per light-harvesting protein, this means the species P makes up approximately 1 in 30 light harvesting proteins in N. oceanica. Using this ratio of P to the other light-harvesting proteins and assuming excitation energy diffusion between proteins is faster than quenching, we can estimate the lifetime of Chl-a* on the active quenchers to be less than 10 ps (further details of this calculation are given in the SI, Sec. S.4). This approximate time-scale is roughly consistent the quenching time-scale in HL acclimated N. oceanica observed in transient-absorption experiments of 8 ps[4] (especially given the simplifying assumptions we use to deduce our estimate). Recent work has suggested that quenching can be limited by excitation energy redistribution within and between light-harvesting proteins,[38, 36, 39] so the actual quenching process (likely either excitation energy transfer or charge transfer quenching[4]) may need to occur on an even shorter time-scale than this estimate.
IV Conclusion
In this work, we have presented a model of xanthophyll cycle mediated non-photochemical quenching in N. oceanica, which can both accurately describe the short and intermediate timescale responses of N. oceanica to HL stress and the accompanying changes in xanthophyll concentrations. Employing a combination of experiments and modelling we have developing a deeper understanding of the photoprotective roles of the xanthophylls together with LHCX1. From this we have suggested a three-state model for short time-scale photoprotection in N. oceanica, where the zeaxanthin-LHCX1 system acts as the primary quencher, with antheraxanthin acting as a short-term “memory” of HL stress capable of facilitating rapid response to fluctuations in light levels, and violaxanthin deactivating quenching under low-light conditions. This adds to the established picture of xanthophyll composition correlating for long-term memory of light-exposure.[22] Although we cannot conclusively identify the qE quencher, PX/QX, we can say that LHCX1 is an essential component of this system. We have also been able to estimate the chlorophyll excitation lifetime on active quenching proteins as less than 10 ps, as well as the relative abundance of quenchers in the thylakoid membrane. Evidence for zeaxanthin-dependent but LHCX1-independent qZ quenching has also been found, although its contribution to NPQ appears to be much smaller than that of LHCX1-dependent qE quenching. However, the propotion of qE or qZ contributions are going to vary depending on the species [40]. In order to implement a similar model of NPQ for use in vascular plants, more components need to be incorporated such as quenching due to lutein and state transitions,[5, 6, 7] which are not present in N. oceanica. However, we believe the model presented here provides a basis for building a quantitative model of NPQ responses for plants and other photosynthetic organisms, which are mediated by the same xanthophyll cycle.
Acknowledgements
The experimental work was supported by the U.S. Department of Energy, Office of Science, Chemical Sciences, Geosciences and Biosciences Division through FWP 449B to K.K.N and G.R.F. T.P.F. and D.T.L. were supported by the U.S. Department of Energy, Office of Science, Basic Energy Sciences, CPIMS Program Early Career Research Program under Award DE-FOA0002019. K.K.N. is an investigator of the Howard Hughes Medical Institute. We also thank Reviewer 1 for their useful comments in placing this work in broader context in the study of photoprotective memory.
Supporting Information
Details of the model kinetic equations and simplification for analysis of HPLC data. Details of the model parameters. Analysis to obtain estimates of quencher abundance and quenching lifetime. Full HPLC data for the WT HL/dark sequences.
Data availability
Source data are provided with this paper. All data presented in this manuscript is available at www.doi.org/10.5281/zenodo.8284422.
Code availability
All Matlab code used to run the model and produce figures in this manuscript is available at www.doi.org/10.5281/zenodo.8284422.
Competing interests
All authors declare no competing interests.
Author contributions
GRF and AS conceived the research. AS performed all spectroscopic and HPLC experiments, and performed initial data analysis. TPF developed and implemented the model and performed final data analysis. TC prepared all algal samples and generated mutants. RM assisted AS in performing experiments. AS, TPF and GRF wrote the manuscript. AS, TPF, TC, GRF, DTL, and KKN discussed results and commented on the manuscript. DTL, KKN and GRF procured funding.
These authors contributed equally: Audrey Short, Thomas P. Fay.
Methods
IV.1 Algal growth conditions
N. oceanica CCMP1779[6] was obtained from the National Center for Marine Algae and Microbiota (https://ncma.bigelow.org/) and cultivated in F2N medium[41]. Liquid cultures were grown to 2-5 107 cells/mL in continuous light at a photon flux density of 60 mol photons m-2 s-1 at 22∘C or room temperature.
The knock-out mutants vde and lhcx1 were generated using homologous recombination of a hygromycin resistance cassette was used, with the addition of Cas9 RNP for lhcx1. Further details of how the mutants were generated will be presented in a separate manuscript.
IV.2 Time-correlated single photon counting
Time-correlated single photon counting results in a histogram of Chl-a fluorescence decay, which is then fit to a biexponential decay function yielding an average lifetime (). Fluorescence lifetime measurements were taken every 15 seconds to capture the change in fluorescence lifetimes as a function of HL exposure. The amplitude- weighted average lifetime of the Chl-a fluorescence decay is converted into a unitless form, similar to that measured in the conventional pulse-amplitude modulation technique using the following equation: where and are the average lifetimes in the dark and at any time point t, respectively, during the experiment.
| (3) |
An ultrafast Ti:sapphire coherent Mira 900 oscillator was pumped using a diode laser (Coherent Verdi G10, 532 nm). The center wavelength of the oscillator was 808 nm with a full width at half maximum of 9 nm. After frequency doubling the wavelength to 404 nm with a -barium borate crystal, the beam was split between the sample and a sync photodiode, which was used as a reference for snapshot measurements. Three synchronized shutters controlled the exposure of actinic light and the laser to the sample as well as to the microchannel plate-photomultiplier tube detector (Hamamatsu106 R3809U). The shutters were controlled by a LABVIEW software sequence. The detector was set to 680 nm to measure Chl-a emission. During each snapshot, the laser and detection shutters were opened, allowing an excitation pulse with a power of 1.7 mW to saturate the reaction center for 1 second while the emission was recorded. During HL periods, samples were exposed to white light with an intensity of 885 mol photons m-2 s-1 (Leica KL 1500 LCD, peak 648 nm, FWHM 220 nm ) by opening the actinic light shutter. The N. oceanica sample was concentrated at 40 g Chl mL-1. To do this, 1 mL of N. oceanica culture was pelleted for 5 minutes at room temperature at 14000 x RMP, flash frozen in liquid nitrogen, thawed at room temperature, and broken using FastPrep-24 (MP Biomedicals LLC) at 6.5 m/s for 60 seconds. The pellet was flash frozen and broken two more times. Chlorophyll was extracted from the broken cells using 1 mL of 80% acetone, and total chlorophyll in the culture was quantified according to Porra et al..[42] The culture was then concentrated by centrifuging for 5 minutes at room temperature at 4000 RPM. Samples were dark-acclimated for 30 minutes prior to the experiment and placed in the custom-built sample holder on a sample stage. The LABVIEW sequence was altered for each regular, irregular, and dark duration sequence run to control exposure to light fluctuations. For the experiments three technical replicates were performed for the WT and three for each mutant. Two experimental replicates were performed for the 5 HL- D-5 HL experiments and the training data for the model. Only one experimental replicate was performed for the mutants.
IV.3 High performance liquid chromatography
Aliquots of N. oceanica in F2N media were taken at various time points during several regular and irregular HL/dark duration actinic light sequences. Samples were then flash frozen in liquid nitrogen. After thawing, the samples were pelleted for 5 minutes at 4∘C at 14000 RPM to reach a cell count of 45-60. The cells were washed twice with \cedH2O and pelleted at 14,000 RPM for 5 minutes. The cells were again flash frozen and thawed at room temperature followed by breaking the cells using FastPrep-24 (MP Biomedicals LLC) at 6.5 m/s for 60 seconds. The bead beating step was repeated once before adding 200 L of 100% cold acetone. The samples were centrifuged for 10 minutes (14000 RPM, 4∘C), and the supernatant was filtered (0.2 m nylon filter) into HPLC vials. The supernatant was separated on a Spherisorb S5 ODS1 4.6- 250 mm cartridge column (Waters, Milford, MA) at 30∘C. Analysis was completed using a modification of García-Plazaola and Becerril [43] . Pigments were extracted with a linear gradient from 14% solvent A (0.1M Tris-HCl pH 8.0 ddH20), 84% (v/v) solvent B (acetonitrile), 2.0% solvent C (methanol) for 15 minutes, to 68% solvent C and 32% solvent D (ethyl acetate) for 33 min, and then to 14% solvent A (0.1M Tris-HCl pH 8.0 ddH2O), 84% (v/v) solvent B (acetonitrile) , 2.0% solvent C (methanol) for 19 min. The solvent flow rate was 1.2 mL min-1. Pigments were detected by A445 with reference at 550 nm by a diode array detector. Standard curves were prepared from concentrated pigments. The HPLC peaks were normalized to the total Chl-a concentration.
IV.4 Model details
Each step of the model given in Fig. 1 is treated as an elementary reaction step in the 12 species model. As described on our previous work,[20] we cannot determine from these experiments the absolute concentration of VDE, so we replace the VDE species with a dynamical quantity representing the activity of VDE at a time relative to its maximum possible value. We also work in a reduced unit system defined for species B by , where is the fluorescence lifetime at . With these reduced variables , where is the change in reduced concentration of QX relative to the value, and likewise for .
The model parameters were fitted by minimising the sum of square differences between the model and the experimental for the 5 HL-9 D-5 HL, 5 HL-15 D-5 HL, 3 HL-1 D-1 HL-3 D-9 HL-3 D, 1 HL-2 D-7 HL-5 D-1 HL-2 D, 2 HL-2 D sequences. Parameters for the VAZ interconversion steps were estimated from a least squares fit of a reduced model, which is a simple first order kinetic model with activation of the VDE enzyme, to the HPLC data (this is detailed in the SI). In the rest of the parameter fitting these parameters were constrained to only vary by 50%. Additionally, to reduce the number of free parameters, the forward and backward binding rate constants and , and the activation rate to form QX, , were set to be independent of the species X. This way the equilibrium constant is the only parameter in the model controlling the quenching capacity of each xanthophyll. The remaining parameters were fitted first using Matlab’s “globalsearch” function from an initial guess based on our previous model. This was then refined using the “patternsearch” algorithm. Errors in the fitted parameters were estimated by bootstrapping the experimental time series 1000 times. The conversion factor from reduced units to the mmol / mol Chl units the HPLC data are reported in was found using a simple least squares fit between the experimental HPLC and model values shown in Fig. 2. Full details of the model kinetic equations and the full parameter set are given in the SI.
References
- Demmig‐Adams and Adams [2006] B. Demmig‐Adams and W. W. Adams, “Photoprotection in an ecological context: the remarkable complexity of thermal energy dissipation,” New Phytologist 172, 11–21 (2006).
- Ledford and Niyogi [2005] H. K. Ledford and K. K. Niyogi, “Singlet oxygen and photo‐oxidative stress management in plants and algae,” Plant, Cell & Environment 28, 1037–1045 (2005).
- Chukhutsina et al. [2017] V. U. Chukhutsina, R. Fristedt, T. Morosinotto, and R. Croce, “Photoprotection strategies of the alga Nannochloropsis gaditana,” Biochimica et Biophysica Acta - Bioenergetics 1858, 544—552 (2017).
- Park et al. [2019] S. Park, C. J. Steen, D. Lyska, A. L. Fischer, B. Endelman, M. Iwai, K. K. Niyogi, and G. R. Fleming, “Chlorophyll–carotenoid excitation energy transfer and charge transfer in Nannochloropsis oceanica for the regulation of photosynthesis,” Proceedings of the National Academy of Sciences of the United States of America 116, 3385—3390 (2019).
- Litvin et al. [2016] R. Litvin, D. Bina, M. Herbstova, and Z. Gardian, “Architecture of the light-harvesting apparatus of the eustigmatophyte alga Nannochloropsis oceanica,” Photosynthesis Research 130, 137—150 (2016).
- Vieler et al. [2012] A. Vieler, G. Wu, C.-H. Tsai, B. Bullard, A. J. Cornish, C. Harvey, I.-B. Reca, C. Thornburg, R. Achawanantakun, C. J. Buehl, M. S. Campbell, D. Cavalier, K. L. Childs, T. J. Clark, R. Deshpande, E. Erickson, A. A. Ferguson, W. Handee, Q. Kong, X. Li, B. Liu, S. Lundback, C. Peng, R. L. Roston, Sanjaya, J. P. Simpson, A. TerBush, J. Warakanont, S. Zäuner, E. M. Farre, E. L. Hegg, N. Jiang, M.-H. Kuo, Y. Lu, K. K. Niyogi, J. Ohlrogge, K. W. Osteryoung, Y. Shachar-Hill, B. B. Sears, Y. Sun, H. Takahashi, M. Yandell, S.-H. Shiu, and C. Benning, “Genome, Functional Gene Annotation, and Nuclear Transformation of the Heterokont Oleaginous Alga Nannochloropsis oceanica CCMP1779,” PLoS Genetics 8, e1003064 (2012).
- Llansola-Portoles et al. [2017] M. J. Llansola-Portoles, R. Litvin, C. Ilioaia, A. A. Pascal, D. Bina, and B. Robert, “Pigment structure in the violaxanthin–chlorophyll-a-binding protein VCP,” Photosynthesis Research 134, 51–58 (2017).
- Demmig-Adams et al. [2020a] B. Demmig-Adams, J. J. Stewart, M. López-Pozo, S. K. Polutchko, and W. W. Adams, “Zeaxanthin, a Molecule for Photoprotection in Many Different Environments,” Molecules 25, 5825 (2020a).
- Yamamoto [1979] H. Y. Yamamoto, “Biochemistry of the violaxanthin cycle in higher plants,” Pure and Applied Chemistry , 639–648 (1979).
- Demmig-Adams and Adams [1993] B. Demmig-Adams and W. W. Adams, “Carotenoids in Photosynthesis,” Plant Physiol. , 206–251 (1993).
- Goss, Lepetit, and Wilhelm [2006] R. Goss, B. Lepetit, and C. Wilhelm, “Evidence for a rebinding of antheraxanthin to the light-harvesting complex during the epoxidation reaction of the violaxanthin cycle,” Journal of Plant Physiology 163, 585–590 (2006).
- Nilkens et al. [2010] M. Nilkens, E. Kress, P. Lambrev, Y. Miloslavina, M. Müller, A. R. Holzwarth, and P. Jahns, “Identification of a slowly inducible zeaxanthin-dependent component of non-photochemical quenching of chlorophyll fluorescence generated under steady-state conditions in Arabidopsis,” Biochimica et Biophysica Acta (BBA) - Bioenergetics 1797, 466–475 (2010).
- Goss and Lepetit [2015] R. Goss and B. Lepetit, “Biodiversity of NPQ,” Journal of Plant Physiology 172, 13–32 (2015).
- Perin et al. [2023] G. Perin, A. Bellan, T. Michelberger, D. Lyska, S. Wakao, K. K. Niyogi, and T. Morosinotto, “Modulation of xanthophyll cycle impacts biomass productivity in the marine microalga Nannochloropsis,” (2023), 10.1101/2022.08.16.504082, Proceedings of the National Academy of Sciences.
- Buck et al. [2019] J. M. Buck, J. Sherman, C. R. Bártulos, M. Serif, M. Halder, J. Henkel, A. Falciatore, J. Lavaud, M. Y. Gorbunov, P. G. Kroth, P. G. Falkowski, and B. Lepetit, “Lhcx proteins provide photoprotection via thermal dissipation of absorbed light in the diatom Phaeodactylum tricornutum,” Nature Communications 10, 4167 (2019).
- Giovagnetti et al. [2021] V. Giovagnetti, M. Jaubert, M. K. Shukla, P. Ungerer, J.-P. Bouly, A. Falciatore, and A. V. Ruban, “Biochemical and molecular properties of LHCX1, the essential regulator of dynamic photoprotection in diatoms,” Plant Physiology (2021), 10.1093/plphys/kiab425.
- Taddei et al. [2018] L. Taddei, V. U. Chukhutsina, B. Lepetit, G. R. Stella, R. Bassi, H. van Amerongen, J.-P. Bouly, M. Jaubert, G. Finazzi, and A. Falciatore, “Dynamic changes between two lhcx-related energy quenching sites control diatom photoacclimation,” Plant Physiology 177, 953–965 (2018).
- Lacour, Babin, and Lavaud [2020] T. Lacour, M. Babin, and J. Lavaud, “Diversity in xanthophyll cycle pigments content and related nonphotochemical quenching (NPQ) among microalgae: Implications for growth strategy and ecology,” Journal of Phycology 56, 245–263 (2020).
- Buck, Kroth, and Lepetit [2021] J. M. Buck, P. G. Kroth, and B. Lepetit, “Identification of sequence motifs in lhcx proteins that confer qE-based photoprotection in the diatom Phaeodactylum tricornutum,” Plant Journal 108, 1721–1734 (2021).
- Short et al. [2022] A. H. Short, T. P. Fay, T. Crisanto, J. Hall, C. J. Steen, K. K. Niyogi, D. T. Limmer, and G. R. Fleming, “Xanthophyll-cycle based model of the rapid photoprotection of Nannochloropsis in response to regular and irregular light/dark sequences,” The Journal of Chemical Physics 156, 205102 (2022).
- Sadhukhan et al. [2022] A. Sadhukhan, S. S. Prasad, J. Mitra, N. Siddiqui, L. Sahoo, Y. Kobayashi, and H. Koyama, “How do plants remember drought?” Planta 256, 7 (2022).
- Demmig-Adams et al. [2022] B. Demmig-Adams, S. K. Polutchko, J. J. Stewart, and W. W. Adams, “History of excess-light exposure modulates extent and kinetics of fast-acting non-photochemical energy dissipation,” Plant Physiology Reports 27, 560–572 (2022).
- Demmig-Adams et al. [2020b] B. Demmig-Adams, J. J. Stewart, W. W. Adams, M. López-Pozo, and S. K. Polutchko, “Zeaxanthin, a molecule for photoprotection in many different environments,” Molecules 25 (2020b), 10.3390/MOLECULES25245825.
- Polimene et al. [2012] L. Polimene, C. Brunet, J. I. Allen, M. Butenschön, D. A. White, and C. A. Llewellyn, “Modelling xanthophyll photoprotective activity in phytoplankton,” Journal of Plankton Research 34, 196–207 (2012).
- Bidigare et al. [2014] R. R. Bidigare, F. R. Buttler, S. J. Christensen, B. Barone, D. M. Karl, and S. T. Wilson, “Evaluation of the utility of xanthophyll cycle pigment dynamics for assessing upper ocean mixing processes at station aloha,” Journal of Plankton Research 36, 1423–1433 (2014).
- Galindo et al. [2017] V. Galindo, M. Gosselin, J. Lavaud, C. J. Mundy, B. Else, J. Ehn, M. Babin, and S. Rysgaard, “Pigment composition and photoprotection of arctic sea ice algae during spring,” Marine Ecology Progress Series 585, 49–69 (2017).
- Esteban et al. [2015] R. Esteban, J. F. Moran, J. M. Becerril, and J. I. García-Plazaola, “Versatility of carotenoids: An integrated view on diversity, evolution, functional roles and environmental interactions,” Environmental and Experimental Botany 119, 63–75 (2015).
- Demmig-Adams and Iii [1996] B. Demmig-Adams and W. W. A. Iii, “Xanthophyll cycle and light stress in nature: uniform response to excess direct sunlight among higher plant species,” Planta 198, 460–470 (1996).
- Hartel et al. [1996] H. Hartel, H. Lokstein, B. Grimm, and B. Rank, “Kinetic Studies on the Xanthophyll Cycle in Barley Leaves (Influence of Antenna Size and Relations to Nonphotochemical Chlorophyll Fluorescence Quenching),” Plant Physiology 110, 471–482 (1996).
- Siefermann [1972] D. Siefermann, “Kinetic Studies on the Xanthophyll Cycle of Lemna gibba L. - Influence of Photosynthetic Oxygen and Supplied Reductor,” Photosynthesis, two centuries after its discovery by Joseph Priestley , 629–635 (1972).
- Yamamoto and Higashi [1978] H. Yamamoto and R. Higashi, “Violaxanthin de-epoxidase lipid composition and substrate specificity,” Archives of Biochemistry and Biophysics 190, 514–522 (1978).
- Horton and Ruban [2005] P. Horton and A. Ruban, “Molecular design of the photosystem II light-harvesting antenna: photosynthesis and photoprotection,” Journal of Experimental Botany 56, 365–373 (2005).
- Havaux et al. [1999] M. Havaux, †, , and K. K. Niyogi, “The violaxanthin cycle protects plants from photooxidative damage by more than one mechanism,” Plant Biology 96, 8762–8767 (1999).
- Demmig-Adams et al. [2012] B. Demmig-Adams, C. M. Cohu, O. Muller, and W. W. Adams, “Modulation of photosynthetic energy conversion efficiency in nature: From seconds to seasons,” Photosynthesis Research 113, 75–88 (2012).
- Lapillo et al. [2020] M. Lapillo, E. Cignoni, L. Cupellini, and B. Mennucci, “The energy transfer model of nonphotochemical quenching: Lessons from the minor cp29 antenna complex of plants,” Biochimica et Biophysica Acta (BBA) - Bioenergetics 1861, 148282 (2020).
- Cupellini et al. [2020] L. Cupellini, D. Calvani, D. Jacquemin, and B. Mennucci, “Charge transfer from the carotenoid can quench chlorophyll excitation in antenna complexes of plants,” Nature Communications 11, 662 (2020).
- Cignoni et al. [2021] E. Cignoni, M. Lapillo, L. Cupellini, S. Acosta-Gutiérrez, F. L. Gervasio, and B. Mennucci, “A different perspective for nonphotochemical quenching in plant antenna complexes,” Nature Communications 12, 7152 (2021).
- Bennett, Fleming, and Amarnath [2018] D. I. Bennett, G. R. Fleming, and K. Amarnath, “Energy-dependent quenching adjusts the excitation diffusion length to regulate photosynthetic light harvesting,” Proceedings of the National Academy of Sciences of the United States of America 115, E9523–E9531 (2018).
- Fay and Limmer [2022] T. P. Fay and D. T. Limmer, “Coupled charge and energy transfer dynamics in light harvesting complexes from a hybrid hierarchical equations of motion approach,” The Journal of Chemical Physics 157, 174104 (2022).
- López-Pozo et al. [2023] M. López-Pozo, W. W. Adams, S. K. Polutchko, and B. Demmig-Adams, “Terrestrial and Floating Aquatic Plants Differ in Acclimation to Light Environment,” Plants 12, 1928 (2023).
- Kilian et al. [2011] O. Kilian, C. S. E. Benemann, K. K. Niyogi, and B. Vick, “High-efficiency homologous recombination in the oil-producing alga Nannochloropsis sp.” Proceedings of the National Academy of Sciences 108, 21265–21269 (2011).
- Porra, Thompson, and Kriedemann [1989] R. Porra, W. Thompson, and P. Kriedemann, “Determination of accurate extinction coefficients and simultaneous equations for assaying chlorophylls a and b extracted with four different solvents: verification of the concentration of chlorophyll standards by atomic absorption spectroscopy,” Biochimica et Biophysica Acta (BBA) - Bioenergetics 975, 384–394 (1989).
- García‐Plazaola and Becerril [1999] J. I. García‐Plazaola and J. M. Becerril, “A rapid high‐performance liquid chromatography method to measure lipophilic antioxidants in stressed plants: simultaneous determination of carotenoids and tocopherols,” Phytochemical Analysis 10, 307–313 (1999).