Study of the process in the energy range = 1.07 – 2 GeV
Abstract
The cross section is measured in the center-of-mass energy range from 1.07 to 2.00 GeV in the decay channel , . The data set with an integrated luminosity of 242 pb-1 accumulated in the experiment with the SND detector at the VEPP-2000 collider is analyzed.
1 Introduction
Radiative decays are one of the best tools for study of the internal structure of hadrons. For light vector mesons, these decays have been studied for more than 50 years. The decay probabilities of the , , and resonances into the final state are currently measured with an accuracy of 7%, 9%, and 2%, respectively. Moreover, for and mesons, the uncertainty is still determined by statistics. The most accurate measurements of , , and decays were made in the SND [1] and CMD-2 [2] experiments at the VEPP-2M collider.
In experiments, the directly measured quantity is the cross section for the process . The decay probabilities can be determined from the fit to the cross section with the sum of the contributions of vector resonances. From the analysis of the VEPP-2M data [1], it was found that the model uncertainty of the , , and branching fractions associated with the uncertainty of the contributions of excited vector states reach several percent. To eliminate this uncertainty, it is required, in particular, to measure the cross section at center-of-mass energies at least up to 2 GeV.
The measurement at –2 GeV is important in itself. From it one can extract the probabilities of radiative decays of excited vector mesons , and . In this energy region, in addition to the conventional vector states, the production of exotic hybrid (quark-antiquark-gluon) mesons is possible. Since hybrid states can mix with two-quark states, their identification is a complex experimental task requiring a detailed analysis of all available decay modes. Radiative decays, whose probabilities are relatively well predicted within the framework of the quark model, may turn out to be the key to identifying vector hybrid states [3].
In this paper, we present the measurement of the cross section in the energy range –2.00 GeV in the experiment with the SND detector at the VEPP-2000 collider [4]. We use statistics with an integrated luminosity of about 242 pb-1 accumulated from 2010 to 2021. The results of the measurement of the process in this energy range, obtained by SND based on 2010–2012 data with an integrated luminosity of about 36 pb-1, were published in Ref. [5]. Since this publication, in the SND, CMD-3, and BABAR experiments, the cross sections for the background processes [6, 7] and [6] were refined, while the cross sections for the processes [8, 10], [11, 12, 13], and [6] were measured for the first time. These data are used in the new analysis.
2 Detector and experiment
During the experiments, the energy interval 1.05–2.00 GeV was scanned several times with a step of 20-25 MeV. In this analysis, due to limited statistics, we present as a result the cross section values averaged over 14 energy intervals listed in Table 1.
A detailed description of the SND detector is given in Refs. [14]. It is a non-magnetic detector, the main part of which is a three-layer spherical electromagnetic calorimeter based on NaI(Tl) crystals. The solid angle of the calorimeter is 95% of 4. Its energy resolution for photons is , and its angular resolution is about . The angles and production vertex of charged particles are measured in a tracking system consisting of a nine-layer drift chamber and a proportional chamber with signal readout with cathode strips. The solid angle of the tracking system is 94% of 4.
The main meson decay modes are (39%), (33%) and (23%). Background from the processes and , which significantly exceeds the effect in the energy range 1.07–2.00 GeV makes it difficult to use the and decay modes. In this paper, the process is studied in the decay channel, which has seven photons in the final state. Since the final state for the process under study does not contain charged particles, the process without charged particles is also chosen for normalization. As a result of the normalization, the systematic uncertainties associated with the event selection in the first level trigger, as well as the uncertainties arising due to superimposing of beam-generated background charged tracks on events under study, are canceled. The accuracy of the luminosity measurement using the process is 2.2% [15].
3 Selection conditions
The background processes are , , , , and with decays , and . The processes with neutral kaons , , , and with decay also contribute to background.
Of the above processes, only and have seven photons in the final state. In processes with the meson, additional photons can be reconstructed due to the nuclear interaction in the calorimeter or its decay. Also, additional photons are arised from splitting of electromagnetic showers in the calorimeter, emission of photons by the initial particles at a large angle, and superimposing of beam-generated background.
The selection of events is carried out in two stages. First, events are selected, in which seven or more photons are detected and there are no charged particles, with the following conditions on the total energy deposition in the calorimeter and the total event momentum calculated using the energy depositions in the calorimeter crystals
| (1) |
For selected events, a kinematic fit is performed using the measured photon angles and energies, energy-momentum conservation laws, and assumptions about the presence of intermediate mesons. As a result of the fit, the photon energies are refined and is calculated for the used kinematic hypothesis. The two hypotheses are tested:
-
(),
-
().
In the hypothesis, the photon with the maximum energy is chosen as the recoil photon. The candidates are formed from the remaining six photons. If there are more photons in an event compared to the requirement of the hypothesis, all possible five (seven)-photon combinations are tested and the combination with the minimum value of () is selected.
Further selection of events is carried out according to the following conditions:
| (2) |
For selected events, the distribution of the invariant mass recoiling against the photon in the hypothesis is analyzed. These distributions in the range MeV for six energy intervals are shown in Fig. 1.

At energies below 1.3 GeV, a significant contribution to the distribution comes from the process of “radiative return” to the -meson resonance , in which the additional photon is emitted from the initial state predominantly at a small angle to the beam axis. We consider this process as background. Its contribution with the condition on the mass recoiling against : GeV, is calculated by Monte-Carlo (MC) simulation using data on the cross section at energies below 1.03 GeV [1]. The calculated spectrum for the process is shown in Fig. 1, and the expected number of events with MeV is listed in Table 1.
The contribution of other background processes is calculated using data on the measured cross sections for [16], [8, 9], [8, 10], [17, 18], [11, 12, 13], [19], [6, 7], [6] and [6]. For the process , the isotopic relation is used. Radiative corrections [20] are taken into account when calculating the background. This is especially important for the process, which is dominated by radiative return to the meson: .
For the energy range above 1.6 GeV, the cross sections for many background processes are known with an accuracy of about 25%. The cross section of the process measured in the SND and BABAR experiments differs by a factor of 2. Below 1.2 GeV, the dominant background source is the process. The accuracy of its estimation is determined by the quality of MC simulation of nuclear interaction in the calorimeter. Therefore, the mass interval MeV is also analyzed, where only background processes are expected to contribute.
The distributions in the range MeV are fitted by a sum of the contributions of the process under study and background processes:
| (3) |
Here is the signal distribution normalized to unity, is the calculated spectrum for the process , and is the calculated spectrum for other background processes. The free fit parameters are the number of signal events and the scale factor for the background . Below 1.4 GeV, statistics do not allow to determine with the required accuracy for each interval. Therefore, to determine the background, the combined distributions are fitted in the ranges GeV and GeV. The resulting values with their error are then used in the fit for individual intervals.
The shape of the distribution for was checked according to the data collected near the resonance. The simulation agrees with experiment. For the purposes of these statistics the shape of the distribution for does not need to be amended.
The obtained numbers of events of the signal and background processes, as well as the values of the coefficient for different energy intervals, are listed in Table 1.
4 Detection efficiency
The signal detection efficiency is determined by MC simulation, which take into account radiative corrections to the initial state [20], in particular, the emission of additional photons. The angular distribution of these photons is generated according to Ref. [21]. Figure 2 shows the dependence of the detection efficiency on the energy of the photon radiated from the initial state for three values of the center-of-mass energy.
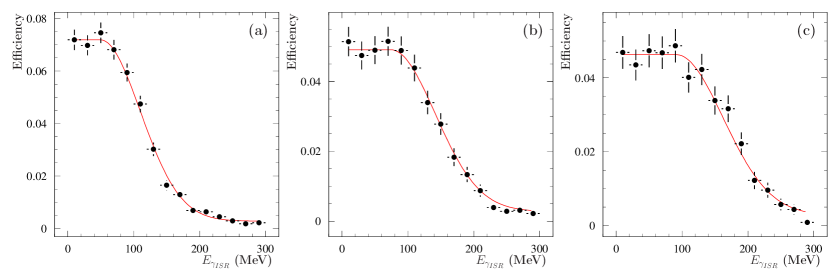
The values of the detection efficiency at , averaged over the energy intervals, are listed in Table 1.
5 Cross section parametrization
In the framework of the vector meson dominance model, the cross section of the process can be written as:
| (4) |
| (5) |
| (6) |
where the summation is over all vector resonances that contribute to the cross section, and are the mass of the resonance and its total width, is the cross section of the process for , and are the branching fractions of the corresponding decays , are the phases of the vector resonance amplitudes (). In addition to the resonances , , and , the sum in Eq. (4) includes all their excited states. For , , and , when calculating the energy dependence of the widths, the main decay modes are taken into account. For excited resonances, the widths were assumed to be independent of the energy.
6 Fit to data and obtaining the Born cross section
The visible cross section of the process is related to the Born cross section (), which must be determined from experiment, by the following formula:
| (7) |
where is a function describing the distribution of the energy fraction taken away by photons emitted from the initial state [20]. The value of is determined by the condition GeV, which is used to separate the processes and . The expression (7) can be rewritten as:
| (8) |
where the detection efficiency and the radiative correction are defined as follows:
| (9) |
| (10) |
Technically, the Born cross section is found as follows. The energy dependence of the measured visible cross section , where is the energy interval number, is fitted by Eq. (7). For the parametrization of the Born cross section, some theoretical model is used that describes the experimental data well. Using the obtained parameters of the theoretical model, the radiative correction is determined, and then the experimental Born cross section is calculated using the formula (8).
In the fit to the cross section, the Particle Data Group (PDG) values of the , , and parameters [22] are used. The phases , and are chosen according to the prediction of the quark model: , . As already mentioned, at energies above 1 GeV, all five known excited vector resonances , , , , and contribute to the cross section. It is impossible to separate the contributions of these resonances by fitting the cross section . However, the problem can be significantly simplified using the fact that the resonances are divided into two groups with close masses (, ) and (, , and ). With the available limited statistics, we can use a model with two effective resonances and with masses and widths equal to the PDG values for and . This choice of resonances is consistent with the predictions of the quark model [23], in which the decay widths and are at least an order order of magnitude larger than the widths for the other three excited states.
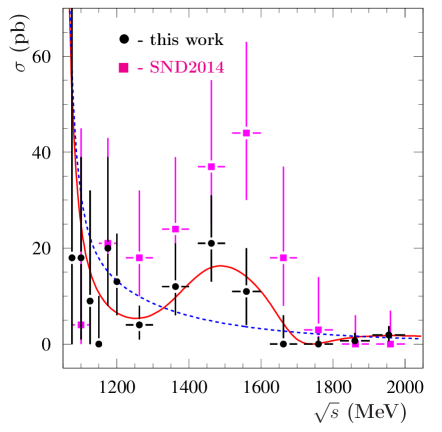
The free fit parameters are the cross sections and , and the phases and . The resulting fitted curve is shown in Fig. 3 together with the values of the Born cross section calculated using Eq. (8) The numerical values of the Born cross section and the radiative correction are listed in Table 1.
For the cross sections at the resonance maxima, the following values are obtained:
| (11) |
The first of the quoted errors is statistical, the second is systematic.
It should be noted that small statistics do not allow us to discard the model without excited resonances. The result of the fit in this hypothesis is also shown in Fig. 3. For it, , where is the number of degrees of freedom, versus in the model with two excited resonances. It should be noted that the model with only one excited resonance cannot describe the cross section dip at GeV.
| (GeV) | (pb-1) | (%) | (pb) | ||||
|---|---|---|---|---|---|---|---|
| 1.075 | 1.10 | 28 | 2.9 () | 8.1 | |||
| 1.100 | 3.38 | 51 | 6.4 () | 8.0 | |||
| 1.125 | 1.32 | 11 | 1.4 () | 8.2 | |||
| 1.150 | 3.21 | 15 | 2.8 () | 8.1 | |||
| 1.175 | 1.73 | 4 | 1.1 () | 7.9 | |||
| 1.200 | 4.30 | 4 | 2.2 () | 7.7 | |||
| 1.225–1.300 | 21.0 | 5 | 20 () | 7.0 | |||
| 1.325–1.400 | 10.0 | 1 | 16 () | 6.6 | |||
| 1.425–1.500 | 11.0 | 0 | 22 () | 6.3 | |||
| 1.520–1.600 | 11.3 | 0 | 34 () | 6.0 | |||
| 1.625–1.700 | 12.4 | 0 | 58 () | 5.6 | |||
| 1.720–1.800 | 15.0 | 0 | 25 () | 5.4 | |||
| 1.820–1.902 | 63.5 | 0 | 43 () | 4.9 | |||
| 1.910–2.000 | 83.2 | 0 | 38 () | 4.6 |
7 Systematic measurement errors
The systematic uncertainty on the measured cross section includes uncertainties in determining the detection efficiency, measuring the integrated luminosity, as well as the model error in calculation the radiative correction. To estimate the systematic error in the detection efficiency, we study the stability of the result on the cross section under wide variation of the selection criteria, in particular, the conditions on of the kinematic fits. An analysis is also carried out with the requirement that exactly seven photons be detected in an event, as in Ref. [5]. At the current level of statistical accuracy, no change in the result on the cross section is found. In addition, for a numerical estimate of the uncertainty in the detection efficiency, one can use the results of the study of the difference in the detector response between data and simulation for the five-photon events performed in Ref. [15]. For the current analysis, we use the sum of the correction from [15] and its error (3%) as an estimate of the systematic uncertainty associated with selection conditions. The systematic uncertainty due to the difference between data and simulation in the photon conversion probability before the track system is 1.3%.
The systematic uncertainty associated with normalization to luminosity is 2.2%. The model error in the calculation of the radiative correction is determined from the difference between the values obtained for the models with and without the use of and excited states. The total systematic uncertainty on the cross section is listed in Table 1.
8 Conclusion
In the experiment at the VEPP-2000 collider with the SND detector, the cross section of the process was measured in the energy range 1.05 – 2.00 GeV. events were searched in the decay mode . The measured cross section of this process is shown in Fig. 3 in comparison with the previous SND result [5] obtained using approximately 7 times less statistics. The new results are significantly lower than the previous ones for GeV. The difference is explained by a significant underestimation of background in Ref. [5]. The results obtained in this work supersede the measurement of Ref. [5].
References
- [1] M. N. Achasov et al. (SND Collaboration), Phys. Rev. D 74, 014016 (2006); ibid. 76, 077101 (2007).
- [2] R. R. Akhmetshin et al. (CMD-2 Collaboration), Phys. Lett. B 509, 217 (2001).
- [3] V. M. Aulchenko et al., J. Exp. Theor. Phys. 97 (2003).
-
[4]
D. Shwartz et al.
JACoW IPAC2021, TUPAB002 (2021),
https://jacow.org/ipac2021/papers/tupab002.pdf - [5] M. N. Achasov et al. (SND Collaboration), Phys. Rev. D 90, 032002 (2014).
- [6] J. P. Lees et al. (BABAR Collaboration), Phys. Rev. D 95, 052001 (2017).
- [7] M. N. Achasov et al. (SND Collaboration), Phys. Rev. D 97, 032011 (2018).
- [8] M. N. Achasov et al. (SND Collaboration), Phys. Rev. D 99, 112004 (2019).
- [9] M. N. Achasov et al. (SND Collaboration), Eur. Phys. J. C 80, 1008 (2020).
- [10] V. L. Ivanov et al. (CMD-3 Collaboration), Phys. Lett. B 798, 134946 (2019).
- [11] M. N. Achasov et al. (SND Collaboration), Phys. Rev. D 94, 032010 (2016).
- [12] J. P. Lees et al. (BABAR Collaboration), Phys. Rev. D 98, 112015 (2018).
- [13] J. P. Lees et al. (BABAR Collaboration), Phys. Rev. D 103, 092001 (2021).
- [14] M. N. Achasov et al., Nucl. Instrum. Methods Phys. Res., Sect. A 598, 31 (2009); V. M. Aulchenko et al., ibid. 598, 102 (2009); A. Yu. Barnyakov et al., ibid. 598, 163 (2009); V. M. Aulchenko et al., ibid. 598, 340 (2009).
- [15] M. N. Achasov et al. (SND Collaboration), Phys. Rev. D 88, 054013 (2013).
- [16] M. N. Achasov et al. (SND Collaboration), Phys. Rev. D 94, 112001 (2016).
- [17] R. R. Akhmetshin et al. (CMD-2 Collaboration), Phys. Lett. B 489, 125 (2000).
- [18] B. Aubert et al. (BABAR Collaboration), Phys. Rev. D 76, 092005 (2007) [Erratum-ibid, 77, 119902 (2008)].
- [19] J. P. Lees et al. (BABAR Collaboration) Phys. Rev. D 89, 092002 (2014).
- [20] E. A. Kuraev and V. S. Fadin, Yad. Fiz. 41, 733 (1985) [Sov. J. Nucl. Phys. 41, 466 (1985)].
- [21] G. Bonneau and F. Martin, Nucl. Phys. B27, 381 (1971).
- [22] R. L. Workman et al. (Particle Data Group), Prog. Theor. Exp. Phys. 2022, 083C01 (2022).
- [23] F. E. Close, A. Donnachie and Y. S. Kalashnikova, Phys. Rev. D 65, 092003 (2002).