Dimming of Continuum Captured in Mrk 841: New Clues on the Nature of the Soft X-ray Excess
Abstract
We report on a remarkable change in the spectral energy distribution (SED) of Mrk 841, providing new insights on how the soft X-ray excess emission in active galactic nuclei (AGNs) is produced. By Swift monitoring of a sample of Seyfert-1 galaxies, we found an X-ray spectral hardening event in Mrk 841. We thereby triggered our XMM-Newton, NuSTAR, and HST observations in 2022 to study this event. Our previous investigations of such events in other AGNs had shown that they are caused by obscuring winds. However, the event in Mrk 841 has different spectral characteristics and origin. We find it is the soft X-ray excess component that has become dimmer. This is, importantly, accompanied by a similar decline in the optical/UV continuum, suggesting a connection to the soft X-ray excess. In contrast, there is relatively little change in the X-ray power-law and the reflection components. Our SED modeling suggests that the soft X-ray excess is the high-energy extension of the optical/UV disk emission, produced by warm Comptonization. We find the temperature of the disk dropped in 2022, explaining the observed SED dimming. We then examined the Swift data, taken over 15 years, to further decipher the UV and X-ray variabilities of Mrk 841. A significant relation between the variabilities of the X-ray spectral hardness and that of the UV continuum is found, again suggesting that the soft excess and the disk emission are interlinked. This is readily explicable if the soft excess is produced by warm Comptonization.
1 Introduction
Outflows/winds in AGNs transport mass and energy away from the central engine and into the host galaxy. This may have important consequences for the co-evolution of supermassive black holes (SMBHs) and their host galaxies through the resulting feedback mechanism between the AGN activity and star formation (see e.g. King & Pounds 2015; Gaspari et al. 2020). Thus, ascertaining the physical properties and energetics of AGN winds, and how they are launched and driven, are important for determining their role in AGNs and assessing their impact on their environment.
As outflows in AGNs are ultimately powered and driven by the energy released from the accretion process, their physics is interlinked to that of accretion and its associated continuum radiation, called the spectral energy distribution (SED). Outflows are photoionized by this intense ionizing SED, thus imprinting their spectral signatures on the UV/X-ray continuum as absorption and emission features. Therefore, for the study of ionized outflows, the SED needs to be determined. On the other hand, to derive the intrinsic SED, the underlying emission prior to any continuum absorption needs to be established. Thus, spectral modelings of the ionized outflows and the SED are interwoven. The SED model is required for both photoionization modeling of the outflows, and also disentangling the absorption components from the continuum components. Understanding changes in the SED is needed for both proper modeling of the winds and probing the accretion-powered emission in AGNs.
It is not fully understood how the observed SED in AGNs is produced. The nature and origin of the components of the SED, and their physical relation with each other, are uncertain. Convolution of these components across wide energy bands, and their alteration due to absorption, are complicating factors. In particular, an outstanding problem is the origin of a puzzling “soft X-ray excess” emission. The observed X-ray spectra of AGNs often display an excess emission component in addition to the underlying X-ray power-law continuum at energies keV. There are different explanations proposed in the literature for the presence of the soft X-ray excess: relativistically-blurred ionized disk reflection (e.g. Ross & Fabian 2005; Crummy et al. 2006); Compton up-scattering of the disk photons in a warm and optically-thick corona (e.g. Done et al. 2012; Kubota & Done 2018); non-thermal particle acceleration processes, including shocks or magnetic reconnection (e.g. Fukumura et al. 2016); consequences of relativistcally-blurred absorption by disk winds (e.g. Gierliński & Done 2004). Determining the nature and origin of the soft X-ray excess is important as different interpretations ultimately have important implications for our understanding of the accretion and wind phenomena in AGNs.
Spectral variability is a key characteristic of AGNs, which is useful for probing the unknown properties of both the accretion/SED and the outflows. In changing-look AGNs, where there is a transformation of the intrinsic continuum, it allows us to probe major changes in the accretion activity and the associated radiation (LaMassa et al., 2015, 2017; Mehdipour et al., 2022b). Likewise, in AGNs that undergo transient obscuration, this variability allows us to study different types of winds, and how they interact and influence each other (Arav et al., 2015; Kriss et al., 2019a; Dehghanian et al., 2019; Laha et al., 2021).
Following the discovery of a connection between transient X-ray obscuration and broad-line region (BLR) winds in NGC 5548 (Kaastra et al., 2014), the Swift observatory has been utilized to monitor the X-ray spectral hardness variability in a sample of Seyfert-1 AGNs, in order to trigger joint target-of-opportunity (ToO) observations with XMM-Newton, NuSTAR, and the Hubble Space Telescope’s (HST) Cosmic Origins Spectrograph (COS). As a result, additional transient obscuring winds have been found in other AGNs, notably NGC 3783 (Mehdipour et al., 2017; Kriss et al., 2019b), Mrk 335 (Longinotti et al., 2019; Parker et al., 2019) NGC 3227 (Mehdipour et al., 2021; Wang et al., 2022; Mao et al., 2022a), and MR 2251-178 (Mao et al., 2022b).
In late December 2021 a new spectral hardening event was discovered in Mrk 841, which led to follow-up observations with XMM-Newton, NuSTAR, and HST in January and February 2022. However, unlike our previously triggered objects, the event in Mrk 841 turned out to be very different. Mrk 841 is a Seyfert-1 galaxy at redshift (Falco et al., 1999). It was one of the first AGNs where the presence of the soft X-ray excess was discovered (Arnaud et al., 1985; Petrucci et al., 2007). The soft X-ray excess in Mrk 841 was studied by Petrucci et al. (2007) using XMM-Newton/EPIC-pn data taken in 2001 and 2005. They tested different models for the soft excess, namely the relativistically-blurred reflection and absorption models. They found both models are able to reproduce the soft excess with statistically equivalent results. Such studies highlight the difficulty in the interpretation of the soft excess when considering only the X-ray band. However, inclusion of optical/UV data, and importantly their variability, are highly useful in identifying the right explanation for the soft excess. As we present in this paper, our modeling of the new broadband SED captured by the 2022 event, and the comparison with the historical SED, shines new light on the origin and nature of the soft X-ray excess.
2 Comparison of new and historical observations
Our XMM-Newton and NuSTAR ToO observations of Mrk 841, as well as the Swift monitoring, were all approved as a NuSTAR Cycle 7 proposal. During the Swift monitoring of Mrk 841 in December 2021, we first noticed an X-ray spectral hardening on 2021-12-26. Our triggered NuSTAR (50 ks) and XMM-Newton (60 ks) ToO observations were then taken on 2022-01-09. Through a Director Discretion (DD) request, a HST/COS observation (1 orbit) was also taken on 2022-02-01 with the G130M and G160M gratings.
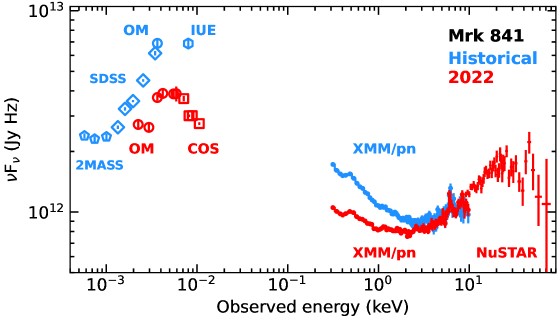
The Swift/XRT data products were obtained from the UK Swift Science Data Centre (Evans et al., 2007, 2009). The Swift/UVOT and NuSTAR data were processed with HEASoft v6.30.1. The XMM-Newton data were reduced with SAS v20.0.0. The HST/COS data of Mrk 841 can be accessed via 10.17909/ajvk-5644 (catalog 10.17909/ajvk-5644). The XMM-Newton, NuSTAR, and HST/COS data are shown in SEDs of Figure 1. The COS fluxes in this figure are from four bands that are free of spectral features to represent the far-UV (FUV) continuum. In order to assess the SED changes that are evident in Figure 1, we compare the 2022 data with the historical observations. We describe below the data that were used for the construction of this historical SED of Mrk 841.
For our investigation we model the 2001 XMM-Newton observation which was originally used in our simulations for the proposal to calculate the reference X-ray hardness ratio at the usual bright state of Mrk 841. The 2001 XMM-Newton/OM exposure was taken in the band only, whereas our 2022 OM data were taken in all six filters. Thus, to help us with constraining the historical SED, we make use of other archival data published in the literature. These data are not contemporaneous. However, in wavelength regions that are close or overlapping, the flux levels are similar. This suggests there is no substantial variability between these historical data. Nonetheless, the inclusion of these non-contemporaneous data is useful for the construction of the broadband SED. We model SDSS data (Adelman-McCarthy et al., 2008), taken with the , , , , filters, to cover the optical and IR bands. To check the SED at lower IR energies, we obtained 2MASS photometric data (Skrutskie et al., 2006) taken with the , , filters. To extend the historical SED as much as possible into the far-UV band, we also make use of an IUE flux measurement (Baskin & Laor, 2005), which like the 2001 XMM-Newton observation is at the bright flux level of Mrk 841. These archival data and the 2001 XMM-Newton data, collectively referred to as “historical”, are shown in Fig. 1.
3 Spectral analysis and modeling
We carried out our spectral modeling of Mrk 841 in SPEX v3.07.01 (Kaastra et al., 1996, 2020). We fitted the 2022 and historical spectra jointly, allowing the possibility of coupling parameters for the two epochs. All IR/optical, UV, and X-ray data shown in Figure 1 were modeled, except the 2MASS data as they contain emission from the dusty torus (hence the rise in luminosity), which we are not studying here. In our modeling, the redshift of Mrk 841 was set to (Falco et al., 1999), and the Milky Way absorption and reddening in our line of sight are taken into account using the hot and ebv models. The total Galactic was fixed to (Willingale et al., 2013), and the extinction to (Schlafly & Finkbeiner, 2011). We use the extinction curve of Cardelli et al. (1989), including the O’Donnell (1994) update, with the ratio fixed to 3.1. The examination of HST and OM images shows that this object is a very compact source, and the starlight contamination by the host galaxy is minimal (few %).
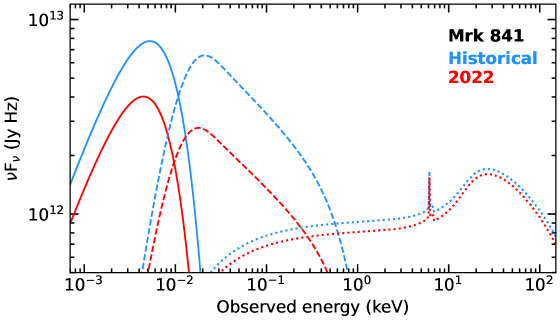
To derive the intrinsic broadband continuum, we apply models that have been previously tried and tested in modeling SEDs of other similar Seyfert-1 galaxies (see e.g. Mehdipour et al. 2015, 2021). We use a disk blackbody component (dbb) to model the optical/UV continuum emission from the accretion disk. To model the extreme UV (EUV) emission and the soft X-ray excess component, we use a Comptonization component (comt). In our modeling the dbb component represents the outer region of the disk (without a warm-Comptonizing corona) and the comt component represents the inner region of the disk (with a warm-Comptonizing corona). We thus couple the seed photon temperature of comt to the maximum temperature of dbb in our fits. We use a power-law model (pow) to model the underlying X-ray continuum and a neutral, narrow, reflection component (refl) to fit the Fe K line and the Compton hump at hard X-rays. The parameters of the illuminating power-law for refl are coupled to those of the 2001 power-law. The high-energy exponential cut-off of the power-law was fixed to 300 keV (Petrucci et al., 2007), and the low energy one to 1 Ryd.
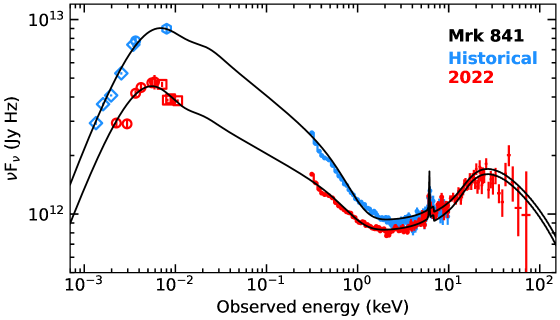
In our SED modeling we took into account the X-ray absorption by the warm absorber in Mrk 841, using the pion model (Mehdipour et al., 2016). Our modeling of the XMM-Newton/RGS data shows that the intrinsic absorption is rather weak, due to relatively low and high ionization parameter . We find the warm absorber consists of two ionization components. The first component has parameters of , , with an outflow velocity of . The parameters of the second, more ionized, component are , , outflowing at . We find the parameters of the warm absorber are consistent with no change between the two epochs, except the ionization parameters which are lowered by 0.2 dex in response to the dimming of the ionizing SED in 2022. Figure 2 (top panel) shows our derived intrinsic SED models for the historical and the 2022 epochs. The individual components of the SEDs are shown in the bottom panel. The best-fit parameters of the continuum components are provided in Table 1. We discuss the results and the SED changes in the following section.
| Parameter | Historical | 2022 |
|---|---|---|
| Disk component (dbb): | ||
| Area ( cm2) | ||
| (eV) | ||
| Soft X-ray excess component (comt): | ||
| Normalization | ||
| (eV) | (f) | (f) |
| (keV) | ||
| Optical depth | ||
| X-ray power-law component (pow): | ||
| Normalization | ||
| Photon index | ||
| X-ray reflection component (refl): | ||
| Reflection fraction | ||
| C-stat / d.o.f. | 1096 / 765 | 1241 / 918 |
Note. — The normalization of the Comptonization component (comt) is in units of photons s-1 keV-1. The power-law normalizations of the pow and refl components are in units of photons s-1 keV-1 at 1 keV.
4 Discussion and conclusions
Understanding the formation of continuum emission, across the electromagnetic spectrum, is important for both the studies of accretion (disk) and ejection (wind). The unobservable EUV band is the least known region of the SED, and the soft X-ray excess is the most uncertain component. Yet, the EUV band is arguably the most significant part of the SED as the luminosity is generally dominant in this band. Ascertaining the bolometric luminosity of an AGN is dependent on the modeling of the uncertain EUV band. Importantly, the ionization and thermal structure of AGN winds, derived from photoionization modeling, is highly dependent on the ionizing EUV and the soft X-ray continuum. Thus, establishing global models that connect the optical/UV to the soft X-rays in a physically consistent fashion is crucial for both correct modeling of winds, as well as for understanding the physical association between the disk and the X-ray emitting coronas in AGNs. The warm Comptonization interpretation of the soft X-ray excess (Done et al., 2012; Petrucci et al., 2018; Kubota & Done, 2018) can provide a viable model for the EUV continuum.
The change in the SED of Mrk 841, captured with our ToO observations in 2022, provides useful clues into the nature of the soft X-ray excess. The comparison of the new and historical spectra (Fig. 1) reveals a clear decline in both the soft X-ray and optical/UV bands, while the Fe K line and the hard X-rays show little change. So the soft X-ray excess and the optical/UV continuum became fainter together in 2022. This is evident in both the raw data (Fig. 1) and the derived continuum models (Fig. 2). For the 2001/historical SED, the intrinsic luminosity of the disk blackbody component (dbb) was and that of the Comptonization component (comt) . This slightly higher luminosity of comt compared to dbb merely means that the inner part of the disk (which has a warm-Comptonizing corona) is more luminous than the outer part of the disk (which does not have a warm-Comptonizing corona). Our SED modeling shows that the intrinsic luminosities of both the dbb and comt reduced by half in 2022.
In the 2001 XMM-Newton observation, the intrinsic luminosity of the X-ray power-law over 0.3–10 keV was , while in the 2022 observation this luminosity was smaller by only 10%. Even if the entire luminosity of the X-ray corona was absorbed and reprocessed to make the soft X-ray excess, it would be energetically insufficient by a factor of five. Furthermore, the luminosities of the reflection component (Fe K line) are consistent with no change. While hard X-ray NuSTAR data are not available for the historical observation, the Fe K line and the continuum up to 10 keV still provide useful measurements for comparison. The luminosity change in the soft excess component is larger by more than an order of magnitude than that of the power-law, also making it inconsistent for the power-law to power the luminosity change of the soft excess in Mrk 841. Warm Comptonization is the only energetically plausible model that can explain the joint dimming of the optical/UV and the soft excess, as according to this model the soft excess is the extension of the optical/UV disk component into the EUV and soft X-ray bands. This reasoning for the origin of the soft excess goes beyond considerations of the statistical quality of X-ray-only fits as different models can provide similarly good fits to the soft excess.
In the X-ray illuminated disk models, the X-ray power-law emission from a hot corona is reprocessed by other regions, such as the disk or the torus. These X-ray models provide predictions for the spectral properties and timing/lag characteristics of the continuum (power-law) and the reflected components (soft excess, Fe K line, and the Compton hump); see e.g. Ross & Fabian (2005); García et al. (2019). However, from the X-rays alone, it is challenging to distinguish between the warm Comptonization and the reflection models for the soft excess (e.g. García et al. 2019). This is because with either model, a combination of parameters can produce equally good fits to the X-ray spectra, albeit sometimes with extreme conditions in both scenario, such as a maximally spinning black hole to blur out the reflected emission features from the disk, or applying a non-standard corona for the warm Comptonization scenario. Understanding how the disk and different X-ray coronas may interact and impact each other (e.g. Ballantyne & Xiang 2020; Dovčiak et al. 2022) are important for better understanding the nature of the soft excess. Importantly, the UV continuum’s luminosity, shape, and variability characteristics can provide additional valuable information, which sometimes are not taken into account by some X-ray studies in the literature. In the case of Mrk 841, the reflection explanation for the soft excess is unlikely to explain the large, simultaneous dimming of the soft excess and the optical/UV continuum. The luminosity of the X-ray power-law (pow) changed little (10%), and that of the X-ray reflection component (refl) is consistent with no change. The Fe K line and the Compton hump are fitted well with the same neutral, narrow, refl component, suggesting that it does not follow the behavior of the soft excess. We note that warm Comptonization and blurred reflection are not mutually exclusive, and both can occur and contribute to the soft excess of an AGN, but to what extent is the question. The Mrk 841 results suggest that at least the bulk of the soft excess emission, and its variability, are most plausible with the warm Comptonization scenario (Nandi et al., 2021; Kawanaka & Mineshige, 2023; Mitchell et al., 2023).
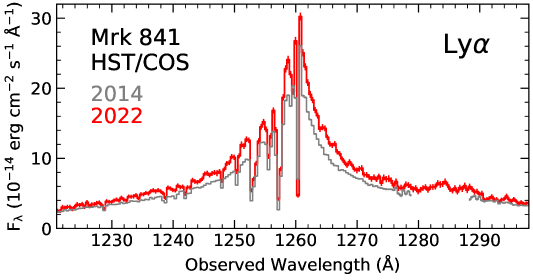
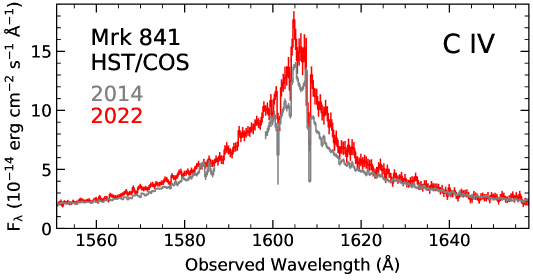
The studies of Seyfert-1 AGNs that underwent transient X-ray obscuration show that the optical/UV continuum does not become dimmer during these events. For example, this is evident in the case of NGC 5548 (Kaastra et al., 2014; Mehdipour et al., 2022a) and NGC 3783 (Mehdipour et al., 2017). However, unlike these obscured AGNs, in Mrk 841 the optical/UV flux declined significantly during the event (Figure 1). Importantly, in those obscured AGNs, broad, blueshifted, UV absorption lines (namely Ly and C IV) appeared during the obscuration events. Figure 3 shows a comparison of the 2022 and 2014 HST/COS spectra at the Ly and C IV regions. It is clear that no broad absorption lines have appeared in 2022, and the emission line profiles are similar in 2014 and 2022. Finally, in addition to the above reasons, by fitting an X-ray obscuration component a significantly worse fit is found, and more importantly, such a component cannot explain the drop in the optical/UV band. Therefore, it is conclusive that the 2022 event in Mrk 841 is not a transient obscuration event.
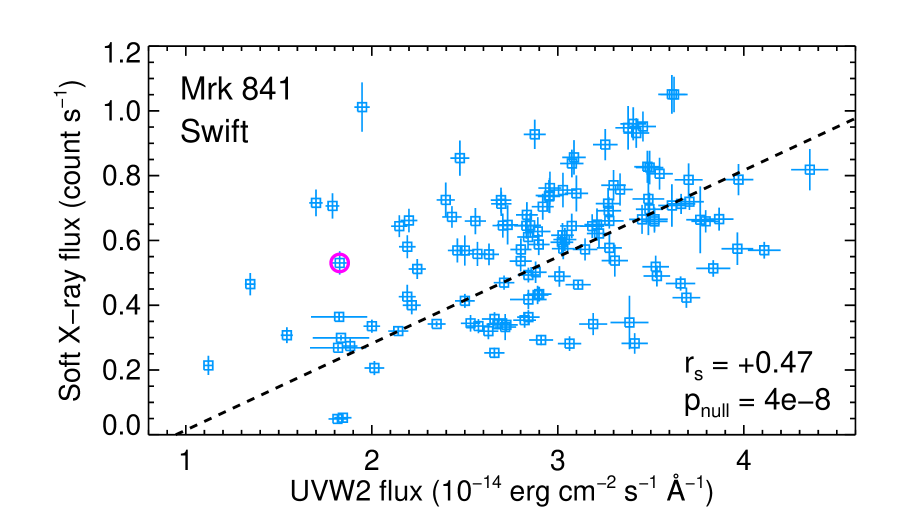
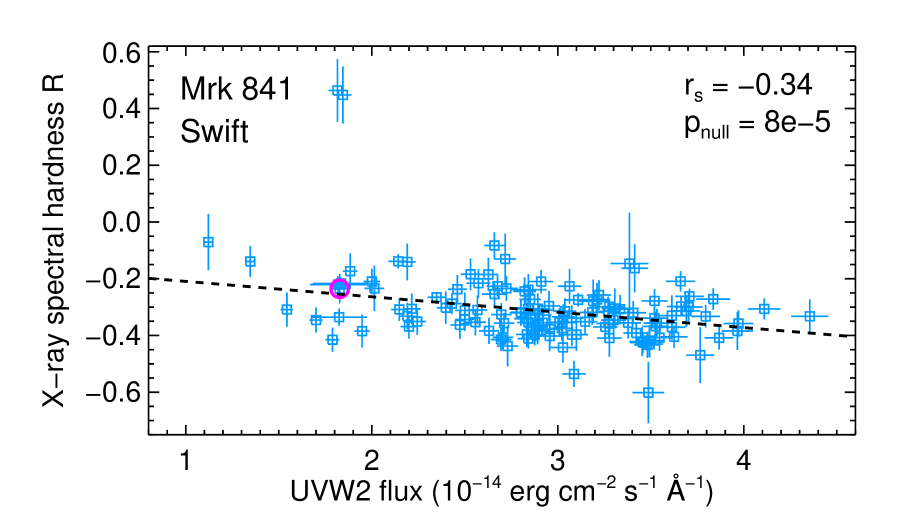
Swift monitoring provides a useful probe of the X-ray and UV variabilities in Mrk 841. Figure 4 shows the soft X-ray flux plotted versus the UV flux (top panel), and the X-ray spectral hardness ratio versus the UV flux (bottom panel). The Swift data span from 2007 to 2022. The data show that there is a highly significant positive correlation between the soft X-ray and UV fluxes (top panel). More interestingly, there is a highly significant negative correlation between the spectral hardness and the UV flux (bottom panel). This means as the source becomes brighter in UV, the X-ray spectrum becomes softer, i.e. the soft excess becomes brighter. This important Swift finding independently verifies the results of our more detailed SED modeling (Figure 2). It demonstrates that the soft excess is directly connected to the UV continuum, consistent with the warm Comptonization explanation of the soft excess. Our soft excess finding in Mrk 841 is similar to that in Mrk 509 (Mehdipour et al., 2011). In that AGN, there was also a significant relationship between the variabilities of the optical/UV continuum and the soft excess. The Mrk 841 results show that the UV continuum and the soft excess vary simultaneously, and more strongly than the power-law, which are not expected in the reflection interpretation of the soft excess. Interestingly, recent Swift reverberation mapping surveys of AGNs also suggest that the lamp-post reprocessing model, where variability of the central X-ray corona drives variability by the surrounding disk, is largely inconsistent with the observed correlations and lags (e.g. Edelson et al. 2019). While the trend of lags with wavelength broadly agrees with the reprocessing prediction (Fausnaugh et al., 2016), towards longer lags the inconsistencies become more apparent.
The SED dimming of Mrk 841 is, to some extent, reminiscent of the changing-look AGNs, where significant changes in accretion may occur. In the case of changing-look NGC 3516 (Mehdipour et al., 2022b), the intrinsic luminosities of the disk and the soft excess component, and the temperature of the disk, dropped together like in Mrk 841. However, in the case of Mrk 841 these SED changes are not as extreme, or long lived, as those in the changing-look AGNs. Also, in changing-look NGC 3516 all components of the SED declined (Mehdipour et al., 2022b), whereas in Mrk 841 the X-ray power-law and the reflection component hardly changed. Thus, the variability of Mrk 841 is at an intermediate level between typical AGN variabilities and the more extreme ones that are associated to the changing-look AGNs. In a typical AGN, the shape of the optical/UV continuum does not alter significantly. However, in changing-look AGNs the continuum does change its shape, like in NGC 3516, and to a lesser extent in Mrk 841.
The observed variability behavior in Mrk 841 is not necessarily indicative of a substantial and persistent change in the accretion rate, but rather it demonstrates that the warm corona (soft excess) is more closely associated to the disk (optical/UV) than the hot corona (power-law). This is likely because the warm corona is physically connected to the accretion disk, whereas the hot corona is more independent from the disk. The location and the formation of the hot corona is still debatable, and its association to the accretion disk may be less straightforward than that of the warm corona.
The results of our investigation highlight the importance of both optical/UV and X-rays for studying spectral hardening events in AGNs because without the UV spectral information one may erroneously associate the lowered X-ray flux to obscuration. In the soft X-ray band alone, the decline in flux can mimic obscuration. However, by taking into account the entire SED it becomes apparent that the flux decline in Mrk 841 is a multi-wavelength phenomenon, spanning from optical/UV to the soft X-rays. The new Mrk 841 results suggest that the soft X-ray excess component is inherently connected to the optical/UV continuum, being the high energy tail of the disk emission. The warm Comptonization model for the soft excess is the only plausible model that can explain such optical/UV and X-ray variability characteristics.
References
- Adelman-McCarthy et al. (2008) Adelman-McCarthy, J. K., Agüeros, M. A., Allam, S. S., et al. 2008, ApJS, 175, 297, doi: 10.1086/524984
- Arav et al. (2015) Arav, N., Chamberlain, C., Kriss, G. A., et al. 2015, A&A, 577, A37, doi: 10.1051/0004-6361/201425302
- Arnaud et al. (1985) Arnaud, K. A., Branduardi-Raymont, G., Culhane, J. L., et al. 1985, MNRAS, 217, 105, doi: 10.1093/mnras/217.1.105
- Ballantyne & Xiang (2020) Ballantyne, D. R., & Xiang, X. 2020, MNRAS, 496, 4255, doi: 10.1093/mnras/staa1866
- Baskin & Laor (2005) Baskin, A., & Laor, A. 2005, MNRAS, 356, 1029, doi: 10.1111/j.1365-2966.2004.08525.x
- Cardelli et al. (1989) Cardelli, J. A., Clayton, G. C., & Mathis, J. S. 1989, ApJ, 345, 245, doi: 10.1086/167900
- Crummy et al. (2006) Crummy, J., Fabian, A. C., Gallo, L., & Ross, R. R. 2006, MNRAS, 365, 1067, doi: 10.1111/j.1365-2966.2005.09844.x
- Dehghanian et al. (2019) Dehghanian, M., Ferland, G. J., Peterson, B. M., et al. 2019, ApJ, 882, L30, doi: 10.3847/2041-8213/ab3d41
- Done et al. (2012) Done, C., Davis, S. W., Jin, C., Blaes, O., & Ward, M. 2012, MNRAS, 420, 1848, doi: 10.1111/j.1365-2966.2011.19779.x
- Dovčiak et al. (2022) Dovčiak, M., Papadakis, I. E., Kammoun, E. S., & Zhang, W. 2022, A&A, 661, A135, doi: 10.1051/0004-6361/202142358
- Edelson et al. (2019) Edelson, R., Gelbord, J., Cackett, E., et al. 2019, ApJ, 870, 123, doi: 10.3847/1538-4357/aaf3b4
- Evans et al. (2009) Evans, P. A., Beardmore, A. P., Page, K. L., et al. 2009, MNRAS, 397, 1177, doi: 10.1111/j.1365-2966.2009.14913.x
- Evans et al. (2007) —. 2007, A&A, 469, 379, doi: 10.1051/0004-6361:20077530
- Falco et al. (1999) Falco, E. E., Kurtz, M. J., Geller, M. J., et al. 1999, PASP, 111, 438, doi: 10.1086/316343
- Fausnaugh et al. (2016) Fausnaugh, M. M., Denney, K. D., Barth, A. J., et al. 2016, ApJ, 821, 56, doi: 10.3847/0004-637X/821/1/56
- Fukumura et al. (2016) Fukumura, K., Hendry, D., Clark, P., Tombesi, F., & Takahashi, M. 2016, ApJ, 827, 31, doi: 10.3847/0004-637X/827/1/31
- García et al. (2019) García, J. A., Kara, E., Walton, D., et al. 2019, ApJ, 871, 88, doi: 10.3847/1538-4357/aaf739
- Gaspari et al. (2020) Gaspari, M., Tombesi, F., & Cappi, M. 2020, Nature Astronomy, 4, 10, doi: 10.1038/s41550-019-0970-1
- Gierliński & Done (2004) Gierliński, M., & Done, C. 2004, MNRAS, 349, L7, doi: 10.1111/j.1365-2966.2004.07687.x
- Kaastra et al. (1996) Kaastra, J. S., Mewe, R., & Nieuwenhuijzen, H. 1996, in UV and X-ray Spectroscopy of Astrophysical and Laboratory Plasmas, ed. K. Yamashita & T. Watanabe, 411–414
- Kaastra et al. (2020) Kaastra, J. S., Raassen, A. J. J., de Plaa, J., & Gu, L. 2020, SPEX X-ray spectral fitting package, 3.06.01, Zenodo, doi: 10.5281/zenodo.4384188
- Kaastra et al. (2014) Kaastra, J. S., Kriss, G. A., Cappi, M., et al. 2014, Science, 345, 64, doi: 10.1126/science.1253787
- Kawanaka & Mineshige (2023) Kawanaka, N., & Mineshige, S. 2023, arXiv e-prints, arXiv:2304.07463, doi: 10.48550/arXiv.2304.07463
- King & Pounds (2015) King, A., & Pounds, K. 2015, ARA&A, 53, 115, doi: 10.1146/annurev-astro-082214-122316
- Kriss et al. (2019a) Kriss, G. A., De Rosa, G., Ely, J., et al. 2019a, ApJ, 881, 153, doi: 10.3847/1538-4357/ab3049
- Kriss et al. (2019b) Kriss, G. A., Mehdipour, M., Kaastra, J. S., et al. 2019b, A&A, 621, A12, doi: 10.1051/0004-6361/201834326
- Kubota & Done (2018) Kubota, A., & Done, C. 2018, MNRAS, 480, 1247, doi: 10.1093/mnras/sty1890
- Laha et al. (2021) Laha, S., Reynolds, C. S., Reeves, J., et al. 2021, Nature Astronomy, 5, 13, doi: 10.1038/s41550-020-01255-2
- LaMassa et al. (2017) LaMassa, S. M., Yaqoob, T., & Kilgard, R. 2017, ApJ, 840, 11, doi: 10.3847/1538-4357/aa68df
- LaMassa et al. (2015) LaMassa, S. M., Cales, S., Moran, E. C., et al. 2015, ApJ, 800, 144, doi: 10.1088/0004-637X/800/2/144
- Longinotti et al. (2019) Longinotti, A. L., Kriss, G., Krongold, Y., et al. 2019, ApJ, 875, 150, doi: 10.3847/1538-4357/ab125a
- Mao et al. (2022a) Mao, J., Kaastra, J. S., Mehdipour, M., et al. 2022a, A&A, 665, A72, doi: 10.1051/0004-6361/202142637
- Mao et al. (2022b) Mao, J., Kriss, G. A., Landt, H., et al. 2022b, ApJ, 940, 41, doi: 10.3847/1538-4357/ac99de
- Mehdipour et al. (2011) Mehdipour, M., Branduardi-Raymont, G., Kaastra, J. S., et al. 2011, A&A, 534, A39, doi: 10.1051/0004-6361/201116875
- Mehdipour et al. (2016) Mehdipour, M., Kaastra, J. S., & Kallman, T. 2016, A&A, 596, A65, doi: 10.1051/0004-6361/201628721
- Mehdipour et al. (2022a) Mehdipour, M., Kriss, G. A., Costantini, E., et al. 2022a, ApJ, 934, L24, doi: 10.3847/2041-8213/ac822f
- Mehdipour et al. (2015) Mehdipour, M., Kaastra, J. S., Kriss, G. A., et al. 2015, A&A, 575, A22, doi: 10.1051/0004-6361/201425373
- Mehdipour et al. (2017) —. 2017, A&A, 607, A28, doi: 10.1051/0004-6361/201731175
- Mehdipour et al. (2021) Mehdipour, M., Kriss, G. A., Kaastra, J. S., et al. 2021, A&A, 652, A150, doi: 10.1051/0004-6361/202141324
- Mehdipour et al. (2022b) Mehdipour, M., Kriss, G. A., Brenneman, L. W., et al. 2022b, ApJ, 925, 84, doi: 10.3847/1538-4357/ac42ca
- Mitchell et al. (2023) Mitchell, J. A. J., Done, C., Ward, M. J., et al. 2023, MNRAS, 524, 1796, doi: 10.1093/mnras/stad1830
- Nandi et al. (2021) Nandi, P., Chatterjee, A., Chakrabarti, S. K., & Dutta, B. G. 2021, MNRAS, 506, 3111, doi: 10.1093/mnras/stab1699
- O’Donnell (1994) O’Donnell, J. E. 1994, ApJ, 422, 158, doi: 10.1086/173713
- Parker et al. (2019) Parker, M. L., Longinotti, A. L., Schartel, N., et al. 2019, MNRAS, 490, 683, doi: 10.1093/mnras/stz2566
- Petrucci et al. (2018) Petrucci, P. O., Ursini, F., De Rosa, A., et al. 2018, A&A, 611, A59, doi: 10.1051/0004-6361/201731580
- Petrucci et al. (2007) Petrucci, P. O., Ponti, G., Matt, G., et al. 2007, A&A, 470, 889, doi: 10.1051/0004-6361:20077787
- Ross & Fabian (2005) Ross, R. R., & Fabian, A. C. 2005, MNRAS, 358, 211, doi: 10.1111/j.1365-2966.2005.08797.x
- Schlafly & Finkbeiner (2011) Schlafly, E. F., & Finkbeiner, D. P. 2011, ApJ, 737, 103, doi: 10.1088/0004-637X/737/2/103
- Skrutskie et al. (2006) Skrutskie, M. F., Cutri, R. M., Stiening, R., et al. 2006, AJ, 131, 1163, doi: 10.1086/498708
- Wang et al. (2022) Wang, Y., Kaastra, J., Mehdipour, M., et al. 2022, A&A, 657, A77, doi: 10.1051/0004-6361/202141599
- Willingale et al. (2013) Willingale, R., Starling, R. L. C., Beardmore, A. P., Tanvir, N. R., & O’Brien, P. T. 2013, MNRAS, 431, 394, doi: 10.1093/mnras/stt175