[1]\fnmWang \surGao
[1]\fnmQing \surJiang
[1]\orgdivKey Laboratory of Automobile Materials (Jilin University), Ministry of Education, Department of Materials Science and Engineering, \orgnameJilin University, \orgaddress \cityChangchun, \postcode130022, \countryChina
An Analytical Model to Quantify the Local Lattice Distortion of Refractory High Entropy Alloys
keywords:
Refractory High Entropy Alloys, Local Lattice Distortion, Short Range Order, Descriptors and Models, Phase Transformation, Yield StrengthLocal lattice distortion (LLD) of high entropy alloys (HEAs) especially refractory HEAs, which is different from one lattice site to another, determines the mechanical properties of HEAs such as yield strength [1, 2, 3, 4, 5] and radiation resistance [6, 7], and is crucial to modulating catalytic activity of HEAs via the atomic strain [8, 9, 10]. In particular, this site-to-site LLD is strongly coupled with the short-range order (SRO) of HEAs [11, 12]. Therefore it is essential to reveal the physical picture of LLD. However, the random distribution of multi-principal constituents of HEAs prohibits the understanding of LLD, including the determinants of LLD and their coupling rules [13, 14]. Herein, we build the first analytical model to realize the site-to-site prediction of LLD in refractory HEAs, by using the neighbor number ratio of central atoms, the central-atom radii, the standard deviation of constituent radii and the constituent number, which demonstrates that LLD surprisingly exhibits a similar mechanism as the relaxation of metal surfaces. The involved parameters depend only on the radii of constituents and are readily accessible. Moreover, our scheme determines not only LLD but also the average lattice distortion (ALD), which enables us to predict the phase stability and yield strength of HEAs. These results build a novel physical picture of LLD, in particular the quantitative relationship between LLD and SRO, which lay a solid foundation for the further target-oriented design of HEAs.
Generally, measuring atomic-scale LD is challenging for experiments [15, 16, 17] and computationally expensive for Density Functional Theory (DFT) calculations when scanning lattice sites at high throughput [18, 19, 20, 21]. Many attempts based on the semi-empirical basis have been made to investigate the determinants of LD [22, 23, 24], such as the hard sphere model [25, 26] and the soft sphere model [27, 28]. Generally, these models only provide the properties of ALD for a given HEAs, obscuring the quantitative relationship between the local site information and the corresponding LLD for a given site. Undoubtedly, LLD uncovers the origin of LD at the most basic level and automatically derives the ALD, whereas its quantification scheme and physical picture are still great obstacles. Herein, we build an analytical model to predict the complex site-to-site LLD of refractory HEAs by linearly combining the effects of a given lattice site and its environment.
To systematically investigate the LLD of refractory HEAs, we adopt six quaternary and six quintary HEAs, consisting of V, Mo, W, Ti, Nb, Ta, Hf and Zr, and use DFT calculations with Perdew-Burke-Ernzerhof functional [29, 30, 31, 32] and machine-learning force fields with Moment Tensor Potential [33, 34, 35, 36] to optimize structures. For each HEA, we check at least three Special Quasi-random Structure (SQS) realizations [37, 38]. In addition, we adopt the Wigner-Seitz (WS) radius, where is the volume of WS cell, to measure the LLD of HEAs [39, 40]. The calculation details are shown in Supplementary Information (SI).
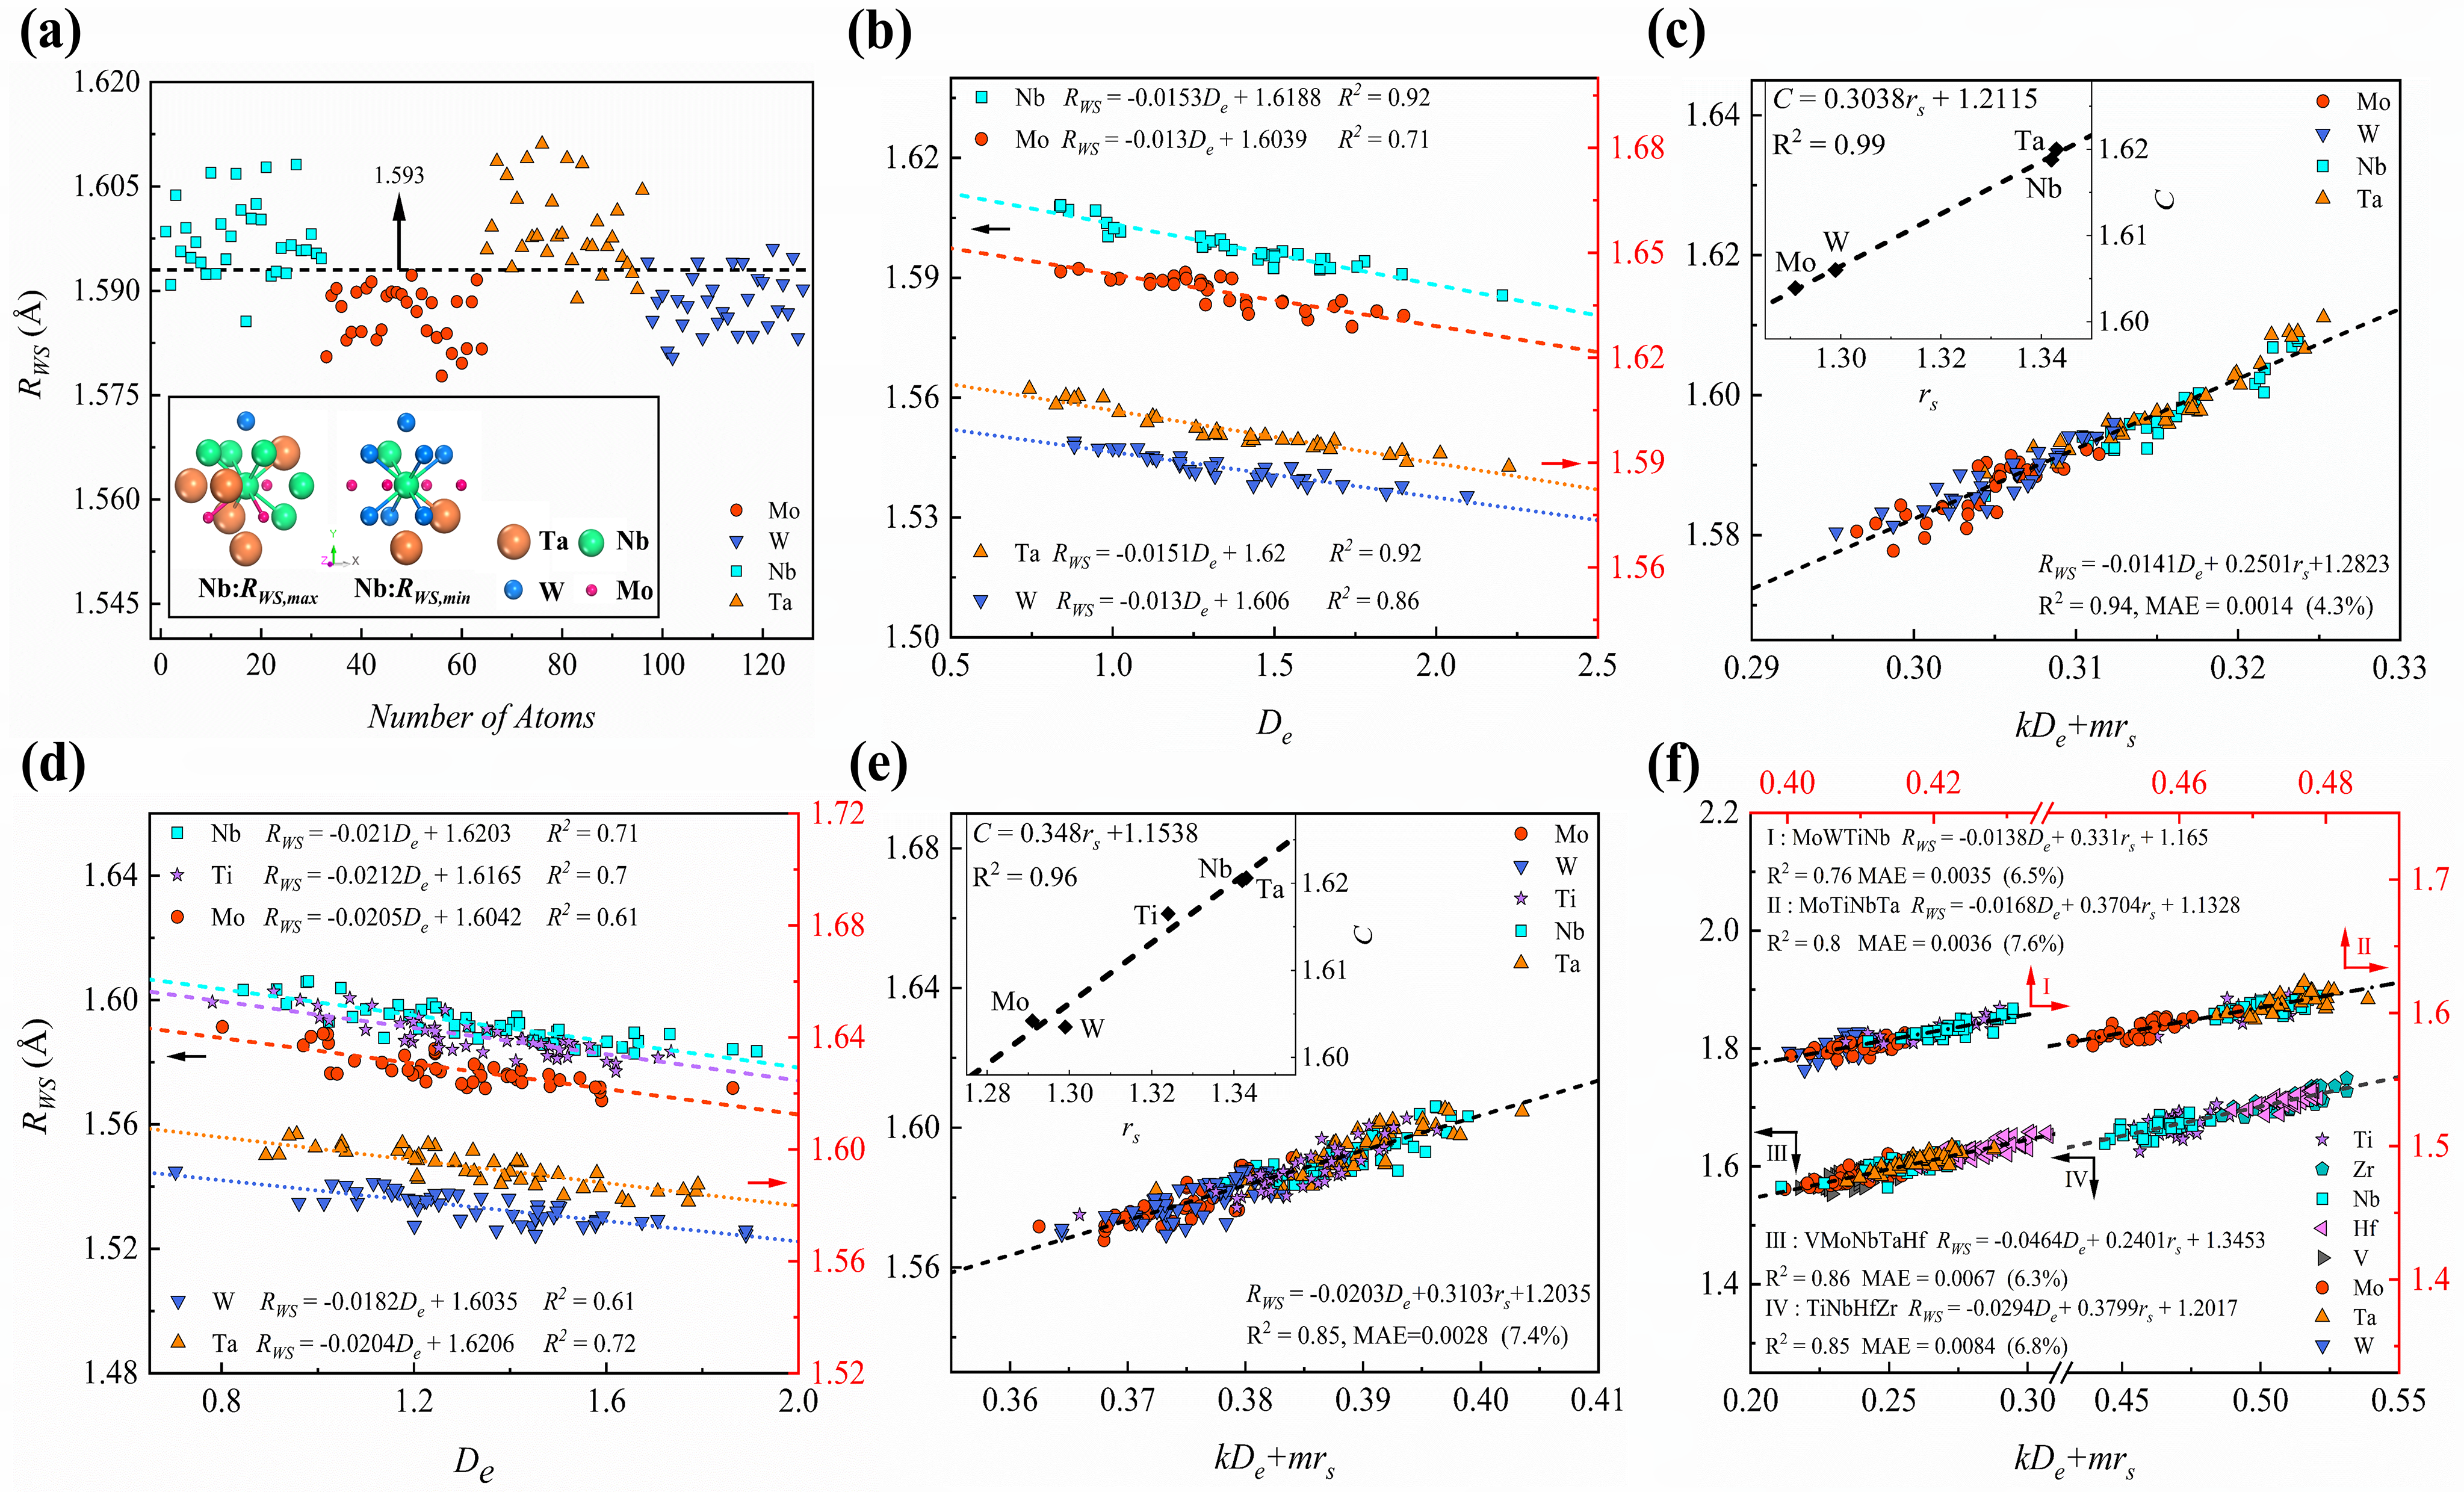
As a direct reflection of LLD, the of HEAs exhibits a significant discrete distribution. Taking MoWNbTa HEA as an example, the of Ta and Nb are larger than the average , while the of Mo and W are smaller than the average (see Fig.1a), corresponding to the fact that the atomic radii of Ta and Nb are larger than those of Mo and W. In addition, the distribution of a given constituent is obviously discrete due to the variation of environments from one site to another. Therefore, the of HEAs is determined by the central atoms and their environments.
First, we focus on the environmental effect on the LLD of HEAs. Taking the of Nb atoms in MoWNbTa HEA as an example (see Fig.1a), the large-radius neighboring atoms increase the of Nb atoms, while the small-radius neighboring atoms reduce the of Nb atoms. It indicates that the large- and small-radius neighboring atoms have opposite effects on the of central atoms. Accordingly, we try to use the ratio between the number of large- and small-radius atoms in the neighbors of central atoms to capture the environmental effect, by building a descriptor where and mean the number of neighboring atoms with the small and large radius, respectively. For quaternary MoWNbTa, is the number of Mo and W and is the number of Nb and Ta in the neighbors of central atoms. We test the influence scope of small- and large-radius neighboring atoms with the th and th nearest neighbors (nn), and the coupling strength between small- and large-radius neighboring atoms with the value. We find that:
| (1) |
effectively quantifies the crucial effects of large- and small-radius neighboring atoms on LLD, namely the environmental effect. Notably, for a given central atom, the small-radius atom of the first (second) nearest neighbor has a coupling effect with the large-radius atom of the first and second (second and third) nearest neighbors. These results demonstrate the large-radius neighboring atoms have larger influence scope than the small-radius neighboring atoms, namely, the impact of the former is more non-local compared to that of the latter. It reflects the fact that in the neighbors of a given central atom, the small-radius atoms have extra space for relaxation, while the large-radius atoms are pushed away and affect their next nearest neighbors. Moreover, our scheme shows that it is indispensable to include the effect of the large-radius atoms of the third nearest neighbors in order to accurately determine LLD, which is the first quantitative model to demonstrate that the impact range of LLD in refractory HEAs reaches the third nearest neighbors (about \qty4) [41, 19]. In Fig.1b, the of a given element in MoWNbTa always exhibits a well linear relation with , as:
| (3) |
The nearly parallel curves of different elements in MoWNbTa demonstrate that is approximately constant, whereas strongly depends on the central-atom effect. We find that is a linear function of the radius of constituent elements (see the inset of Fig.1c), as:
| (5) |
where is the single-bond radius obtained from the metal dimer (see Table.S1) [42], which excludes the impact of multiple coordination environments on the metal atomic radius. Based on above results, the of any central atom in MoWNbTa can be calculated by the linear combination of and , as:
| (7) |
In Fig.1c, although the of MoWNbTa varies over a range () of only \qty0.033, our model effectively realizes a site-to-site determination of by simply summing the environmental and central-atom effects. The fitting coefficient (R2) is 0.94 and the mean absolute error (MAE) is \qty0.0014 that is 4.3 of the radius range (MAE/ = 4.3 ).
We now study the role of a given element in determining the of different constituent HEAs. Taking the Ti-based HEAs as examples, we find that Ti has a negligible effect in MoWTiNbTa (see Fig.1d,e), a non-local effect in MoWTiNb and a local effect in MoTiNbTa (see Fig.1f), corresponding to the fact that Ti is the middle-radius element in MoWTiNbTa, the large-radius element in MoWTiNb and the small-radius element in MoTiNbTa (). The same behavior has also been found for Nb in VMoNbTaHf, MoWNbTa and TiNbHfZr (see Fig.1f). These results demonstrate that for a given element in different constituent HEAs, its effect on is strongly dependent on the radius order between this element and the other constituents.
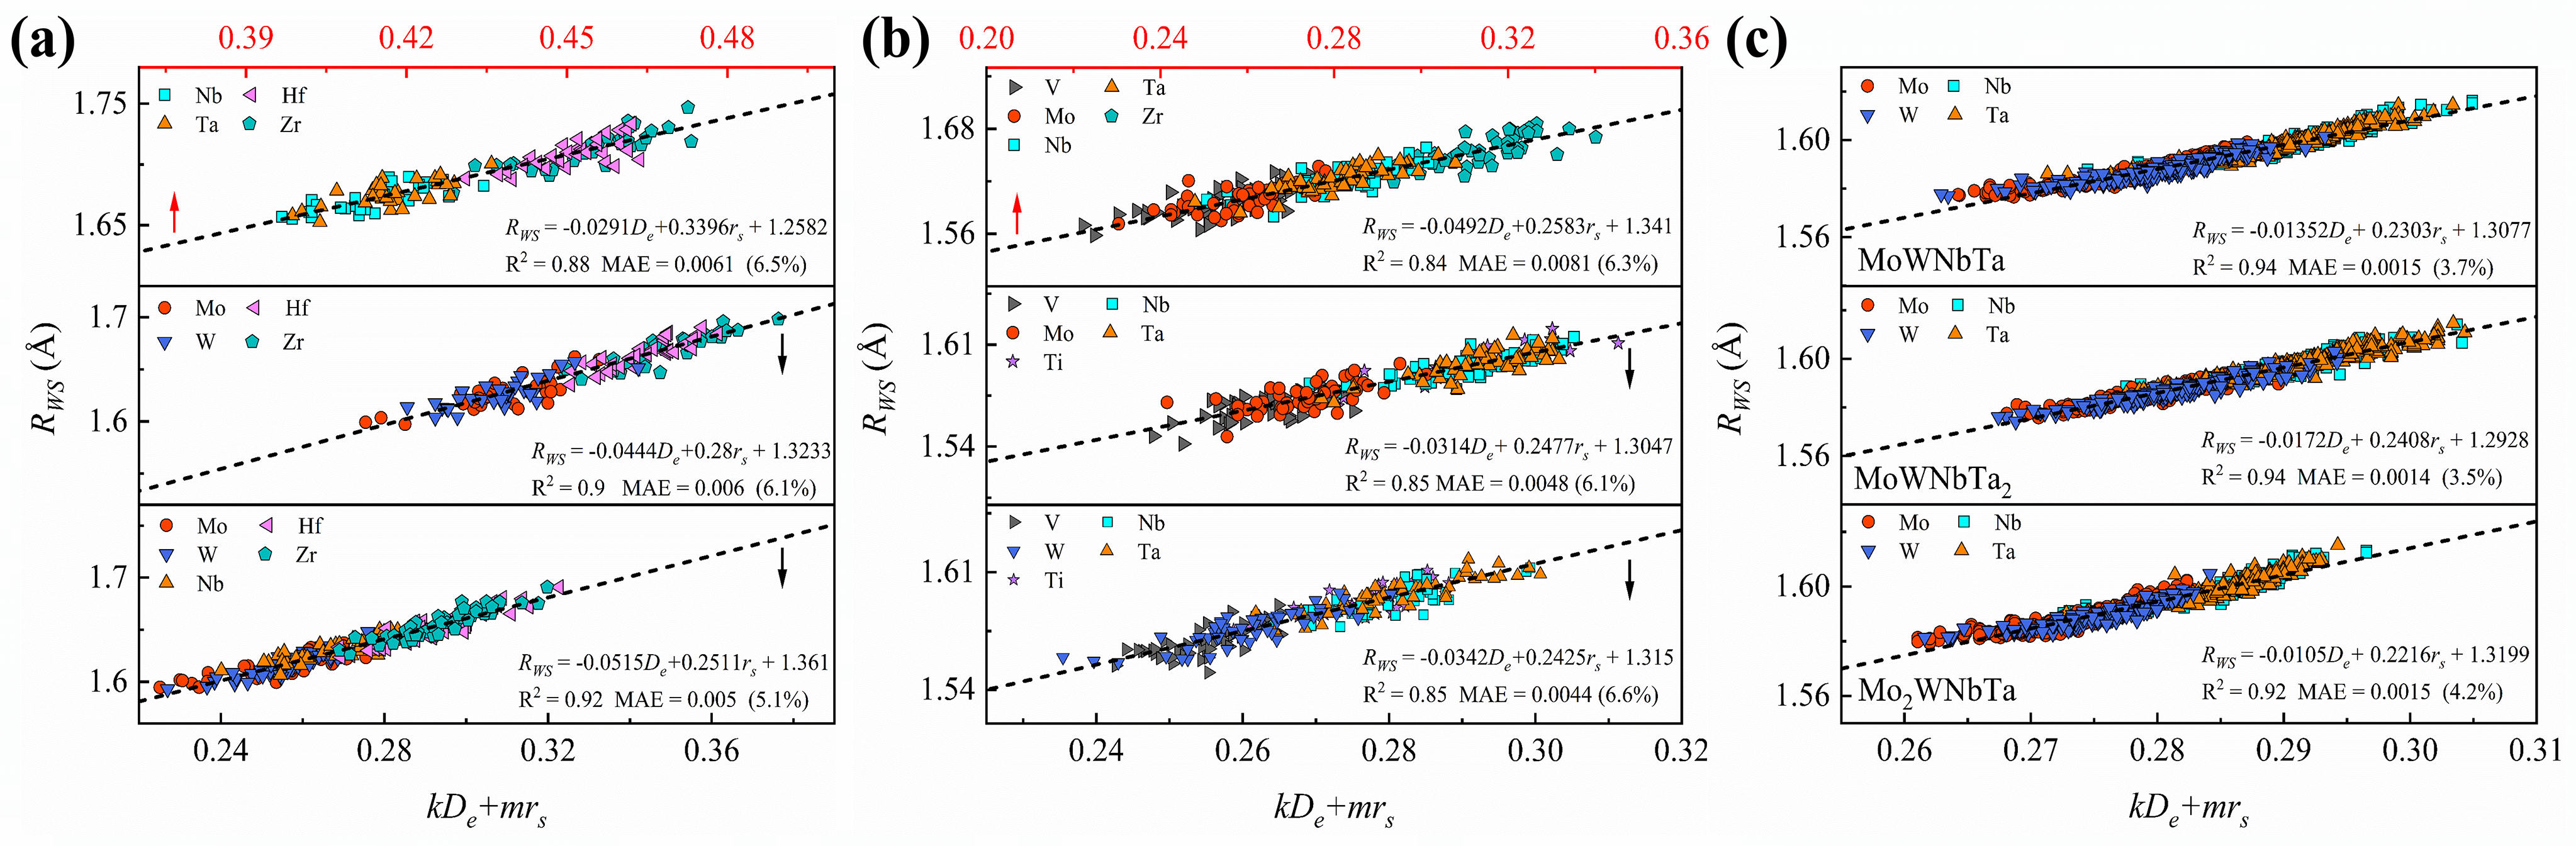
Our model is general in many more HEAs, such as quaternary and quinary HEAs with equiatomic or unequiatomic structures (see Fig.2). In all these HEAs, the variation range of radius is very small, from \qty0.033 to \qty0.128. Strikingly, our model exhibits consistently well linear relationships for all HEAs, for which MAE ranges from \qty0.0014 to \qty0.0084 with MAE/ ranging from 4.3 to 7.6 . These results prove that our model is predictive to the LLD of all refractory HEAs, independent of constituent element and concentration.
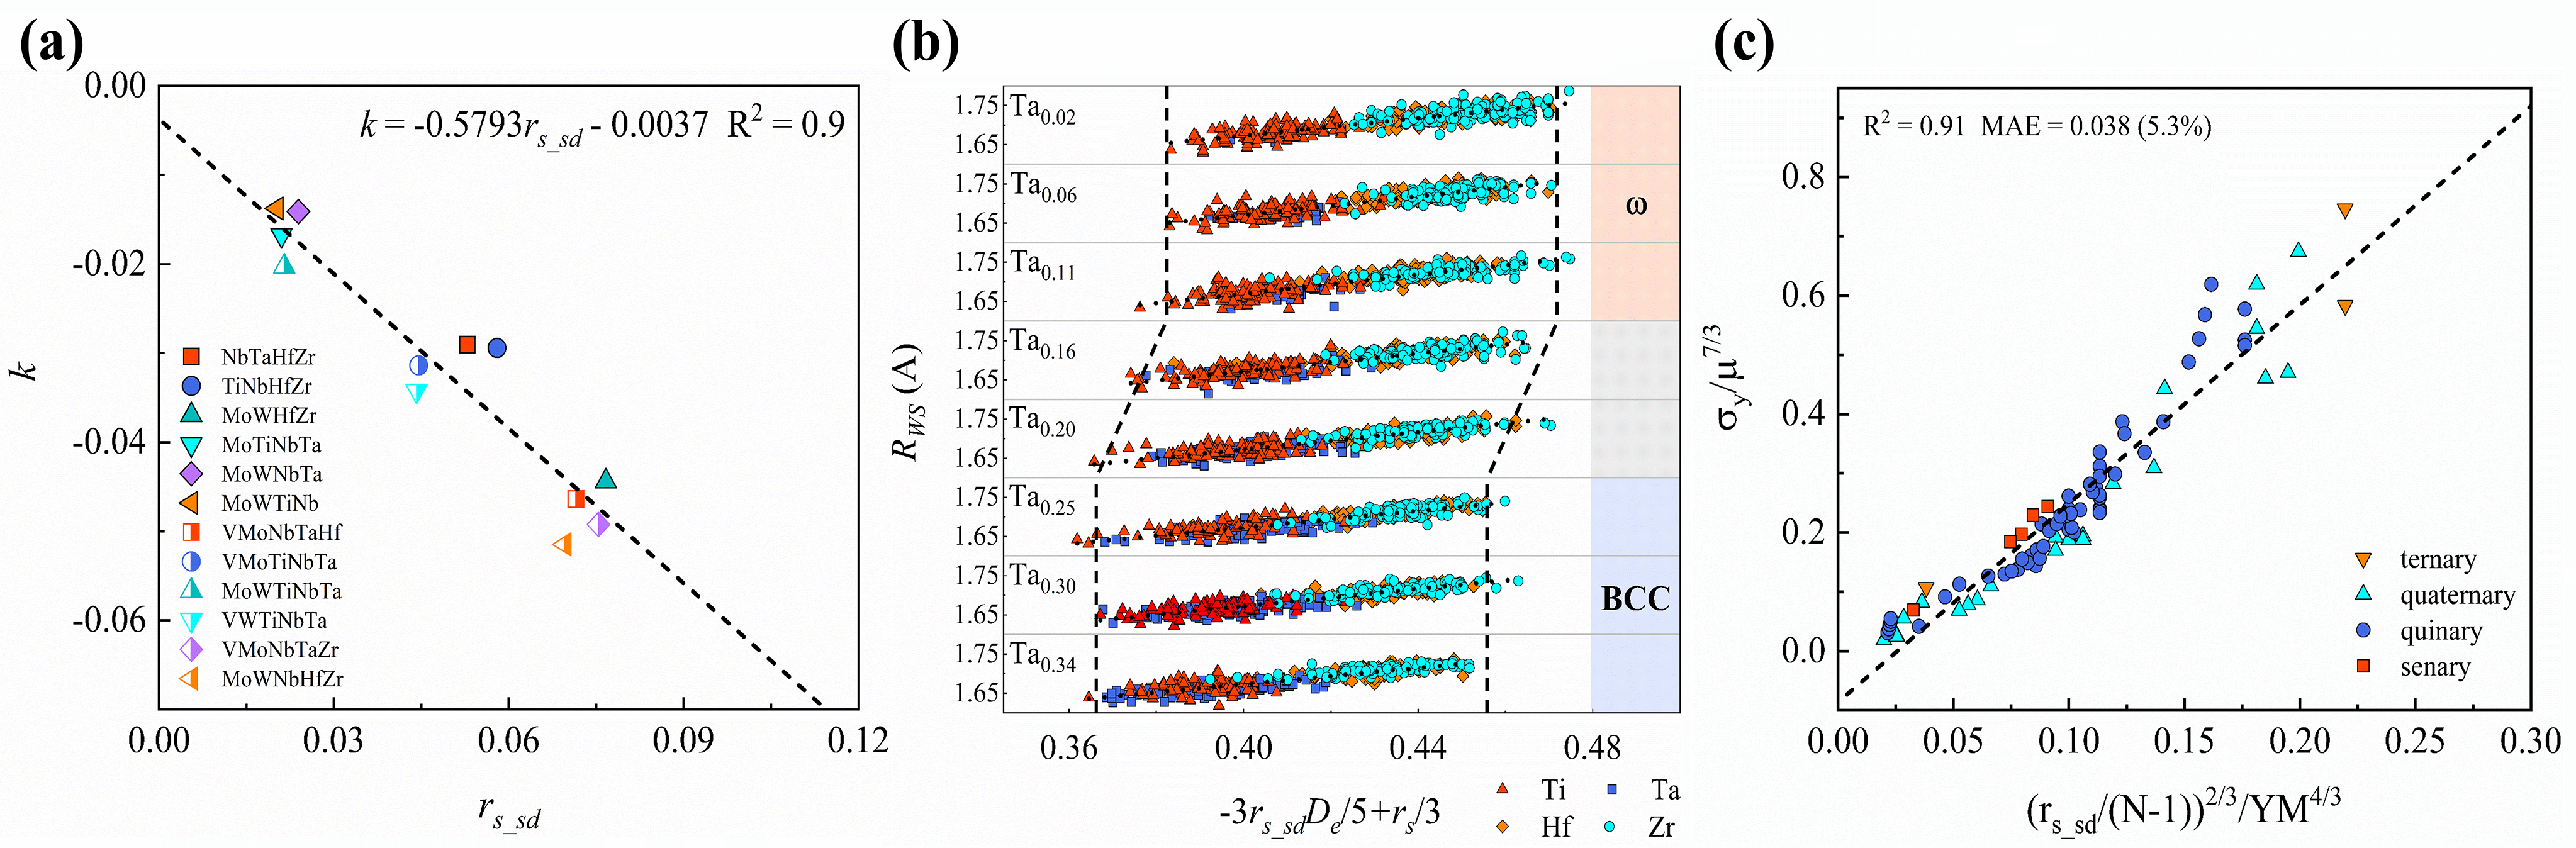
We now study the origin of parameters, and , in the Eq.(4). We find is a linear function of the standard deviation between the of constituents, , where is the concentration of constituent and is the number of constituents of HEAs, and the relationship between and can be simplified as (see Fig.3a). Meanwhile, can be calculated as , representing the average effect of a given element on the other constituents, which complies with the mean field effect. As a consequence, we obtain a fully analytical model of , as:
| (8) |
Notably, all involved parameters are readily accessible and can be determined based on atomic radii. This analytical model predicts the of different HEAs with a well precision, for which the MAE of prediction ranges from \qty0.0024 to \qty0.0103 with MAE/ ranging from 5.5 to 8.7 (see Fig.S2 in SI). Particularly, , directly quantifying LLD, reflects the order of atom distribution in the local environment of a given site from the size perspective, which thus corresponds to the widely used concept SRO. Therefore, our scheme identifies the quantitative relationship between LLD and SRO of HEAs.
Here we turn to uncover the physical picture of LLD in HEAs with the descriptor , which is found to be analogous to the relaxation of metal surfaces and can be understood with the surface energy model in the tight-binding (TB) approximation [43]. It is known that for transition metals, it is sufficient to only consider the band contribution (), which is proportional to the square root of the coordination number (), noted as . On the other hand, is related to the radius () of surface atoms of metals as: , where is the metal atomic radius in bulk. We find that at least the second order approximation is needed to capture the relationship between radius variation and . In this case, , thus . In addition, for a given central atom, the large-radius neighboring atoms are pushed away and reduce its , whereas the small-radius neighboring atoms are brought closer and increase its . Accordingly, is proportional to as .
Based on the effective prediction of LLD, our model can determine the phase transformation of HEAs. Taking TiTaHfZr HEA as an example, its phase structure transforms from phase to BCC phase as the concentration of Ta () increasing from 0 to 34 [44]. This transformation is well captured by our model: the analytical descriptor () in eq.(5) corresponding to phase at 0.382-0.472 ( at 0-11) and BCC phase at 0.366-0.456 ( at 25-34) (see Fig.3b). Our model avoids extensive DFT calculations to determine the transformation criteria compared to the previous model [45, 44]. Notably, for TiTaHfZr HEA, the variation of can be ignored and remains unchanged towards the variation of , thus the environmental effect is dominant in the phase structure transformation reflected by the relationship between and . These results indicate that LLD, as a reflection of the SRO, is a primary contributor to the phase stability of HEAs.
Simultaneously, our model also provides an important strategy for the design of high-yield strength HEAs. It is accepted that the pinning effect of LLD applied to dislocations in HEAs generates a strong solid-solution strengthening (SSS) effect with outstanding yield strength () [4, 23, 24]. According to the theory of SSS for random alloys [46, 47], the athermal of a BCC solid-solution alloy can be calculated as: , where is a fixed line tension coefficient, is Poisson’s ratio, is the the isotropic shear modulus and is a constant parameter for BCC HEAs. By combining a database of experimental of as-cast and annealed refractory HEAs at room temperature (The database and reference are shown in SI) [48, 49], we propose a equation to predict the room-temperature of refractory HEAs:
| (10) |
where YM is the calculated Young modulus calculated using the rule of mixtures [49]. reflect the elastic anisotropy calculated by . The DFT calculated volume mismatch parameter is efficiently determined by our analytical model [50]. Figure 3c shows that our scheme Eq.(6) can predict the of refractory HEAs, and provides an essential basis for engineering materials design. These results demonstrate that the yield strength of HEAs is determined by ALD, which arises mainly from the central-atom effect and the mean field effect between the constituents.
In summary, we build an analytical model to realize the site-to-site prediction of discrete Wigner-Seitz radius in refractory HEAs for the first time. We find that the Wigner-Seitz radius of HEAs is determined by a linear combination of the neighbor number ratio of central atoms and the central-atom radii, with the prefactors determined by the standard deviation of constituent radii and the constituent number. Notably, all involved parameters can be determined based on atomic radii and are readily accessible. Our model demonstrates that the local lattice distortion of refractory HEAs complies with the same rule as the relaxation of metal surfaces. Moreover, our scheme builds a quantitative relationship between local lattice distortion and short-range order and the coupling rule between radius-mismatch and local site environments, consequently quantifying the essential contribution of short-range order to the phase stability of HEAs and the determining role of the averaged lattice distortion in controlling the yield strength of HEAs. All of these results provide a reliable basis for further exploring the structure-property relationship of HEAs and designing ultrahigh-performance HEAs.
Supplementary information
Supplementary information includes the methodology, the predicted data of Eq.(5), the reference single-bond radius () of transition metal used in this work, and the experimental compression yield strength of some refractory HEAs at room temperature.
Acknowledgments The authors are thankful for the support from the National Natural Science Foundation of China (Nos. 22173034, 11974128, 52130101), the Opening Project of State Key Laboratory of High Performance Ceramics and Superfine Microstructure (SKL202206SIC), the Program of Innovative Research Team (in Science and Technology) in University of Jilin Province, the Program for JLU (Jilin University) Science and Technology Innovative Research Team (No. 2017TD-09), the Fundamental Research Funds for the Central Universities, and the computing resources of the High Performance Computing Center of Jilin University, China.
Author contributions W.G. and Q.J. conceived the original idea and designed the strategy. W.G. and L.Z.L derived the models, analyzed the results, wrote the manuscript, performed the DFT calculations, drew figures and prepared the Supplementary Information. All authors have discussed and approved the results and conclusions of this article.
Competing financial interests The authors declare no competing financial interests.
References
- \bibcommenthead
- [1] Wang, F. et al. Multiplicity of dislocation pathways in a refractory multiprincipal element alloy. Science 370, 95–101 (2020).
- [2] Yang, T. et al. Multicomponent intermetallic nanoparticles and superb mechanical behaviors of complex alloys. Science 362, 933–937 (2018).
- [3] Sohn, S. S. et al. Ultrastrong medium-entropy single-phase alloys designed via severe lattice distortion. Adv. Mater. 31, 1807142 (2019).
- [4] Lee, C. et al. Lattice-distortion-enhanced yield strength in a refractory high-entropy alloy. Adv. Mater. 32, 2004029 (2020).
- [5] Samolyuk, G. D., Osetsky, Y., Stocks, G. M. & Morris, J. Role of static displacements in stabilizing body centered cubic high entropy alloys. Phys. Rev. Lett. 126, 025501 (2021).
- [6] El-Atwani, O. et al. Outstanding radiation resistance of tungsten-based high-entropy alloys. Sci. Adv. 5, eaav2002 (2019).
- [7] Tong, Y. et al. Evolution of local lattice distortion under irradiation in medium-and high-entropy alloys. Materialia 2, 73–81 (2018).
- [8] Hao, J. et al. Unraveling the electronegativity-dominated intermediate adsorption on high-entropy alloy electrocatalysts. Nat. Commun. 13, 2662 (2022).
- [9] Batchelor, T. A. et al. High-entropy alloys as a discovery platform for electrocatalysis. Joule 3, 834–845 (2019).
- [10] Qiu, H.-J. et al. Noble metal-free nanoporous high-entropy alloys as highly efficient electrocatalysts for oxygen evolution reaction. ACS Mater. Lett. 1, 526–533 (2019).
- [11] Zhang, R. et al. Short-range order and its impact on the crconi medium-entropy alloy. Nature 581, 283–287 (2020).
- [12] Zhang, F. X. et al. Local structure and short-range order in a nicocr solid solution alloy. Phys. Rev. Lett. 118, 205501 (2017).
- [13] Miracle, D. B. & Senkov, O. N. A critical review of high entropy alloys and related concepts. Acta Mater. 122, 448–511 (2017).
- [14] Nutor, R. K. et al. Phase selection, lattice distortions, and mechanical properties in high-entropy alloys. Adv. Eng. Mater. 22, 2000466 (2020).
- [15] Tan, Y.-Y. et al. Chemical composition dependent local lattice distortions and magnetism in high entropy alloys. Intermetallics 129, 107050 (2021).
- [16] Tong, Y. et al. Local lattice distortion in nicocr, feconicr and feconicrmn concentrated alloys investigated by synchrotron x-ray diffraction. Mater. Des. 155, 1–7 (2018).
- [17] Yeh, J.-W. et al. Formation of simple crystal structures in cu-co-ni-cr-al-fe-ti-v alloys with multiprincipal metallic elements. Metall. Mater. Trans. A 35, 2533–2536 (2004).
- [18] Ching, W.-Y. et al. Fundamental electronic structure and multiatomic bonding in 13 biocompatible high-entropy alloys. npj Comput. Mater. 6, 45 (2020).
- [19] San, S. et al. First-principles calculation of lattice distortions in four single phase high entropy alloys with experimental validation. Mater. Des. 209, 110071 (2021).
- [20] Toda-Caraballo, I., Wróbel, J., Dudarev, S., Nguyen-Manh, D. & Rivera-Díaz-del Castillo, P. Interatomic spacing distribution in multicomponent alloys. Acta Mater. 97, 156–169 (2015).
- [21] Oh, H. S. et al. Engineering atomic-level complexity in high-entropy and complex concentrated alloys. Nat. Commun. 10, 2090 (2019).
- [22] Oh, H. S. et al. Lattice distortions in the feconicrmn high entropy alloy studied by theory and experiment. Entropy 18, 321 (2016).
- [23] Zhao, Y. & Nieh, T. Correlation between lattice distortion and friction stress in ni-based equiatomic alloys. Intermetallics 86, 45–50 (2017).
- [24] Zhao, Y., Lei, Z., Lu, Z., Huang, J. & Nieh, T. A simplified model connecting lattice distortion with friction stress of nb-based equiatomic high-entropy alloys. Mater. Res. Lett. 7, 340–346 (2019).
- [25] Zhang, Y., Zhou, Y. J., Lin, J. P., Chen, G. L. & Liaw, P. K. Solid-solution phase formation rules for multi-component alloys. Adv. Eng. Mater. 10, 534–538 (2008).
- [26] Wang, Z., Qiu, W., Yang, Y. & Liu, C. Atomic-size and lattice-distortion effects in newly developed high-entropy alloys with multiple principal elements. Intermetallics 64, 63–69 (2015).
- [27] Ye, Y., Liu, C. & Yang, Y. A geometric model for intrinsic residual strain and phase stability in high entropy alloys. Acta Mater. 94, 152–161 (2015).
- [28] Ye, Y. et al. Atomic-scale distorted lattice in chemically disordered equimolar complex alloys. Acta Mater. 150, 182–194 (2018).
- [29] Kresse, G. & Furthmüller, J. Efficient iterative schemes for ab initio total-energy calculations using a plane-wave basis set. Phys. Rev. B 54, 11169 (1996).
- [30] Blöchl, P. E. Projector augmented-wave method. Phys. Rev. B 50, 17953 (1994).
- [31] Perdew, J. P., Burke, K. & Ernzerhof, M. Generalized gradient approximation made simple. Phys. Rev. Lett. 77, 3865 (1996).
- [32] Monkhorst, H. J. & Pack, J. D. Special points for brillouin-zone integrations. Phys. Rev. B 13, 5188 (1976).
- [33] Yin, S. et al. Atomistic simulations of dislocation mobility in refractory high-entropy alloys and the effect of chemical short-range order. Nat. Commun. 12, 4873 (2021).
- [34] Zheng, H. et al. Multi-scale investigation of chemical short-range order and dislocation glide in the monbti and tanbti refractory multi-principal element alloys. Preprint at https://doi.org/10.48550/arXiv.2203.03767 (2022).
- [35] Plimpton, S. Fast parallel algorithms for short-range molecular dynamics. J. Comput. Phys. 117, 1–19 (1995).
- [36] Chen, C., Zuo, Y., Ye, W., Ji, Q. & Ong, S. P. Maml - materials machine learning package (2020).
- [37] Zunger, A., Wei, S.-H., Ferreira, L. & Bernard, J. E. Special quasirandom structures. Phys. Rev. Lett. 65, 353 (1990).
- [38] Van de Walle, A. et al. Efficient stochastic generation of special quasirandom structures. Calphad 42, 13–18 (2013).
- [39] Wigner, E. & Seitz, F. On the constitution of metallic sodium. Phys. Rev. 43, 804 (1933).
- [40] Stukowski, A. Visualization and analysis of atomistic simulation data with ovito–the open visualization tool. Modell. Simul. Mater. Sci. Eng. 18, 015012 (2009).
- [41] Meng, F. et al. Charge transfer effect on local lattice distortion in a hfnbtizr high entropy alloy. Scr. Mater. 203, 114104 (2021).
- [42] Pauling, L. Atomic radii and interatomic distances in metals. Journal of the American Chemical Society 69, 542–553 (1947).
- [43] Desjonqueres, M.-C. & Spanjaard, D. Concepts in Surface Physics Vol. 30 (Springer Berlin, Heidelberg, Boston, 1996).
- [44] Ikeda, Y., Gubaev, K., Neugebauer, J., Grabowski, B. & Körmann, F. Chemically induced local lattice distortions versus structural phase transformations in compositionally complex alloys. npj Comput. Mater. 7, 34 (2021).
- [45] Huang, H. et al. Phase-transformation ductilization of brittle high-entropy alloys via metastability engineering. Adv. Mater. 29, 1701678 (2017).
- [46] Lee, C. et al. Strength can be controlled by edge dislocations in refractory high-entropy alloys. Nat. Commun. 12, 5474 (2021).
- [47] Leyson, G. P. M., Curtin, W. A., Hector Jr, L. G. & Woodward, C. F. Quantitative prediction of solute strengthening in aluminium alloys. Nat. Mater. 9, 750–755 (2010).
- [48] Tandoc, C., Hu, Y.-J., Qi, L. & Liaw, P. K. Mining of lattice distortion, strength, and intrinsic ductility of refractory high entropy alloys. npj Comput. Mater. 9, 53 (2023).
- [49] Borg, C. K. et al. Expanded dataset of mechanical properties and observed phases of multi-principal element alloys. Sci. Data 7, 430 (2020).
- [50] Varvenne, C., Leyson, G. P. M., Ghazisaeidi, M. & Curtin, W. A. Solute strengthening in random alloys. Acta Mater. 124, 660–683 (2017).