JADES: The incidence rate and properties of galactic outflows in low-mass galaxies across
We investigate the incidence and properties of ionized gas outflows in a sample of 52 galaxies with stellar mass between M⊙ and M⊙ observed with ultra-deep JWST/NIRSpec MSA spectroscopy as part of the JWST Advanced Deep Extragalactic Survey (JADES). The high-spectral resolution (R2700) NIRSpec observations allowed us to identify for the first time the signature of outflows in the rest-frame optical nebular lines in low-mass galaxies at . The incidence fraction of ionized outflows, traced by broad components, is about 25–40 depending on the intensity of the emission lines. The low incidence fraction might be due to both the sensitivity limit and the fact that outflows are not isotropic but have a limited opening angle which results in a detection only when this is directed toward our line of sight. Evidence for outflows increases slightly with stellar mass and with star-formation rate. The median velocity and mass loading factor (i.e., the ratio between mass outflow rate and star formation rate) of the outflowing ionized gas are 500 and , respectively. These are two and 100 times higher, respectively, than the typical values observed in local dwarf galaxies. These outflows are able to escape the gravitational potential of the galaxy and enrich the circum-galactic medium and, potentially, the inter-galactic medium. Our results indicate that outflows can significantly impact the star formation activity in low-mass galaxies within the first 2 Gyr of the Universe.
Key Words.:
galaxies: evolution, galaxies: high-redshift, galaxies: ISM, ISM: jets and outflows1 Introduction
One of the long-standing problems in astrophysics concerns the process that regulates star formation in galaxies. Only a small fraction () of baryonic matter in the galaxy halo is currently in the form of stars (e.g. Behroozi et al., 2013, 2019), indicating that galaxies have been relatively inefficient in forming stars from their available gas reservoir across cosmic time. Without a mechanism that balances gas accretion and star formation, available models of galaxy formation incorporating the standard cold dark matter paradigm (e.g., White & Rees, 1978) expect the stellar-to-baryon fraction to be well above , depending on the stellar mass (e.g., Henriques et al., 2019). Yet, the primary mechanisms responsible for regulating star formation in galaxies are still unclear and debated. Theoretical models suggest that the energy injected by supernova explosions and the radiation pressure from hot, young stars and active galactic nuclei (AGN) drive the bulk motion of gas at velocities of hundreds of on galactic scales (e.g., Debuhr et al., 2012; Li et al., 2017; Nelson et al., 2019; Mitchell et al., 2020; Pandya et al., 2021). Such fast-outflowing gas is supposed to have a significant impact on galaxies, removing or heating the supply of cold gas required for star formation, generating turbulence in the interstellar medium (ISM), shaping galaxy morphology and kinematics, and polluting the circum-galactic medium (CGM) with metal-enriched material. Galactic outflows and their feedback processes are required in state-of-the-art simulations to self-regulate star formation in low-mass and massive galaxies (e.g., Ceverino et al., 2018). Thus, studying outflow demographics across cosmic time and the impact of feedback on the host galaxy and the surrounding environment is needed to confirm or disprove current models of galaxy formation and evolution.
In recent years, spectroscopic observations of the strongest rest-frame optical nebular lines, such as H and [O], have provided the most extensive census of galactic outflows from to , the so-called “cosmic noon” (Arribas et al., 2014; Förster Schreiber et al., 2014a; Harrison et al., 2016; Cicone et al., 2016; Concas et al., 2017; Rakshit & Woo, 2018; Perna et al., 2017; Leung et al., 2019; Förster Schreiber et al., 2019; Davies et al., 2019; Kakkad et al., 2020; Reichardt Chu et al., 2022; Concas et al., 2022). The considerably high incidence of outflows (, depending on the survey) suggests that outflows are common in massive (M⊙) galaxies up to cosmic noon (e.g., Carniani et al., 2015; Cicone et al., 2016; Concas et al., 2017; Rakshit & Woo, 2018; Förster Schreiber et al., 2019). In contrast, the investigation of outflow properties in the low-mass ( M⊙) regime is limited to the local Universe, because the sensitivity of current ground-based facilities in the near-IR band is not sufficient to detect the faint broad component of nebular lines tracing ionized outflowing gas.
With the advent of the James Webb Space Telescope (JWST; Gardner et al., 2006, 2023), we are now able to extend outflow studies towards higher redshifts and investigate the impact of feedback in galaxies in the first few Gyr of cosmic time. In particular, the spectral coverage of the Near Infrared Spectrograph (NIRSpec; Ferruit et al., 2022; Jakobsen et al., 2022) enables the detection of the strongest rest-frame optical nebular lines out to , and its high sensitivity facilitates the identification of slow and weak galactic outflows in low-mass galaxies separating them from large-scale orbital motions of the host galaxy. For example, Tang et al. (2023) and Zhang et al. (2023) report the detection of a broad emission-line component which likely traces ionized outflows in seven targets out of Cosmic Evolution Early Release Science (CEERS; Bagley et al., 2023; Finkelstein et al., 2023), Early Release Observations (ERO; Pontoppidan et al., 2022), and GLASS-JWST-ERS (Treu et al., 2022) surveys.
In this work, we study the incidence of outflows in the NIRSpec GOODS-S Deep/HST pointing (Program ID: 1210; PI: N. Luetzgendorf) of the JWST Advanced Deep Extragalactic Survey (JADES; Eisenstein et al. 2023; Rieke & the JADES Collaboration 2023 ). The NIRSpec Deep/HST pointing provides R100, R1000, and R2700 spectroscopy of 253 galaxies in the Hubble Ultra Deep Field and surrounding GOODS-South (Bunker et al., 2023). We specifically exploit the deepest R2700 observations carried out with the spectral configuration G395H/F290LP that covers the wavelength range between 2.87 m and 5.14 m and allows us to detect the strongest rest-frame optical nebular lines up to . Thanks to the high sensitivity of these observations (i.e, 5 for an unresolved emission line at m), for the first time, we are able to analyze the main properties of ionized outflows in a sample of low-mass ( M⊙) galaxies in the first two Gyr of cosmic time ().
The paper is organized as follows. Sample selection and data reduction are presented in Sec. 2 and Sec. 3, while the description of the outflow identification workflow is discussed in Sec. 4. We analyze the incidence and properties of ionized outflows in Sec. 5 and Sec. 6, respectively. Finally, we summarize our conclusions in Sec. 7. We adopt the following cosmological parameters from Planck Collaboration et al. (2015): = 67.7 km s-1 Mpc-1, = 0.308 and = 0.70, according to which 1″ at corresponds to a proper distance of 5.84 kpc. Hereafter we use the terms low-mass and high-mass galaxies to refer to those systems having stellar mass and , respectively. Throughout this work, we use the term SFR to refer to the star formation rate over the last 10 Myr.
2 Sample selection
We have selected galaxies detected in either [O] or H, or both, in the NIRSpec G395H/F290LP 1D spectra with a peak signal-to-noise ratio111We define the signal-to-noise ratio of an emission line as the ratio between the flux peak of the line and the sensitivity level of the observation at the same wavelength. (SNR) higher than 5.
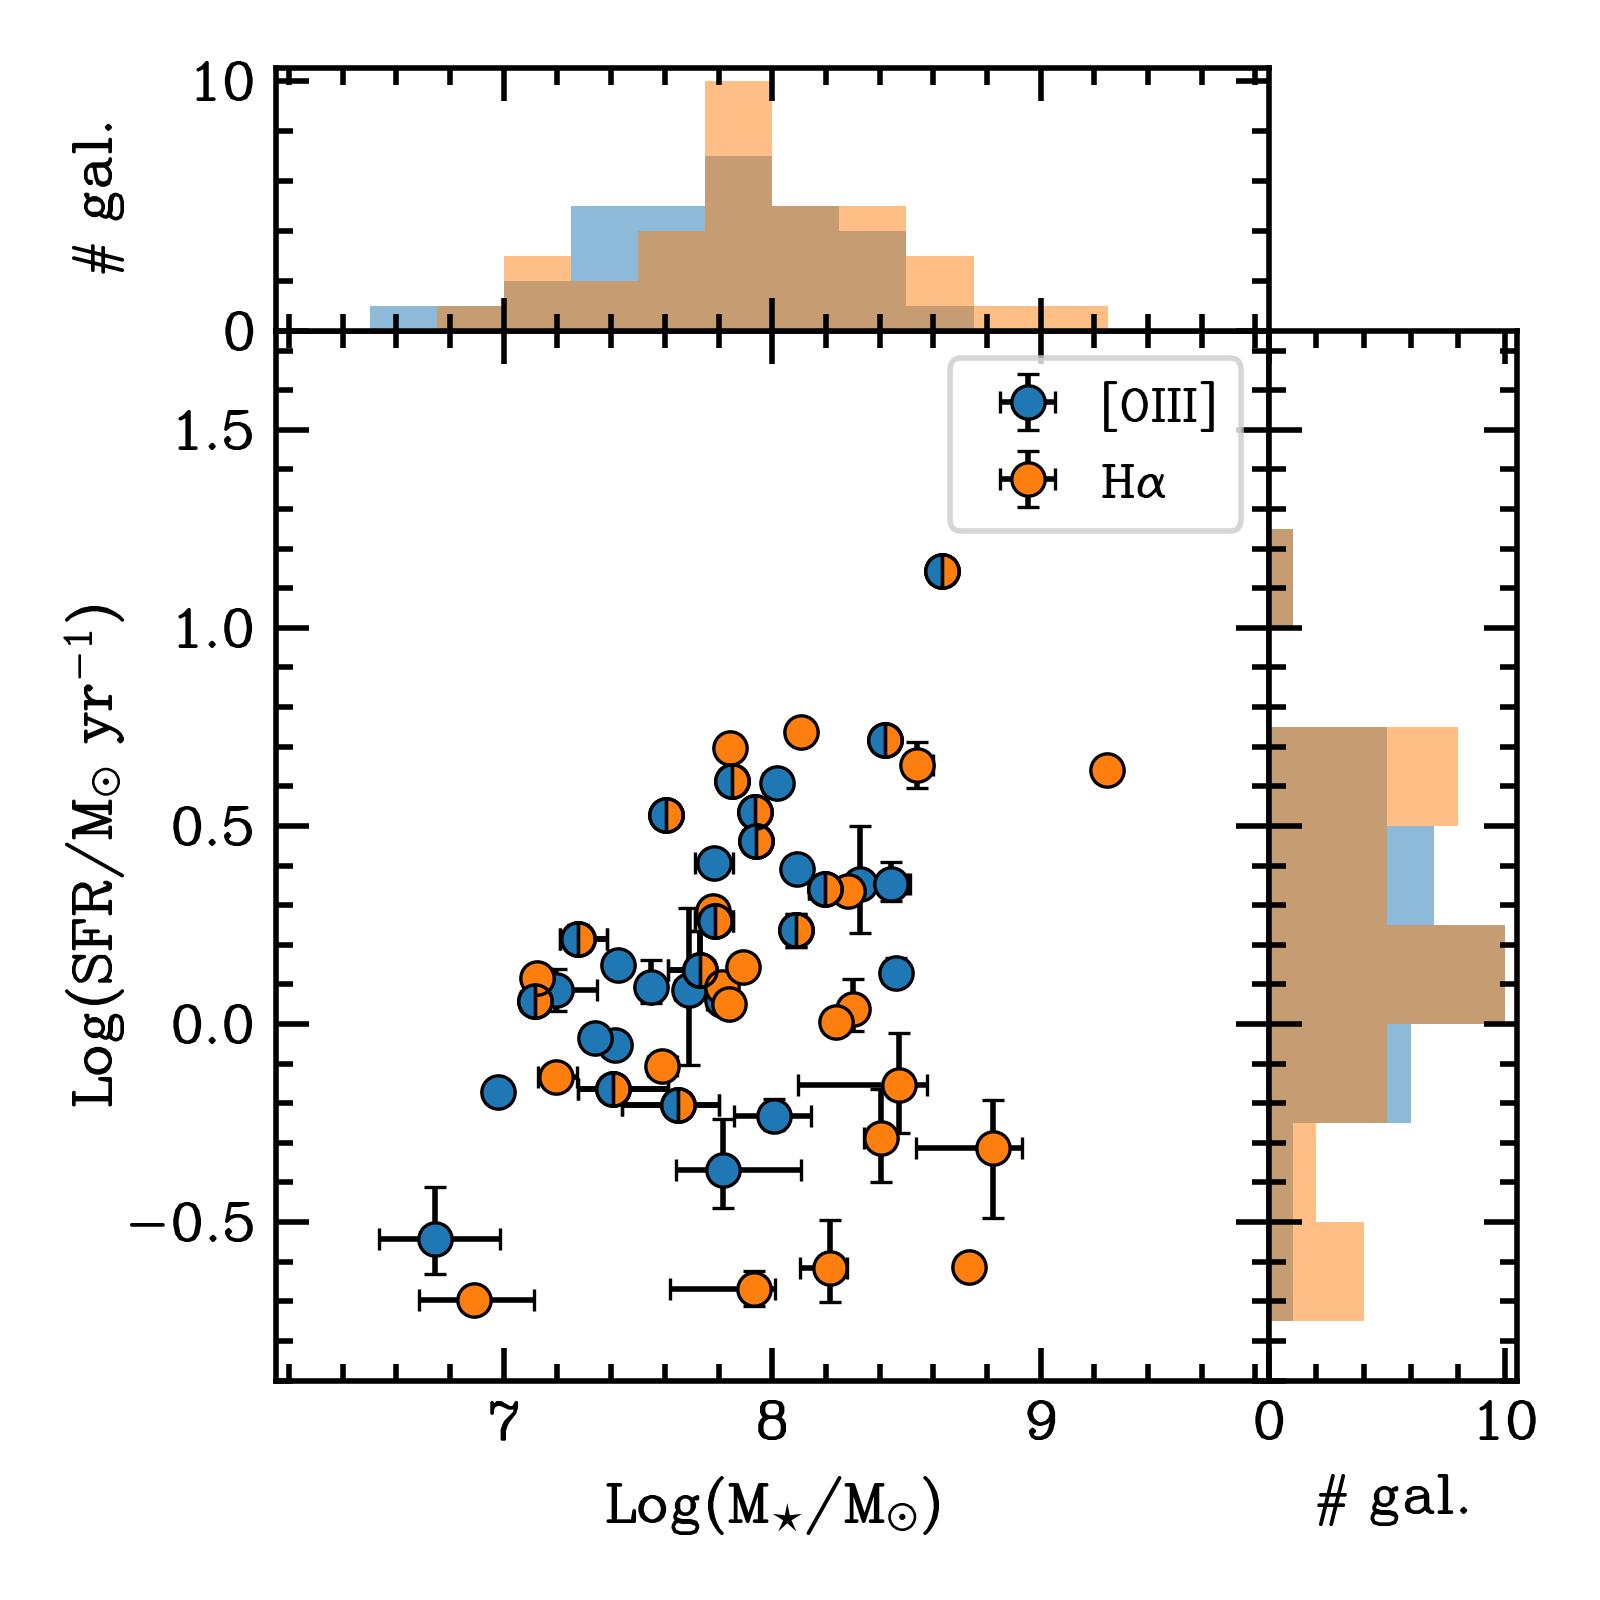
Our sample comprises 52 JADES galaxies which span redshifts between 3.5 and 8.5, and in the following ranges of stellar masses and star formation rates over the past ten Myr (SFR): , SFR . Stellar masses and SFRs were estimated from the NIRSpec PRISM/CLEAR spectra by using the BEAGLE code (Chevallard & Charlot, 2016). In the fitting, we used the synthetic stellar population described in Vidal-García et al. (2017) and adopted a delayed-exponential profile for the star-formation history and a Chabrier initial mass function Chabrier (2003). A detailed description of the fitting procedure and all the free parameters is given in Chevallard et al., in prep.
The sample distribution in the SFR versus stellar mass plane is shown in Figure 1. We stress that this is the first time that ionized outflows can be identified and studied in individual galaxies in the low-stellar mass regime () at .
3 NIRSpec observations
We used the flux-calibrated 1D data produced using a custom pipeline developed by the ESA NIRSpec Science Operations Team (SOT) and Guaranteed Time Observations (GTO) teams. Most of the pipeline workflow adopts the same algorithms included in the official STScI pipeline (Alves de Oliveira et al., 2018; Ferruit et al., 2022). While the details of this custom pipeline will be presented in a forthcoming paper (Carniani et al., in prep.), the main steps are discussed in Curtis-Lake et al. (2023) and Bunker et al. (2023).
Differently from the standard products delivered by the pipeline, we used a finer regular grid wavelength to improve the sampling of the line spread function in the 2D rectification process. We adopted a regular grid wavelength with a pixel scale of 3.32 Åso that the line spread function is sampled by at least four spectral channels. This oversampling is adequate to map the optical nebular line profile and improve the detection of broad components tracing fast-emitting gas. In this study, we also used the 1D spectra extracted from a 3-pixel aperture to maximize the signal-to-noise ratio of the signal.
4 Outflow identification
To investigate the presence of potential outflow signatures in the 1D spectra of the galaxies in our sample, we performed a multi-Gaussian fitting of the emission lines using the nested sampling algorithm dynesty (Speagle, 2020) and disentangled the emission associated with the galactic disk from the one associated with fast gas. In this section, we describe in detail the spectral fitting and outflow identification process.
Initially, we estimated the continuum emission due to either stellar populations or potential residuals after background subtraction around the wavelengths of the nebular lines. In particular, we determined the continuum level in a velocity range of from the peak of the emission line to exclude the spectral range covered by the line and possible broad components due to outflows. We note that the continuum emission of the R2700 data is detectable only in the brightest galaxies of the sample. We thus fitted the continuum underlying the emission lines by using a constant and neglected the contribution of stellar absorption to Balmer lines. We then performed two fits of the continuum-subtracted spectrum: the first with a single Gaussian component and the second with a double Gaussian model defined as:
where is the emission line profile as a function of wavelength, , , and are the amplitude, centroid, and velocity dispersion, respectively, of the narrow Gaussian component associated with the galactic disk and , , and are the same parameters for the broad Gaussian component tracing the outflowing gas. The free parameters for the broad component are , , and . We imposed with so that the velocity dispersion of the additional component is at least 20% larger than the first one without setting any fixed lower limit for for each galaxy. A similar approach was adopted for the amplitude parameter, defined as with based on low-redshift outflow studies (Swinbank et al., 2019; Concas et al., 2022).
For all free components, we used a flat distribution for the priors. We only set an upper bound of on the priors of , which corresponds to the maximum broadening that the narrow component can reach based on: a) the broadening due to the rotational motions in the disk given the mass and size of each galaxy (see App. A); b) the velocity dispersion of gas observed in galaxies, which spans a range between 30 and 80 (Lelli et al., 2021, 2023; Parlanti et al., 2023; Rizzo et al., 2023); c) the line spread function of the instrument that enlarges the line width of the emission line depending on the intra-shutter position and size of the target (Jakobsen et al., 2022, ; de Graaff et al., in prep.).
The presence of outflows in each galaxy was determined based on the presence of a second broad component in addition to the narrow one associated with the general system motions. In turn, the two-Gaussian best-fit model was preferred to the one-Gaussian one based on the following criteria (to be satisfied jointly):
-
•
the two-Gaussian model led to a decrease in reduced chi-squared () by 10% or more compared to of the single-component model;
-
•
the log-difference between the two Bayesian evidences222Bayesian evidence is the average of the likelihood under the prior for a specific model choice and is used to quantify the support for one model over the other (Skilling, 2004). A value of , where and are the Bayesian evidences estimated for the double- and single-Gaussian models, respectively, means that the former model is more strongly supported by the data under consideration than the latter. () of the models was larger than 2 (Jeffreys, 1961);
-
•
integrated flux emission of the broad component was larger than three times the uncertainties.
We also performed a visual inspection to double-check that the best-fitting broad component model was not associated with noise fluctuations or continuum that had not been fully/properly subtracted.
Among the targets with candidate outflows, selected as described above, we removed two targets, 10013704 and 8083, since the broad component of H was not associated with outflowing gas but arose from the broad line region of AGN based on the analysis of the nebular lines in R1000 NIRspec data (Bunker et al. 2023 and Maiolino et al., in prep.). After applying these selection criteria, we identified 13 galaxies with outflow signatures. The spectra of all of them, together with their best-fitting models, are reported in Appendix A. The best-fit results for the modeling with two Gaussian profiles are listed in Tables 1 and 2.
5 Outflow demography
5.1 Outflow incidence
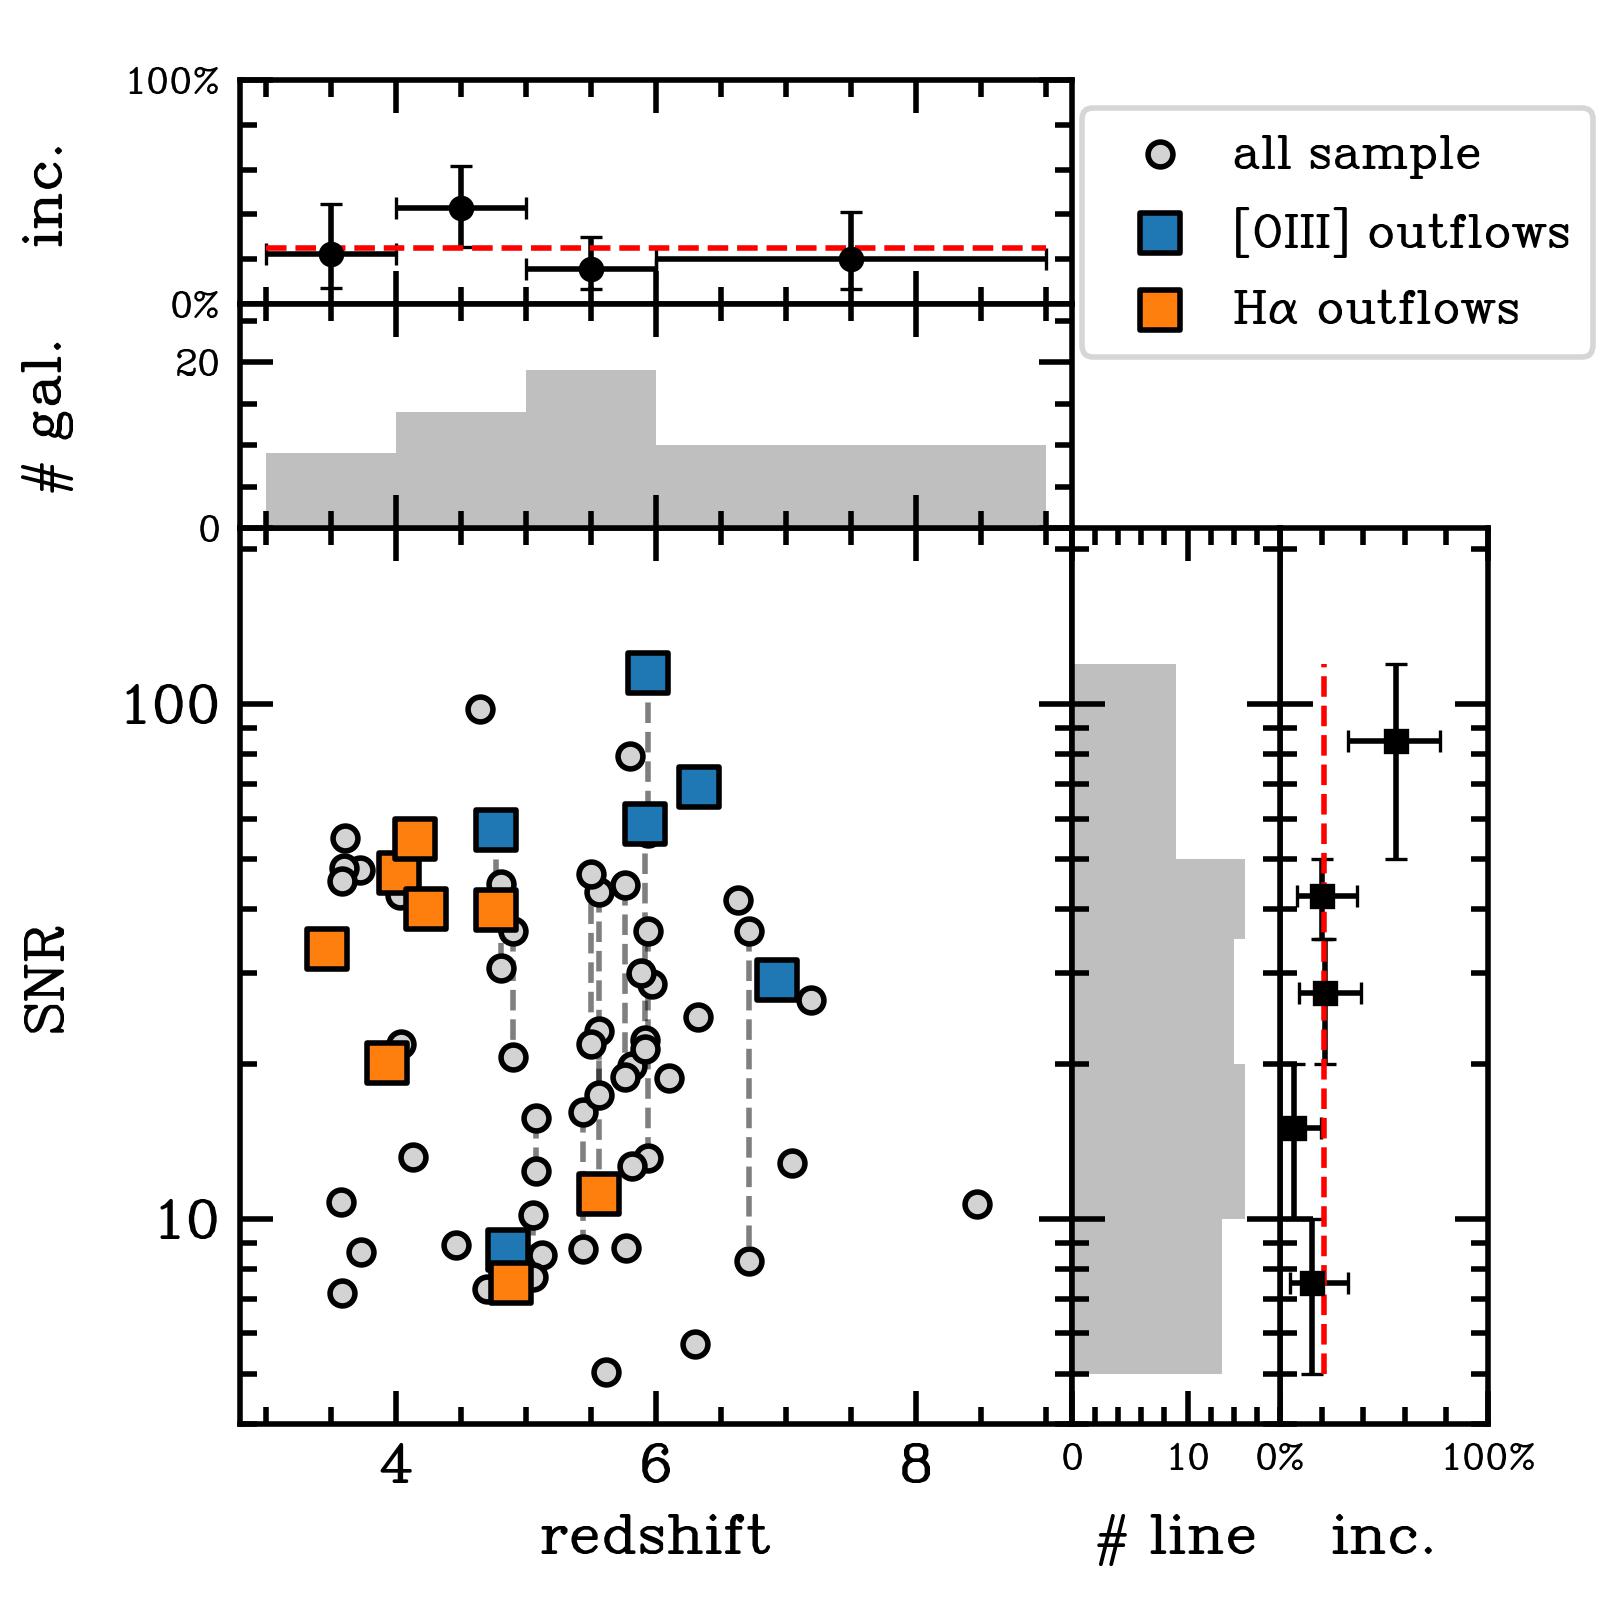
Among the 52 galaxies selected from the JADES survey of the Deep/HST field, 13 show outflow signatures that satisfy the requirements described in the previous section. These are reported in Figure 2, which shows the SNR of emission lines as a function of redshift. Out of the 13 outflows identified from broad components in the emission line profiles, five were detected in only [O] and seven in only H. Among the sub-sample of 14 galaxies observed in both lines, only one reveals evidence for broad components in both H and [O]. Using both nebular lines, we have derived an outflow incidence rate of that appears constant, within the uncertainties, over the redshift range covered by our sample (top panel of Figure 2).
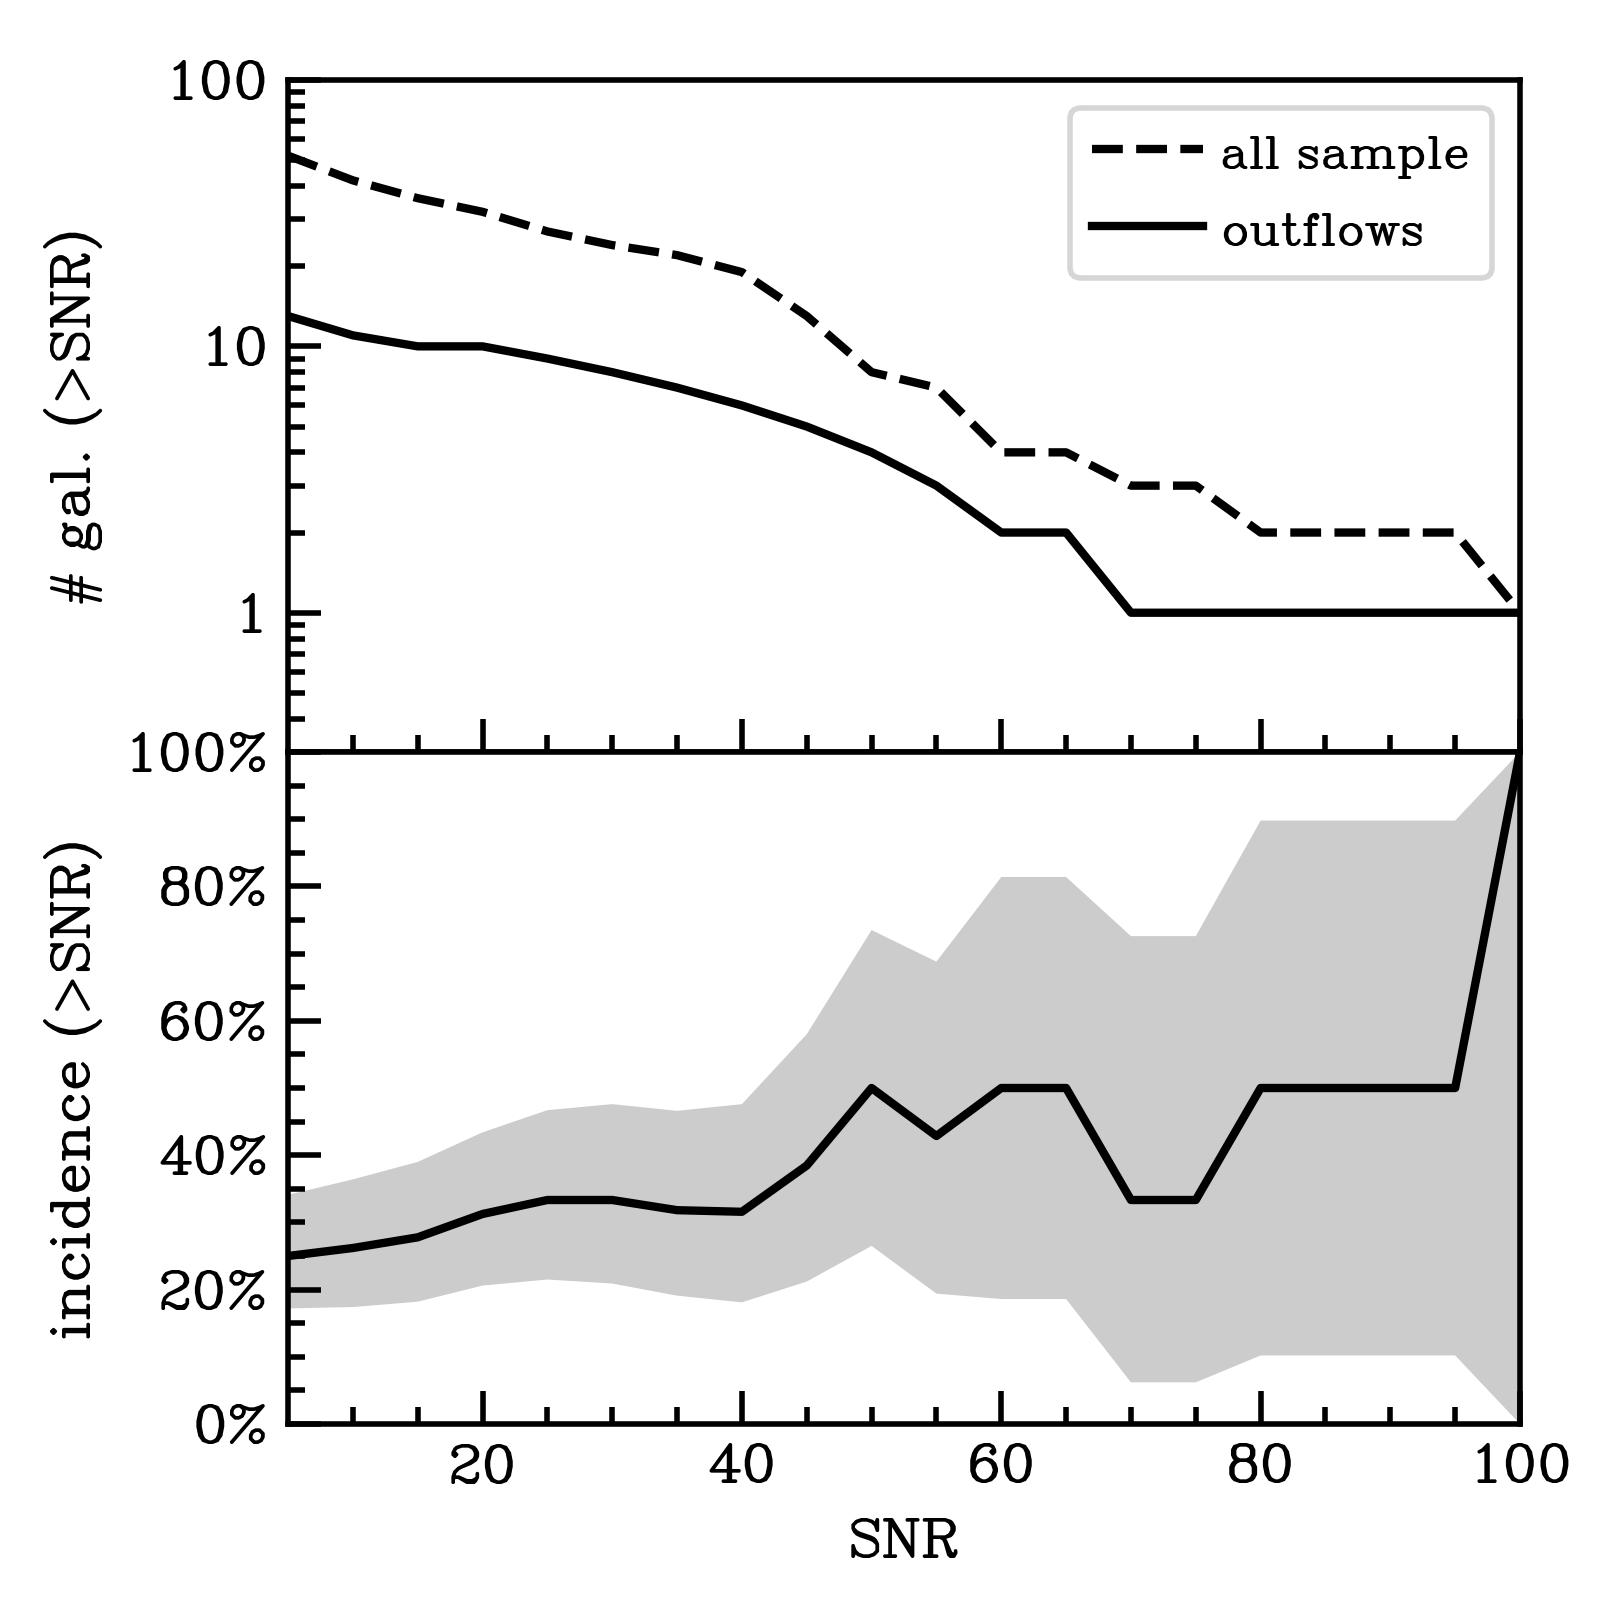
However, focusing on the fraction of outflow detections as a function of the SNR of the overall nebular line (right panel of Figure 2), we note that the incidence drops below if we select only galaxies whose nebular lines are detected with 5¡SNR¡20. Since the targets with SNR¡20 represent half of the sample, the low incidence rate could be affected by these fainter galaxies whose sensitivity is not sufficient to detect the broad outflow components in the emission line profiles. The dependence of the outflow incidence on the SNR is illustrated in Figure 3. The incidence reaches a value of when selecting only targets with SNR. However, the number of targets above this threshold is limited (), and the uncertainties on the incidence fraction are , yielding inconclusive results.
A detection fraction of may be caused by the geometry of the outflowing gas. If we assume a biconical outflow model with an opening angle of , which is consistent with what is typically measured in the local Universe (e.g., Venturi et al., 2018; López-Cobá et al., 2020; Juneau et al., 2022; Kakkad et al., 2023), the solid angle subtended by the outflow is steradians, where the factor of 2 is due to the biconical morphology. By taking into account that in spatially integrated spectra, the radiation emitted by outflowing gas can be clearly distinguished from that coming from the galactic disk only when the fast gas is moving along the line of sight, particularly in case of low outflow velocities (e.g., Woo et al., 2016; Lamperti et al., 2022), the probability of detecting the broad component can be approximated to , which is consistent with the incidence rate indicated by our observations. Under these assumptions, the inferred outflow incidence may indicate that outflows are common and even ubiquitous in the low-mass galaxy population at .
5.2 Host galaxy properties
As discussed in the previous Sec., we find a global outflow detection rate of depending on the SNR threshold. This indicates that it is more likely to detect a broad component tracing outflows when the SNR of the emission line is higher. On the other hand, the incidence fraction may also depend on the galaxy properties. Previous studies at lower redshift have concluded that the incidence fraction increases with increasing stellar mass (Weiner et al., 2009; Genzel et al., 2014; Förster Schreiber et al., 2019; Leung et al., 2019; Concas et al., 2022). Specifically, these studies found an incidence fraction in galaxies with while the fraction reaches values of in massive galaxies with . This trend was associated with the presence of AGN, which are more luminous in massive galaxies, thus making the outflows they accelerate more likely to be detected, being faster and more massive than in lower-mass galaxies. However, the sample of galaxies without AGN signatures shows that the incidence of outflows increases with the SFR supporting the scenario in which such fast gas is accelerated by star formation activity. We have thus investigated if the presence of outflows in our sample might depend on galaxy properties as well.
Figure 4 shows the incidence of broad components (i.e., outflows) in the galaxies of the sample as a function of stellar mass, star-formation rate, and specific star-formation rate (i.e., SFR/M⋆). We find a positive correlation between incidence rate and both M⋆ and SFR. This may be interpreted as evidence for more massive and more actively star-forming galaxies driving outflows more frequently. However, it is important to stress that the SNR of the nebular lines in our sample increases with increasing SFR (Appendix B), so the trend between incidence rate and SFR might just reflect the correlation between outflow detection rate and SNR shown in Figure 3. On the other hand, the stellar mass in Deep/HST pointing does not reveal any correlation with the strength of the nebular lines (Appendix B), and the positive trend between incidence rate and stellar mass does not seem to be a consequence of selection effects and probably has a physical origin. The positive correlation between outflow incidence and stellar mass might indicate that outflow velocities and kinetic energies are boosted by the radiation from faint AGN that are not detected with standard diagnostics (e.g., [OIII]/H versus [NII]H diagram; see Maiolino in prep.). This scenario has been recently presented in several theoretical studies (Silk, 2017; Dashyan et al., 2018; Koudmani et al., 2019) and supported by the growing number of works revealing AGN in low-redshift dwarf (M⋆ M⊙) galaxies (e.g., Sartori et al., 2015; Penny et al., 2018; Reines et al., 2020; Mezcua et al., 2023). The boost due to AGN radiation in more massive galaxies might increase the chance of detecting the broad component in nebular lines.
To reduce the dependency of outflow incidence with the SNR of the nebular line, in the third panel of Figure 3 we report the outflow demography as a function of the SFR averaged over the last 100 Myr estimated by beagle (SFR100). This parameter is less correlated to the strength of the nebular line (Appendix B), and the positive trend between outflow incidence and SFR100 suggests that these outflows are mainly driven by star-formation activity. However, improving the statistical robustness of this sample is fundamental for confirming such trends and identifying the mechanism that drives outflowing gas in the early Universe.
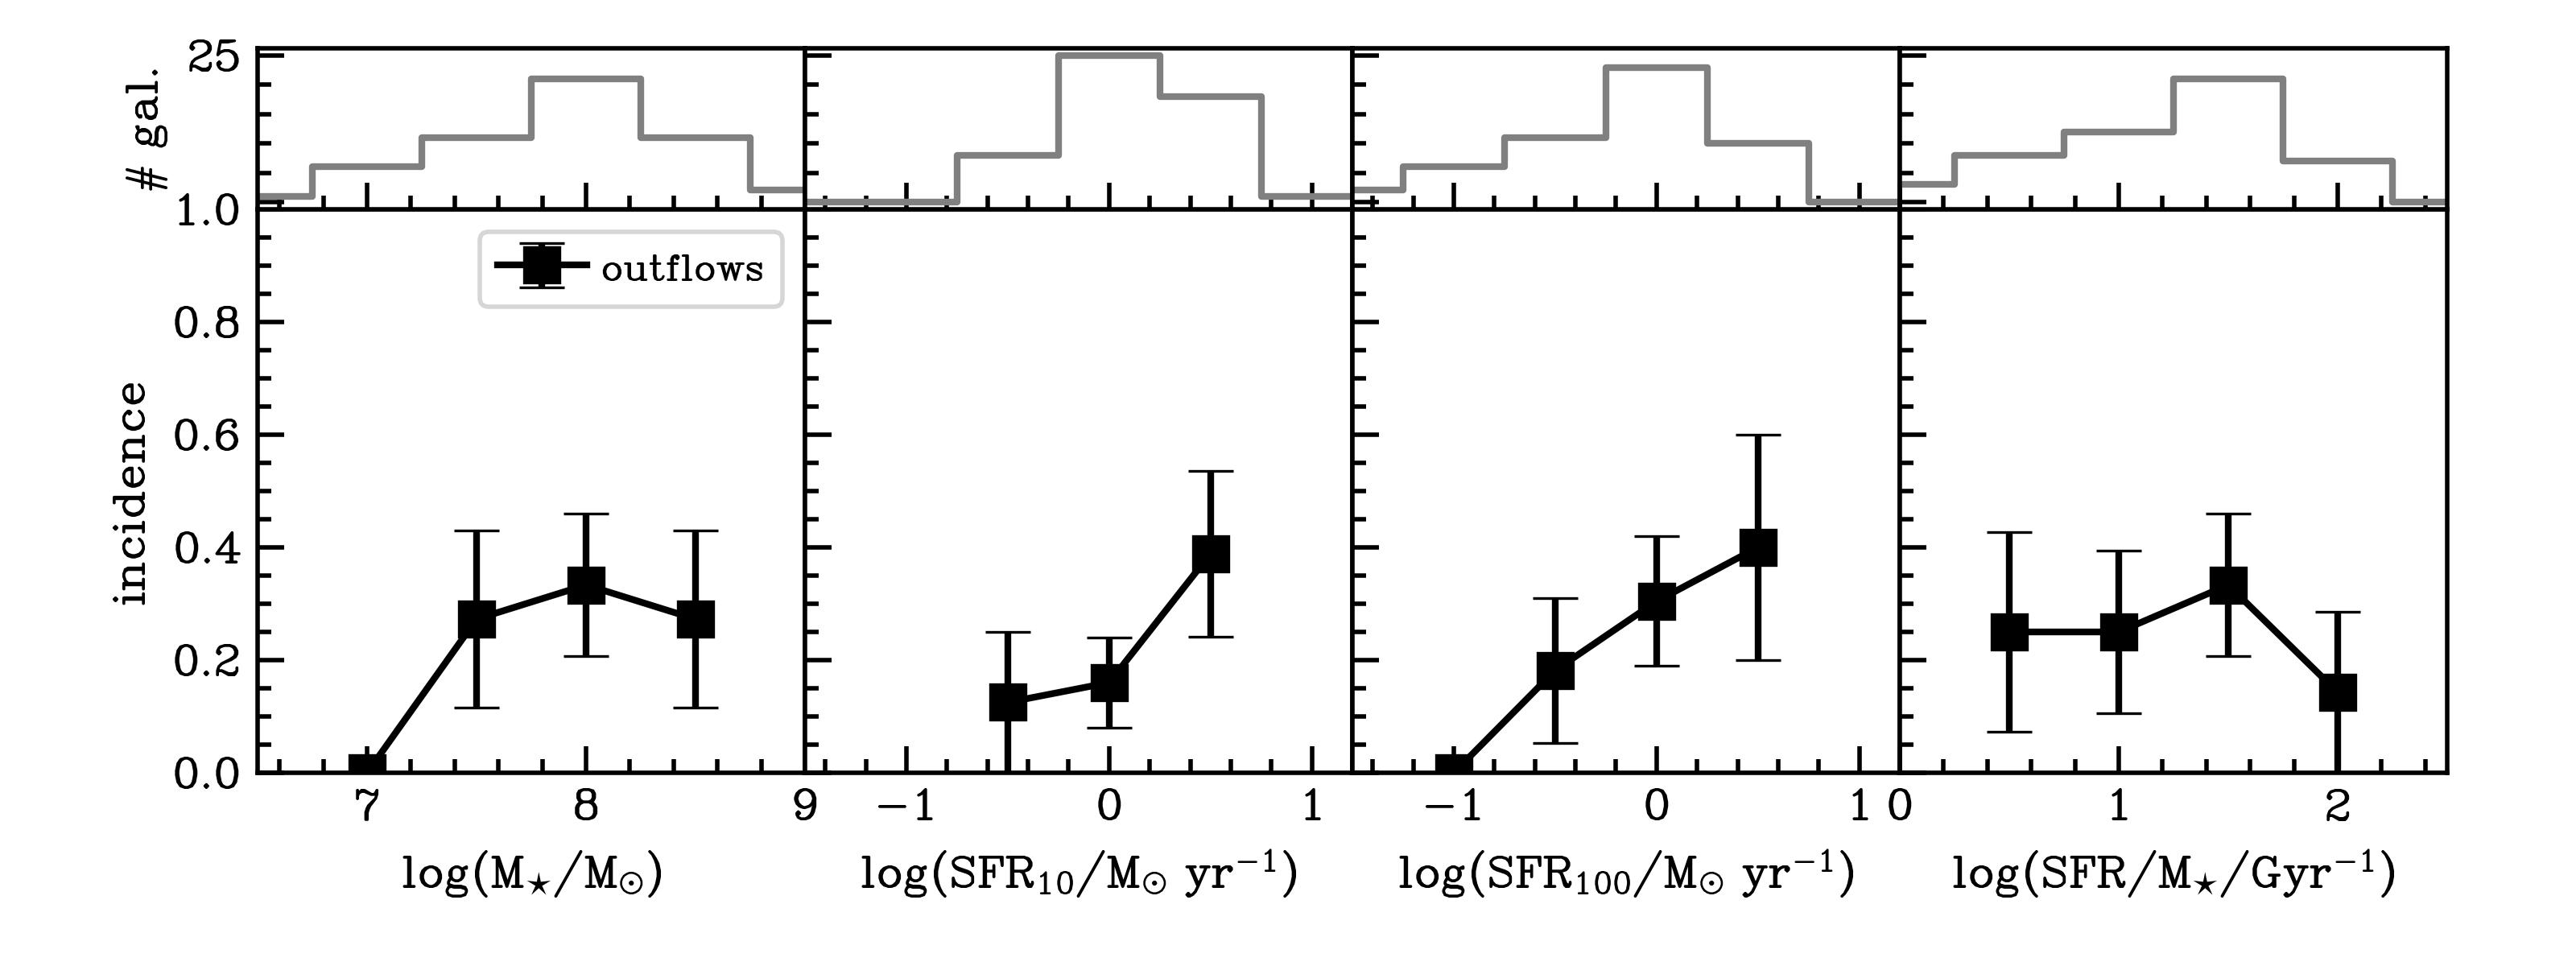
The last panel of Figure 4 illustrates the outflow incidence rate as a function of the specific star formation rate. Over the range covered by our sample (), the outflow incidence is constant within the error over the specific star formation rate range, but the low statistical significance does not allow us to identify a trend between the two observables. All in all, the detection of outflows in our sample is consistent with the framework in which galaxies whose specific star formation rate exceeds might develop radiation pressure-driven outflows which clear the galaxy of its gas and dust (Ziparo et al., 2022; Fiore et al., 2023).
6 Outflow properties
In this section, we estimate the physical properties of the outflows and explore the trends with galaxy properties.
6.1 Outflow velocity
We first focus on the velocities of the outflowing gas (), which we obtain by using the prescription from Rupke et al. (2005), who define the velocity of the outflowing gas as
where is the shift between the peak velocities of the broad and narrow components (the latter assumed to trace the systemic velocity) and is the velocity dispersion of the broad component, deconvolved by the instrumental line spread function as . In any case, the correction is small since km/s (depending on wavelength) and the measured are in the range km/s.
This method guarantees that the outflow velocity estimates do not depend strongly on the inclination of the outflow cone with respect to the line of sight (Rupke et al., 2005; Fiore et al., 2017). The outflow velocity estimates cover a range between 300 and 1200 , and the individual values for each galaxy are reported in Tables 1 and 2.
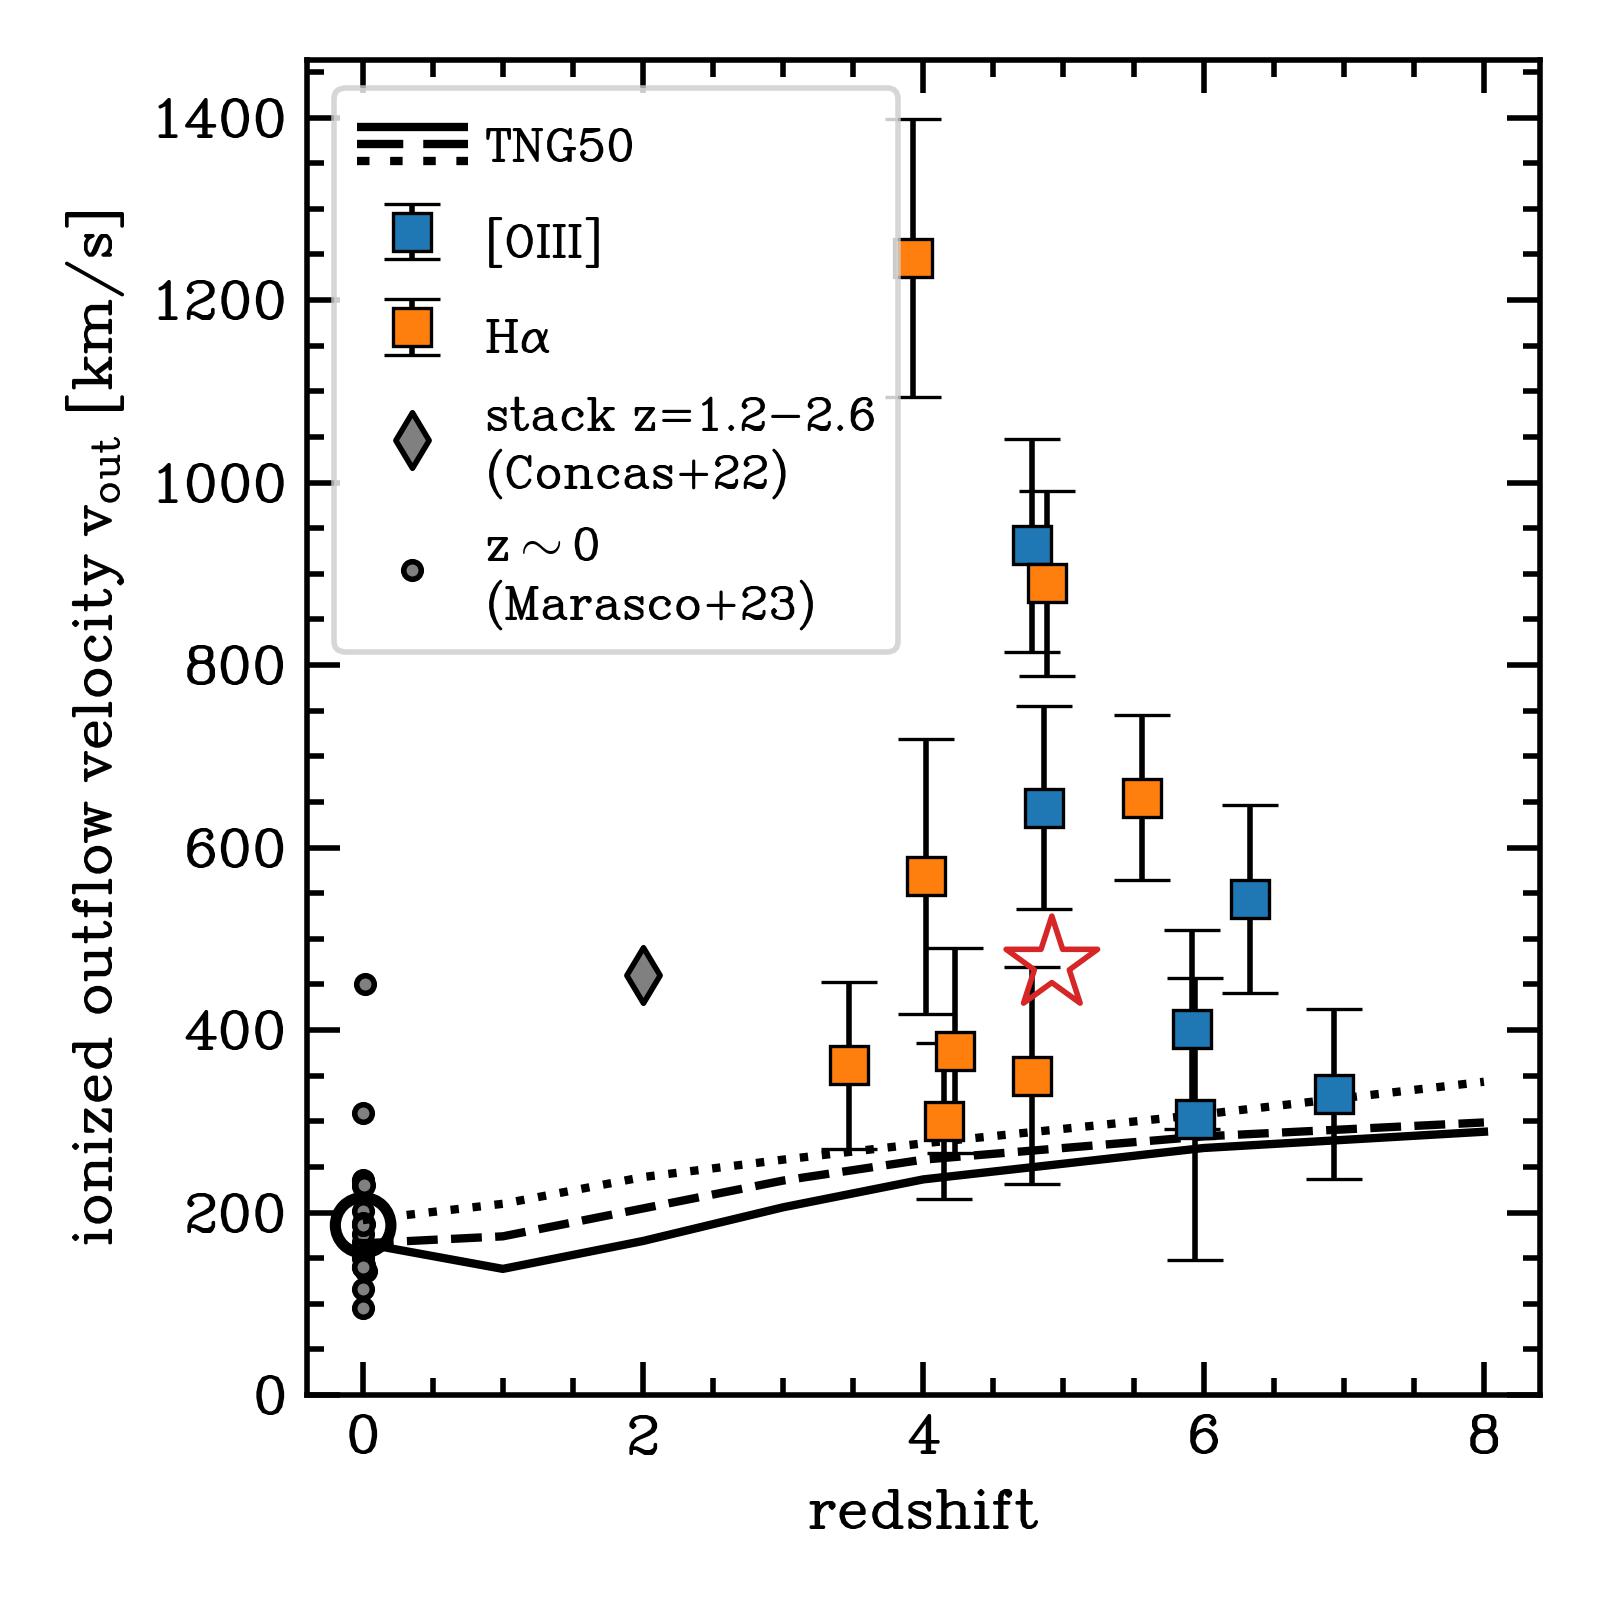
The evolution of outflow velocity as a function of cosmic time for low-mass galaxies is reported in Figure 5, where we compare the values found for our sample with those observed at lower redshifts. We stress that ionized outflow studies, based on rest-frame optical nebular lines, in low-mass galaxies to date are limited to a few samples due to the limited sensitivity of ground-based observations. In the local Universe, Marasco et al. (2023) investigate outflow properties in a sample of 19 nearby galaxies with stellar masses , mostly lying above the main sequence of star-forming galaxies. At high redshift, there is only one work by Concas et al. (2022) reporting only a tentative detection of outflows at in the mass range by stacking the spectra of 20 main-sequence galaxies.
The outflow velocity in our sample is about two times higher than the average outflow velocities inferred in a sample of local dwarf galaxies with similar stellar masses (Marasco et al., 2023), suggesting that outflow velocities increase rapidly from to . On the contrary, little or no evolution is found at higher redshifts. The broad component observed by Concas et al. (2022) in the stacked spectrum of a sample star-forming galaxies at shows a tentative outflow with a velocity of that comparable, or slightly higher than the average outflow velocity of our sample. Focusing only on the outflows at detected with JWST in our JADES sample, we find no evolution with redshift. A similar outflow velocity trend with cosmic time is also reported in other studies targeting massive galaxies (M⋆) that show a rapid evolution up to while the correlation is almost flat at higher redshift (Sugahara et al., 2019).
The theoretical predictions by Nelson et al. (2019), who analyzed outflow properties in about 20,000 galaxies with stellar mass and in TNG50 simulations, agree well with our observational trend, although the velocities at predicted by simulations for low-mass galaxies are that are three times lower with respect to our median outflow velocity. In the simulations, the redshift dependence is caused by the adopted feedback prescription that connects the outflow velocity to the halo virial mass (Pillepich et al., 2018). This implies that the velocity and the growth of the virial halo mass have the same scaling with redshift. Despite the agreement between observations and simulations, the statistics in our sample are still too limited to conclude whether the outflow prescription adopted in TNG50 is correct or not.
We also examined the relation between outflow kinematic parameters and galaxy properties, finding no correlation between outflow velocity and star formation rate or stellar mass (see Appendix C). The lack of correlation is overall consistent with simulations and theoretical models, which predict a trend only in massive galaxies, where bright AGN drive fast outflowing gas, while no trend or only a weak correlation is expected in the low-mass regime (Muratov et al., 2015; Nelson et al., 2019).
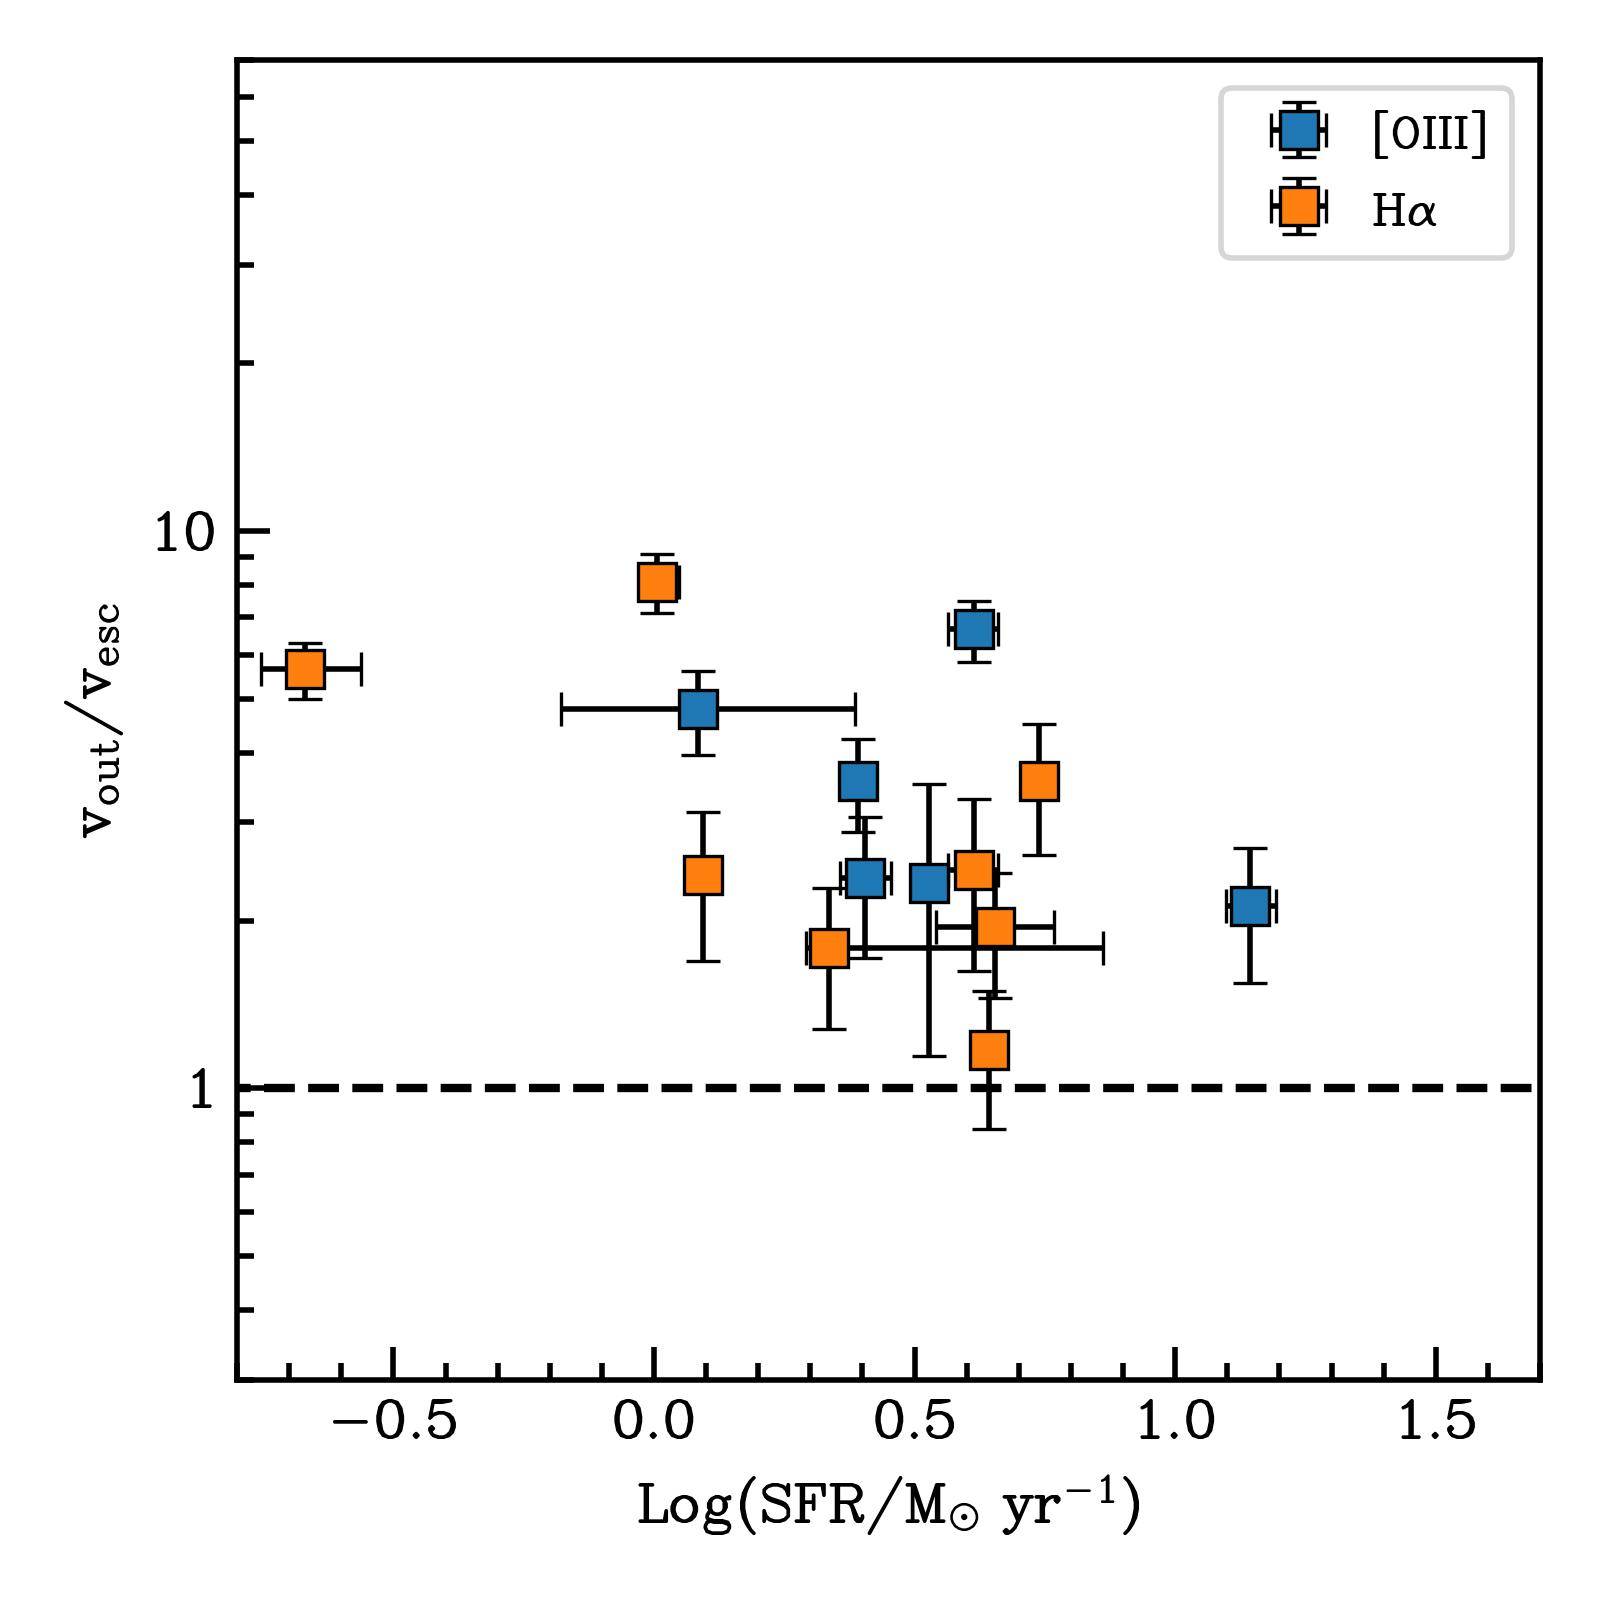
To verify whether outflows can represent the feedback mechanism required by theory to wipe gas out of galaxies and thus deplete the fuel for star formation, we compared the outflow velocity with the escape velocity from the galaxy. We computed the escape velocity by considering a Hernquist potential (Hernquist 1990) for the galactic disk component, defined by the following density profile:
| (1) |
where , is the half-light (or effective) radius of the galaxy, and Mgas is the total gas mass. For the Mgas we assumed , which is the average gas fraction measured at (Pavesi et al., 2019; Dessauges-Zavadsky et al., 2020). For the dark matter halo we adopted a Navarro-Frenk-White (NFW) potential (Navarro et al., 1996) given by the following density profile:
| (2) |
where is the critical density of the Universe, the characteristic overdensity for the halo and = the characteristic radius, being the concentration parameter at redshift . The virial dark matter halo mass () is inferred from the stellar-to-halo mass relation of Moster et al. (2013), following the prescription by Posti et al. (2019), and the concentration is determined from the - relation of Dutton & Macciò (2014). Finally, we determined the escape velocity for the combination of the two profiles by using the python package galpy (Bovy, 2015). We thus found that the outflow velocities are, on average, three times larger than the escape velocity (Figure 6). This indicates that the outflows are able to eject gas from the galaxy and enrich the circum-galactic gas outside the virial radius and inter-galactic medium on large scales. A similar result has been recently found by Übler et al. (2023) in a massive AGN-host galaxy revealing an outflow of 700 , which is potentially able to escape the potential well of the galaxy and enrich the inter-galactic medium. We stress that the escape velocity estimated above, on one hand, is valid for ballistic motions and thus does not take into account that the outflow could keep on being accelerated, as in the case of direct radiation pressure or of an expanding shocked bubble, while on the other hand, it is expected to be slowed down by ram pressure due to the ambient gas it encounters during its propagation.
6.2 Mass loading factor
In the previous section, we discussed the kinematics and the potential impact of ionized outflows on low-mass galaxies at high redshift. We now determine if the amount of ionized gas removed by outflows per unit of time is larger than that converted to stellar mass due to star formation. Specifically, we estimate the mass-loading factor , which is defined as the ratio between the mass loss rate due to outflows and the SFR. If , outflows can have a negative feedback impact on their host galaxy, effectively quenching star formation, as models predict (e.g., Muratov et al., 2015; Nelson et al., 2019).
For a uniformly filled conical outflow, the mass outflow rate is defined as
| (3) |
where is the mass of the outflowing gas and is the extension of the outflow (e.g., Maiolino et al., 2012; González-Alfonso et al., 2017). The mass of the gas can be estimated from the luminosity of the broad component of H (e.g., Concas et al., 2022) or [O] (e.g., Carniani et al., 2015):
| (4) |
and
| (5) |
where and are the metallicity and the electron density of the outflowing gas.
As the above equations show, the outflow mass is sensitive to the electron density and metallicity of the outflowing gas. These two gas properties are generally assumed for most outflow studies in the local and distant Universe (Förster Schreiber et al., 2019; Concas et al., 2019, 2022; Marasco et al., 2023). Key diagnostic emission lines needed to estimate electron density (e.g., [SII]6716,6731; Förster Schreiber et al. 2019; Davies et al. 2020) and gas-phase metallicity ([O III]4363; Cameron et al. 2021), either are too faint to be detected in the observed outflows or are not covered by the G395H/F290LP NIRSpec observations for most of our targets. Therefore, we assume an electron density of , which is the typical value estimated from deep observations of star-formation-driven outflows (Förster Schreiber et al. 2019; also adopted by Concas et al. 2022), and a as large as the gas-phase metallicity of the interstellar medium. The latter was recently estimated for the same JADES galaxies analyzed in this work by Curti et al. (2023) and spans a range of . We associate a 0.3 dex uncertainty on the measurement of the ionized gas outflow mass, which takes into account the typical variations of metallicity and electron density (following Concas et al. 2022).
Determining the outflow extension from the NIRSpec MSA data requires detailed modeling of the 2D spectra to quantify the impact of the background subtraction process, slit losses, and impact of the bar shadow on the surface brightness emission. In addition, a detailed kinematic analysis is necessary to distinguish the galactic disk emission from the outflow emission pixel-by-pixel. Therefore, in this work, which is meant as a first exploration of outflows in low-mass galaxies at high redshift, we use the same assumption adopted in other studies, which assumed the ionized outflows to be as extended as the galaxy, that is, . This assumption is supported by the typical sizes of ionized gas outflows determined with high-spatial resolution observations of local and low- star-forming galaxies (Newman et al., 2012; Förster Schreiber et al., 2014b). We thus adopt the half-light radius of the galaxies determined by NIRCam imaging (Rieke & the JADES Collaboration, 2023) to calculate the mass loss rate of the ionized outflows.
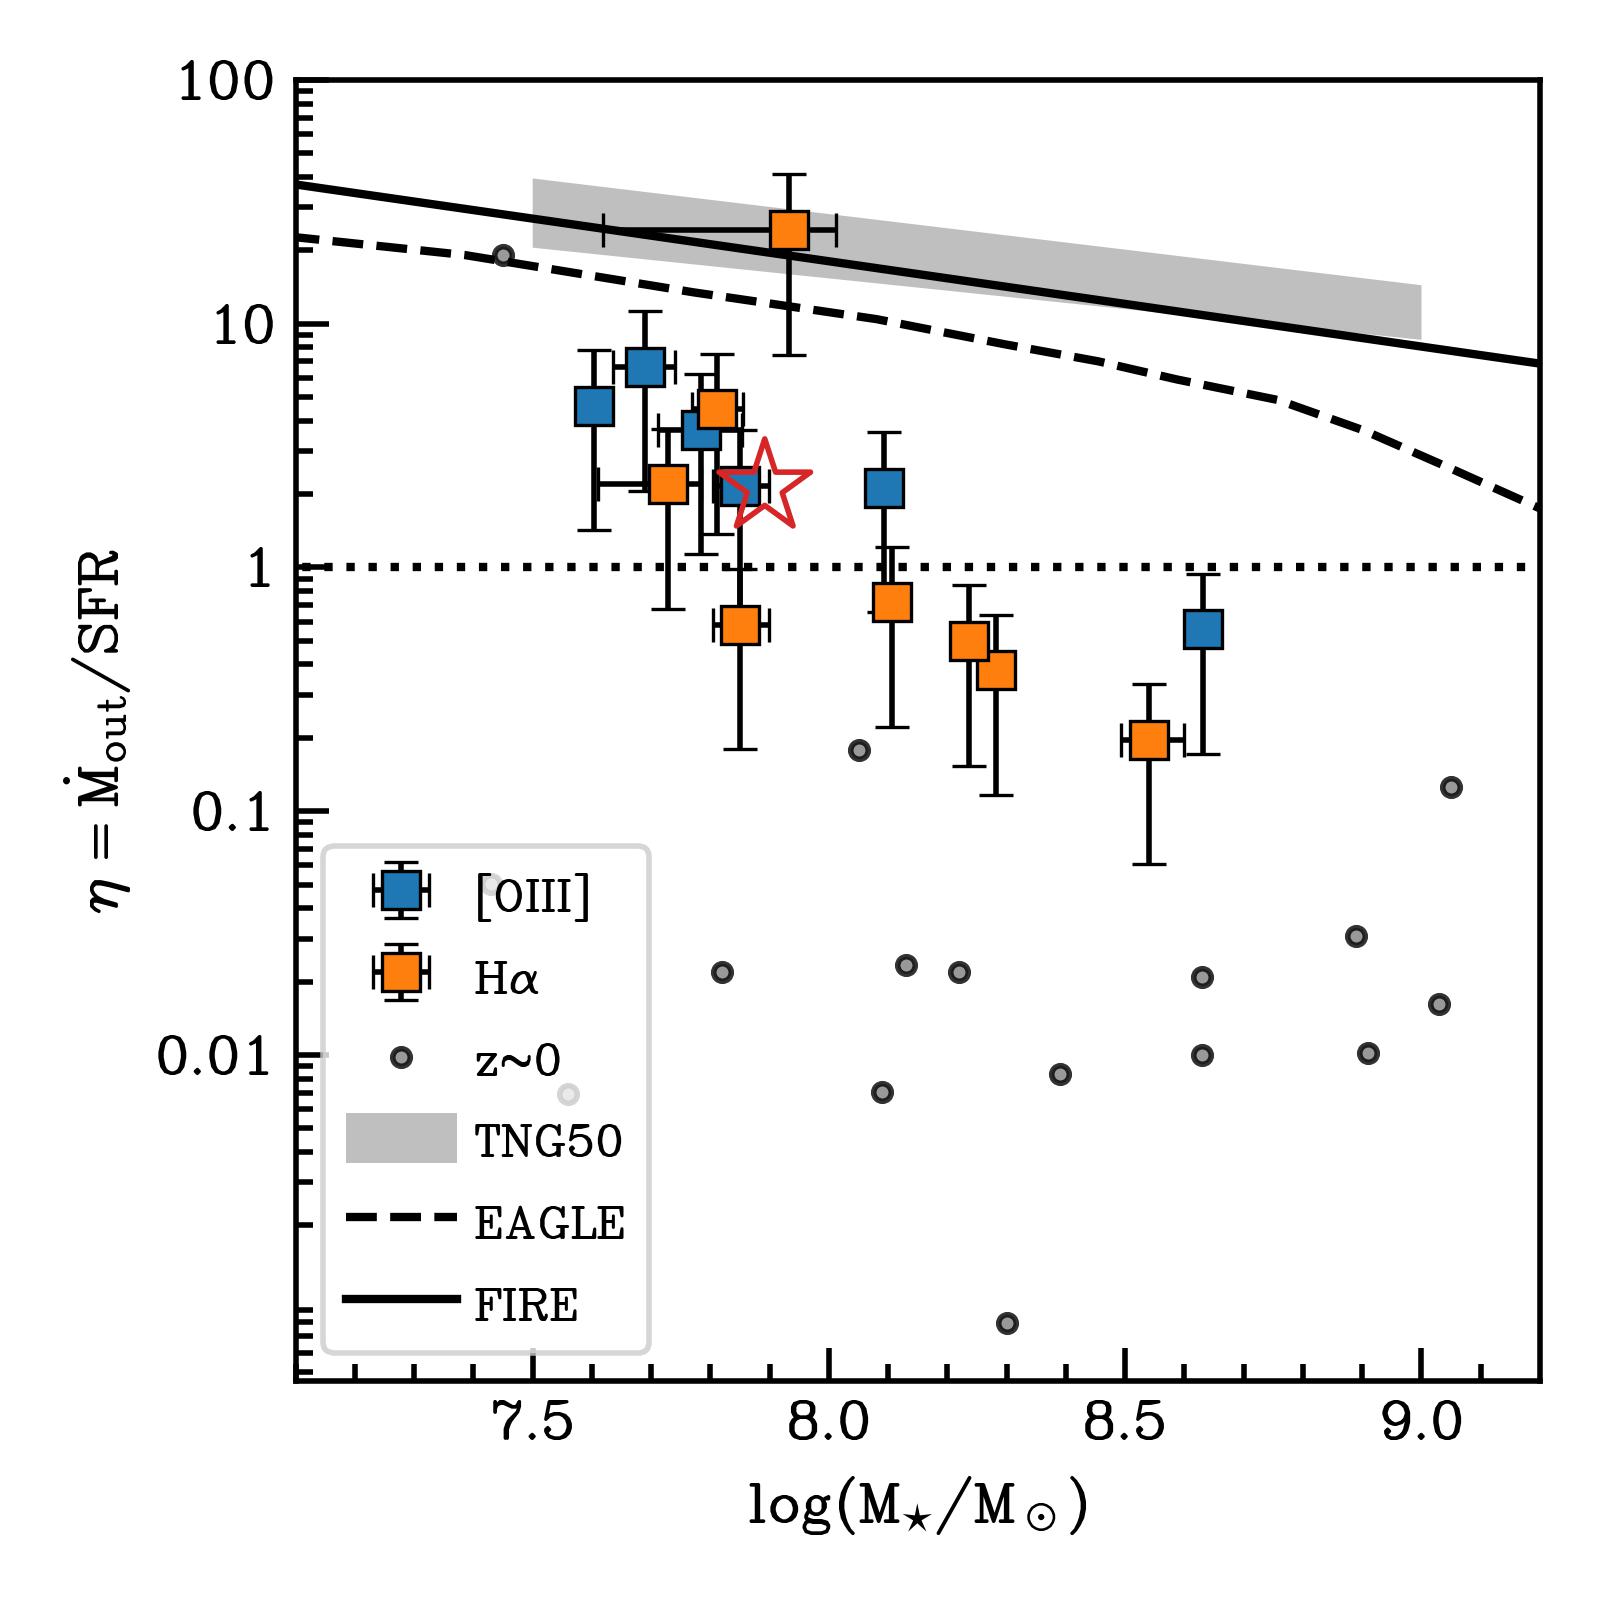
Based on the inferred estimates of outflow mass, velocity, and radius, we determine the mass outflow rate by using Equation 3 and, from this, the mass loading factor for each outflow (Table 3). Our sample has a median mass loading factor of , which is in good agreement with models which predict that feedback from supernovae is the main outflow driver and is required to regulate star formation and metal enrichment in galaxies (e.g. Finlator & Davé, 2008; Davé et al., 2011; Heckman et al., 2015).
Figure 7 presents the dependence of the outflow mass loading factor on stellar mass for the JADES sample. The figure shows that is inversely proportional to stellar mass. It reaches values up to at and decreases down to at . Theory predicts that outflows driven by a momentum- or energy-conserving shocked expanding bubble powered by star formation activity are expected to have a power-law dependence of the mass loading factor on stellar mass with slopes in the range to (Dutton, 2012; Muratov et al., 2015; Nelson et al., 2019). This is different from the much steeper trend we find (Figure 7), whose slope is .
In addition, the inferred mass loading factor is, on average, five times lower than the predictions from cosmological simulations, which require to reproduce the expected stellar-to-halo mass ratio in the mass range of our sample (Muratov et al., 2015; Nelson et al., 2019; Mitchell et al., 2020). This discrepancy may arise from the fact that optical nebular lines only map the warm ( K) ionized gas, while part of the gas may be in a cold molecular and neutral atomic phase ( K) or even in a hot ( K) ionized phase (Cicone et al., 2014; Carniani et al., 2015; Nelson et al., 2019; Fluetsch et al., 2019; Herrera-Camus et al., 2019; Fluetsch et al., 2021). Moreover, the fraction of ionized gas at a given distance from the galaxy depends on the amount of ionizing photons intercepting the gas clouds at that distance, and consequently, the ionized gas fraction is determined by the covering factor of the gas clouds (i.e., the fraction of sky covered by photoionized gas clouds, as seen from the emitter) and by the shading of the flux due to the gas clouds at smaller distances. Therefore, the tracer we use (the warm ionized gas) may not map the bulk of outflowing gas at large distances. Finally, the mass outflow rate estimated by the nebular lines could be underestimated as the photo-centroid of the light emission of both H and [O] could be at smaller distances, and the assumption on the outflow radius used in Equation 3 may be overestimated. Deep NIRSpec observations in integral-field spectroscopic (IFS) mode will be fundamental to spatially resolve ionized outflows in the early Universe and determine their properties as a function of distance from the galactic center.
In conclusion, the mass loading factor estimated from the rest-frame optical nebular lines is at least as large as the star formation rate estimates for most of the galaxies in our sample. We note that the median mass loading factor is 100 times higher than what is observed in the local Universe by Marasco et al. (2023), who reports a median mass loading factor of 0.02. This indicates that the star formation activity in the early Universe can be strongly affected by galactic outflows, which, according to theoretical studies, can be driven by either supernovae or radiation pressure from stars, or both (Heckman et al., 1990; Murray et al., 2005; Dutton, 2012; Muratov et al., 2015; Hopkins et al., 2016, 2018; Nelson et al., 2019; Ziparo et al., 2023). However, we cannot exclude that faint accreting super-massive black holes are hidden at the center of the galaxies in our sample, and their radiation boosts the outflow energetics as predicted by recent theoretical works (Dashyan et al., 2018; Koudmani et al., 2019; Mezcua et al., 2023).
7 Conclusions
We investigated the outflow incidence and properties of 52 low-mass ( M⊙) star-forming galaxies at by exploiting the JWST/NIRSpec R2700 observations of the JADES Deep/HST program. We inferred the presence of outflowing gas through the analysis of the rest-frame optical lines, specifically H or [O], or both, which can be detected with NIRSpec up to . Our main findings are listed in the following:
-
1.
We find evidence for ionized outflows in of the 52 galaxies of the sample, where the incidence rate depends on the SNR. This incidence rate may be caused by the geometry of the outflowing gas. If outflows have a biconical morphology with an opening angle of deg, we expect an incidence rate of , which is consistent with our observations.
-
2.
The incidence of outflows increases with stellar mass and SFR, suggesting that outflows are more frequent in more massive and starbursting galaxies.
-
3.
The inferred outflow velocities are three times larger than the median velocity observed in local dwarf star-forming galaxies. This indicates that outflows are more powerful in the distant Universe than they are at low redshift.
-
4.
For most galaxies, the velocity of the outflowing gas is larger than the escape velocity from the gravitational potential of the host galaxy and its dark matter halo. This means that the expelled outflows are able to enrich both the circum-galactic and the inter-galactic media.
-
5.
The inferred mass-loading factor of the outflows (mass-loss rate versus star formation rate in the host) spans values between , with a median of , which is about 100 times higher than the mass loading factors observed in local dwarf galaxies. This indicates that the impact of ejective feedback mechanisms in the early galaxies is significant and might explain the presence of quiescent galaxies in the first Gyr of the Universe (Looser et al., 2023).
-
6.
We find that the mass loading factor decreases with increasing stellar mass with a slope of . Although an anti-correlation is consistent with the predictions from theoretical studies, the mass-loading factor is a factor of three smaller than that predicted by simulations for galaxies at the same masses and redshifts.
This study provides the first census of ionized outflows in the galaxy population at with stellar masses M⊙. Our results suggest that ionized outflows play a crucial role in the evolution of galaxies and in the metal enrichment of the circum- and inter-galactic media. Thanks to JWST, we can detect and study outflows on a wide range of stellar masses and SFRs in the high-redshift Universe and provide new insights on galaxy formation and evolution. Future deep and wide NIRSpec observations will be crucial to expand the current sample of galaxies showing outflows and understand their impact on galaxies.
| ID | SNRbroad | |||||||||
|---|---|---|---|---|---|---|---|---|---|---|
| [] | [] | [] | [] | |||||||
| (1) | (2) | (3) | (4) | (5) | (6) | (7) | (8) | (9) | (10) | (11) |
| 3184 | 10.8 | 1.41 | 0.85 | 7.29 | ||||||
| 4270 | 5.1 | 1.43 | 0.75 | 10.33 | ||||||
| 4297 | 1.2 | 0.74 | 0.66 | -1.89 | ||||||
| 4404 | 0.4 | 0.90 | 0.92 | -3.67 | ||||||
| 5329 | 1.9 | 0.98 | 0.81 | 1.36 | ||||||
| 5759 | 0.9 | 1.09 | 0.99 | -1.26 | ||||||
| 6002 | 1.7 | 1.44 | 1.31 | 0.61 | ||||||
| 6246 | 3.1 | 0.95 | 0.69 | 3.92 | ||||||
| 6384 | 0.7 | 1.30 | 1.29 | -1.89 | ||||||
| 7507 | 1.1 | 1.00 | 0.98 | -3.55 | ||||||
| 7762 | 14.5 | 1.24 | 0.64 | 7.43 | ||||||
| 7809 | 1.0 | 0.86 | 0.70 | -1.46 | ||||||
| 7892 | 8.2 | 0.96 | 0.58 | 3.16 | ||||||
| 7938 | 2.5 | 1.55 | 1.36 | 1.49 | ||||||
| 8083 | 10.5 | 4.70 | 1.44 | 85.81 | ||||||
| 8113 | 1.7 | 0.97 | 0.82 | 0.82 | ||||||
| 9422 | 1.6 | 1.32 | 1.14 | -0.38 | ||||||
| 9743 | 1.9 | 1.51 | 1.18 | 3.56 | ||||||
| 16745 | 2.0 | 1.17 | 0.86 | 6.38 | ||||||
| 17072 | 1.2 | 1.01 | 0.95 | -1.48 | ||||||
| 17260 | 3.6 | 1.30 | 1.09 | 2.72 | ||||||
| 17777 | 2.5 | 1.18 | 0.82 | 4.37 | ||||||
| 18028 | 1.6 | 0.76 | 0.74 | -1.01 | ||||||
| 18090 | 12.8 | 1.22 | 0.90 | 2.90 | ||||||
| 18970 | 13.3 | 2.11 | 1.81 | 1.75 | ||||||
| 19519 | 2.2 | 1.08 | 1.07 | -4.34 | ||||||
| 10000626 | 0.9 | 0.58 | 0.56 | -1.87 | ||||||
| 10005113 | 1.1 | 0.46 | 0.44 | -1.99 | ||||||
| 10009506 | 5.8 | 0.81 | 0.62 | -0.71 | ||||||
| 10013545 | 4.1 | 0.88 | 0.70 | -3.00 | ||||||
| 10013704 | 4.2 | 3.02 | 1.16 | 60.09 | ||||||
| 10015338 | 1.6 | 1.06 | 0.95 | -0.50 | ||||||
| 10016186 | 3.1 | 1.21 | 0.71 | 9.05 | ||||||
| 10016374 | 2.7 | 0.80 | 0.71 | -2.53 | ||||||
| 10035295 | 8.2 | 1.01 | 0.94 | -2.50 |
Note: (1) NIRSpec ID of the target; (2) amplitude of the narrow component; (3,4) velocity centroid and dispersion of the narrow Gaussian component with respect to the systemic redshift of the galaxy reported in Bunker et al. (2023); (5) broad-to-narrow Gaussian amplitude ratio; (6) velocity centroid of the broad Gaussian component with respect to the systemic redshift of the galaxy; (7) broad-to-narrow Gaussian velocity dispersion ratio; (8) signal-to-noise ratio of the integrated flux of broad component; (9,10) reduced chi-squared for the single- and double-Gaussian models, respectively; (11) log-difference between the two Bayesian evidences of the single and double-Gaussian models.
| ID | SNRbroad | |||||||||
|---|---|---|---|---|---|---|---|---|---|---|
| [] | [] | [] | [] | |||||||
| (1) | (2) | (3) | (4) | (5) | (6) | (7) | (8) | (9) | (10) | (11) |
| 3968 | 0.8 | 0.45 | 0.40 | -1.74 | ||||||
| 4297 | 1.2 | 0.94 | 0.85 | -1.79 | ||||||
| 4404 | 1.8 | 0.55 | 0.45 | -1.43 | ||||||
| 5457 | 4.1 | 1.04 | 0.66 | 3.89 | ||||||
| 5759 | 0.5 | 0.45 | 0.45 | -2.54 | ||||||
| 6002 | 4.9 | 0.79 | 0.66 | -2.17 | ||||||
| 6246 | 3.2 | 1.08 | 1.01 | -2.47 | ||||||
| 7938 | 15.1 | 0.76 | 0.44 | 0.15 | ||||||
| 8013 | 0.9 | 0.76 | 0.73 | -2.27 | ||||||
| 8113 | 1.3 | 0.89 | 0.89 | -3.71 | ||||||
| 9422 | 34.8 | 3.32 | 1.65 | 26.88 | ||||||
| 9452 | 0.4 | 0.85 | 0.86 | -2.89 | ||||||
| 9743 | 1.3 | 0.48 | 0.45 | -2.71 | ||||||
| 16625 | 1.5 | 0.72 | 0.70 | -3.15 | ||||||
| 16745 | 1.1 | 0.83 | 0.77 | -2.42 | ||||||
| 17566 | 2.2 | 1.98 | 1.80 | 1.74 | ||||||
| 18090 | 4.3 | 3.22 | 2.32 | 15.86 | ||||||
| 18846 | 5.9 | 1.55 | 1.02 | 9.27 | ||||||
| 18976 | 8.3 | 1.26 | 1.06 | -1.30 | ||||||
| 19342 | 1.3 | 0.86 | 0.76 | -2.53 | ||||||
| 19606 | 1.5 | 1.16 | 1.13 | -2.26 | ||||||
| 20961 | 0.6 | 1.31 | 1.32 | -3.60 | ||||||
| 22251 | 24.5 | 1.73 | 1.66 | -2.33 | ||||||
| 10009693 | 1.1 | 0.68 | 0.63 | -1.68 | ||||||
| 10013609 | 13.6 | 2.32 | 0.99 | 32.53 | ||||||
| 10013620 | 2.0 | 0.95 | 0.89 | -2.36 | ||||||
| 10013704 | 9.5 | 1.53 | 1.00 | 7.32 | ||||||
| 10013905 | 2.6 | 1.20 | 0.96 | 2.21 | ||||||
| 10015338 | 1.9 | 1.04 | 0.75 | 3.32 | ||||||
| 10016374 | 2.1 | 2.40 | 1.99 | 2.97 | ||||||
| 10056849 | 1.3 | 0.99 | 0.94 | -2.44 |
Note: (1) NIRSpec ID of the target; (2) amplitude of the narrow component; (3,4) velocity centroid and dispersion of the narrow Gaussian component with respect to the systemic redshift of the galaxy reported in Bunker et al. (2023); (5) broad-to-narrow Gaussian amplitude ratio; (6) velocity centroid of the broad Gaussian component with respect to the systemic redshift of the galaxy; (7) broad-to-narrow Gaussian velocity dispersion ratio; (8) signal-to-noise ratio of the integrated flux of broad component; (9,10) reduced chi-squared for the single- and double-Gaussian models, respectively; (11) log-difference between the two Bayesian evidences of the single and double-Gaussian models.
| ID | Log(/M⊙) | Log(SFR/M⊙ yr-1) | Log(/M⊙) | Log() | |||
| [kpc] | [] | [M] | |||||
| (1) | (2) | (3) | (4) | (5) | (6) | (7) | (8) |
| [O] | |||||||
| 5457 | 0.21 | ||||||
| 9422 | 0.30 | ||||||
| 18090 | 0.64 | ||||||
| 18846 | 0.52 | ||||||
| 10013609 | 0.33 | ||||||
| 10013704 | 0.31 | ||||||
| H | |||||||
| 3184 | 0.71 | ||||||
| 4270 | 0.44 | ||||||
| 6246 | 0.29 | ||||||
| 7762 | 0.61 | ||||||
| 7892 | 0.10 | ||||||
| 17260 | 0.17 | ||||||
| 18090 | 0.64 | ||||||
| 10016186 | 4.06 | ||||||
Acknowledgements.
SC and GV acknowledge support by European Union’s HE ERC Starting Grant No. 101040227 - WINGS. ECL acknowledges support of an STFC Webb Fellowship (ST/W001438/1). RM, JS, JW, and LS acknowledge support by the Science and Technology Facilities Council (STFC) and by the ERC through Advanced Grant 695671 ”QUENCH”. RM also acknowledges funding from a research professorship from the Royal Society. JW also thanks the support by the Fondation MERAC. AJB, AJC, JC acknowledge funding from the ”FirstGalaxies” Advanced Grant from the European Research Council (ERC) under the European Union’s Horizon 2020 research and innovation programme (Grant agreement No. 789056). RS acknowledges support from a STFC Ernest Rutherford Fellowship (ST/S004831/1). SA, MP and BRP acknowledge support from Grant PID2021-127718NB-I00 funded by the Spanish Ministry of Science and Innovation/State Agency of Research (MICIN/AEI/ 10.13039/501100011033). MP acknowledges support from the Programa Atracción de Talento de la Comunidad de Madrid via grant 2018-T2/TIC-11715. HÜ gratefully acknowledges support by the Isaac Newton Trust and by the Kavli Foundation through a Newton-Kavli Junior Fellowship. DJE is supported as a Simons Investigator and by JWST/NIRCam contract to the University of Arizona, NAS5-02015. BER acknowledges support from the NIRCam Science Team contract to the University of Arizona, NAS5-02015. The research of CCW is supported by NOIRLab, which is managed by the Association of Universities for Research in Astronomy (AURA) under a cooperative agreement with the National Science Foundation. Funding for this research was provided by the Johns Hopkins University, Institute for Data Intensive Engineering and Science (IDIES). This research is supported in part by the Australian Research Council Centre of Excellence for All Sky Astrophysics in 3 Dimensions (ASTRO 3D), through project number CE170100013. The Cosmic Dawn Center (DAWN) is funded by the Danish National Research Foundation under grant no.140.References
- Alves de Oliveira et al. (2018) Alves de Oliveira, C., Birkmann, S. M., Böker, T., et al. 2018, in Society of Photo-Optical Instrumentation Engineers (SPIE) Conference Series, Vol. 10704, Observatory Operations: Strategies, Processes, and Systems VII, 107040Q
- Arribas et al. (2014) Arribas, S., Colina, L., Bellocchi, E., Maiolino, R., & Villar-Martín, M. 2014, A&A, 568, A14
- Bagley et al. (2023) Bagley, M. B., Finkelstein, S. L., Koekemoer, A. M., et al. 2023, ApJ, 946, L12
- Behroozi et al. (2019) Behroozi, P., Wechsler, R. H., Hearin, A. P., & Conroy, C. 2019, MNRAS, 488, 3143
- Behroozi et al. (2013) Behroozi, P. S., Wechsler, R. H., & Conroy, C. 2013, ApJ, 770, 57
- Binney & Tremaine (2008) Binney, J. & Tremaine, S. 2008, Galactic Dynamics: Second Edition
- Bovy (2015) Bovy, J. 2015, ApJS, 216, 29
- Bunker et al. (2023) Bunker, A. J., Cameron, A. J., Curtis-Lake, E., et al. 2023, arXiv e-prints, arXiv:2306.02467
- Cameron et al. (2021) Cameron, A. J., Fisher, D. B., McPherson, D., et al. 2021, ApJ, 918, L16
- Carniani et al. (2015) Carniani, S., Marconi, A., Maiolino, R., et al. 2015, A&A, 580, A102
- Ceverino et al. (2018) Ceverino, D., Klessen, R. S., & Glover, S. C. O. 2018, MNRAS, 480, 4842
- Chabrier (2003) Chabrier, G. 2003, PASP, 115, 763
- Chevallard & Charlot (2016) Chevallard, J. & Charlot, S. 2016, MNRAS, 462, 1415
- Cicone et al. (2016) Cicone, C., Maiolino, R., & Marconi, A. 2016, A&A, 588, A41
- Cicone et al. (2014) Cicone, C., Maiolino, R., Sturm, E., et al. 2014, A&A, 562, A21
- Concas et al. (2022) Concas, A., Maiolino, R., Curti, M., et al. 2022, MNRAS, 513, 2535
- Concas et al. (2017) Concas, A., Popesso, P., Brusa, M., et al. 2017, A&A, 606, A36
- Concas et al. (2019) Concas, A., Popesso, P., Brusa, M., Mainieri, V., & Thomas, D. 2019, A&A, 622, A188
- Curti et al. (2023) Curti, M., Maiolino, R., Carniani, S., et al. 2023, arXiv e-prints, arXiv:2304.08516
- Curtis-Lake et al. (2023) Curtis-Lake, E., Carniani, S., Cameron, A., et al. 2023, Nature Astronomy, 7, 622
- Dashyan et al. (2018) Dashyan, G., Silk, J., Mamon, G. A., Dubois, Y., & Hartwig, T. 2018, MNRAS, 473, 5698
- Davé et al. (2011) Davé, R., Finlator, K., & Oppenheimer, B. D. 2011, MNRAS, 416, 1354
- Davies et al. (2020) Davies, R., Baron, D., Shimizu, T., et al. 2020, MNRAS, 498, 4150
- Davies et al. (2019) Davies, R. L., Förster Schreiber, N. M., Übler, H., et al. 2019, ApJ, 873, 122
- Davis et al. (2013) Davis, T. A., Alatalo, K., Bureau, M., et al. 2013, MNRAS, 429, 534
- Debuhr et al. (2012) Debuhr, J., Quataert, E., & Ma, C.-P. 2012, MNRAS, 420, 2221
- Dessauges-Zavadsky et al. (2020) Dessauges-Zavadsky, M., Ginolfi, M., Pozzi, F., et al. 2020, A&A, 643, A5
- Dutton (2012) Dutton, A. A. 2012, MNRAS, 424, 3123
- Dutton & Macciò (2014) Dutton, A. A. & Macciò, A. V. 2014, MNRAS, 441, 3359
- Eisenstein et al. (2023) Eisenstein, D. J., Willott, C., Alberts, S., et al. 2023, arXiv e-prints, arXiv:2306.02465
- Ferruit et al. (2022) Ferruit, P., Jakobsen, P., Giardino, G., et al. 2022, A&A, 661, A81
- Finkelstein et al. (2023) Finkelstein, S. L., Bagley, M. B., Ferguson, H. C., et al. 2023, ApJ, 946, L13
- Finlator & Davé (2008) Finlator, K. & Davé, R. 2008, MNRAS, 385, 2181
- Fiore et al. (2023) Fiore, F., Ferrara, A., Bischetti, M., Feruglio, C., & Travascio, A. 2023, ApJ, 943, L27
- Fiore et al. (2017) Fiore, F., Feruglio, C., Shankar, F., et al. 2017, A&A, 601, A143
- Fluetsch et al. (2021) Fluetsch, A., Maiolino, R., Carniani, S., et al. 2021, MNRAS, 505, 5753
- Fluetsch et al. (2019) Fluetsch, A., Maiolino, R., Carniani, S., et al. 2019, MNRAS, 483, 4586
- Förster Schreiber et al. (2014a) Förster Schreiber, N. M., Genzel, R., Newman, S. F., et al. 2014a, ApJ, 787, 38
- Förster Schreiber et al. (2014b) Förster Schreiber, N. M., Genzel, R., Newman, S. F., et al. 2014b, ApJ, 787, 38
- Förster Schreiber et al. (2019) Förster Schreiber, N. M., Übler, H., Davies, R. L., et al. 2019, ApJ, 875, 21
- Gardner et al. (2023) Gardner, J. P., Mather, J. C., Abbott, R., et al. 2023, arXiv e-prints, arXiv:2304.04869
- Gardner et al. (2006) Gardner, J. P., Mather, J. C., Clampin, M., et al. 2006, Space Sci. Rev., 123, 485
- Genzel et al. (2014) Genzel, R., Förster Schreiber, N. M., Rosario, D., et al. 2014, ApJ, 796, 7
- González-Alfonso et al. (2017) González-Alfonso, E., Fischer, J., Spoon, H. W. W., et al. 2017, ApJ, 836, 11
- Harrison et al. (2016) Harrison, C. M., Alexander, D. M., Mullaney, J. R., et al. 2016, MNRAS, 456, 1195
- Heckman et al. (2015) Heckman, T. M., Alexandroff, R. M., Borthakur, S., Overzier, R., & Leitherer, C. 2015, ApJ, 809, 147
- Heckman et al. (1990) Heckman, T. M., Armus, L., & Miley, G. K. 1990, ApJS, 74, 833
- Henriques et al. (2019) Henriques, B. M. B., White, S. D. M., Lilly, S. J., et al. 2019, MNRAS, 485, 3446
- Hernquist (1990) Hernquist, L. 1990, ApJ, 356, 359
- Herrera-Camus et al. (2019) Herrera-Camus, R., Tacconi, L., Genzel, R., et al. 2019, ApJ, 871, 37
- Hopkins et al. (2016) Hopkins, P. F., Torrey, P., Faucher-Giguère, C.-A., Quataert, E., & Murray, N. 2016, MNRAS, 458, 816
- Hopkins et al. (2018) Hopkins, P. F., Wetzel, A., Kereš, D., et al. 2018, MNRAS, 480, 800
- Jakobsen et al. (2022) Jakobsen, P., Ferruit, P., Alves de Oliveira, C., et al. 2022, A&A, 661, A80
- Jeffreys (1961) Jeffreys, H. 1961, The Theory of Probability, 3rd edn. (Oxford University Press)
- Juneau et al. (2022) Juneau, S., Goulding, A. D., Banfield, J., et al. 2022, ApJ, 925, 203
- Kakkad et al. (2020) Kakkad, D., Mainieri, V., Vietri, G., et al. 2020, A&A, 642, A147
- Kakkad et al. (2023) Kakkad, D., Mainieri, V., Vietri, G., et al. 2023, MNRAS, 520, 5783
- Koudmani et al. (2019) Koudmani, S., Sijacki, D., Bourne, M. A., & Smith, M. C. 2019, MNRAS, 484, 2047
- Lamperti et al. (2022) Lamperti, I., Pereira-Santaella, M., Perna, M., et al. 2022, A&A, 668, A45
- Lelli et al. (2021) Lelli, F., Di Teodoro, E. M., Fraternali, F., et al. 2021, Science, 371, 713
- Lelli et al. (2023) Lelli, F., Zhang, Z.-Y., Bisbas, T. G., et al. 2023, A&A, 672, A106
- Leung et al. (2019) Leung, G. C. K., Coil, A. L., Aird, J., et al. 2019, ApJ, 886, 11
- Li et al. (2017) Li, M., Bryan, G. L., & Ostriker, J. P. 2017, ApJ, 841, 101
- Looser et al. (2023) Looser, T. J., D’Eugenio, F., Maiolino, R., et al. 2023, arXiv e-prints, arXiv:2302.14155
- López-Cobá et al. (2020) López-Cobá, C., Sánchez, S. F., Anderson, J. P., et al. 2020, AJ, 159, 167
- Maiolino et al. (2012) Maiolino, R., Gallerani, S., Neri, R., et al. 2012, MNRAS, 425, L66
- Marasco et al. (2023) Marasco, A., Belfiore, F., Cresci, G., et al. 2023, A&A, 670, A92
- Mezcua et al. (2023) Mezcua, M., Siudek, M., Suh, H., et al. 2023, ApJ, 943, L5
- Mitchell et al. (2020) Mitchell, P. D., Schaye, J., Bower, R. G., & Crain, R. A. 2020, MNRAS, 494, 3971
- Moster et al. (2013) Moster, B. P., Naab, T., & White, S. D. M. 2013, MNRAS, 428, 3121
- Muratov et al. (2015) Muratov, A. L., Kereš, D., Faucher-Giguère, C.-A., et al. 2015, MNRAS, 454, 2691
- Murray et al. (2005) Murray, N., Quataert, E., & Thompson, T. A. 2005, ApJ, 618, 569
- Navarro et al. (1996) Navarro, J. F., Frenk, C. S., & White, S. D. M. 1996, ApJ, 462, 563
- Nelson et al. (2019) Nelson, D., Pillepich, A., Springel, V., et al. 2019, MNRAS, 490, 3234
- Newman et al. (2012) Newman, S. F., Genzel, R., Förster-Schreiber, N. M., et al. 2012, ApJ, 761, 43
- Pandya et al. (2021) Pandya, V., Fielding, D. B., Anglés-Alcázar, D., et al. 2021, MNRAS, 508, 2979
- Parlanti et al. (2023) Parlanti, E., Carniani, S., Pallottini, A., et al. 2023, A&A, 673, A153
- Pavesi et al. (2019) Pavesi, R., Riechers, D. A., Faisst, A. L., Stacey, G. J., & Capak, P. L. 2019, ApJ, 882, 168
- Penny et al. (2018) Penny, S. J., Masters, K. L., Smethurst, R., et al. 2018, MNRAS, 476, 979
- Perna et al. (2017) Perna, M., Lanzuisi, G., Brusa, M., Mignoli, M., & Cresci, G. 2017, A&A, 603, A99
- Pillepich et al. (2018) Pillepich, A., Springel, V., Nelson, D., et al. 2018, MNRAS, 473, 4077
- Planck Collaboration et al. (2015) Planck Collaboration, Ade, P. A. R., Aghanim, N., et al. 2015, A&A, 580, A22
- Pontoppidan et al. (2022) Pontoppidan, K. M., Barrientes, J., Blome, C., et al. 2022, ApJ, 936, L14
- Posti et al. (2019) Posti, L., Marasco, A., Fraternali, F., & Famaey, B. 2019, A&A, 629, A59
- Rakshit & Woo (2018) Rakshit, S. & Woo, J.-H. 2018, ApJ, 865, 5
- Reichardt Chu et al. (2022) Reichardt Chu, B., Fisher, D. B., Nielsen, N. M., et al. 2022, MNRAS, 511, 5782
- Reines et al. (2020) Reines, A. E., Condon, J. J., Darling, J., & Greene, J. E. 2020, ApJ, 888, 36
- Rieke & the JADES Collaboration (2023) Rieke, M. & the JADES Collaboration. 2023, arXiv e-prints, arXiv:2306.02466
- Rizzo et al. (2023) Rizzo, F., Roman-Oliveira, F., Fraternali, F., et al. 2023, arXiv e-prints, arXiv:2303.16227
- Rupke et al. (2005) Rupke, D. S., Veilleux, S., & Sanders, D. B. 2005, ApJS, 160, 115
- Sartori et al. (2015) Sartori, L. F., Schawinski, K., Treister, E., et al. 2015, MNRAS, 454, 3722
- Silk (2017) Silk, J. 2017, ApJ, 839, L13
- Skilling (2004) Skilling, J. 2004, in American Institute of Physics Conference Series, Vol. 735, Bayesian Inference and Maximum Entropy Methods in Science and Engineering: 24th International Workshop on Bayesian Inference and Maximum Entropy Methods in Science and Engineering, ed. R. Fischer, R. Preuss, & U. V. Toussaint, 395–405
- Speagle (2020) Speagle, J. S. 2020, MNRAS, 493, 3132
- Sugahara et al. (2019) Sugahara, Y., Ouchi, M., Harikane, Y., et al. 2019, ApJ, 886, 29
- Swinbank et al. (2019) Swinbank, A. M., Harrison, C. M., Tiley, A. L., et al. 2019, MNRAS, 487, 381
- Tang et al. (2023) Tang, M., Stark, D. P., Chen, Z., et al. 2023, arXiv e-prints, arXiv:2301.07072
- Treu et al. (2022) Treu, T., Roberts-Borsani, G., Bradac, M., et al. 2022, ApJ, 935, 110
- Übler et al. (2023) Übler, H., Maiolino, R., Curtis-Lake, E., et al. 2023, arXiv e-prints, arXiv:2302.06647
- Venturi et al. (2018) Venturi, G., Nardini, E., Marconi, A., et al. 2018, A&A, 619, A74
- Vidal-García et al. (2017) Vidal-García, A., Charlot, S., Bruzual, G., & Hubeny, I. 2017, MNRAS, 470, 3532
- Weiner et al. (2009) Weiner, B. J., Coil, A. L., Prochaska, J. X., et al. 2009, ApJ, 692, 187
- White & Rees (1978) White, S. D. M. & Rees, M. J. 1978, MNRAS, 183, 341
- Woo et al. (2016) Woo, J.-H., Bae, H.-J., Son, D., & Karouzos, M. 2016, ApJ, 817, 108
- Zhang et al. (2023) Zhang, Y., Ouchi, M., Nakajima, K., et al. 2023, arXiv e-prints, arXiv:2306.07940
- Ziparo et al. (2023) Ziparo, F., Ferrara, A., Sommovigo, L., & Kohandel, M. 2023, MNRAS, 520, 2445
- Ziparo et al. (2022) Ziparo, F., Gallerani, S., Ferrara, A., & Vito, F. 2022, MNRAS, 517, 1086
Appendix A Spectroscopic analysis and best-fit results
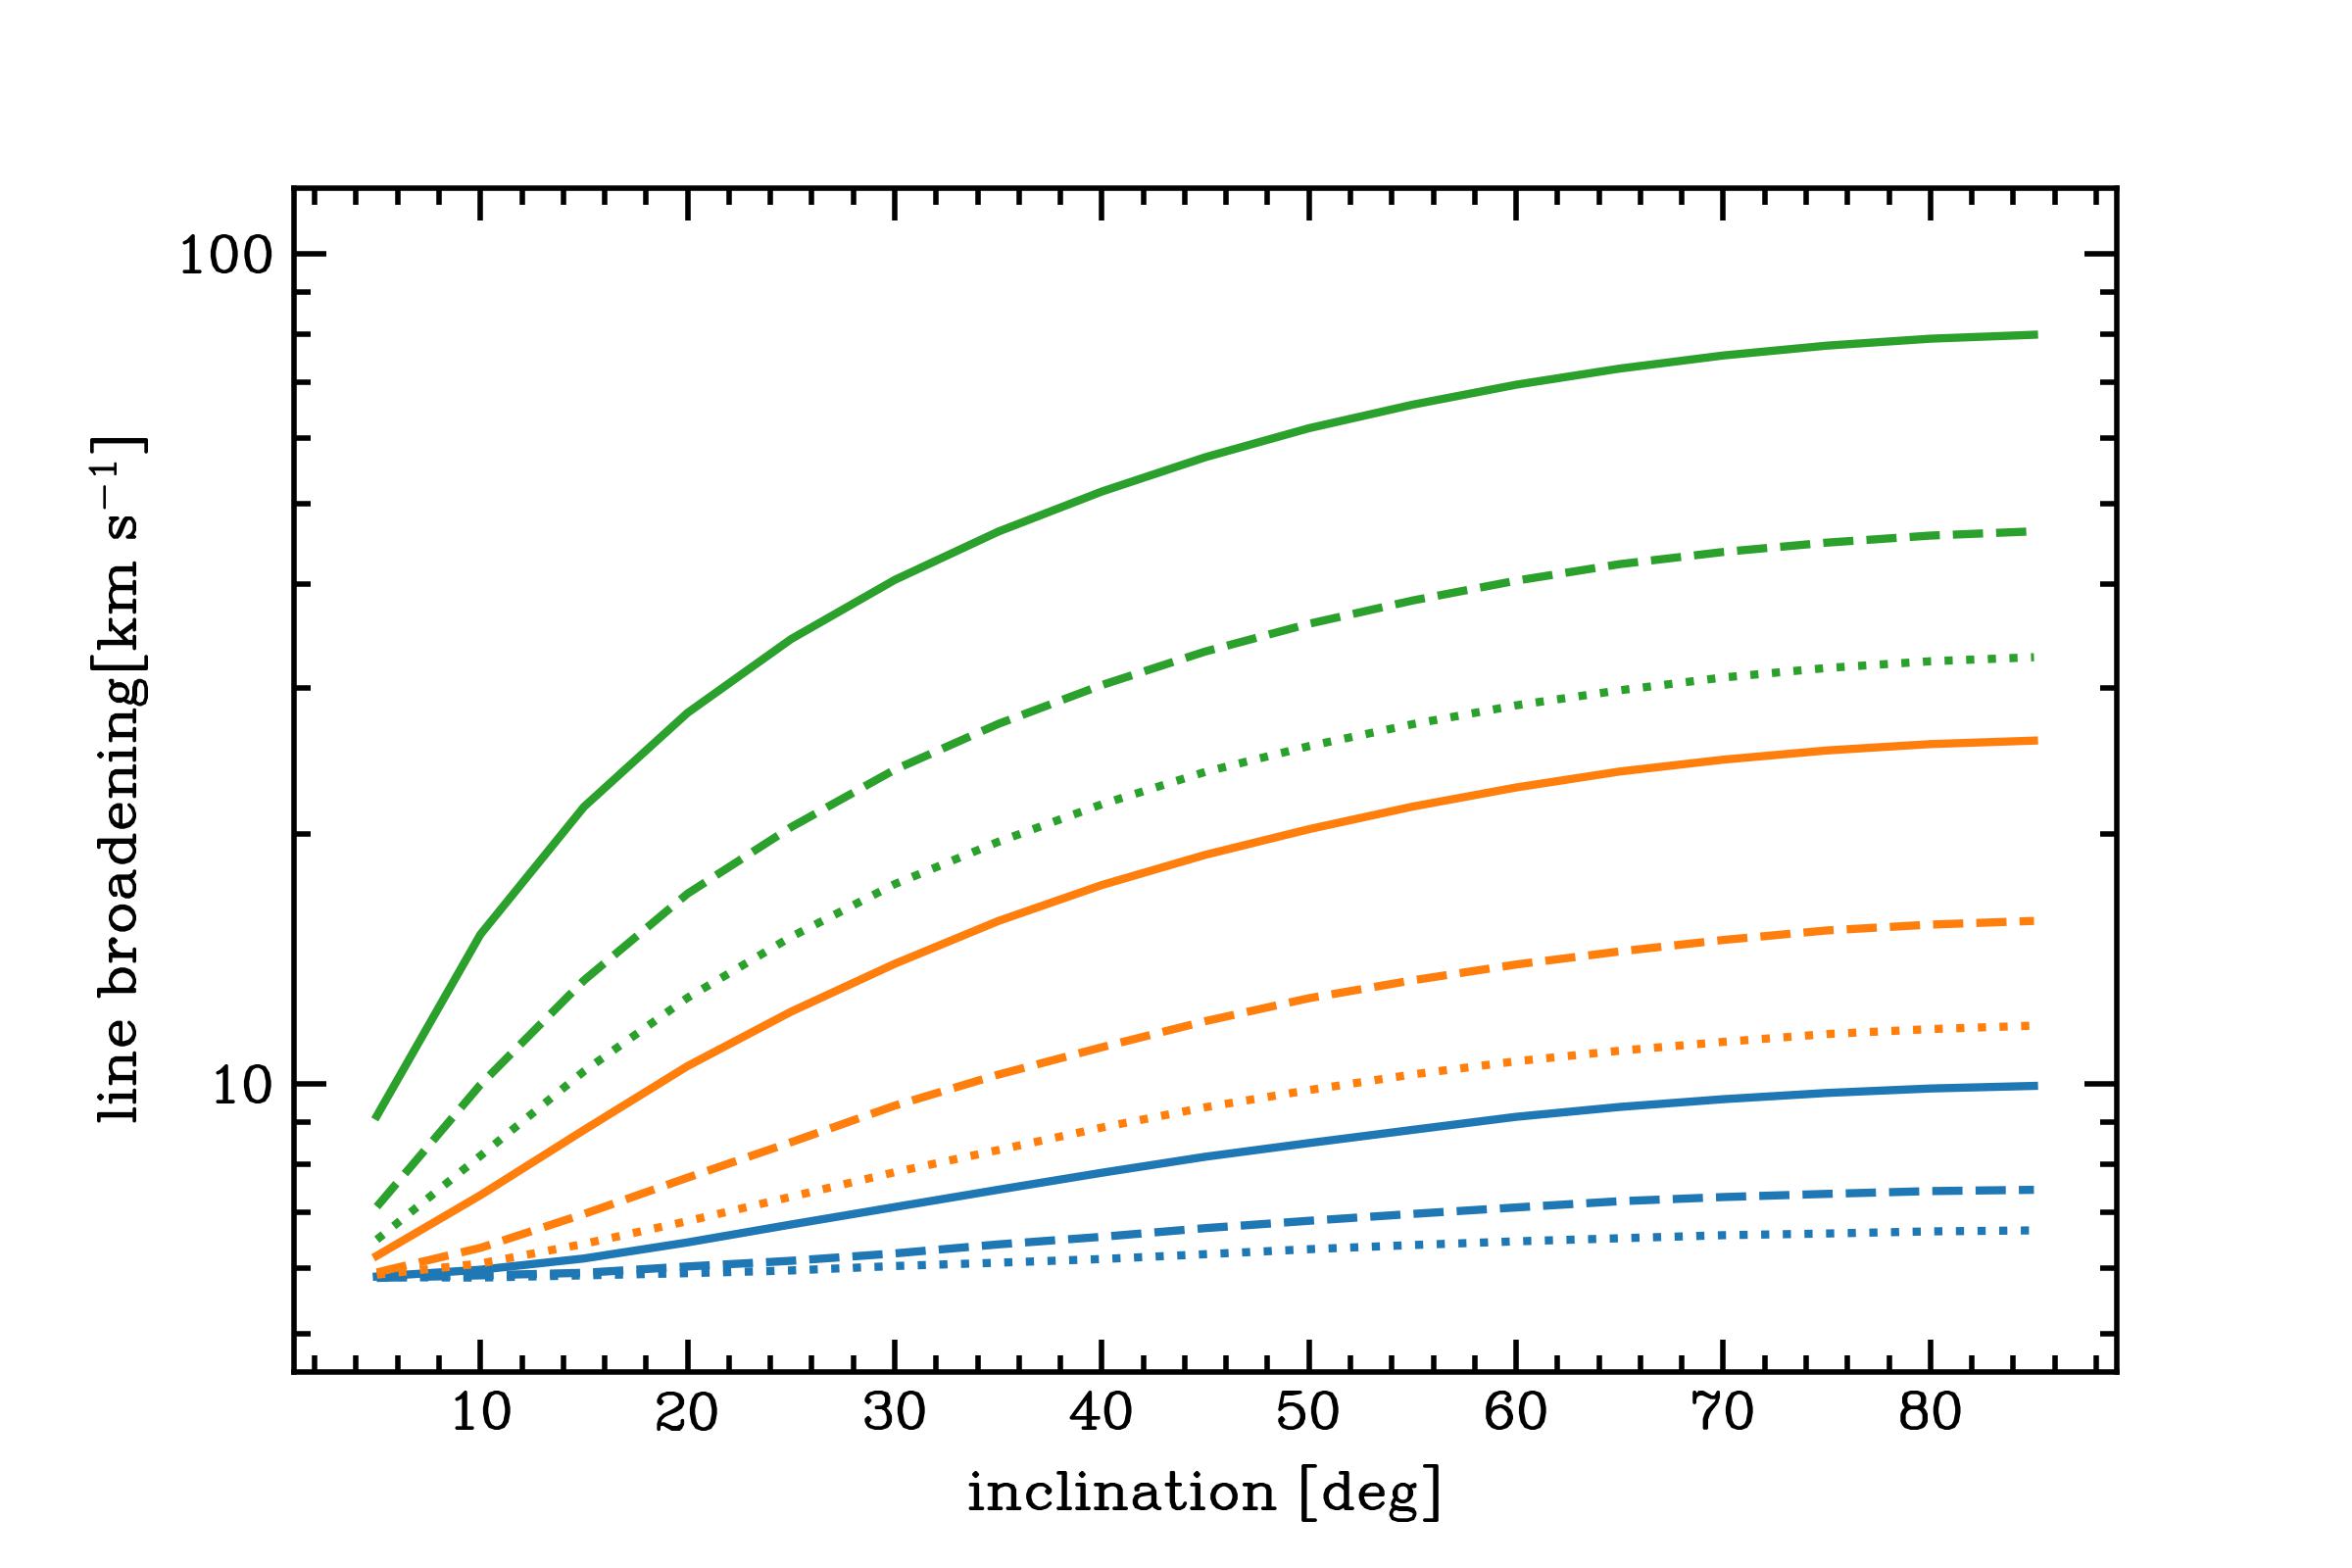
As reported in Sec. 4, line broadening in the spatially integrated 1D spectra can be caused by the rotational motions of a galactic disk. To test this possibility, we determined the maximum line broadening associated with a rotating disk for a typical low-mass galaxy at . We generated mock 1D spectra by using the code KinMS (Davis et al. 2013) for different dynamical masses, galaxy scale radii, and disk inclinations with respect to the line of sight. We assumed that the disk surface mass density distribution is exponential and used equation (6) in Parlanti et al. (2023) to determine the circular velocity as a function of radius Binney & Tremaine (2008). Figure 8 shows the emission line broadening due to circular motions as a function of the galactic disk inclination, dynamical mass, and scale radius. In the mass range of our sample, the line broadening (i.e., velocity dispersion) does not reach values higher than 80 .
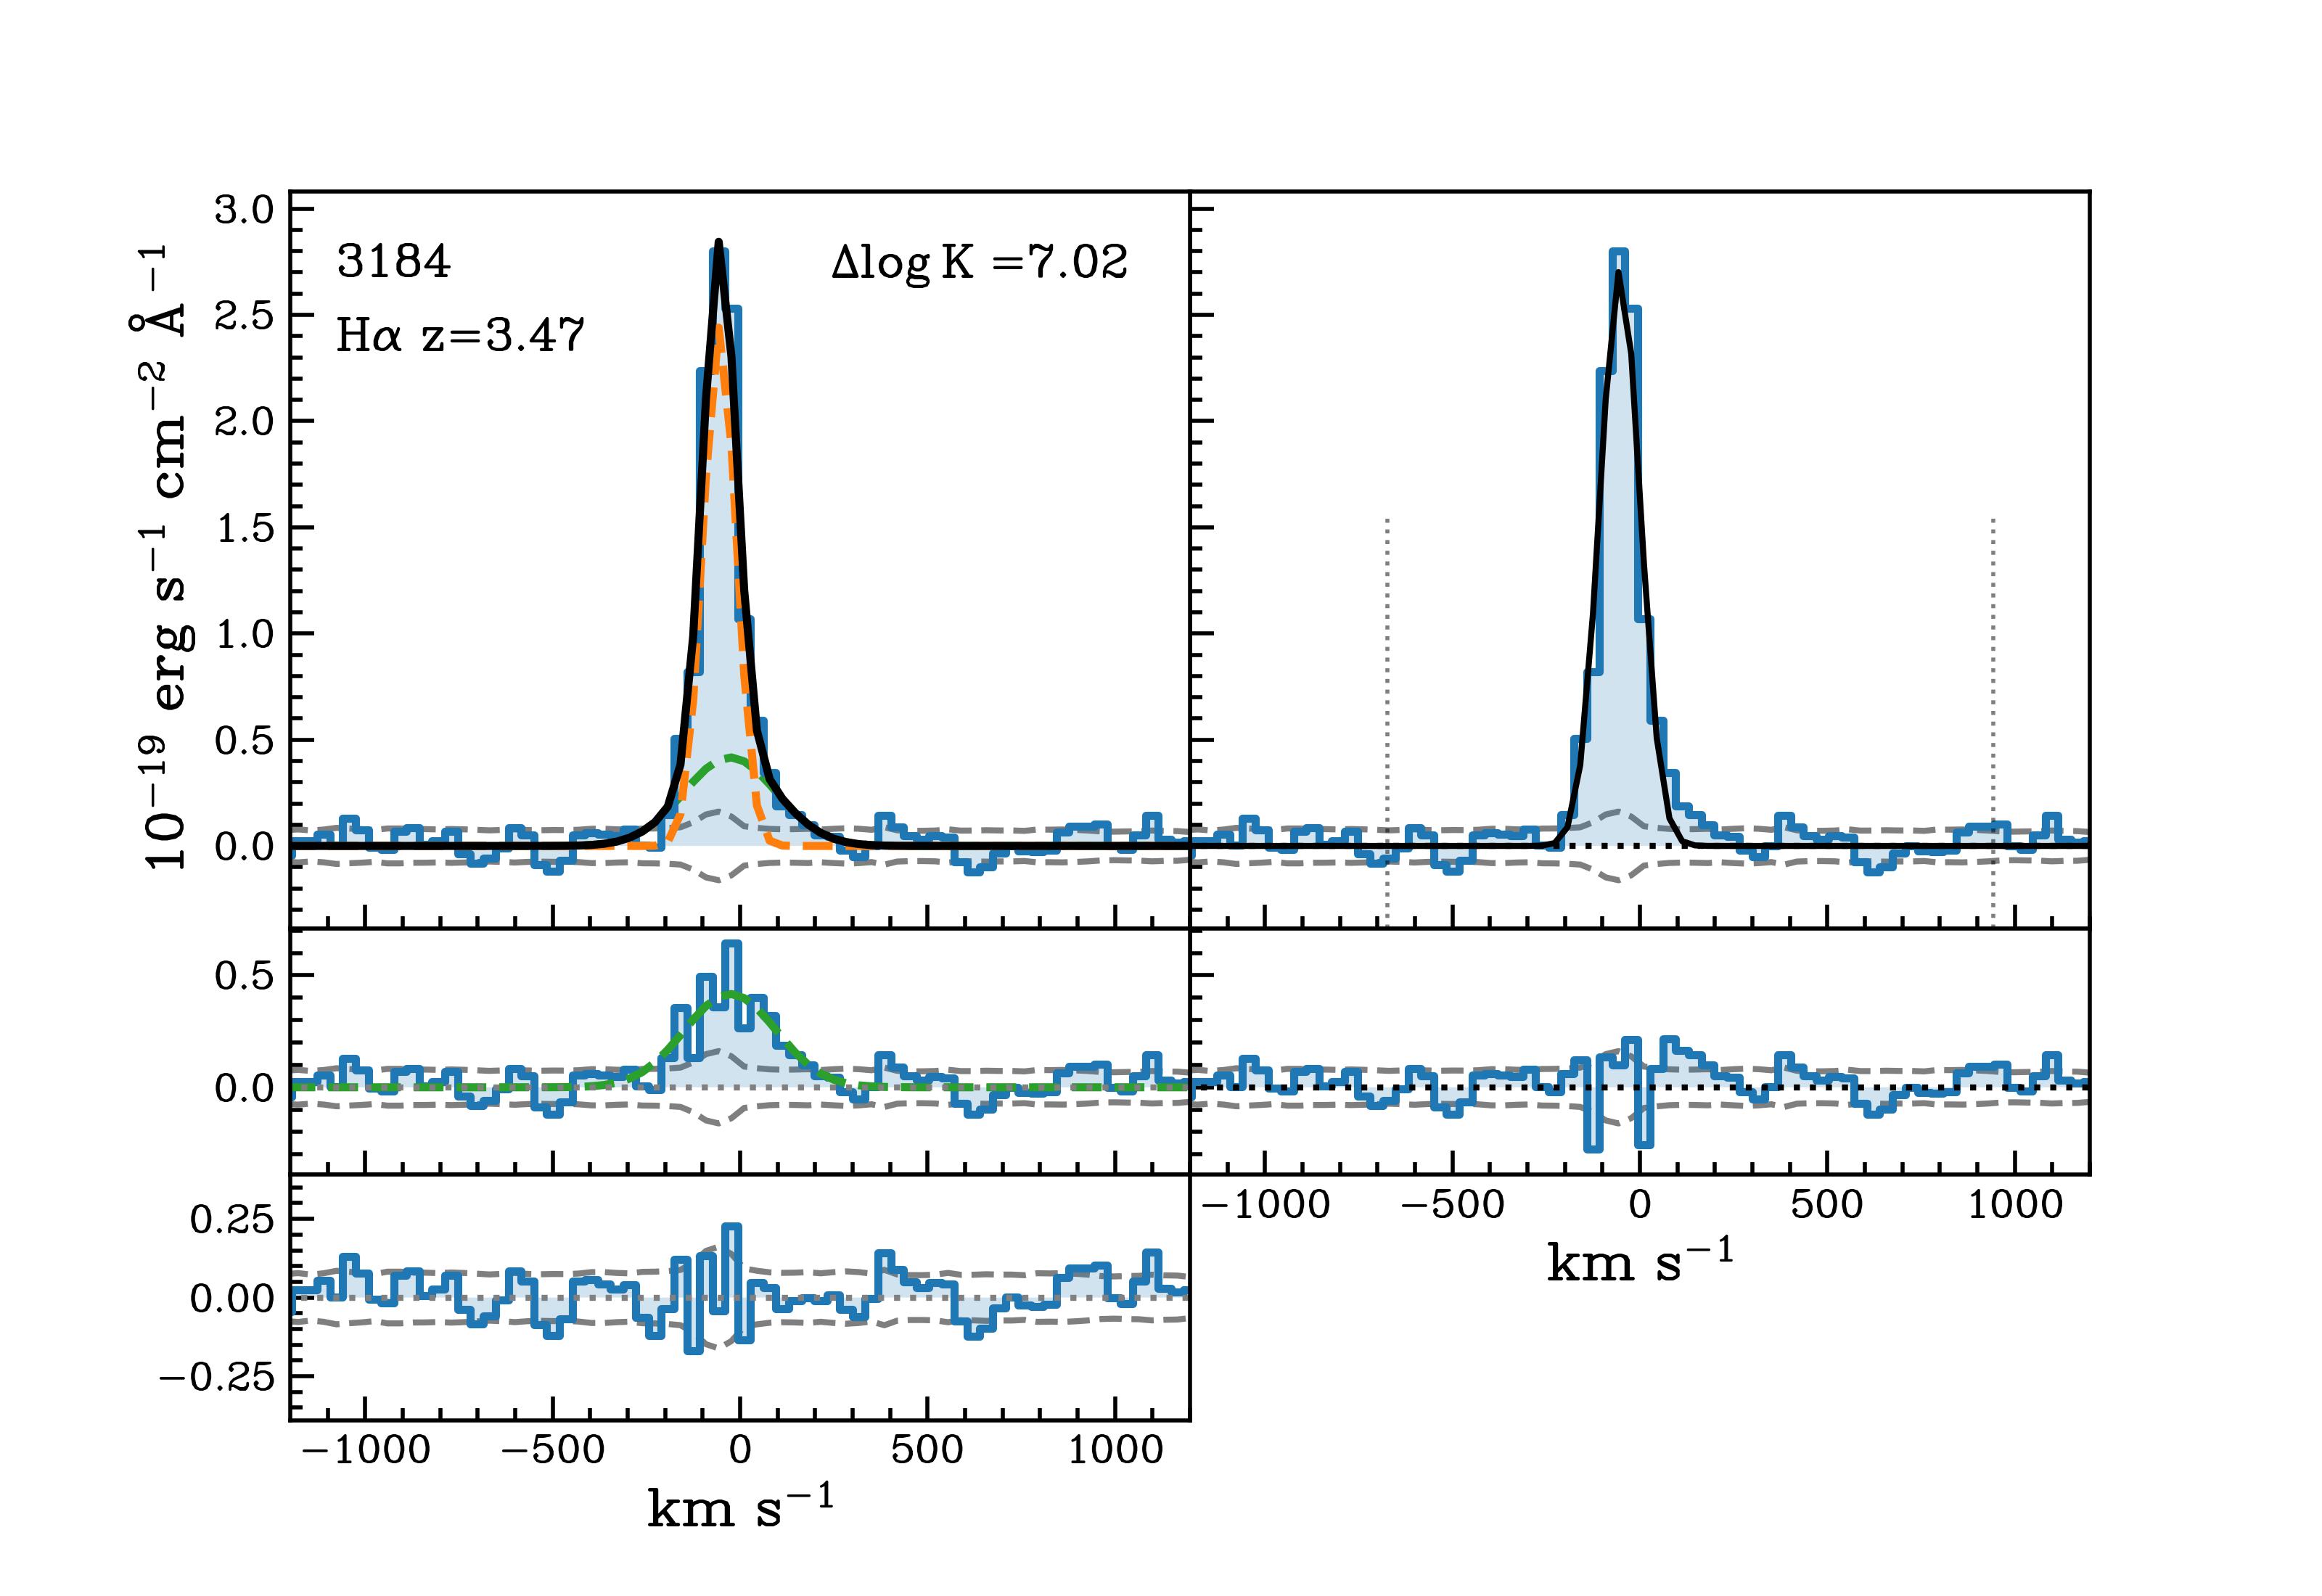
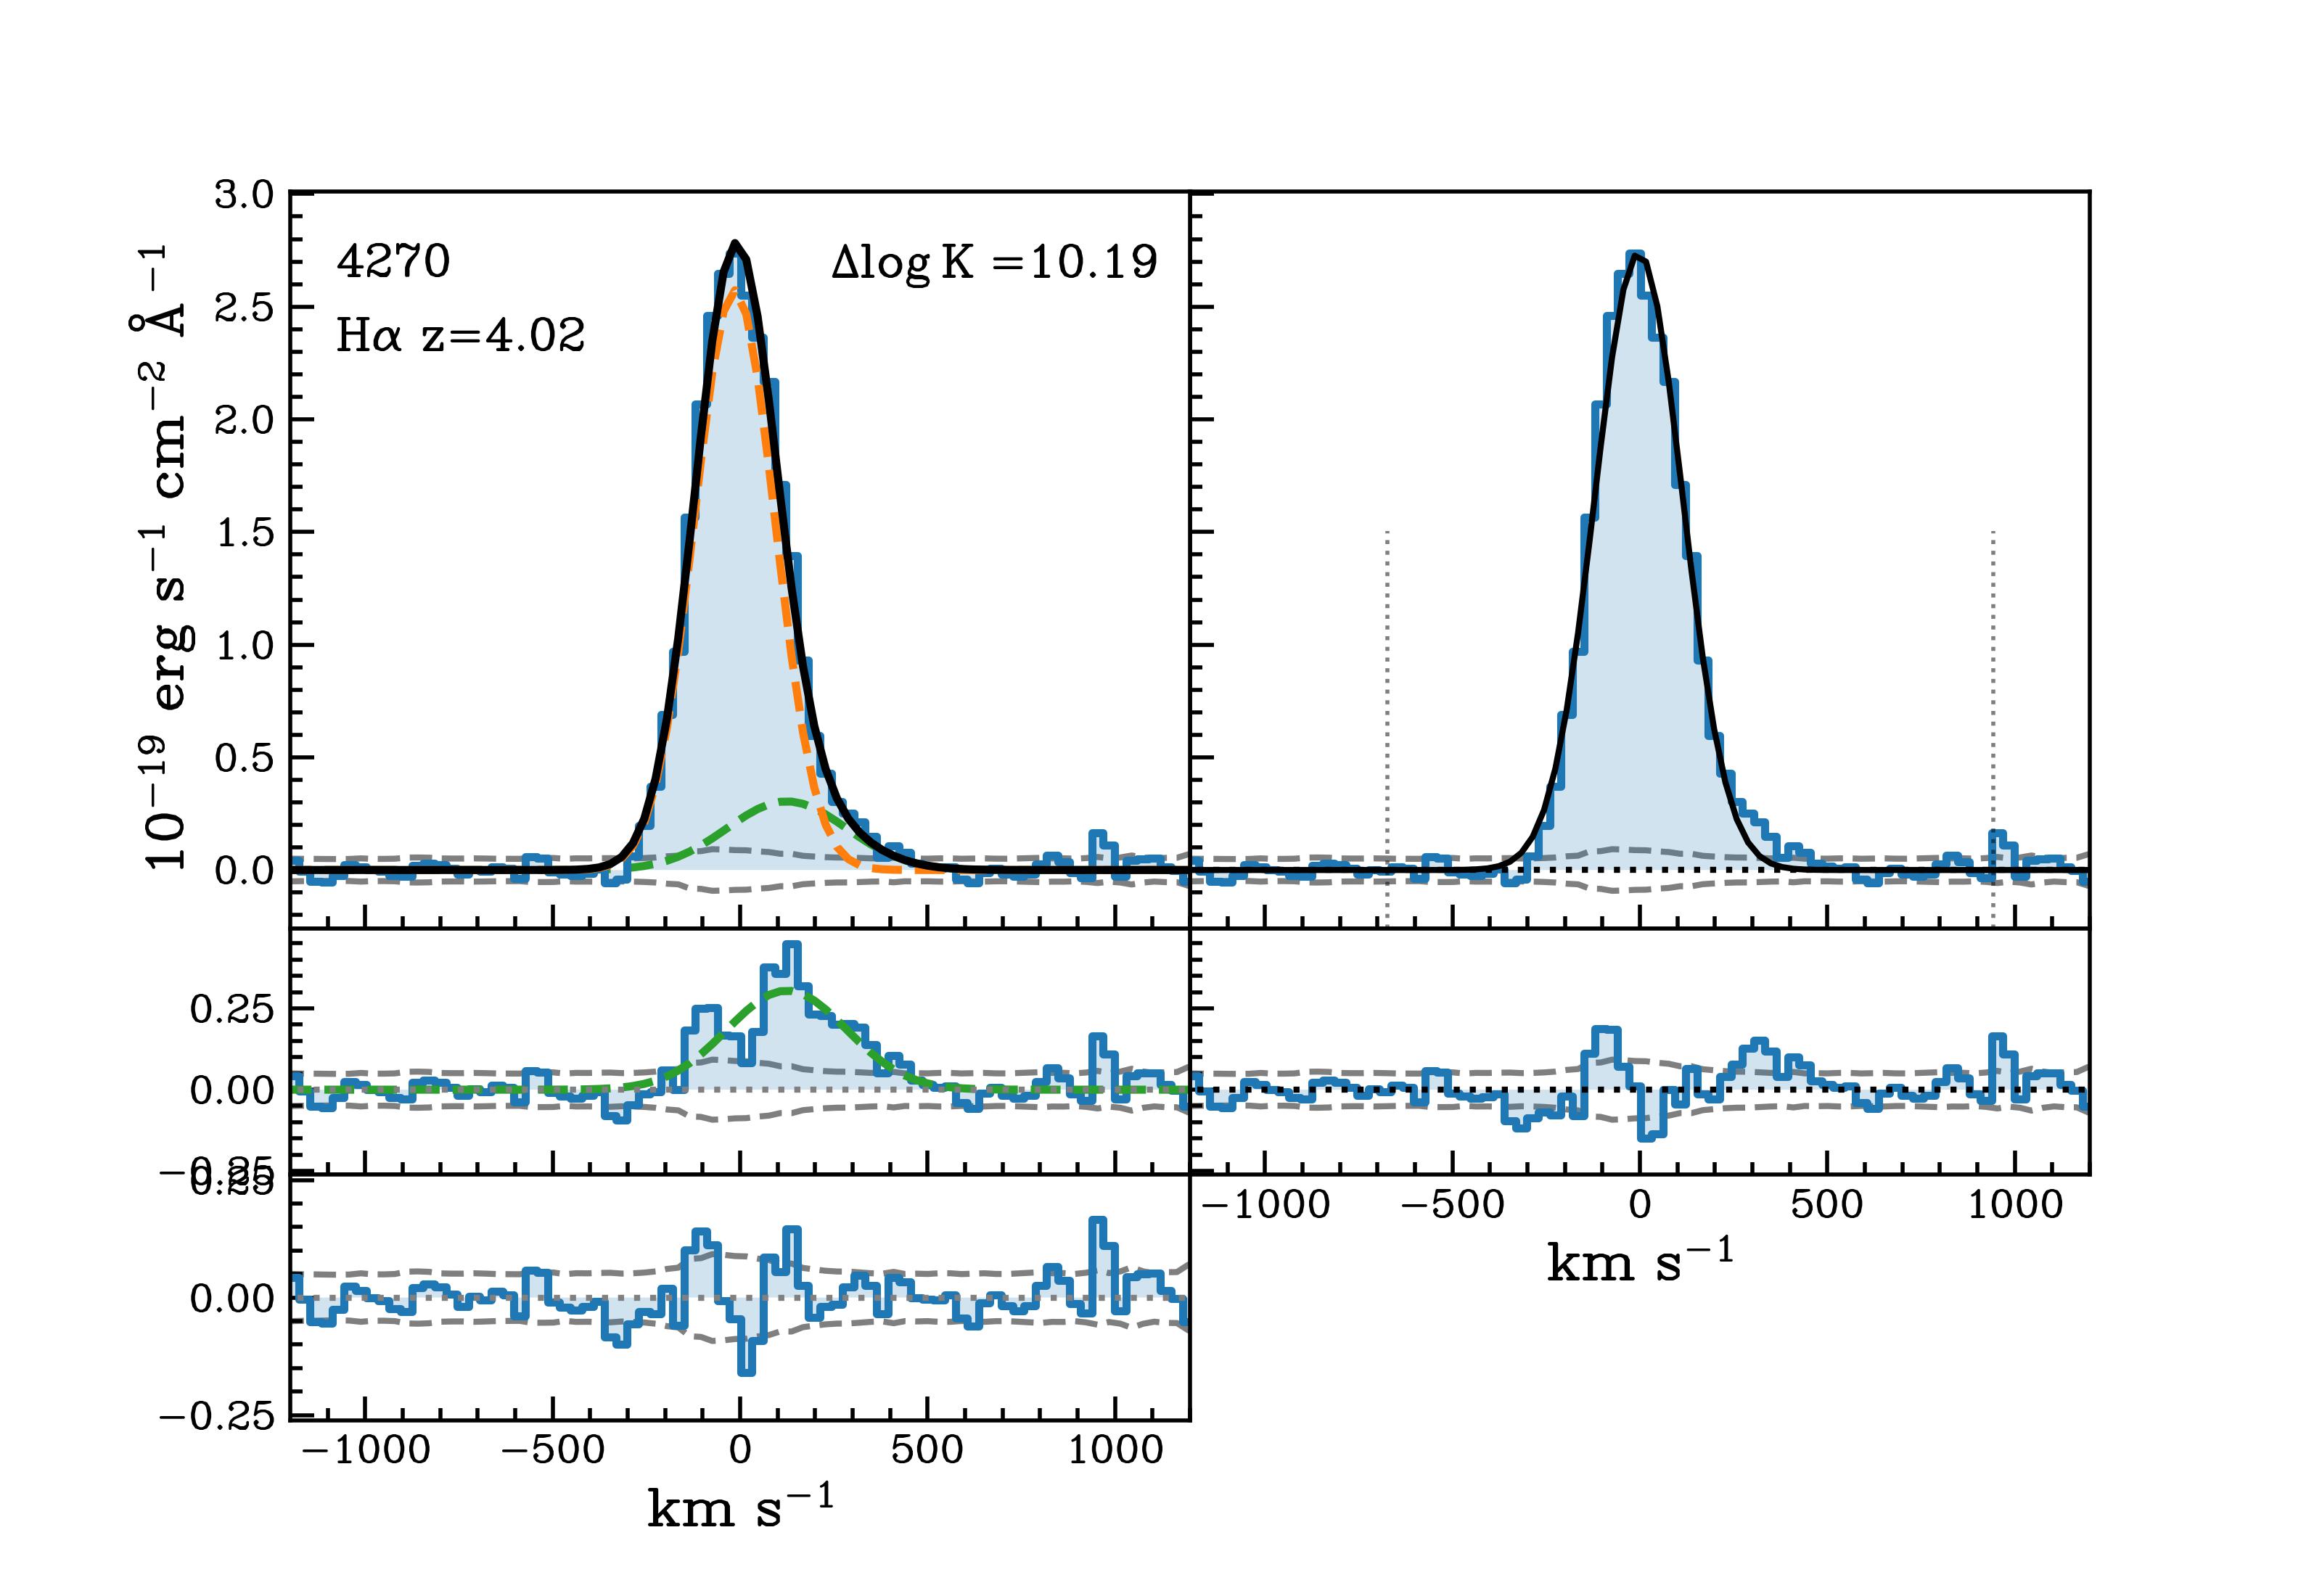
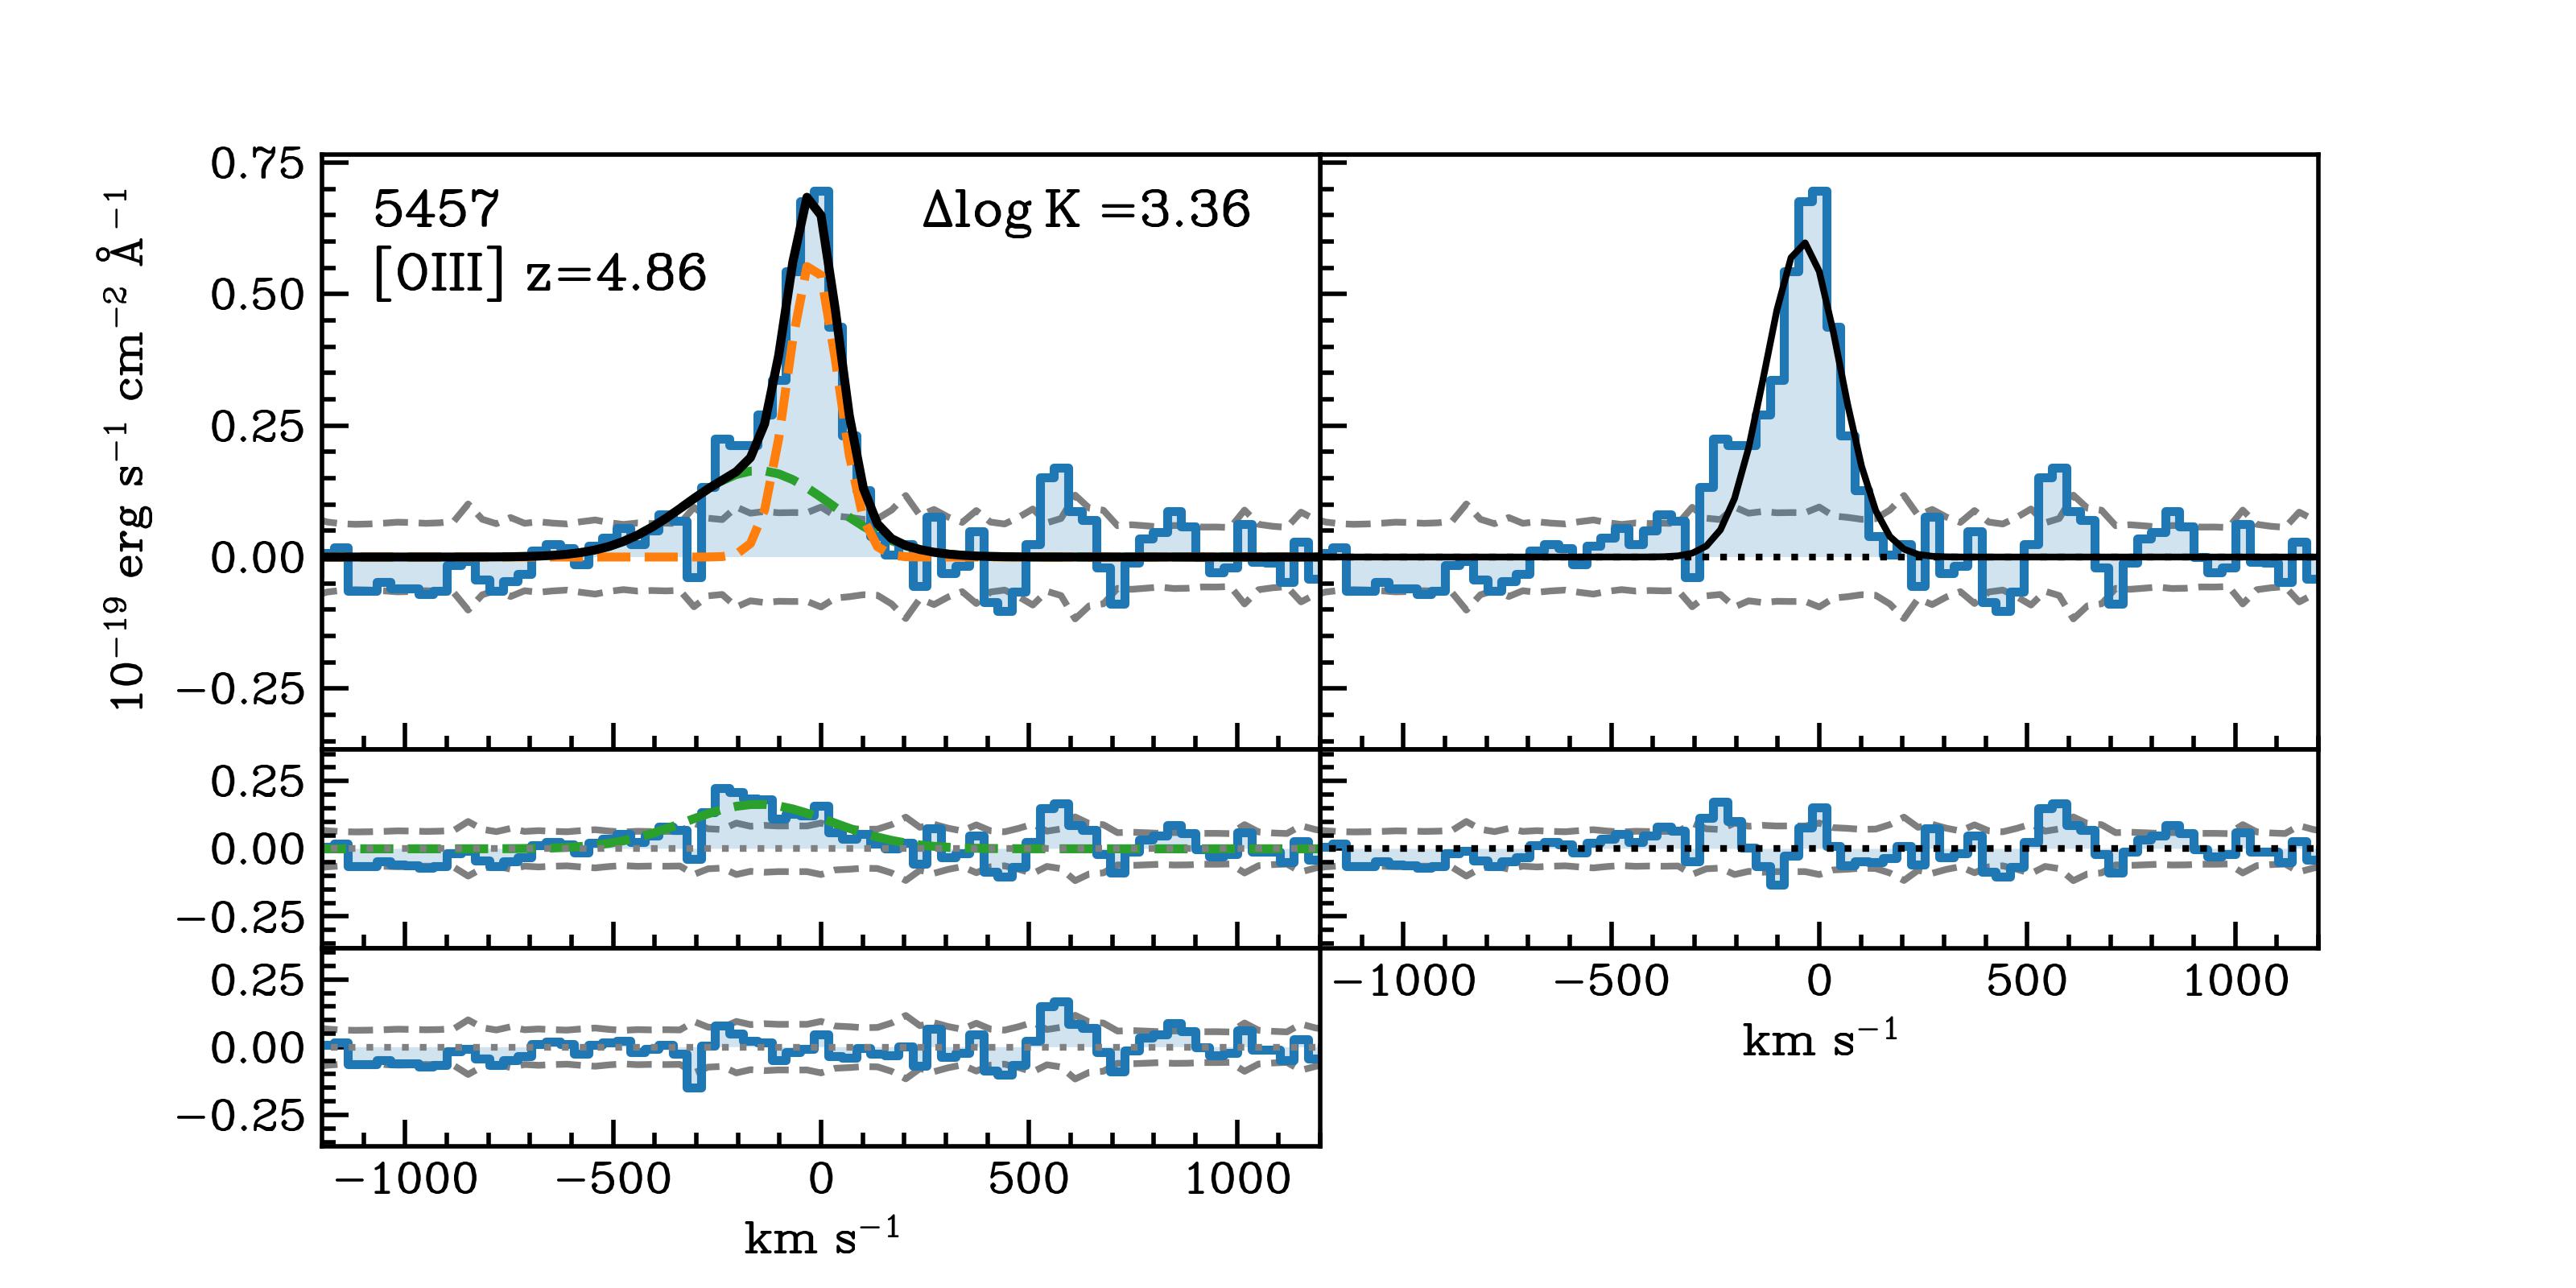
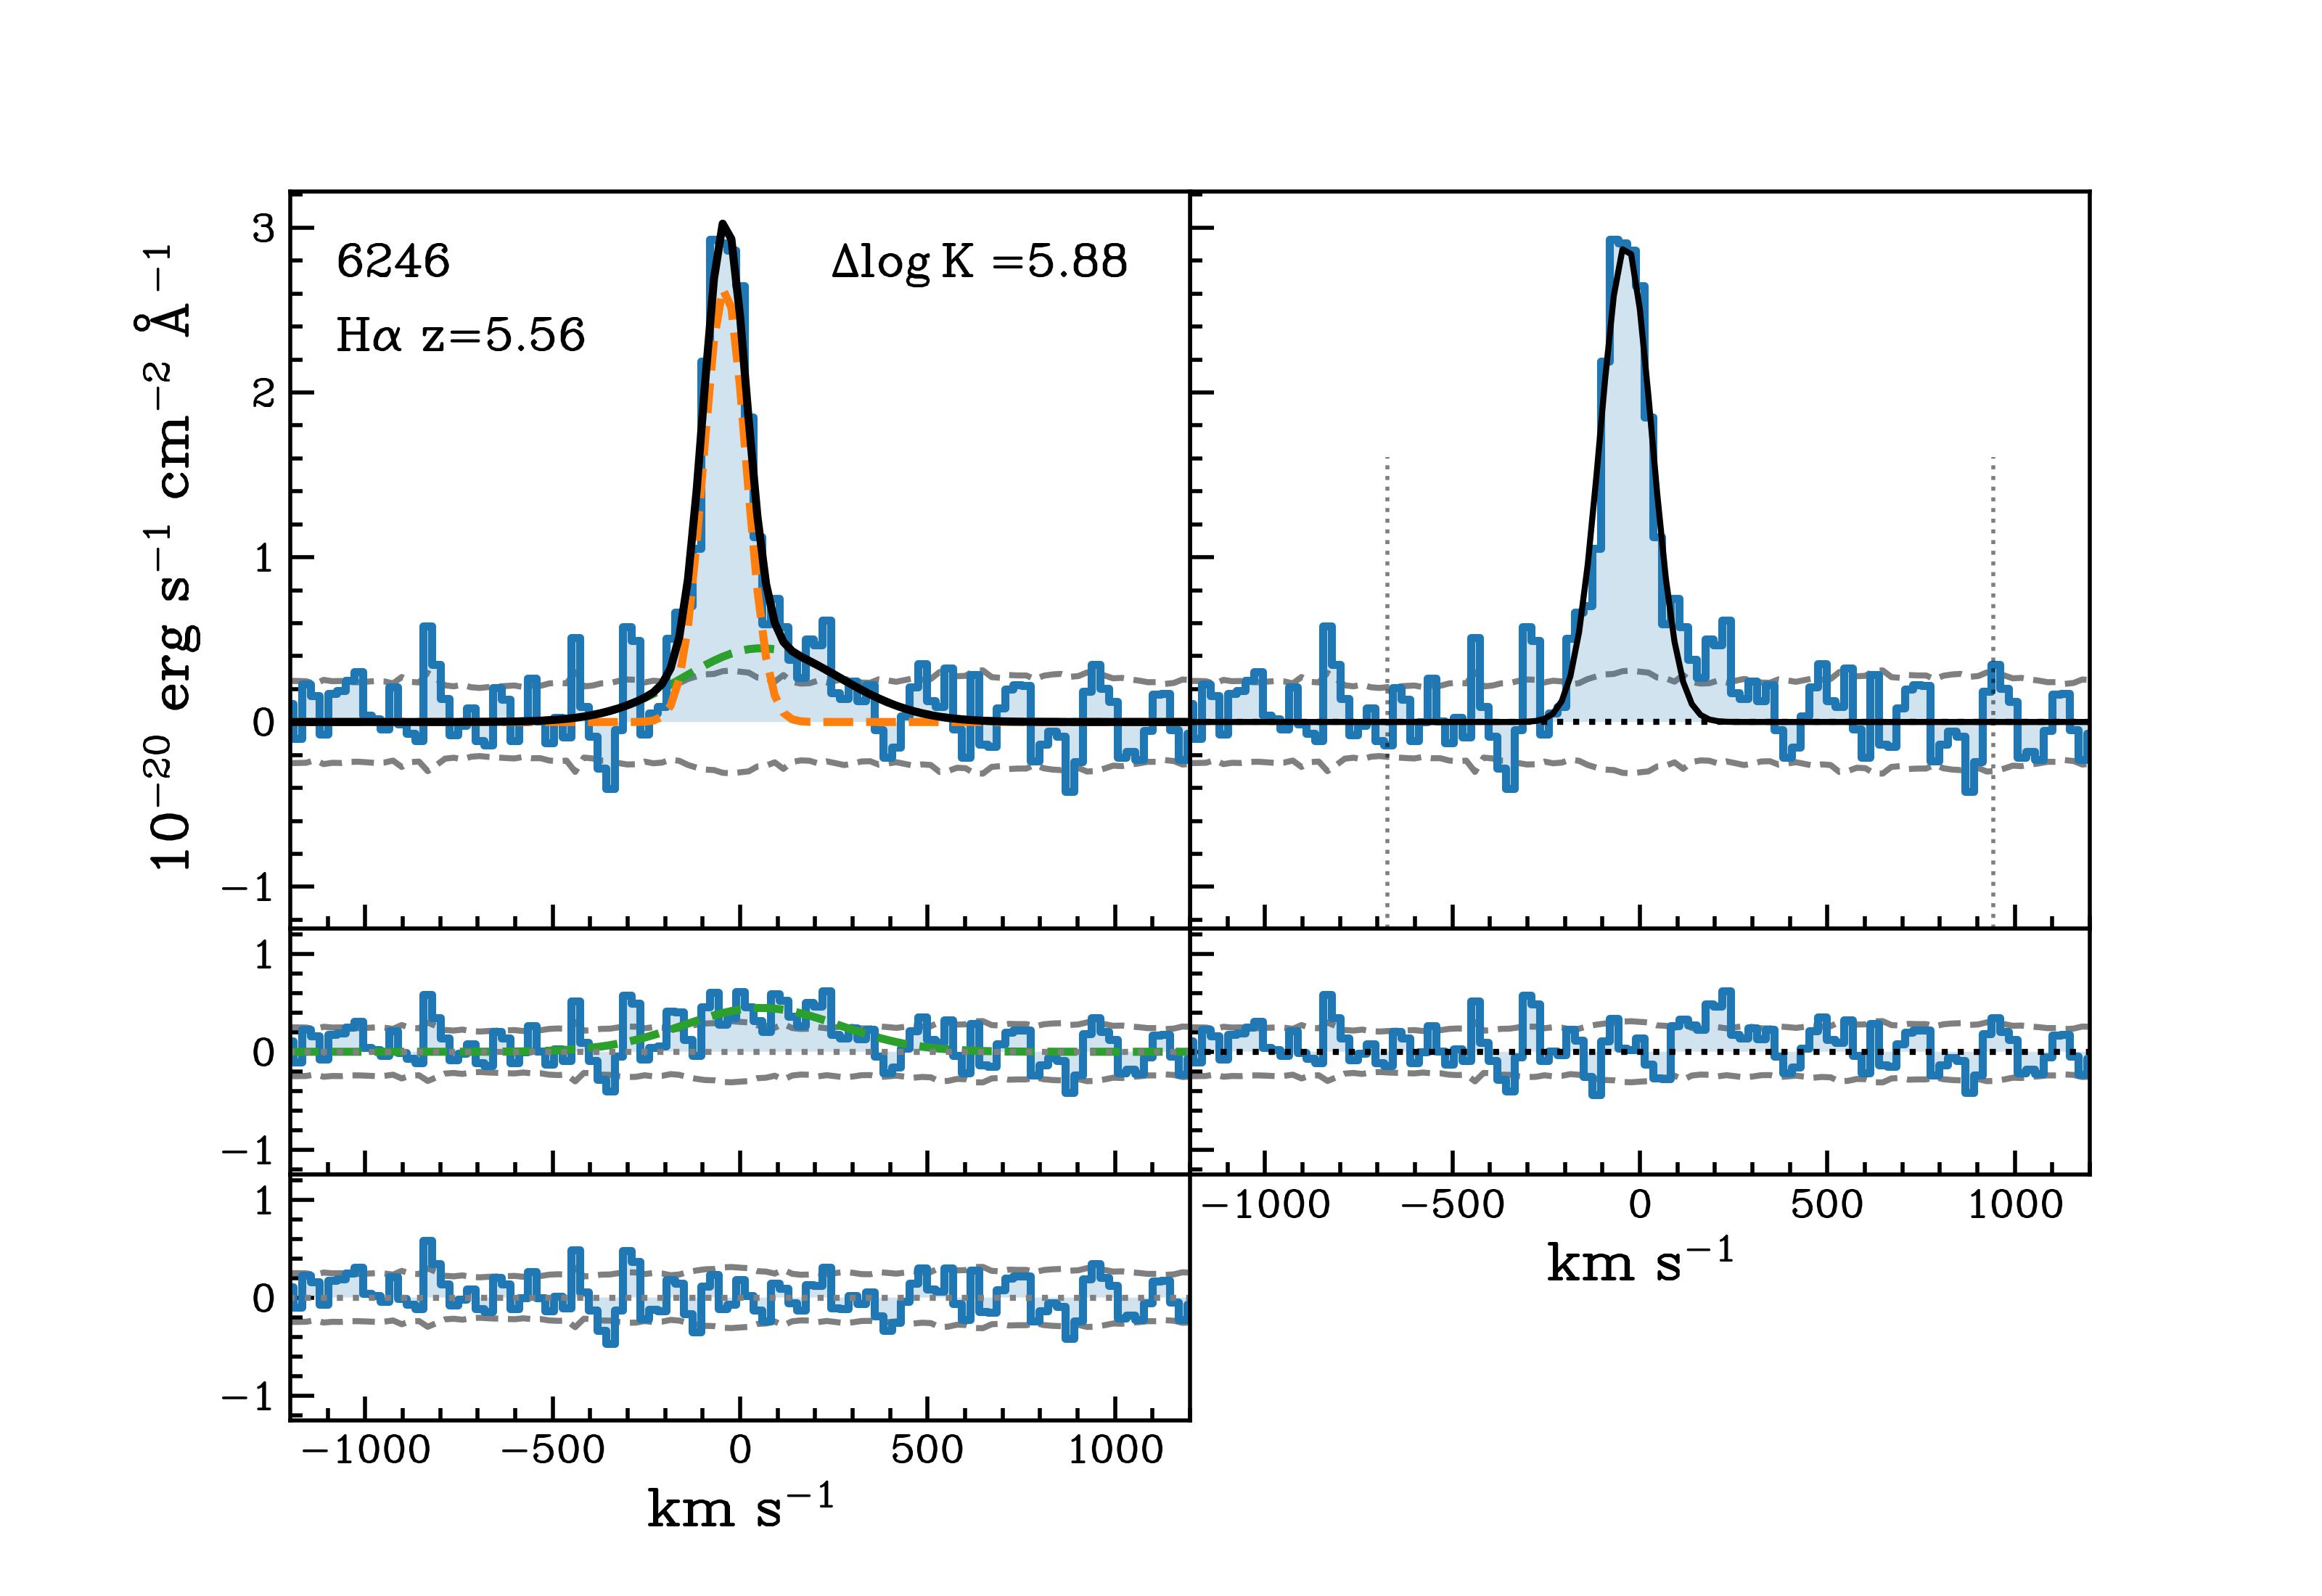
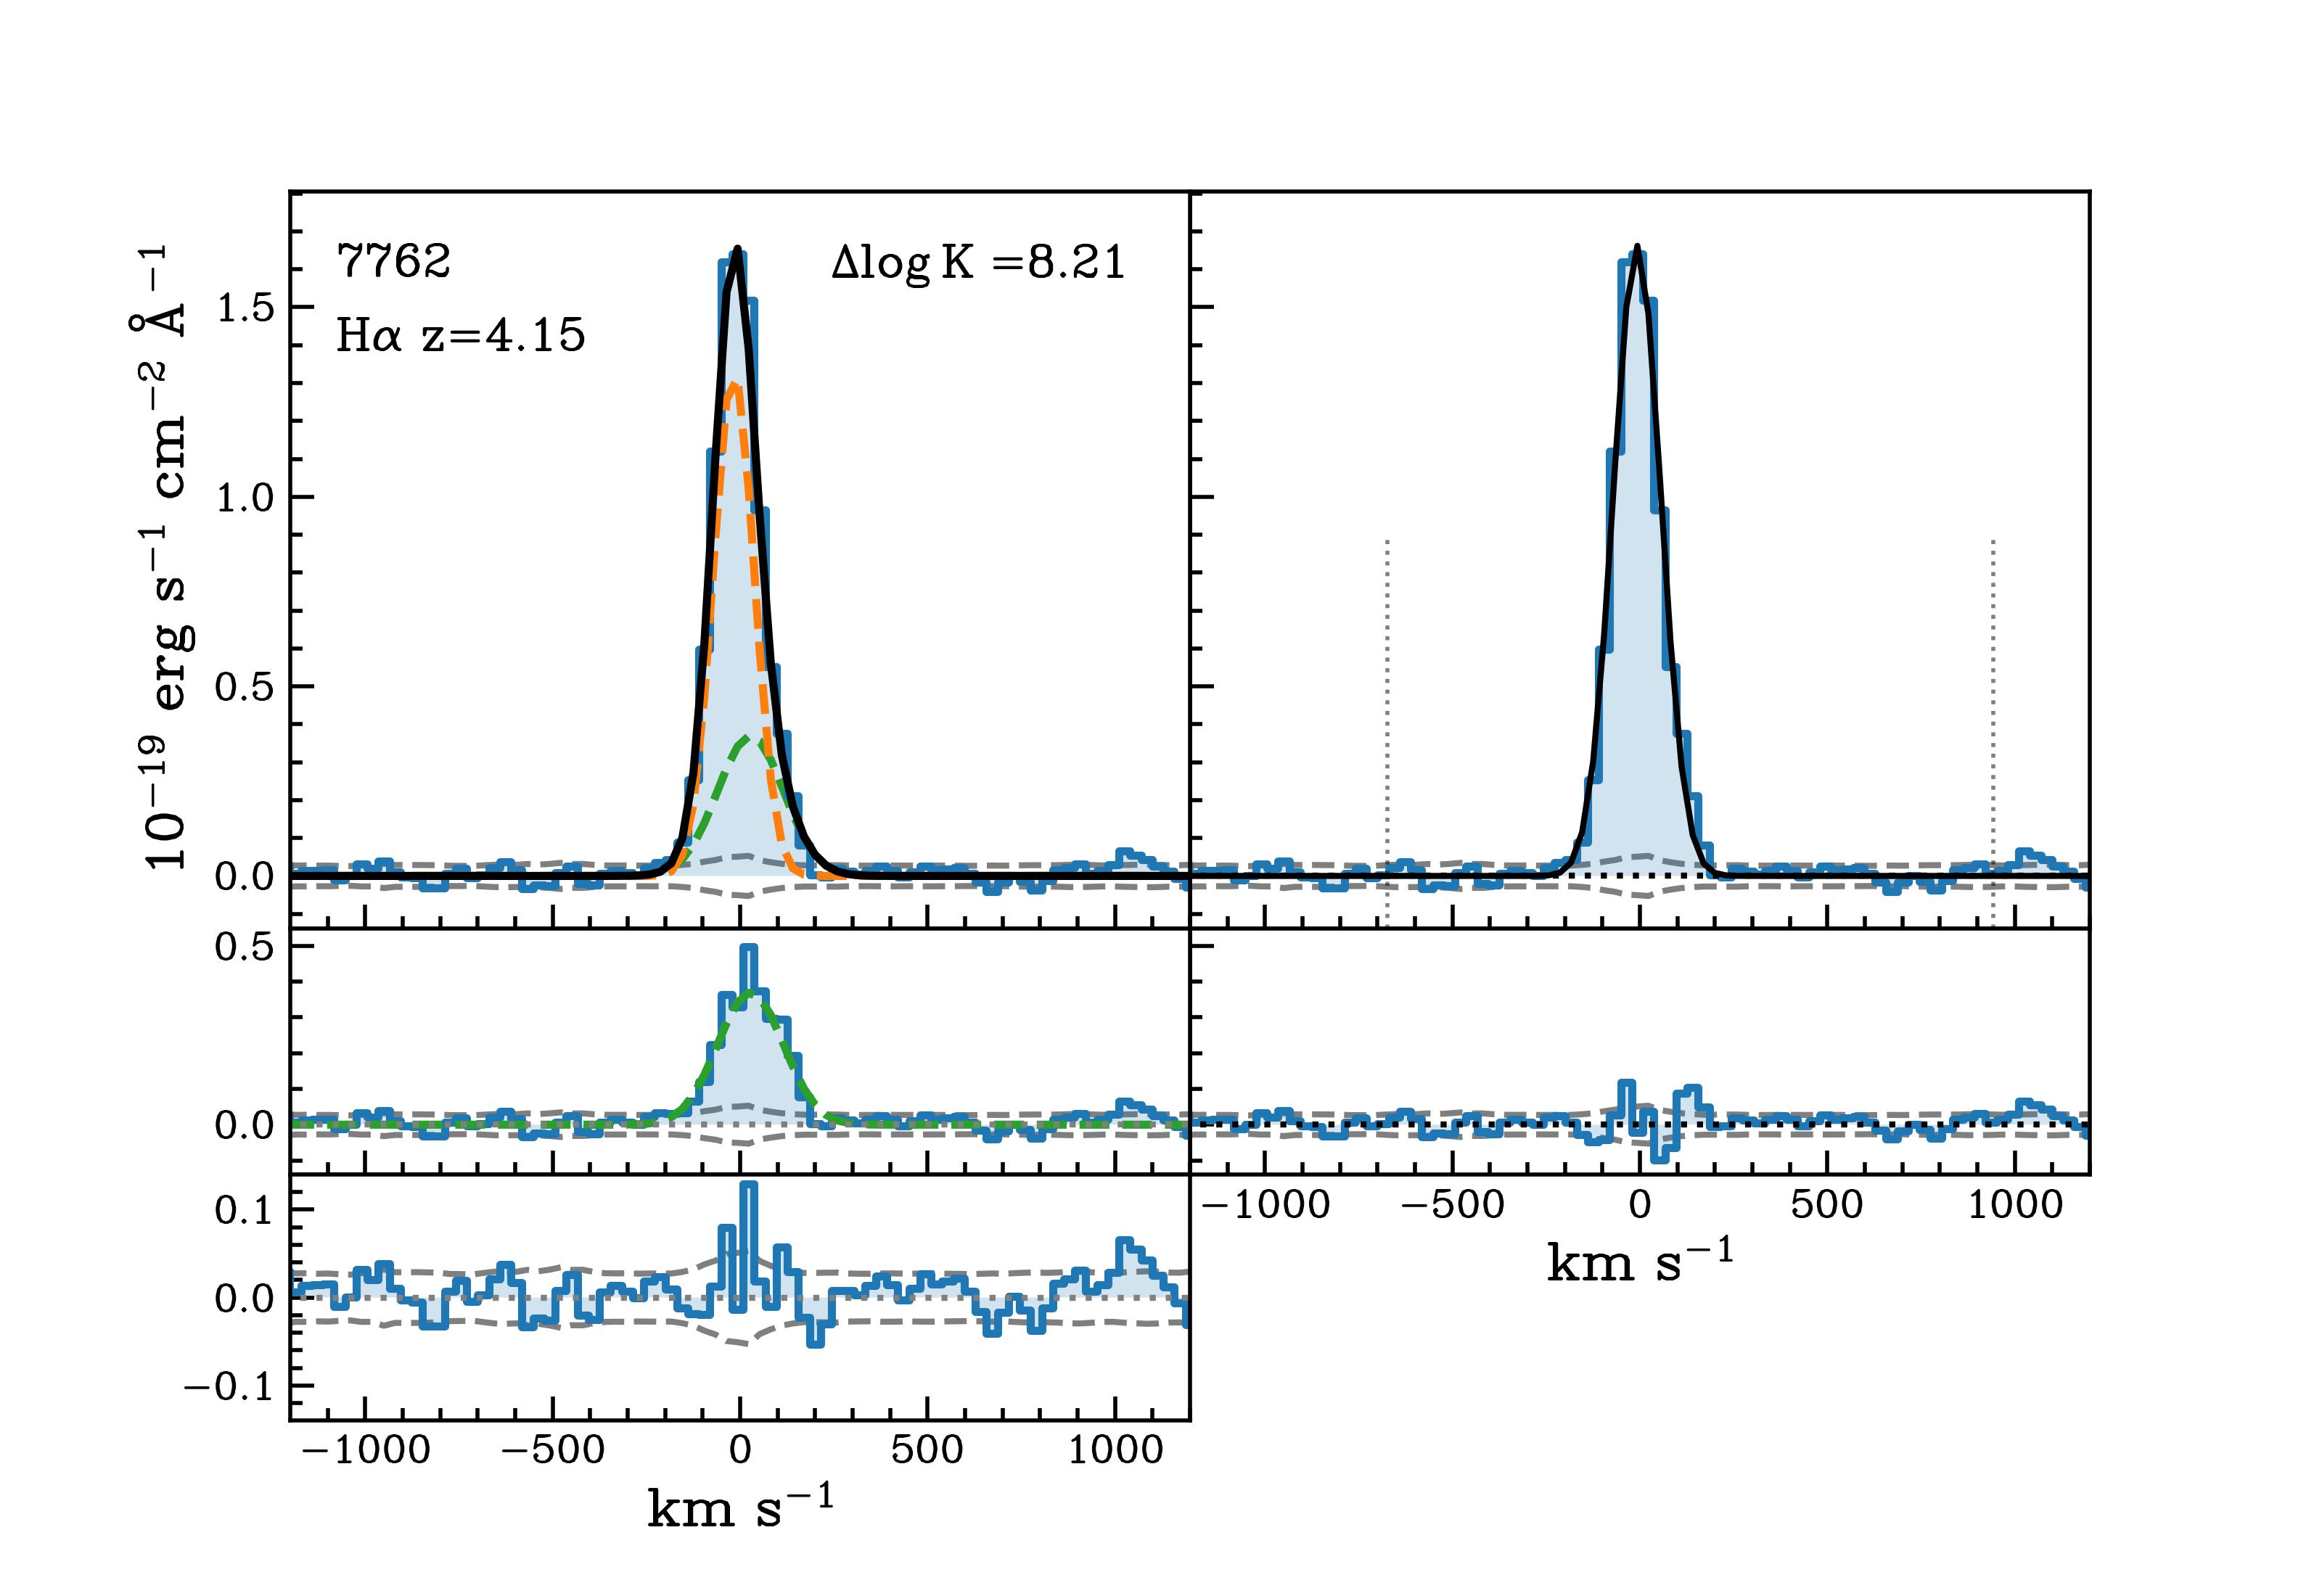
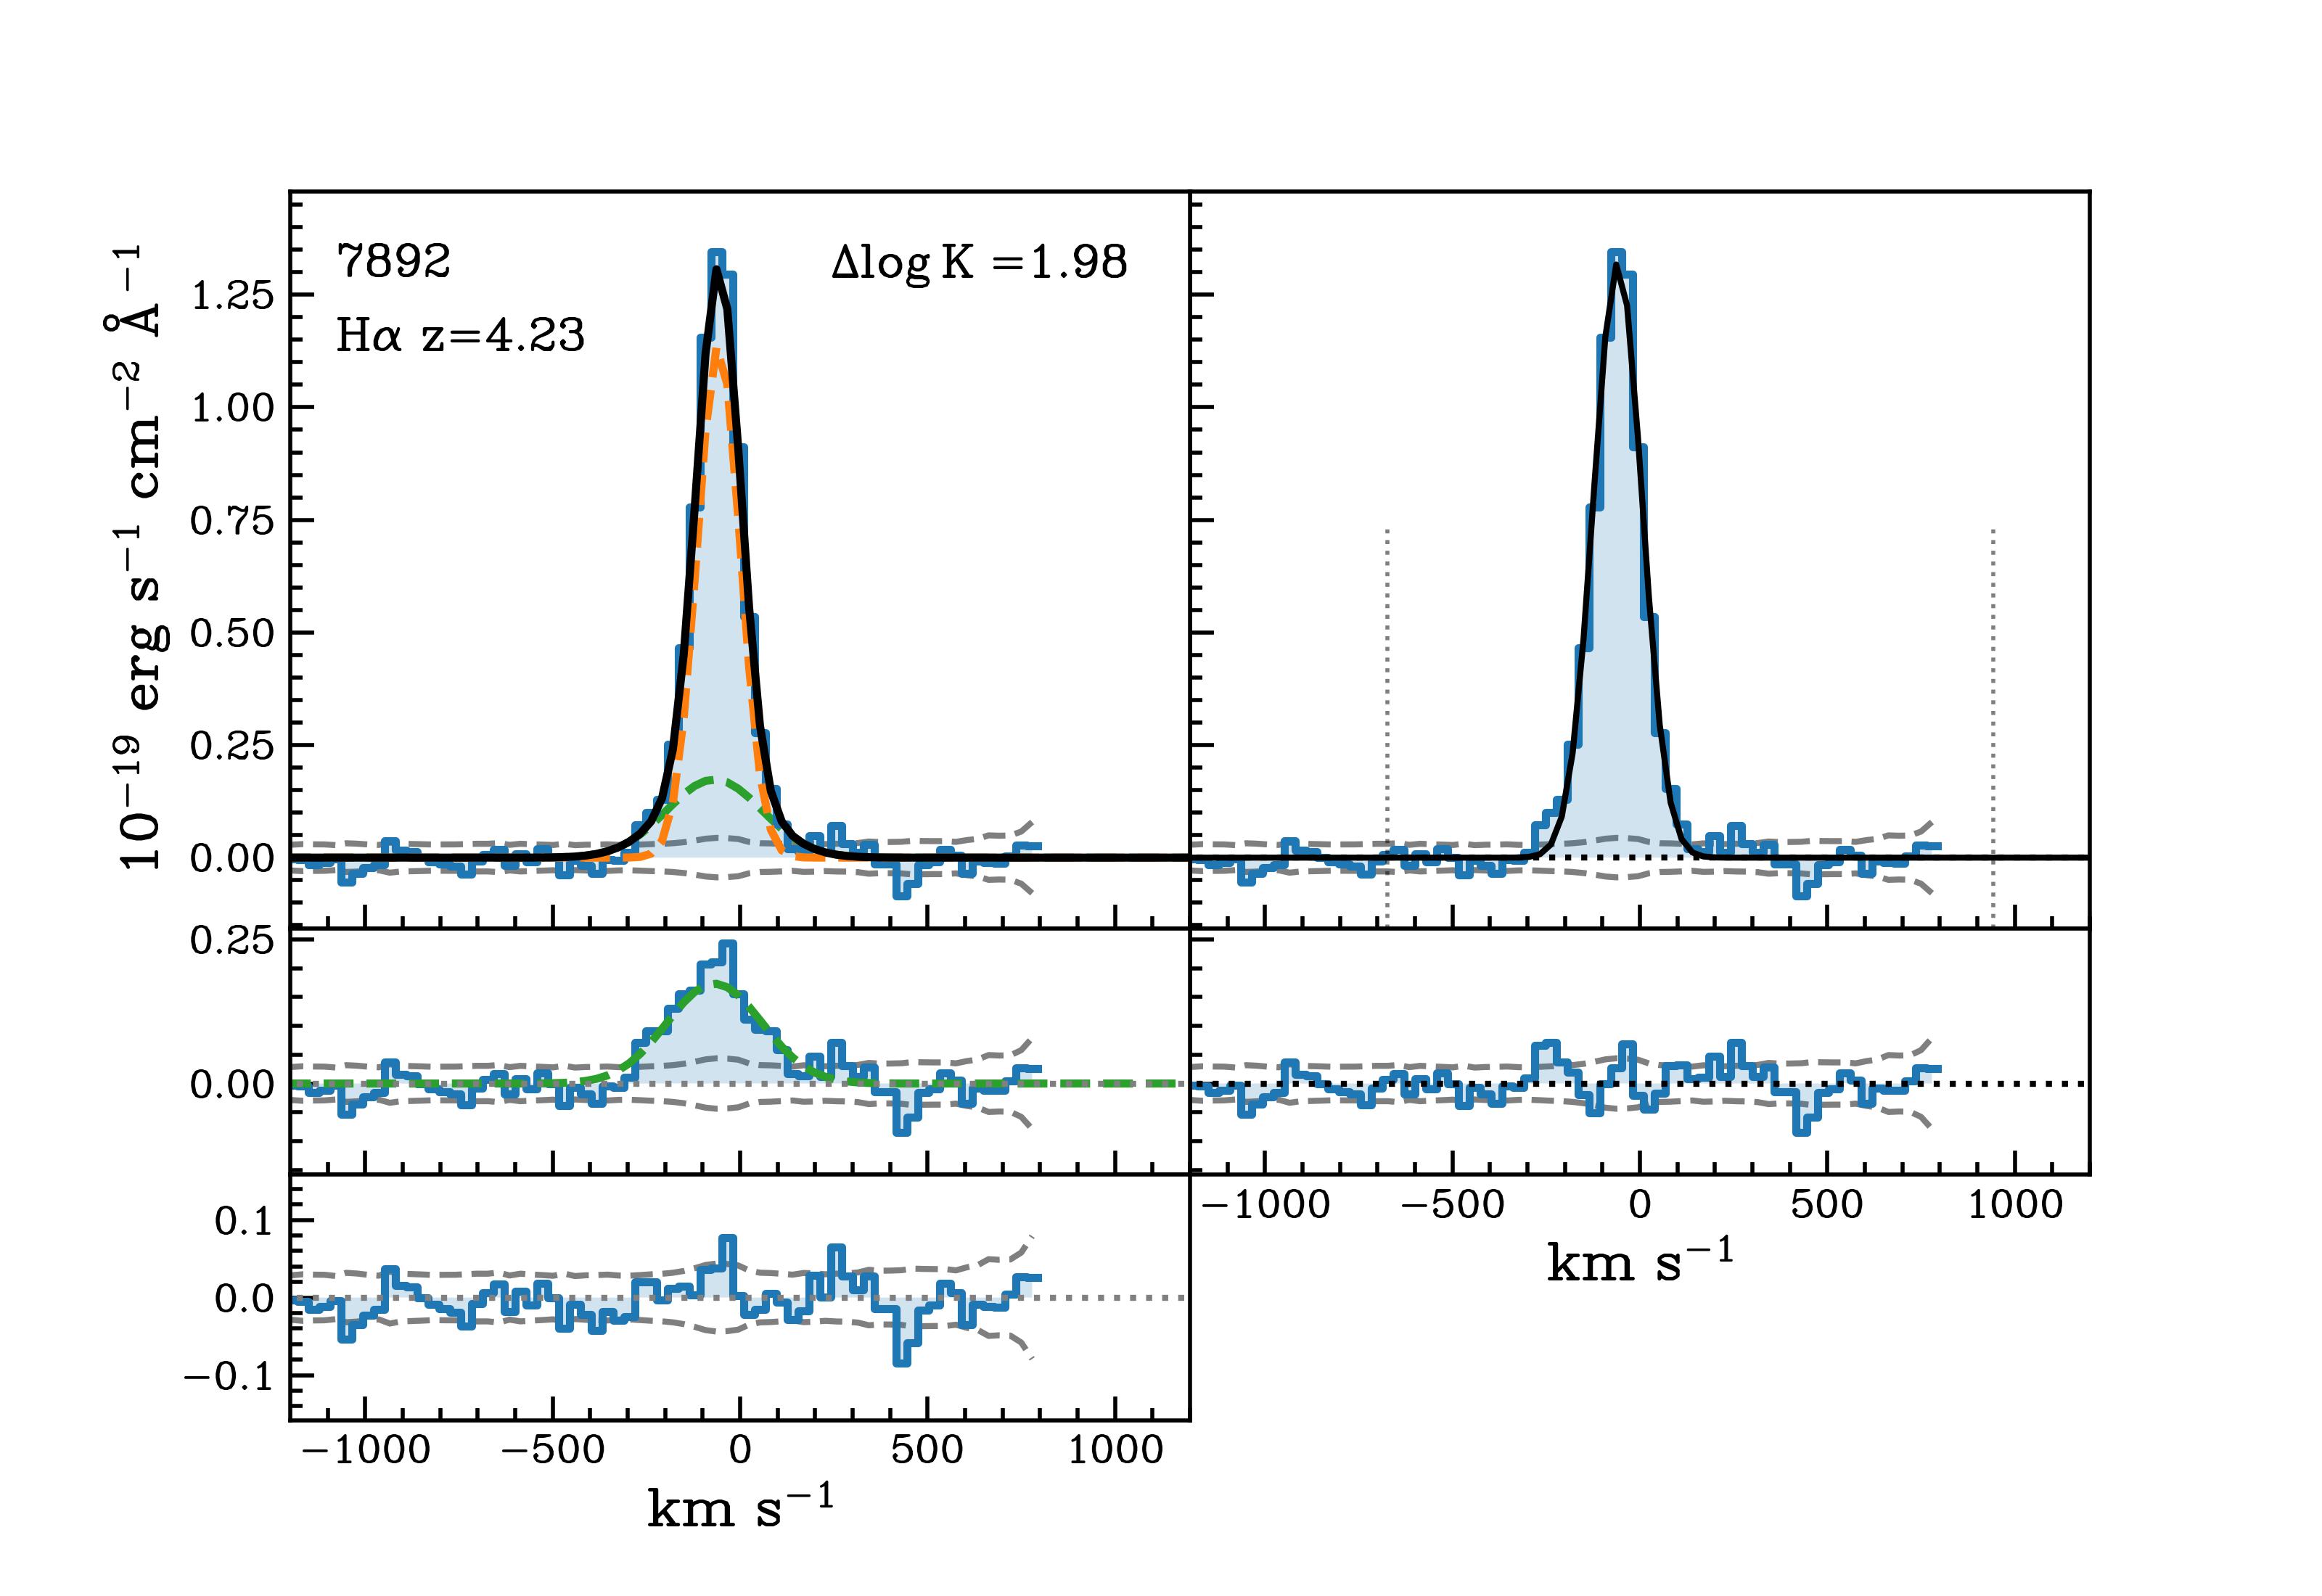
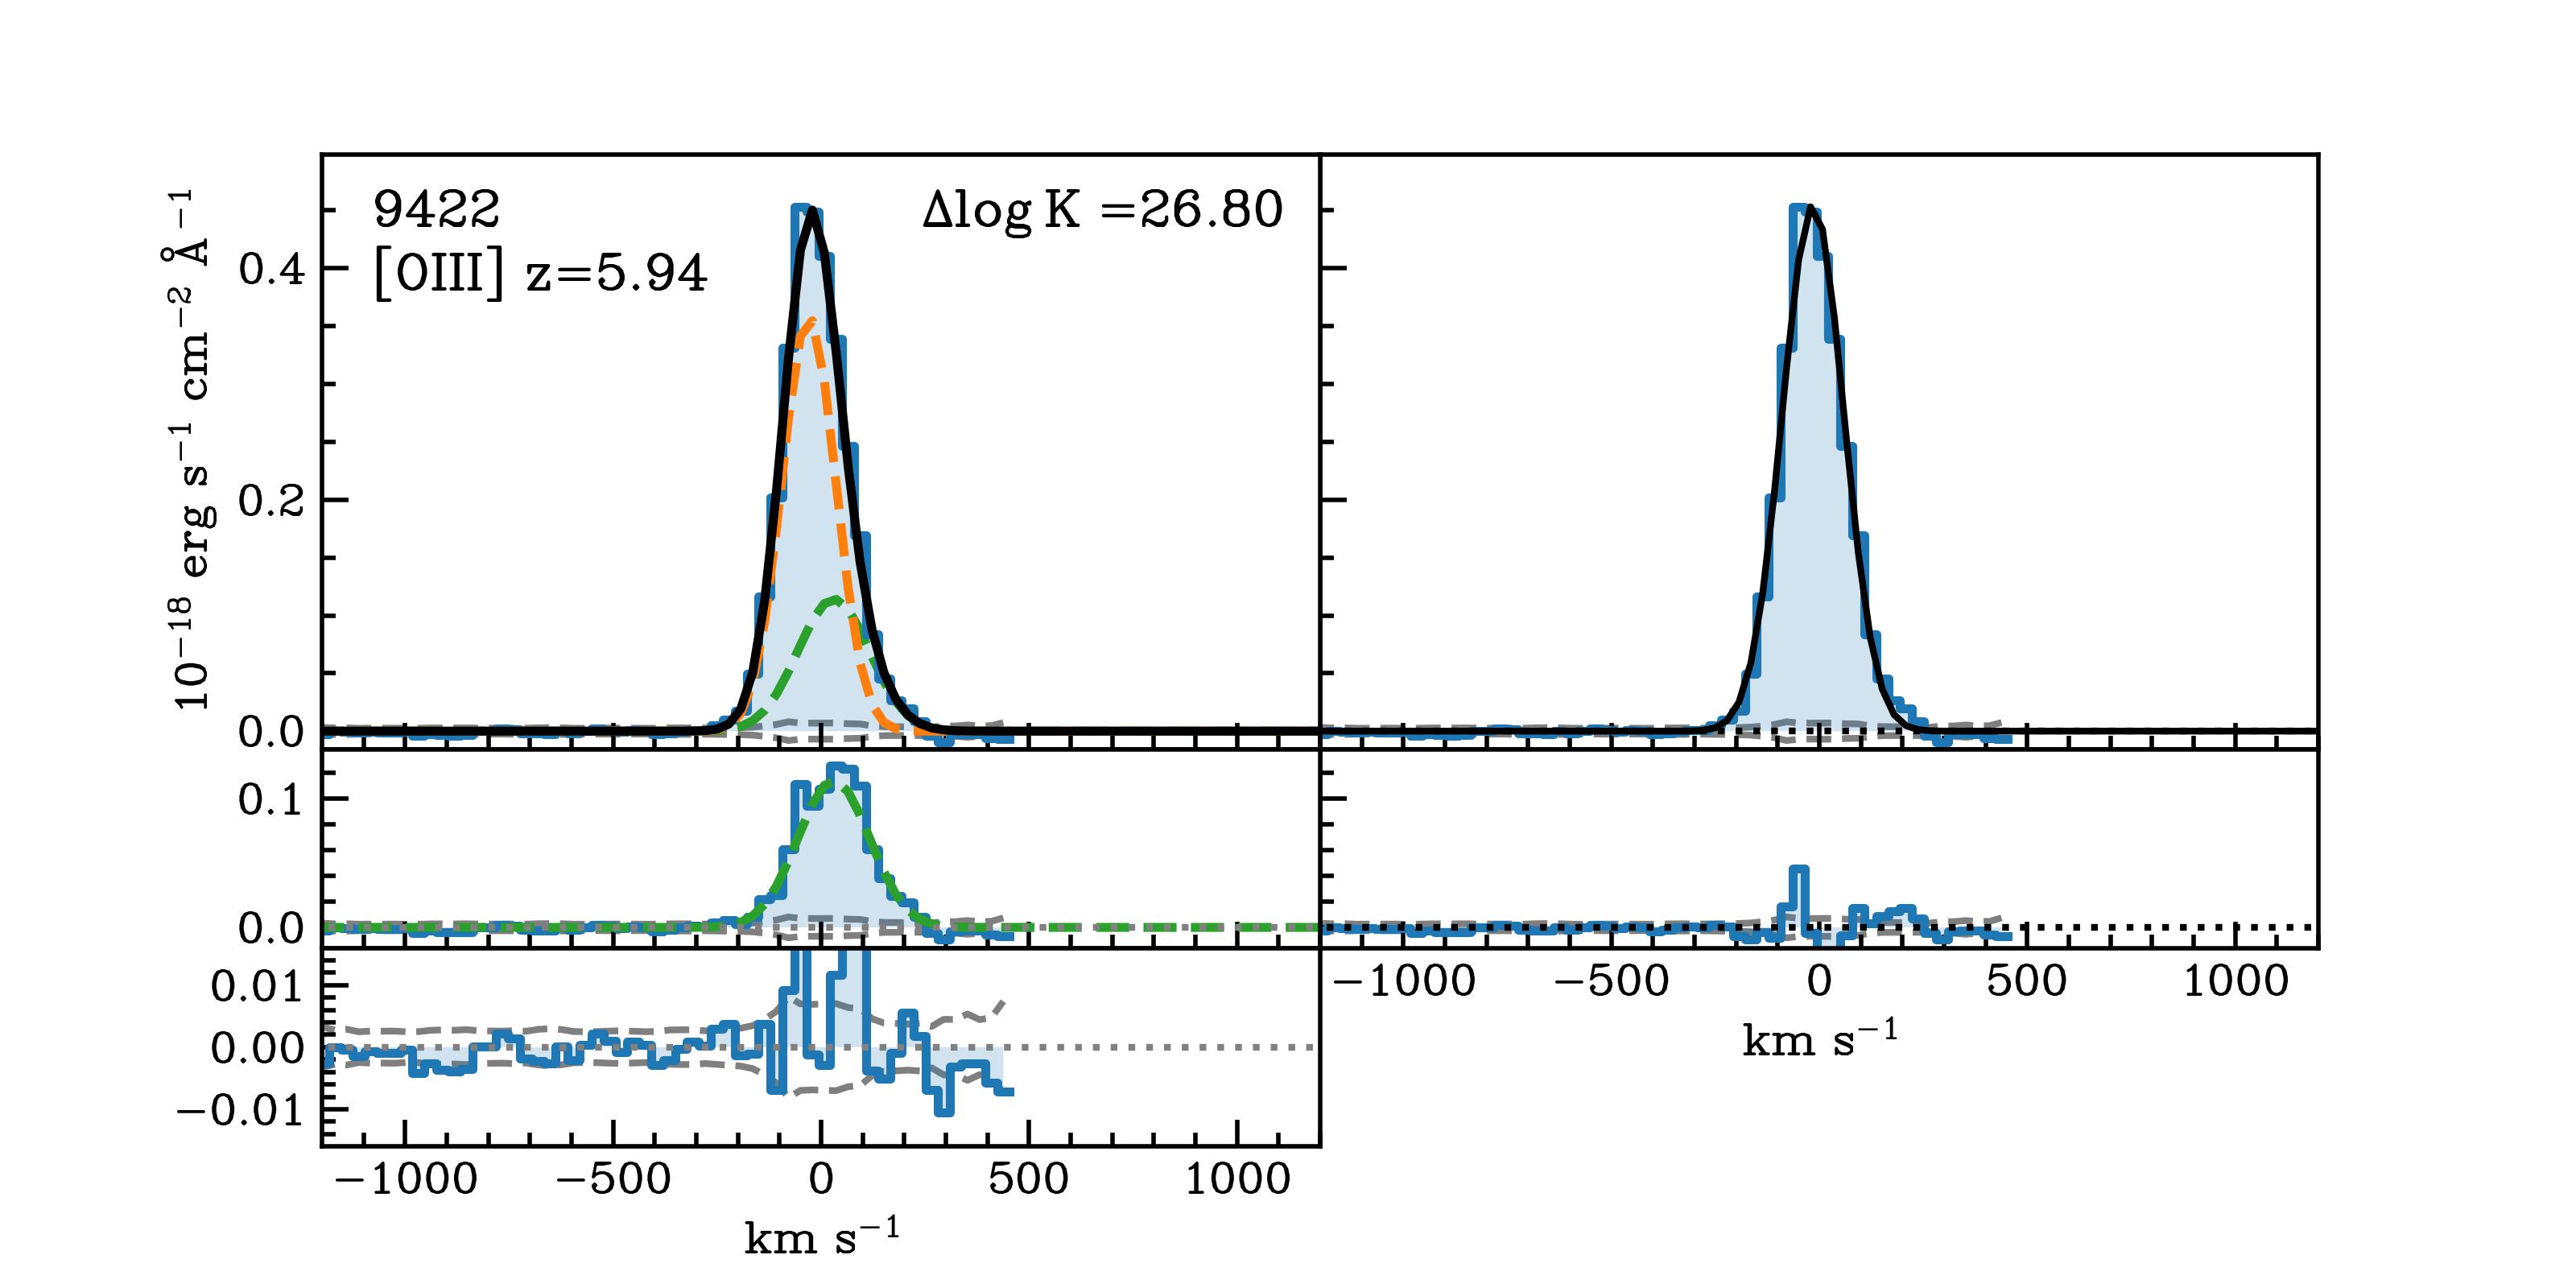
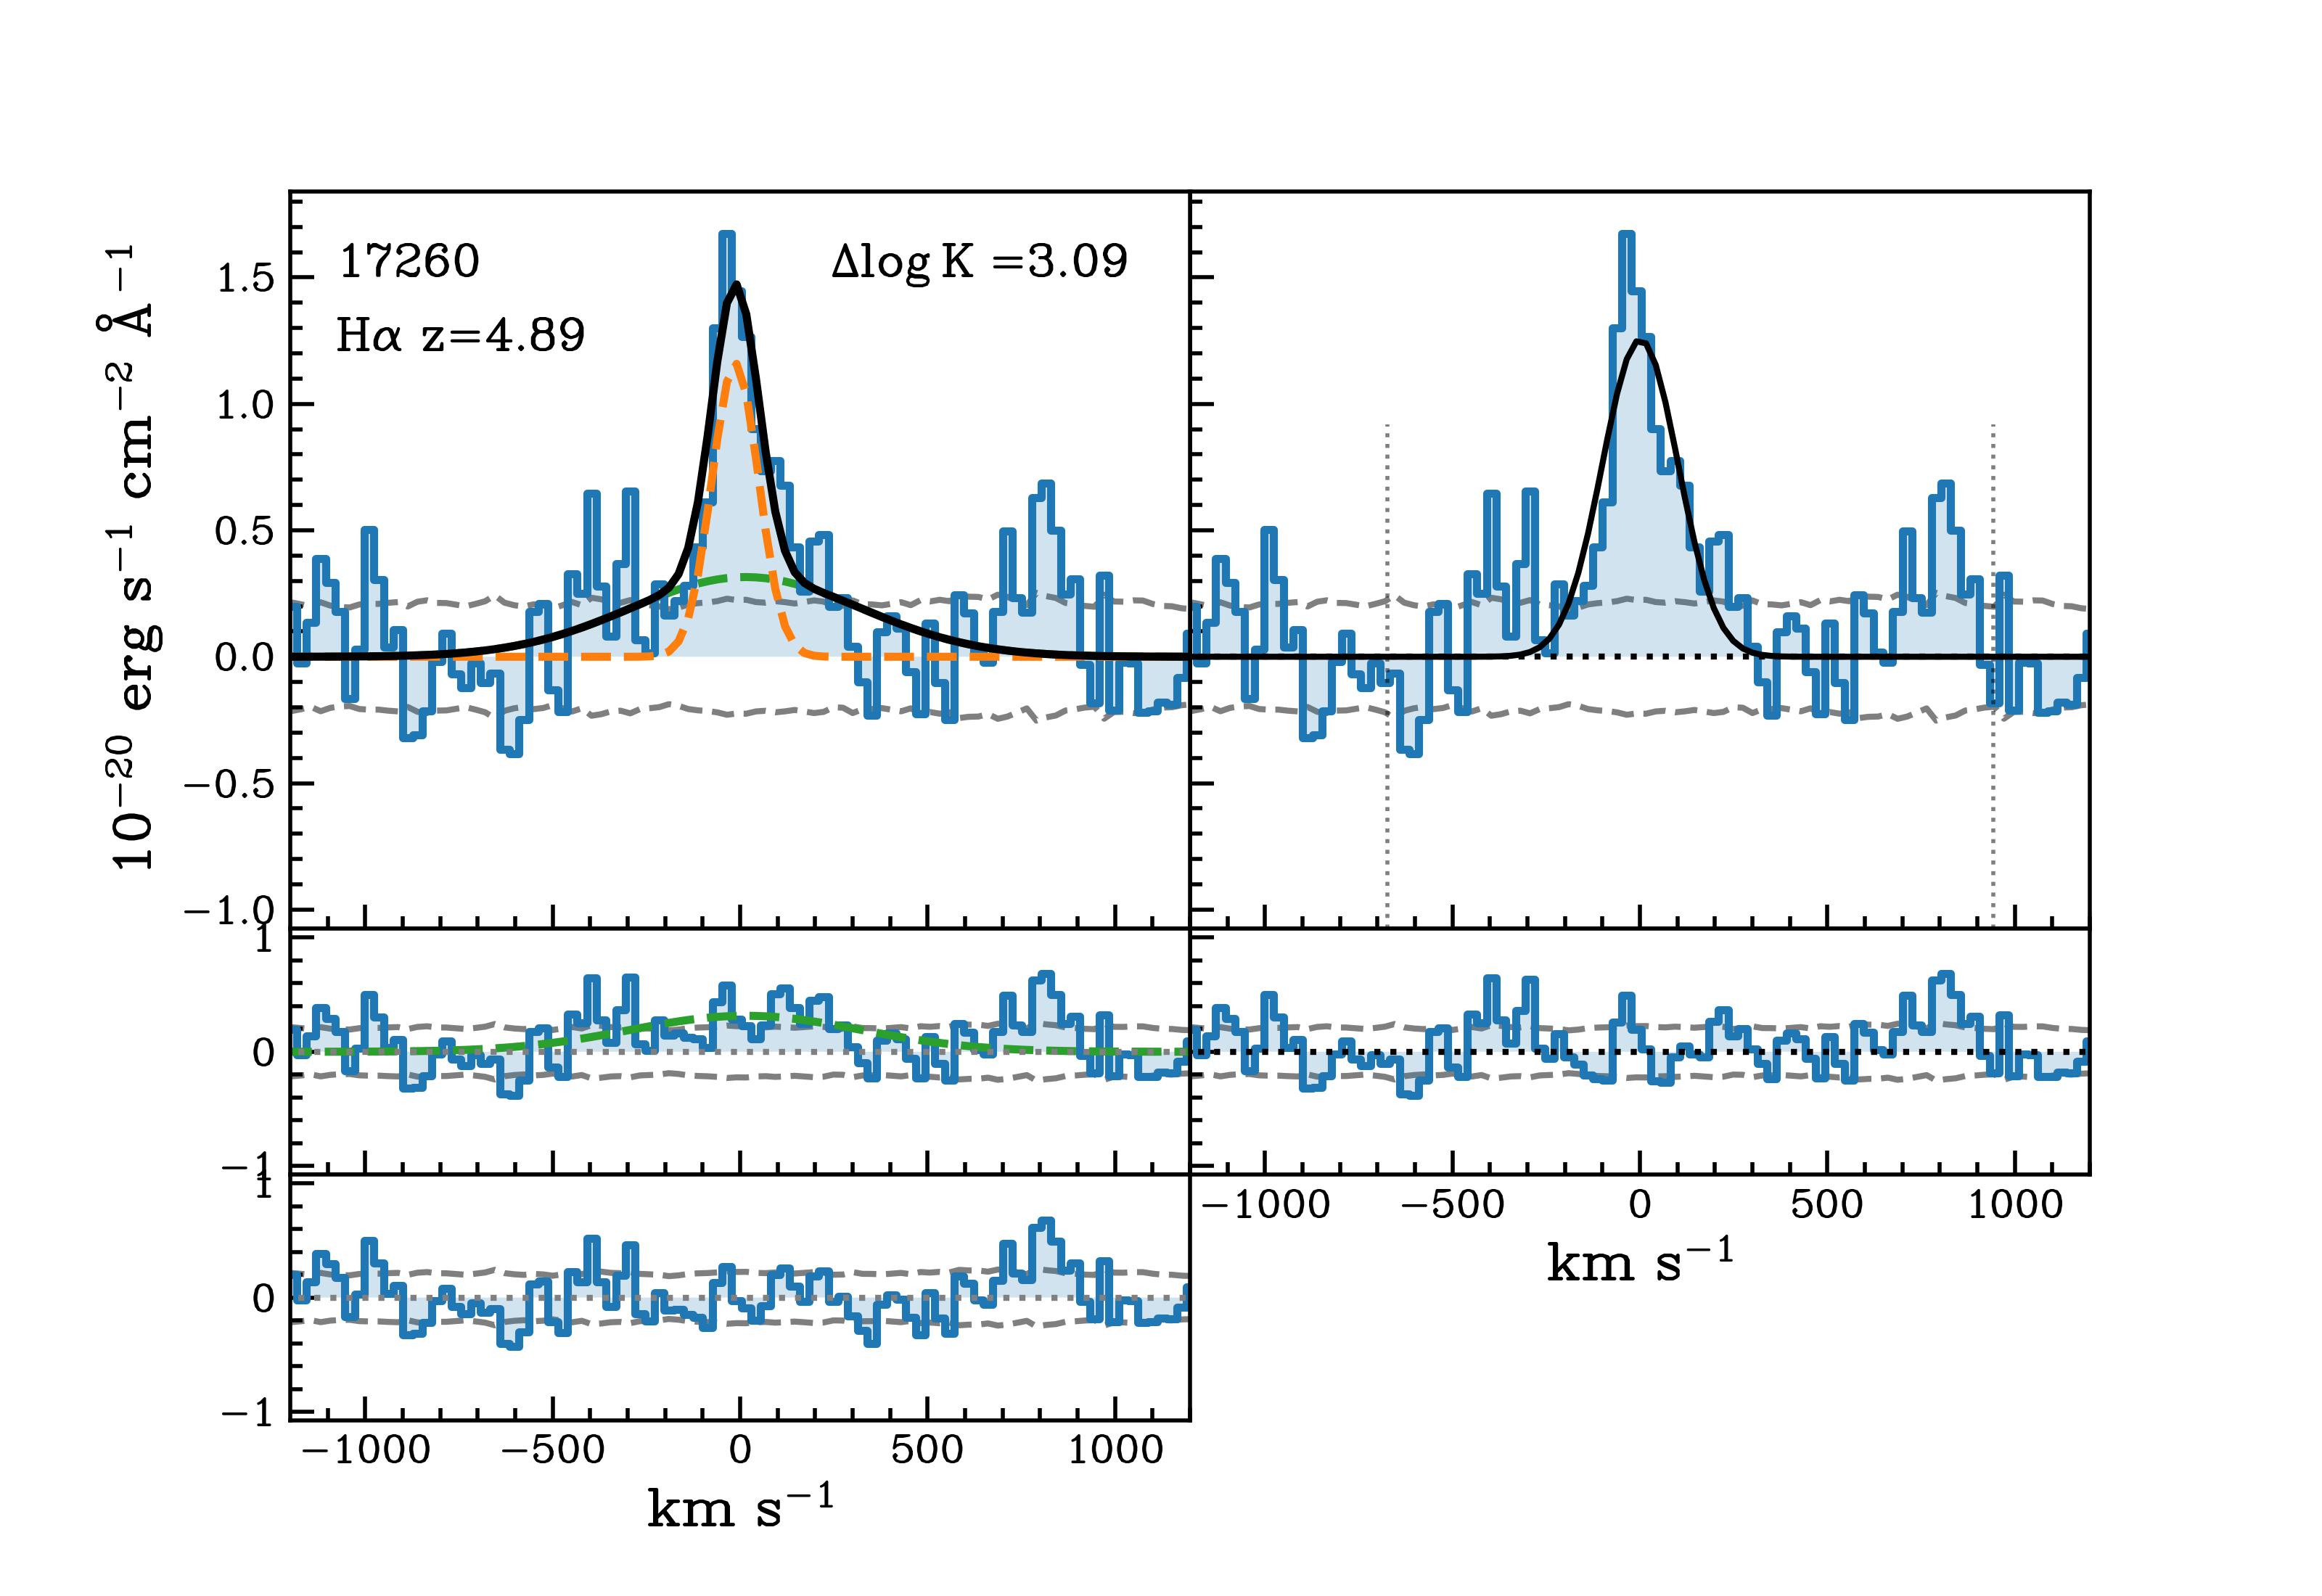
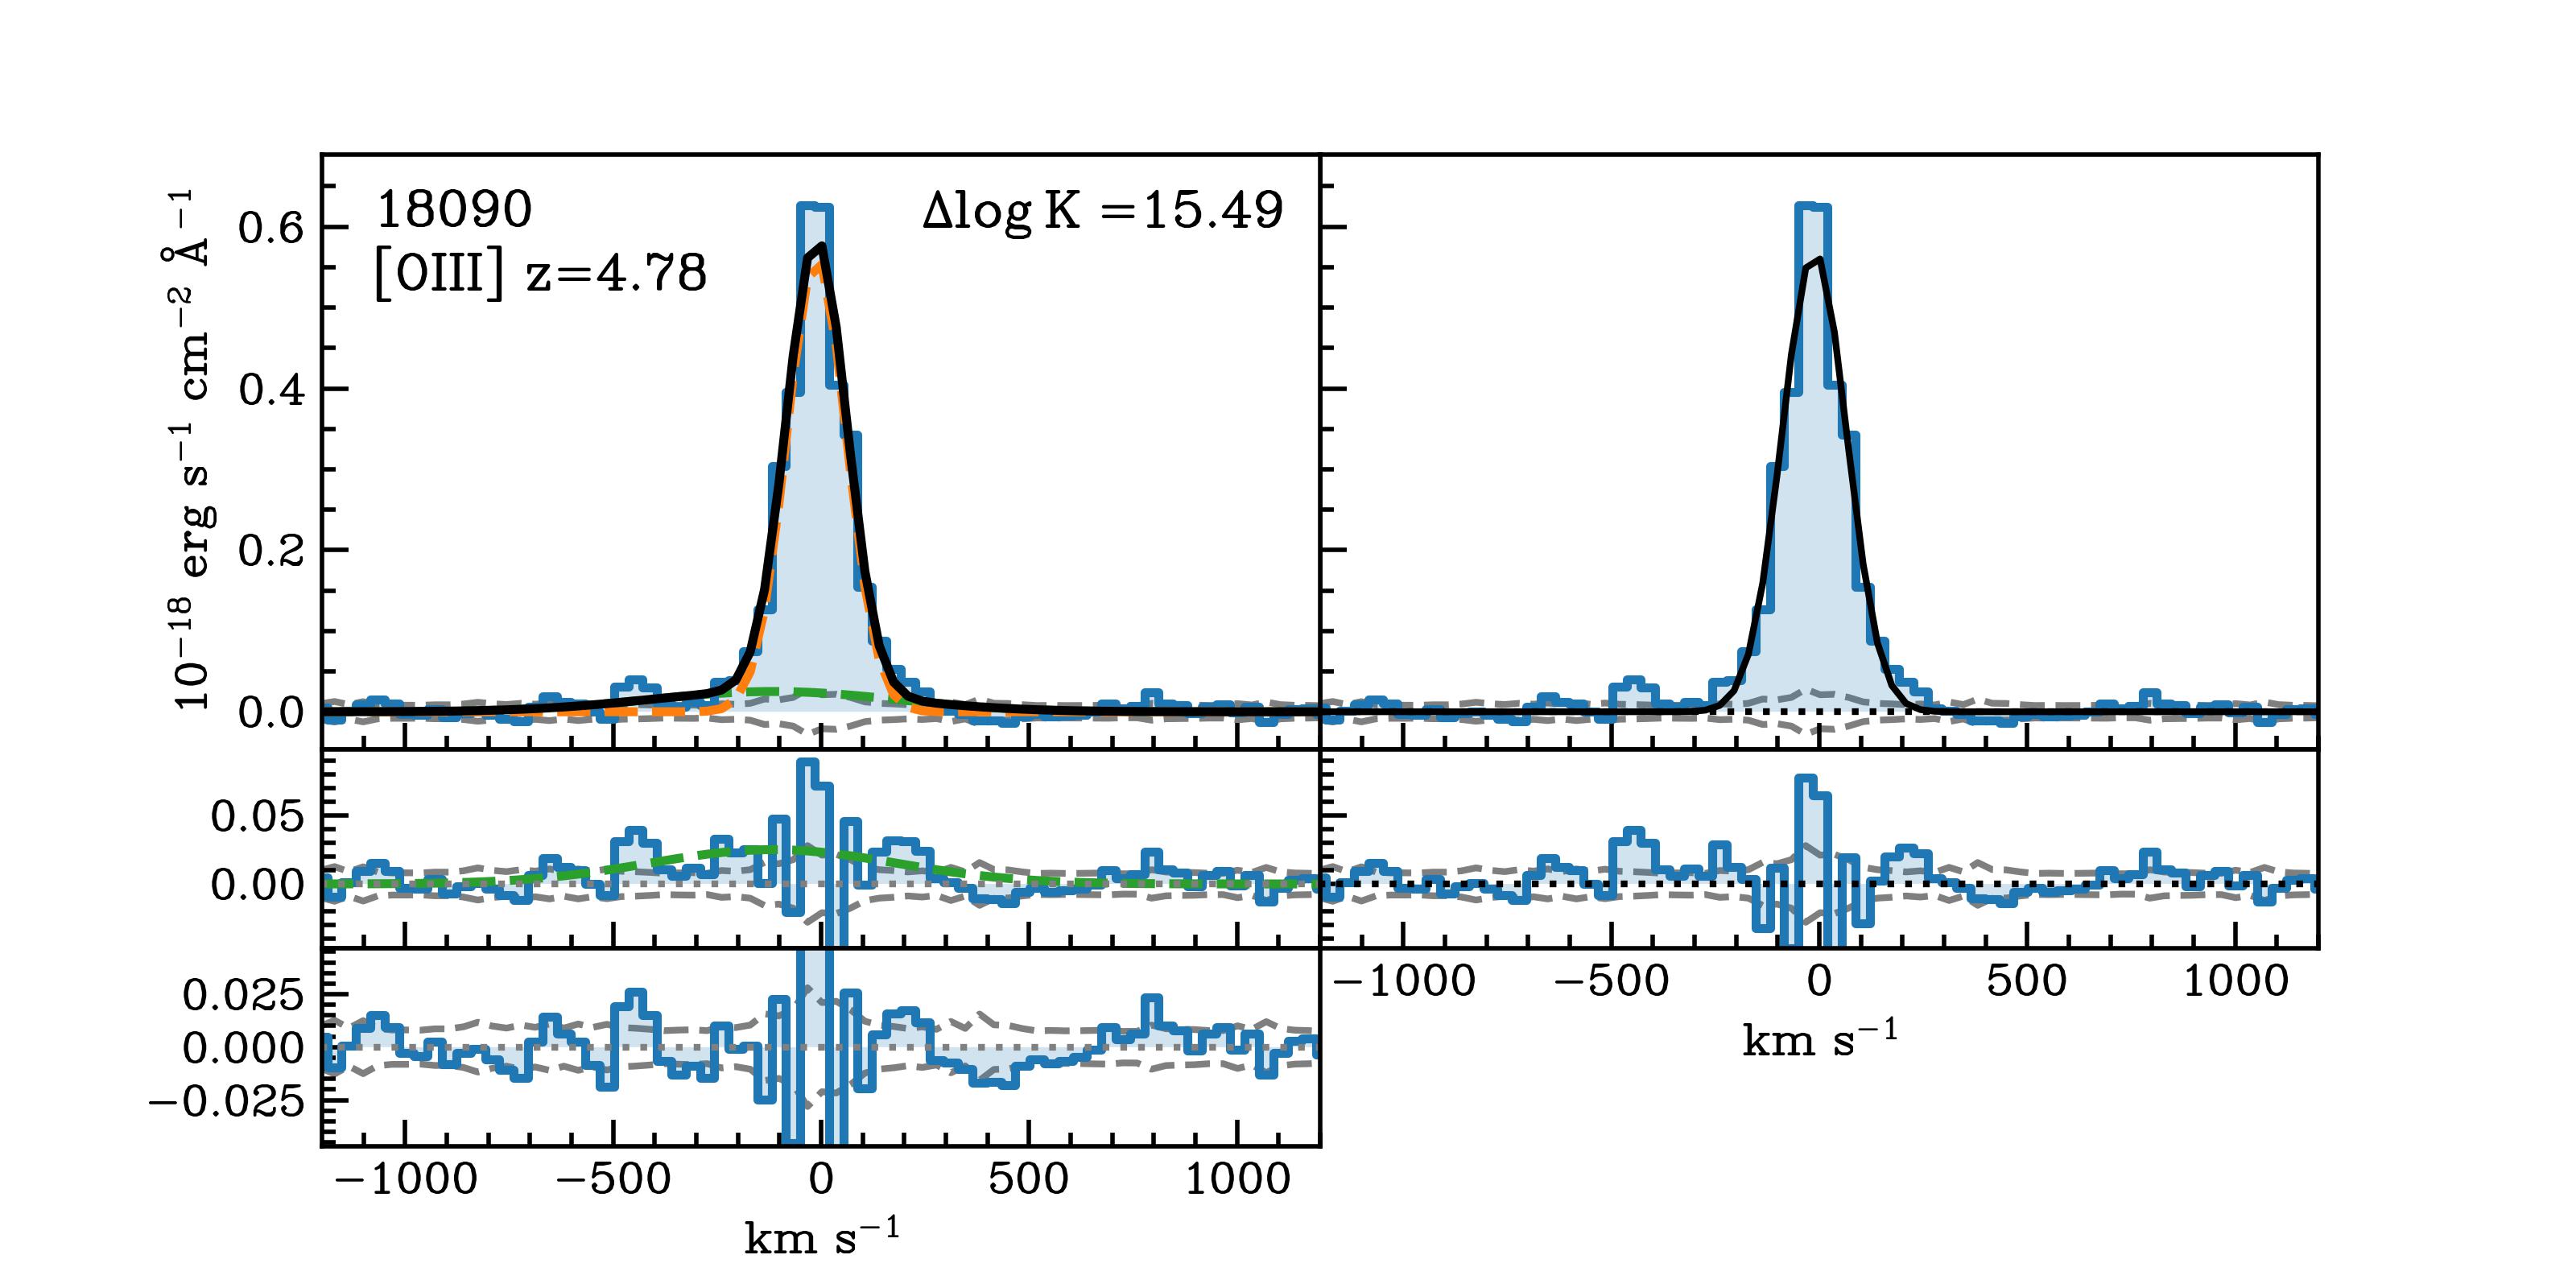
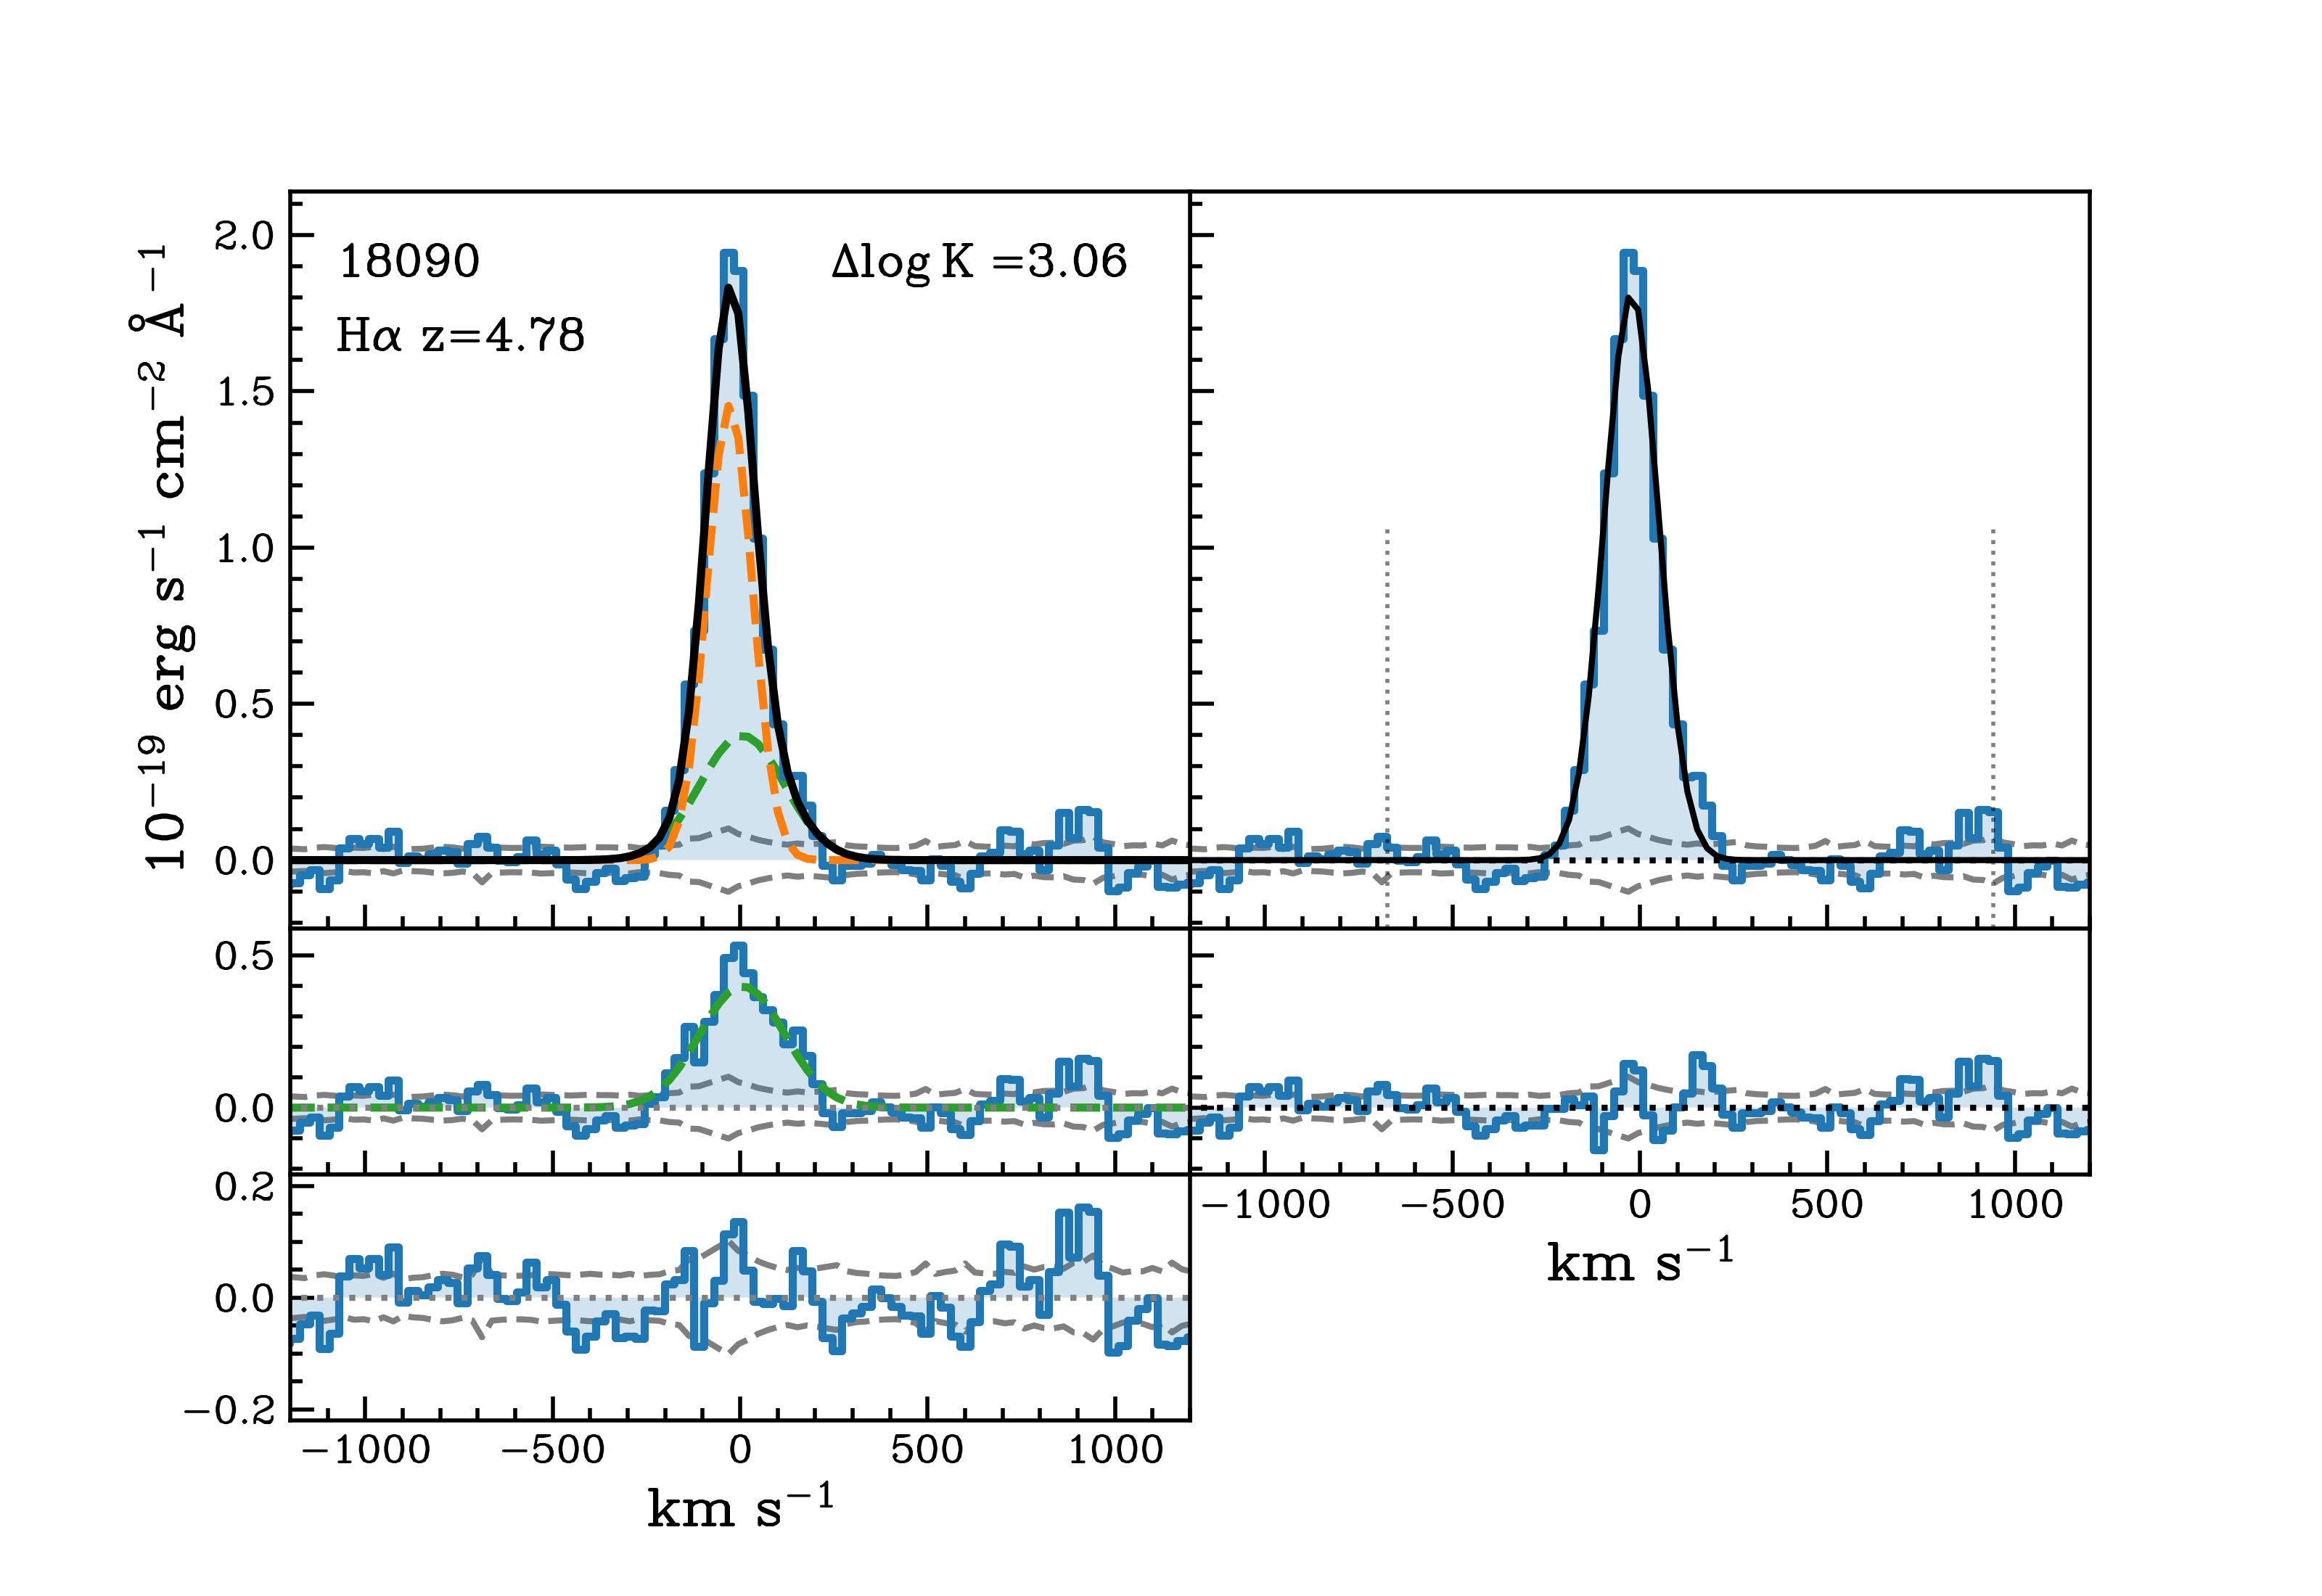
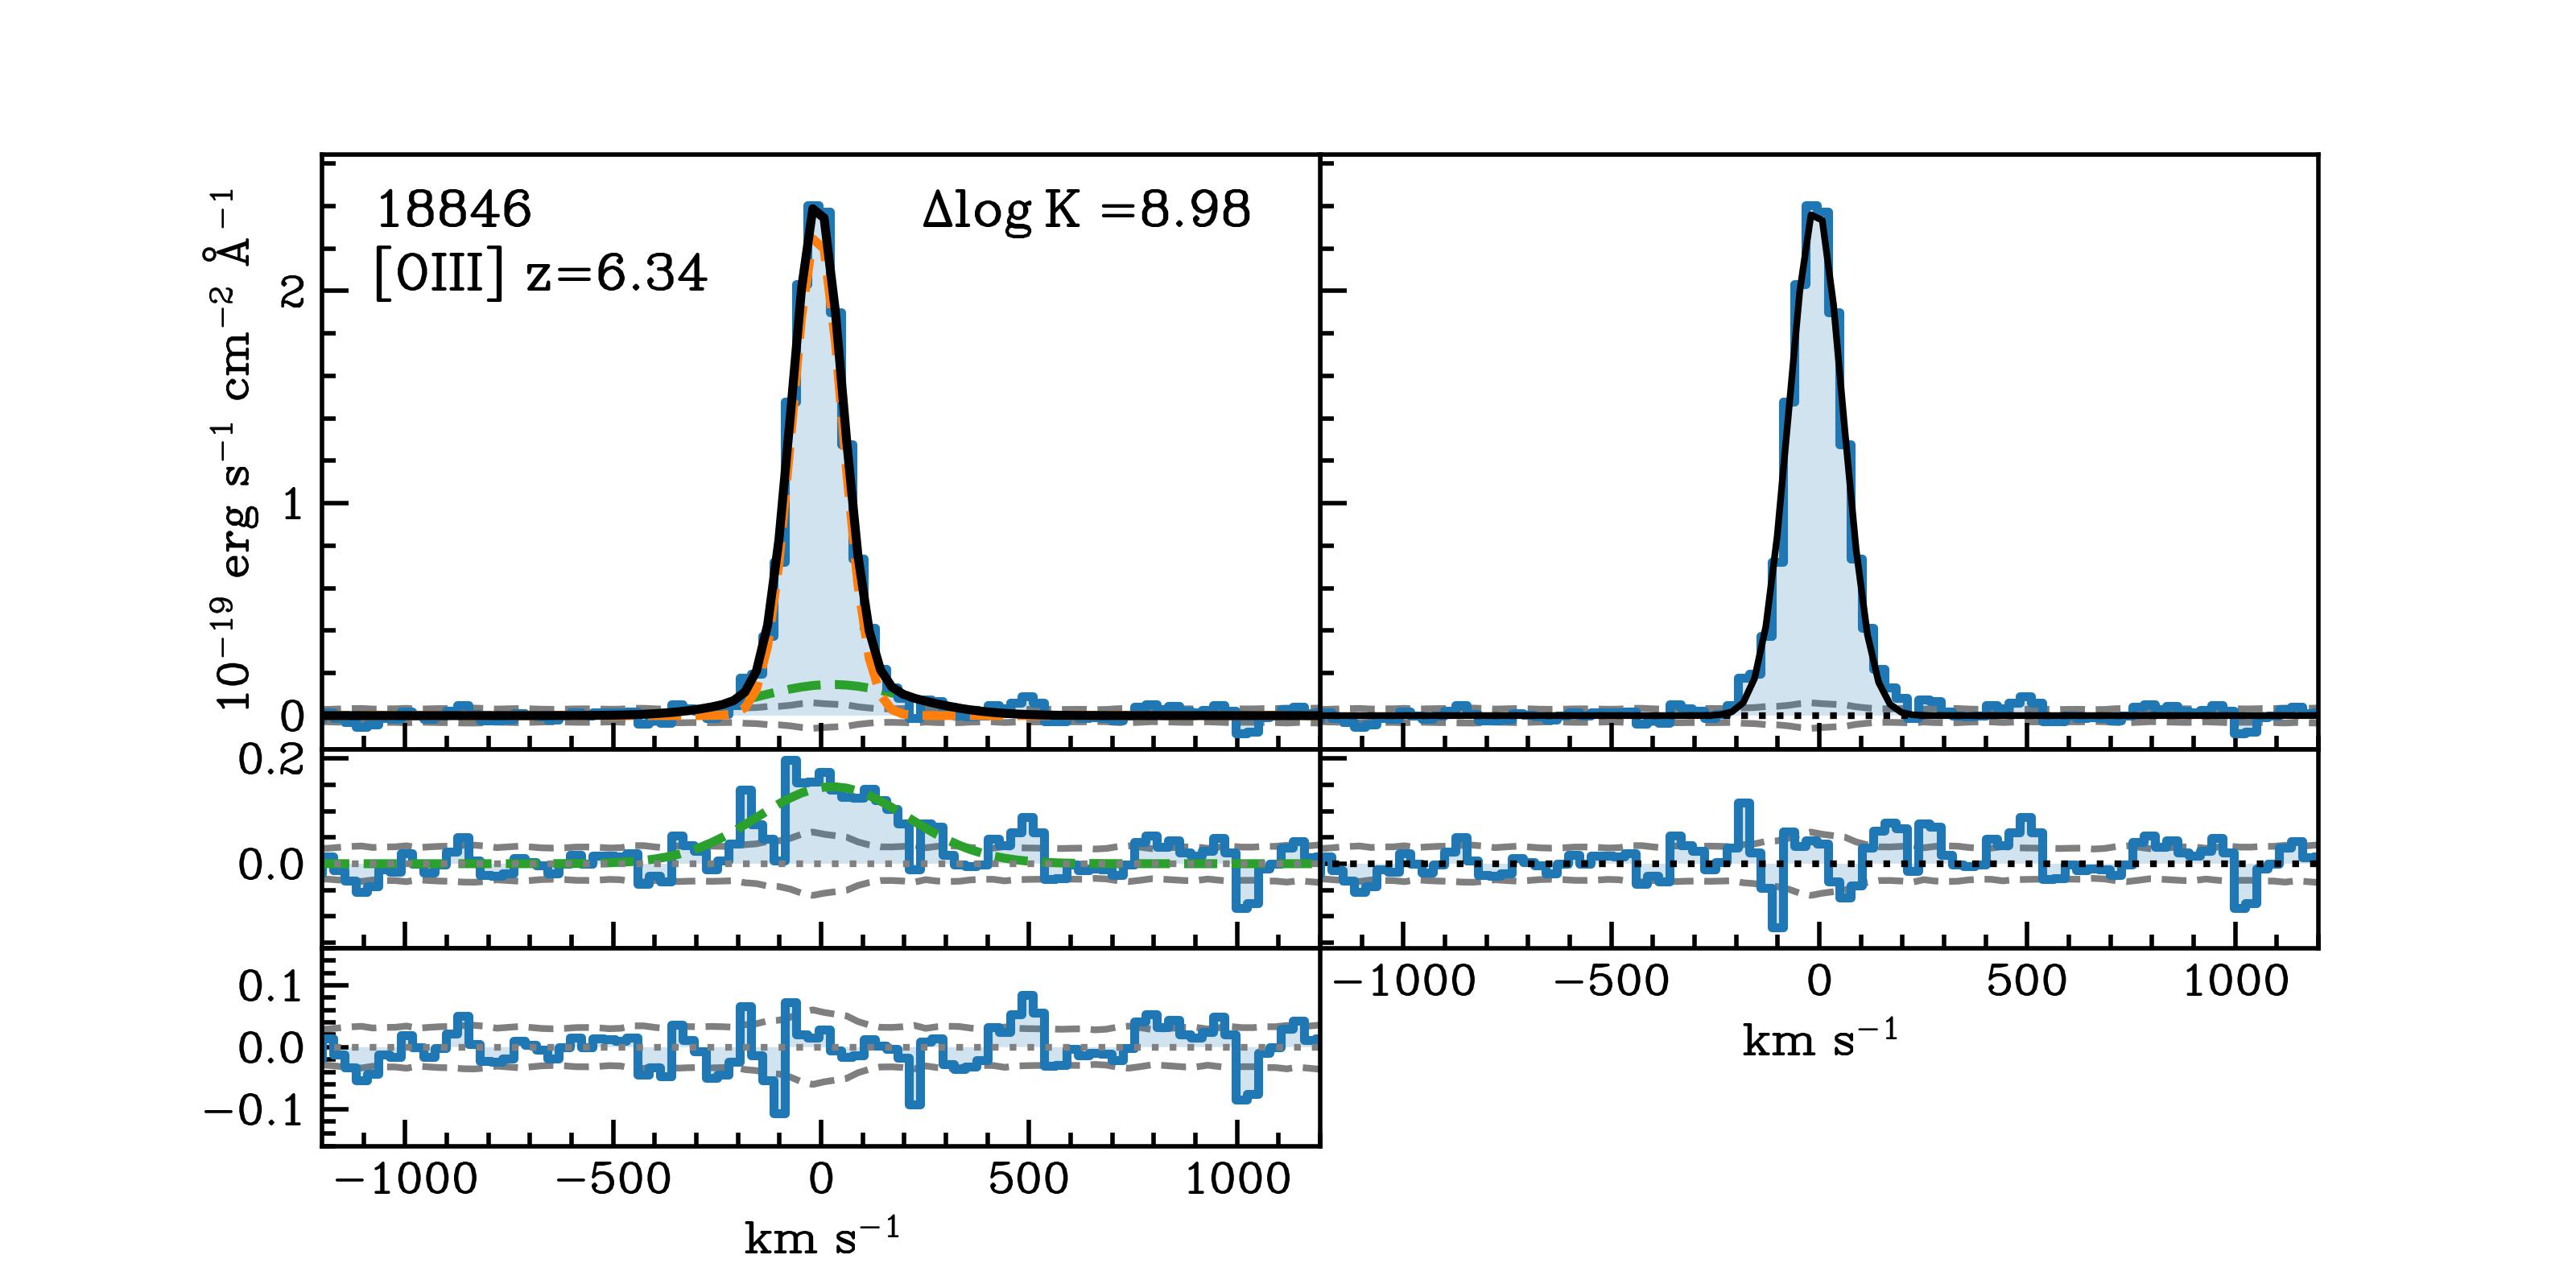
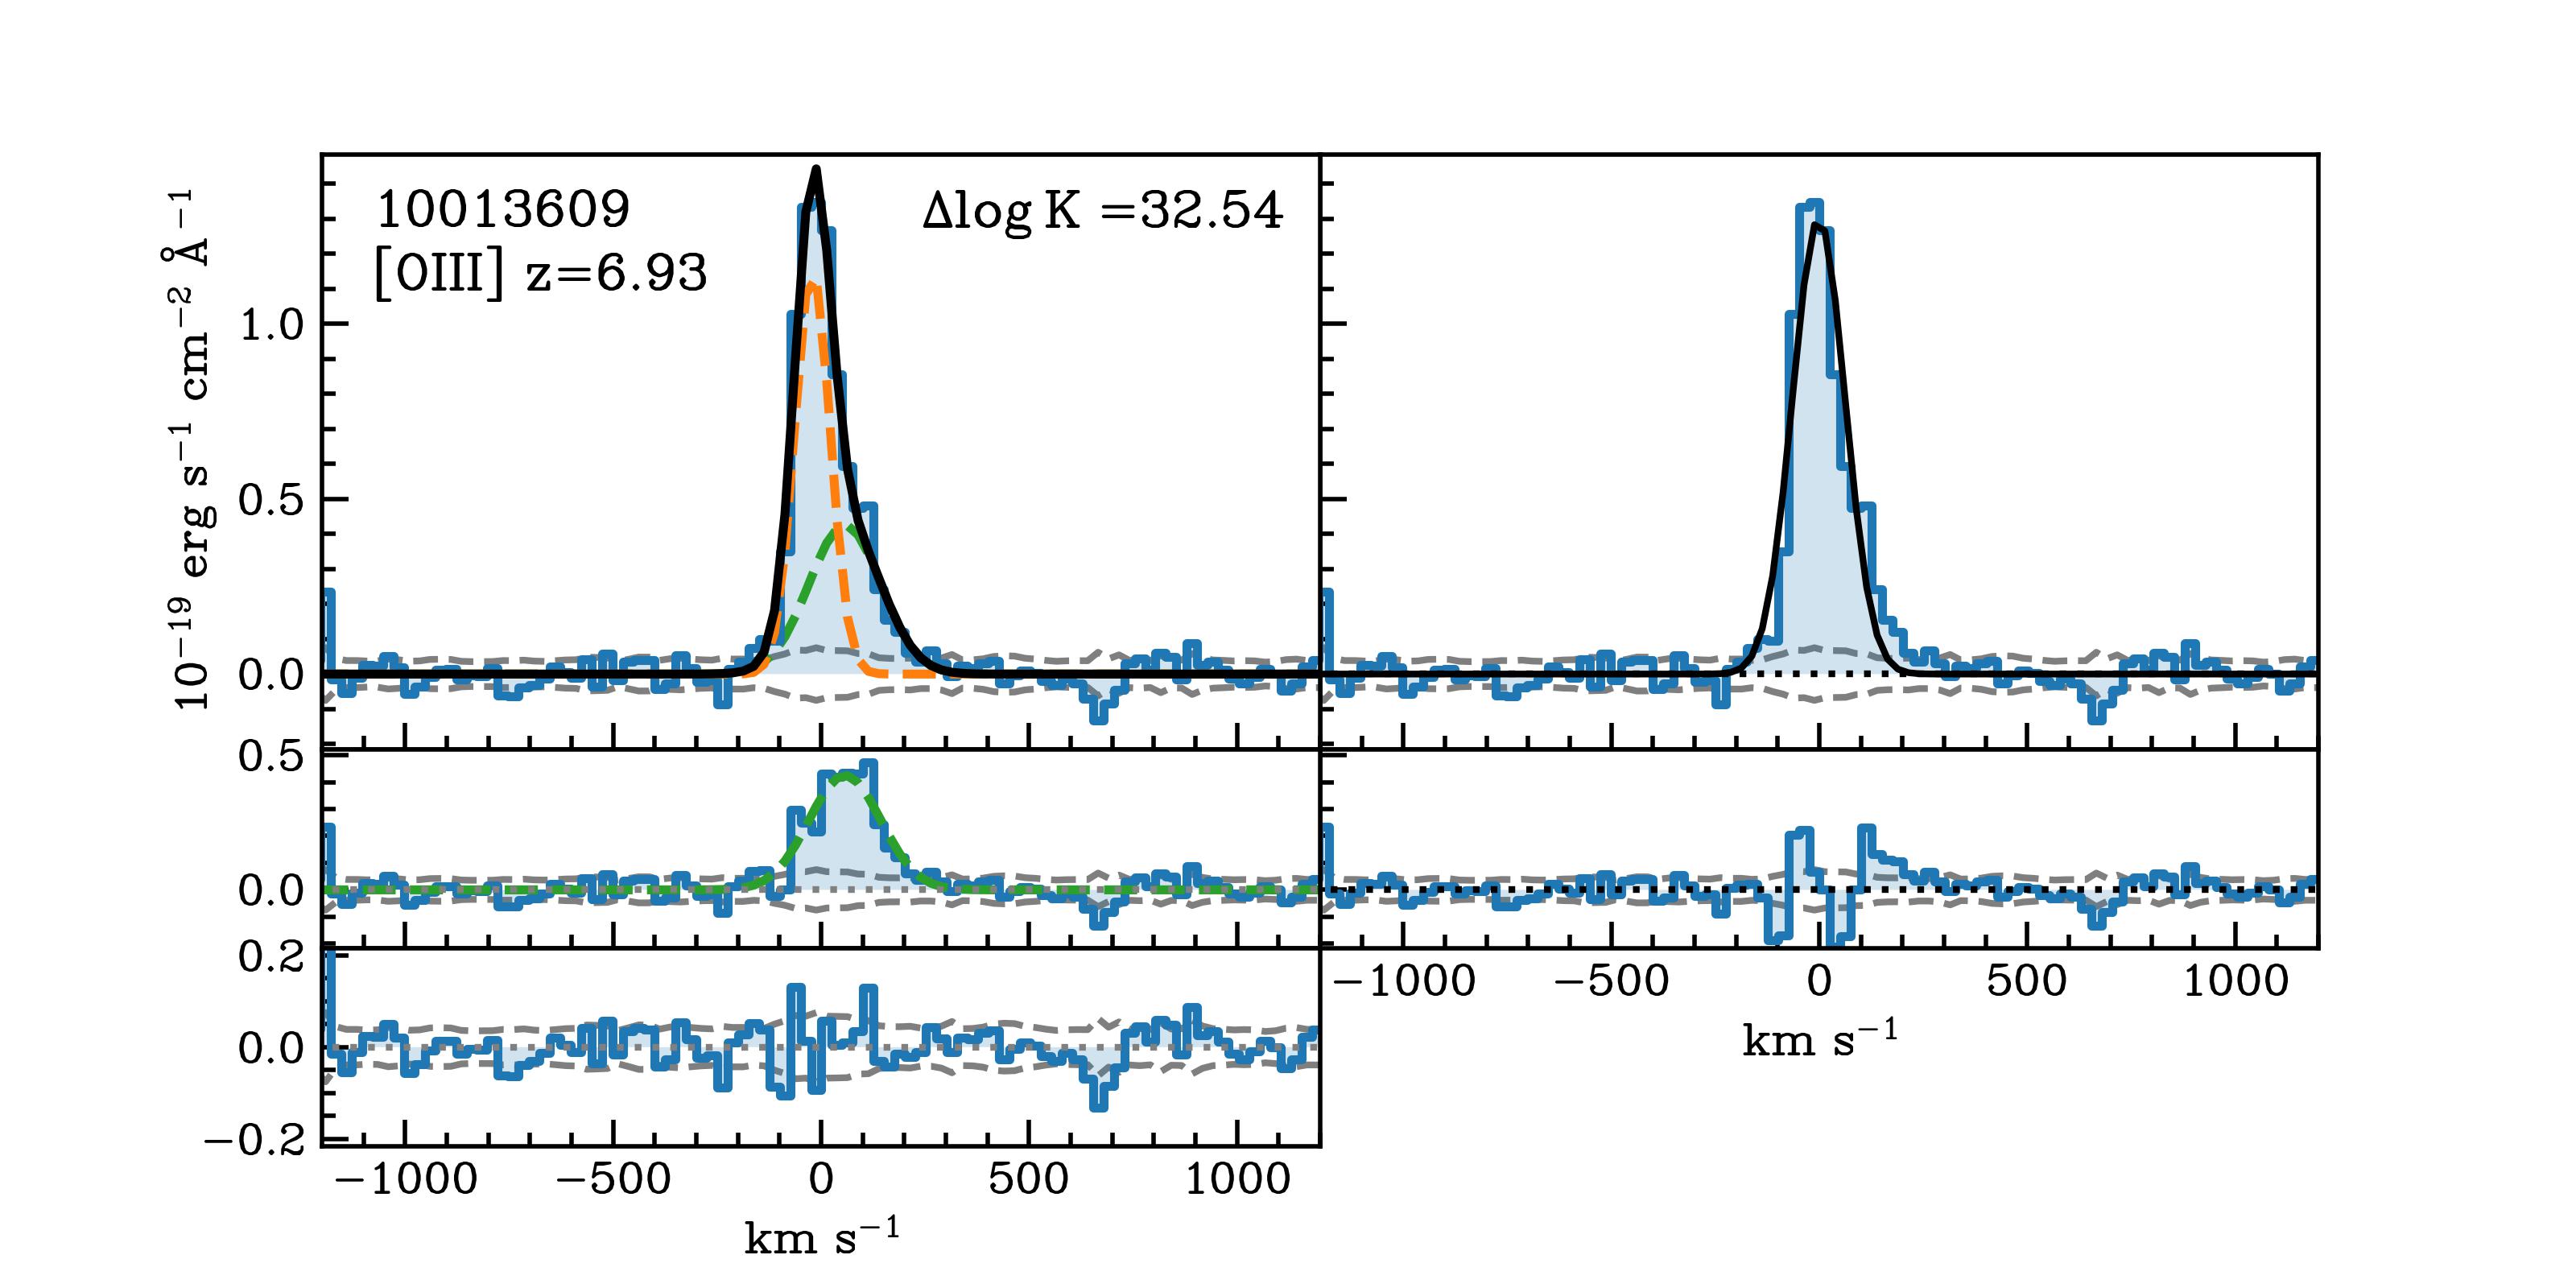
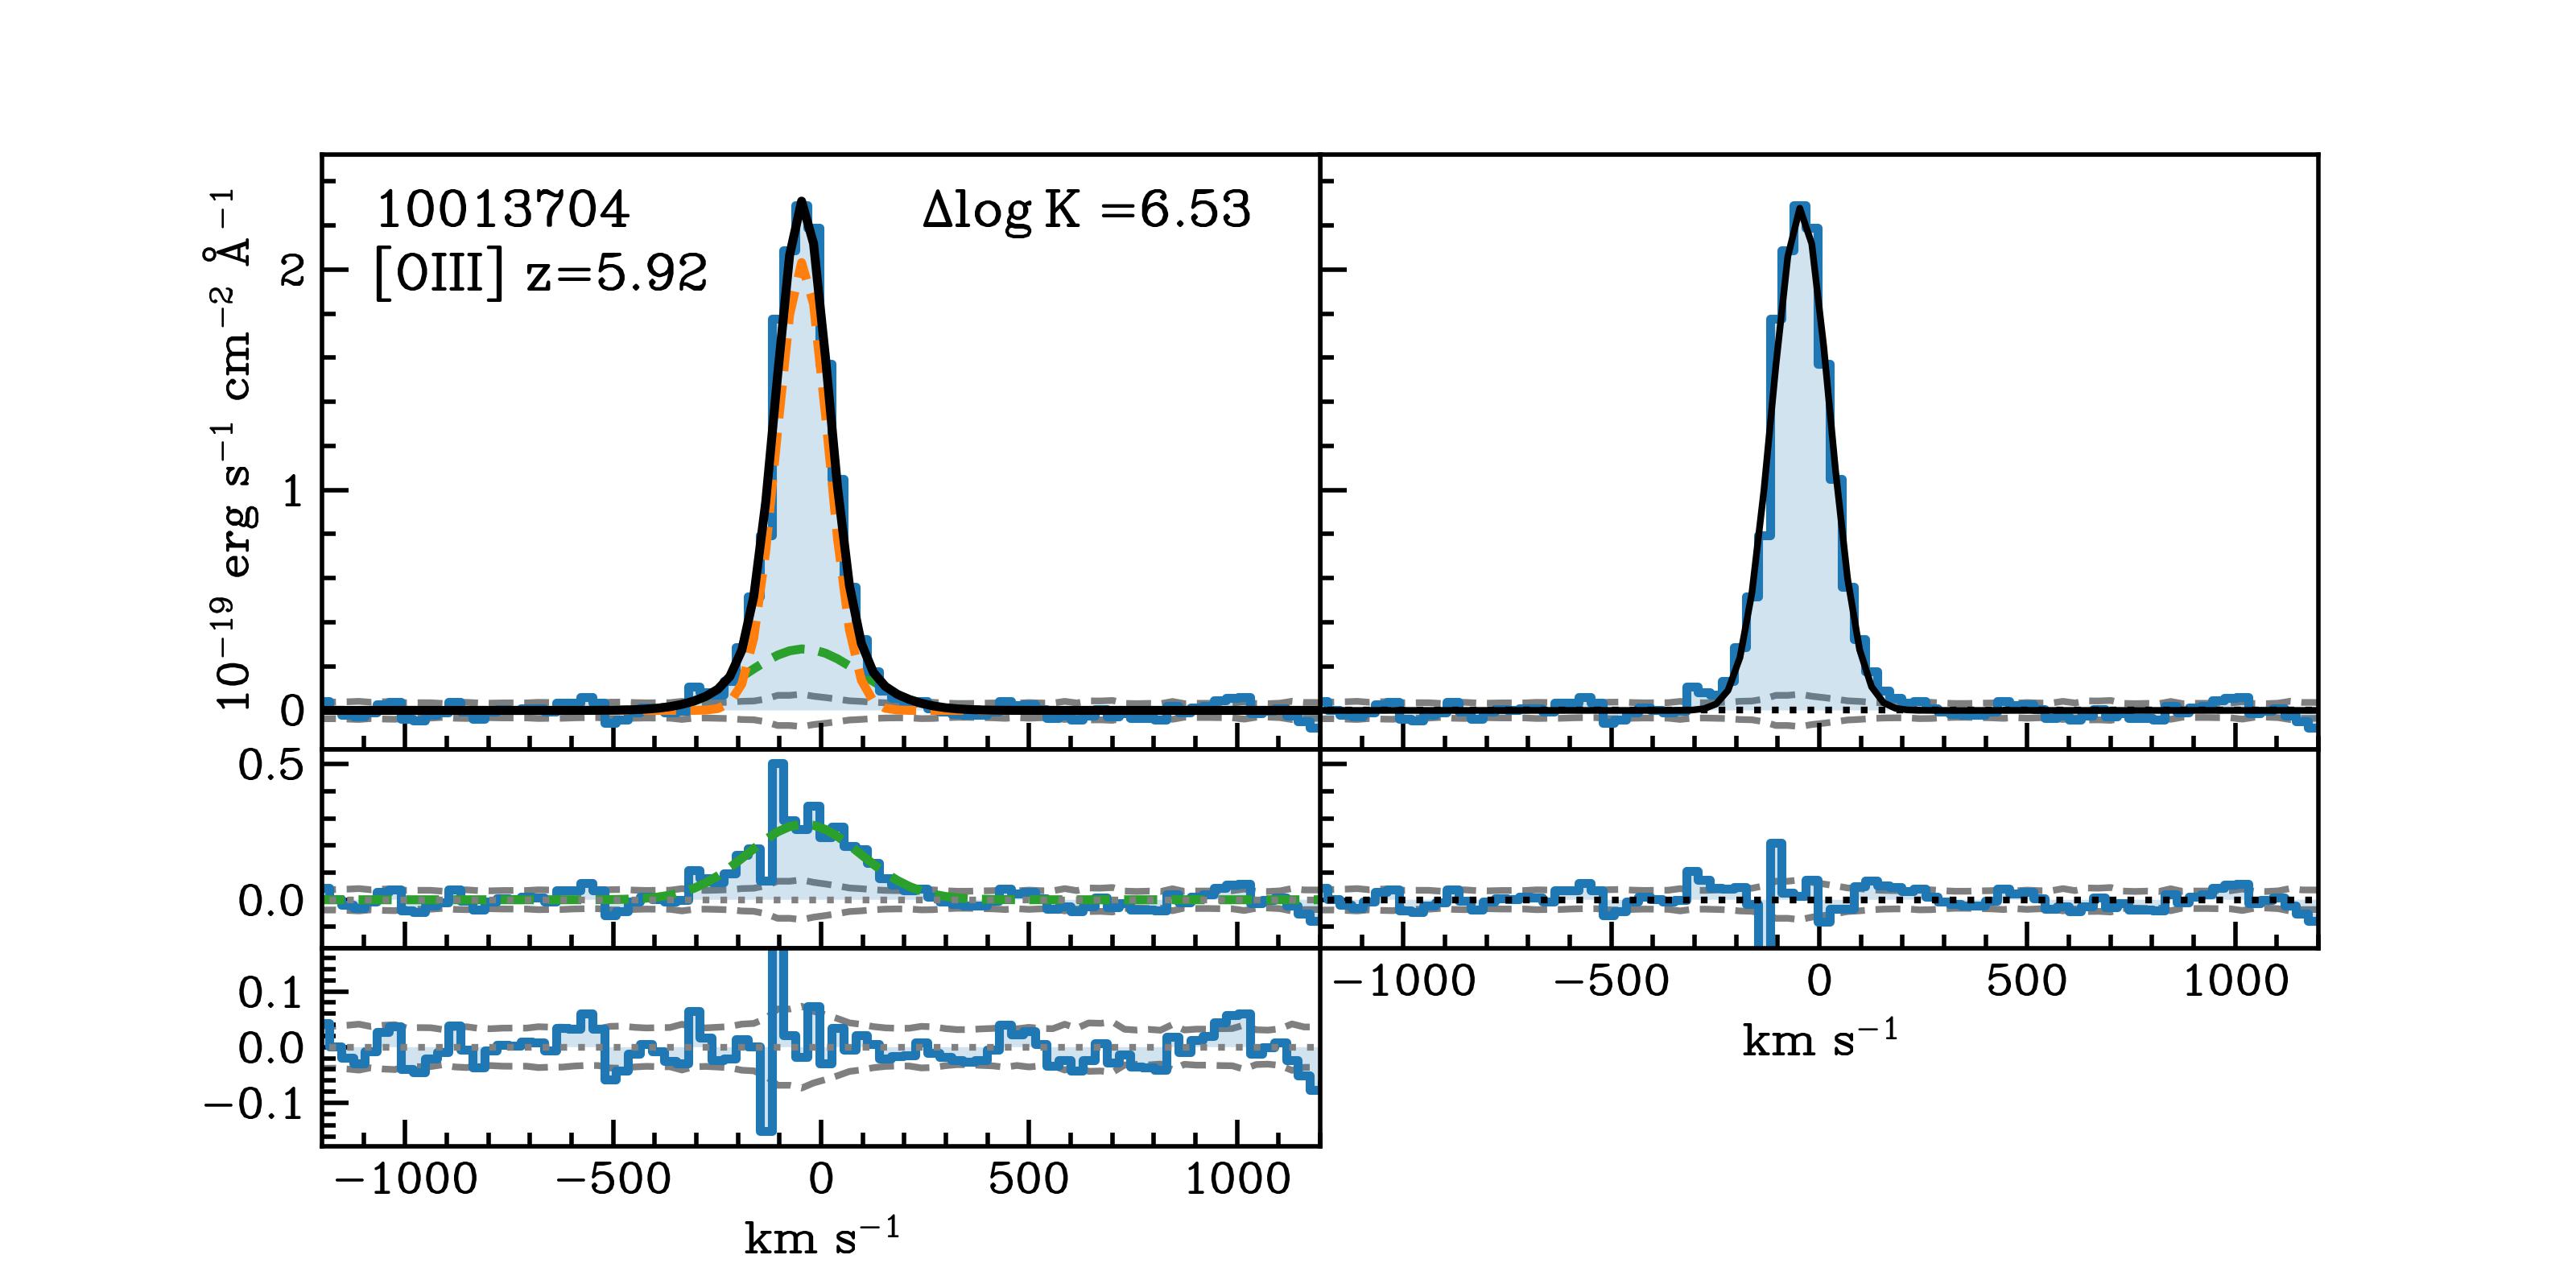
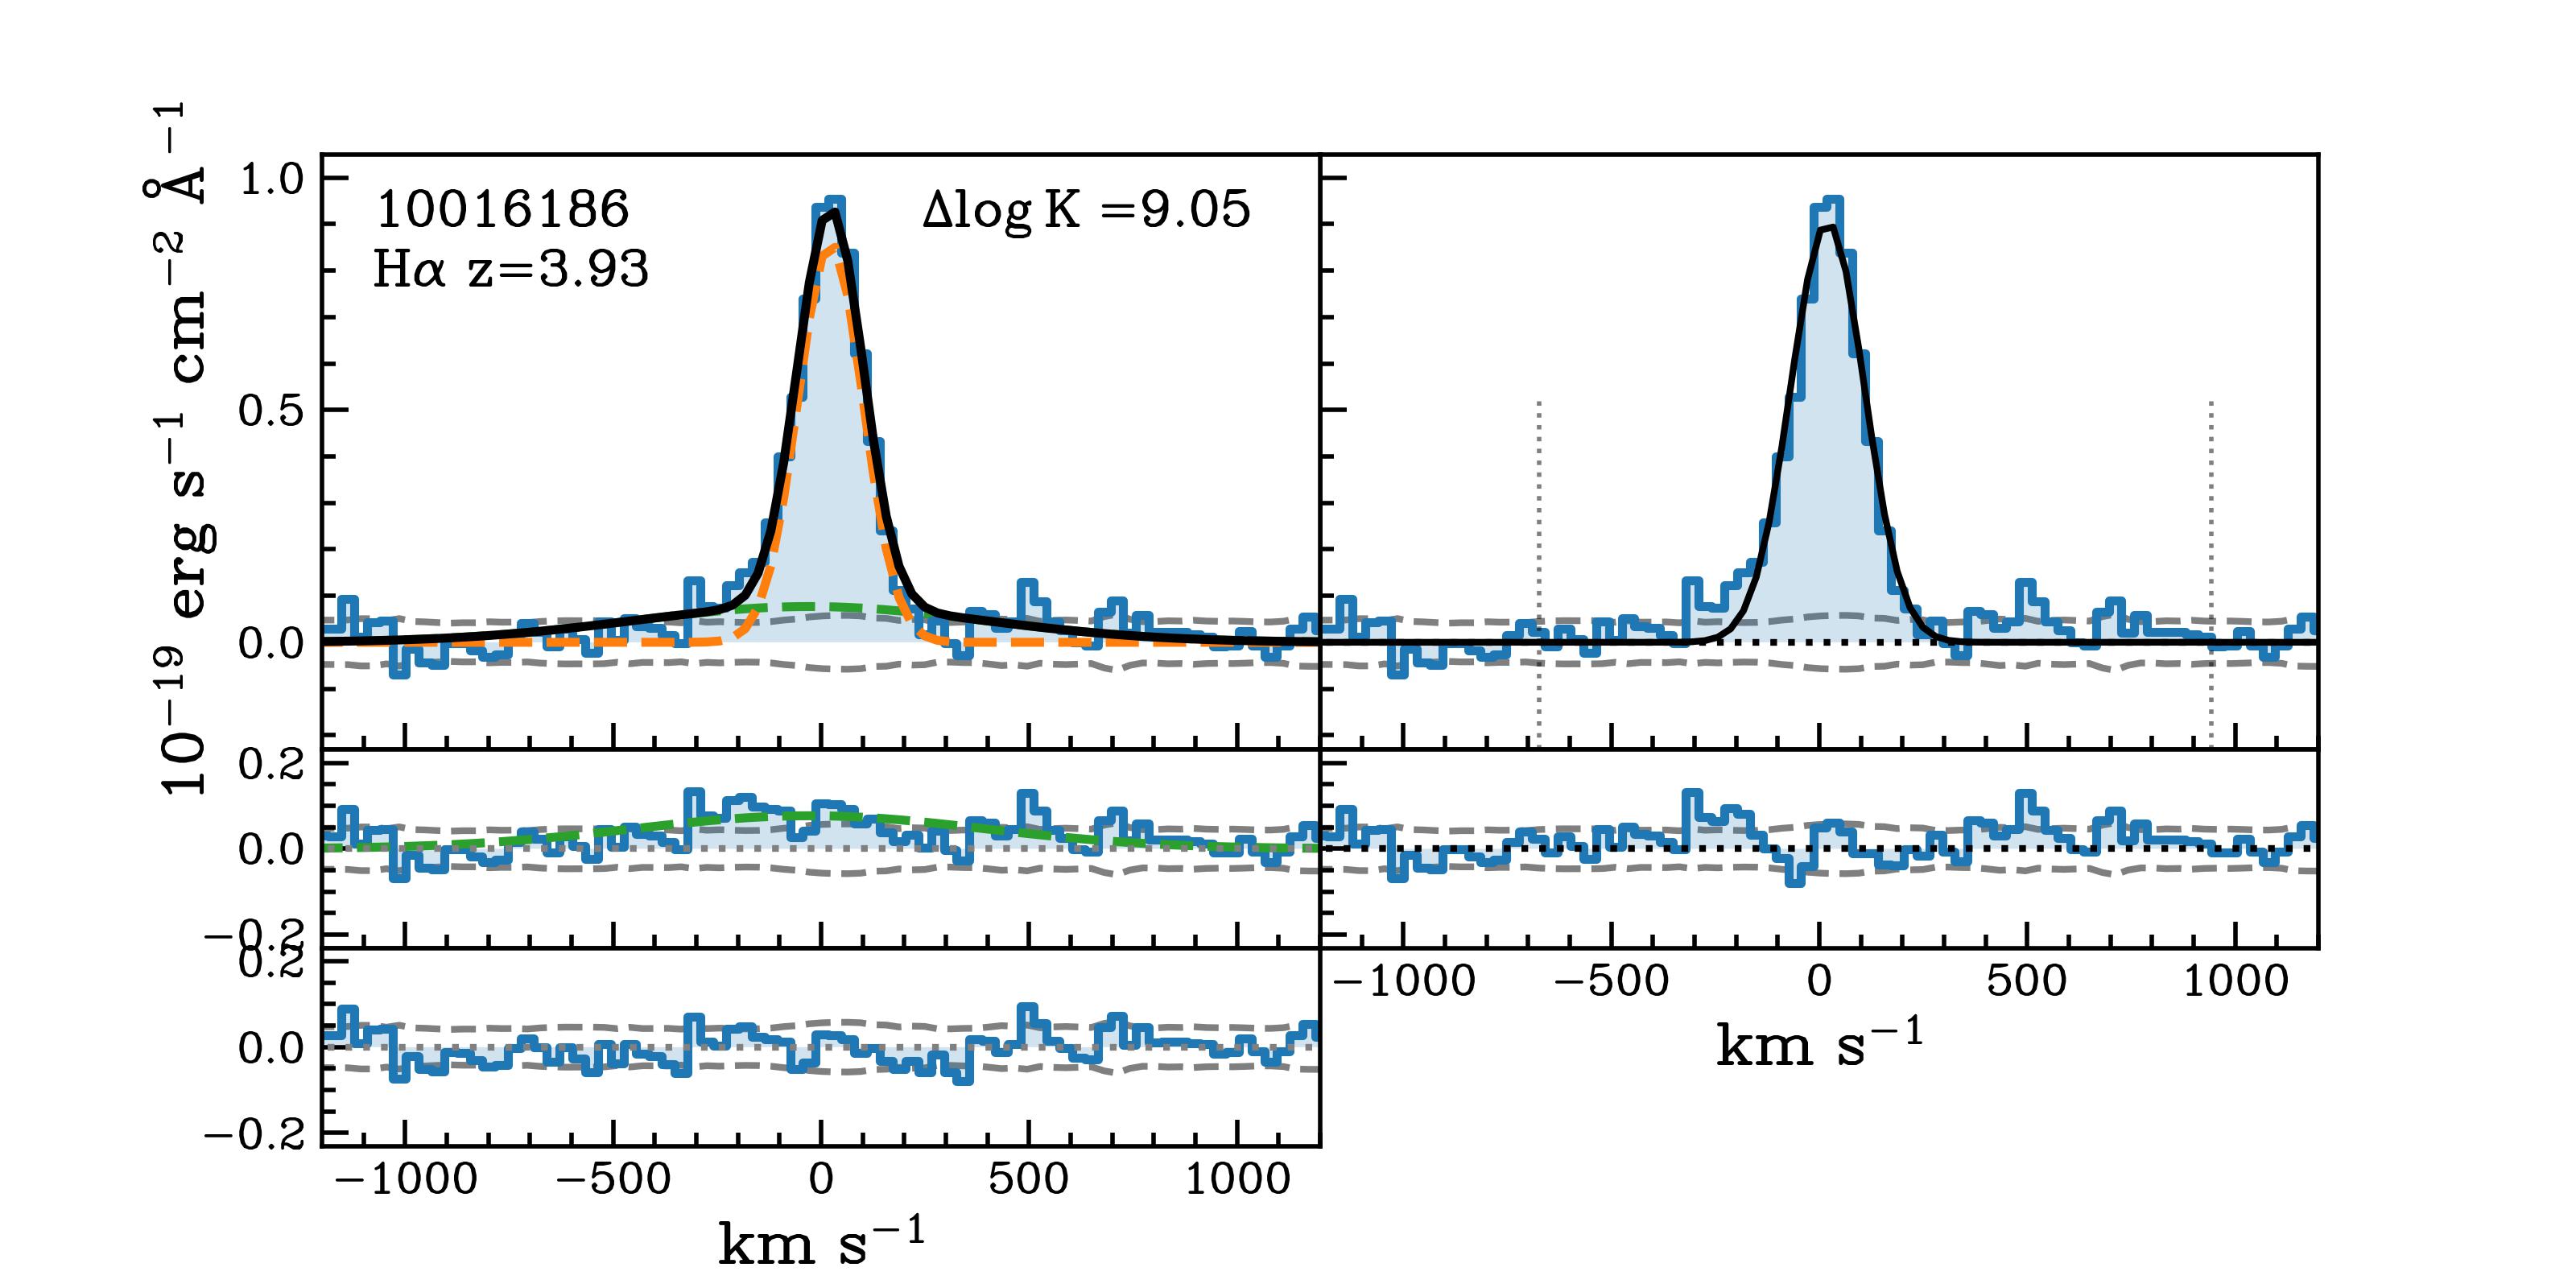
After we set the constraints of the priors for the single- and double-Gaussian components, we performed the fitting of the data for each galaxy and determined the best-fit results and Bayesian evidence for each model. In Figure 9, we present the spectral fitting of the targets showing evidence for an additional broad component based on the criteria defined in Sec. 4. For each galaxy, we report the best-fit results for both the two-Gaussian and the single-Gaussian model. We note that the widths of the broad component (Tables 1 and 2) are larger than the maximum broadening of 80 expected from rotation. We thus conclude that the additional broad component is not tracing the rotation motion in the galaxy but it maps the fast-emitting gas likely associated with outflows.
Appendix B Selection bias
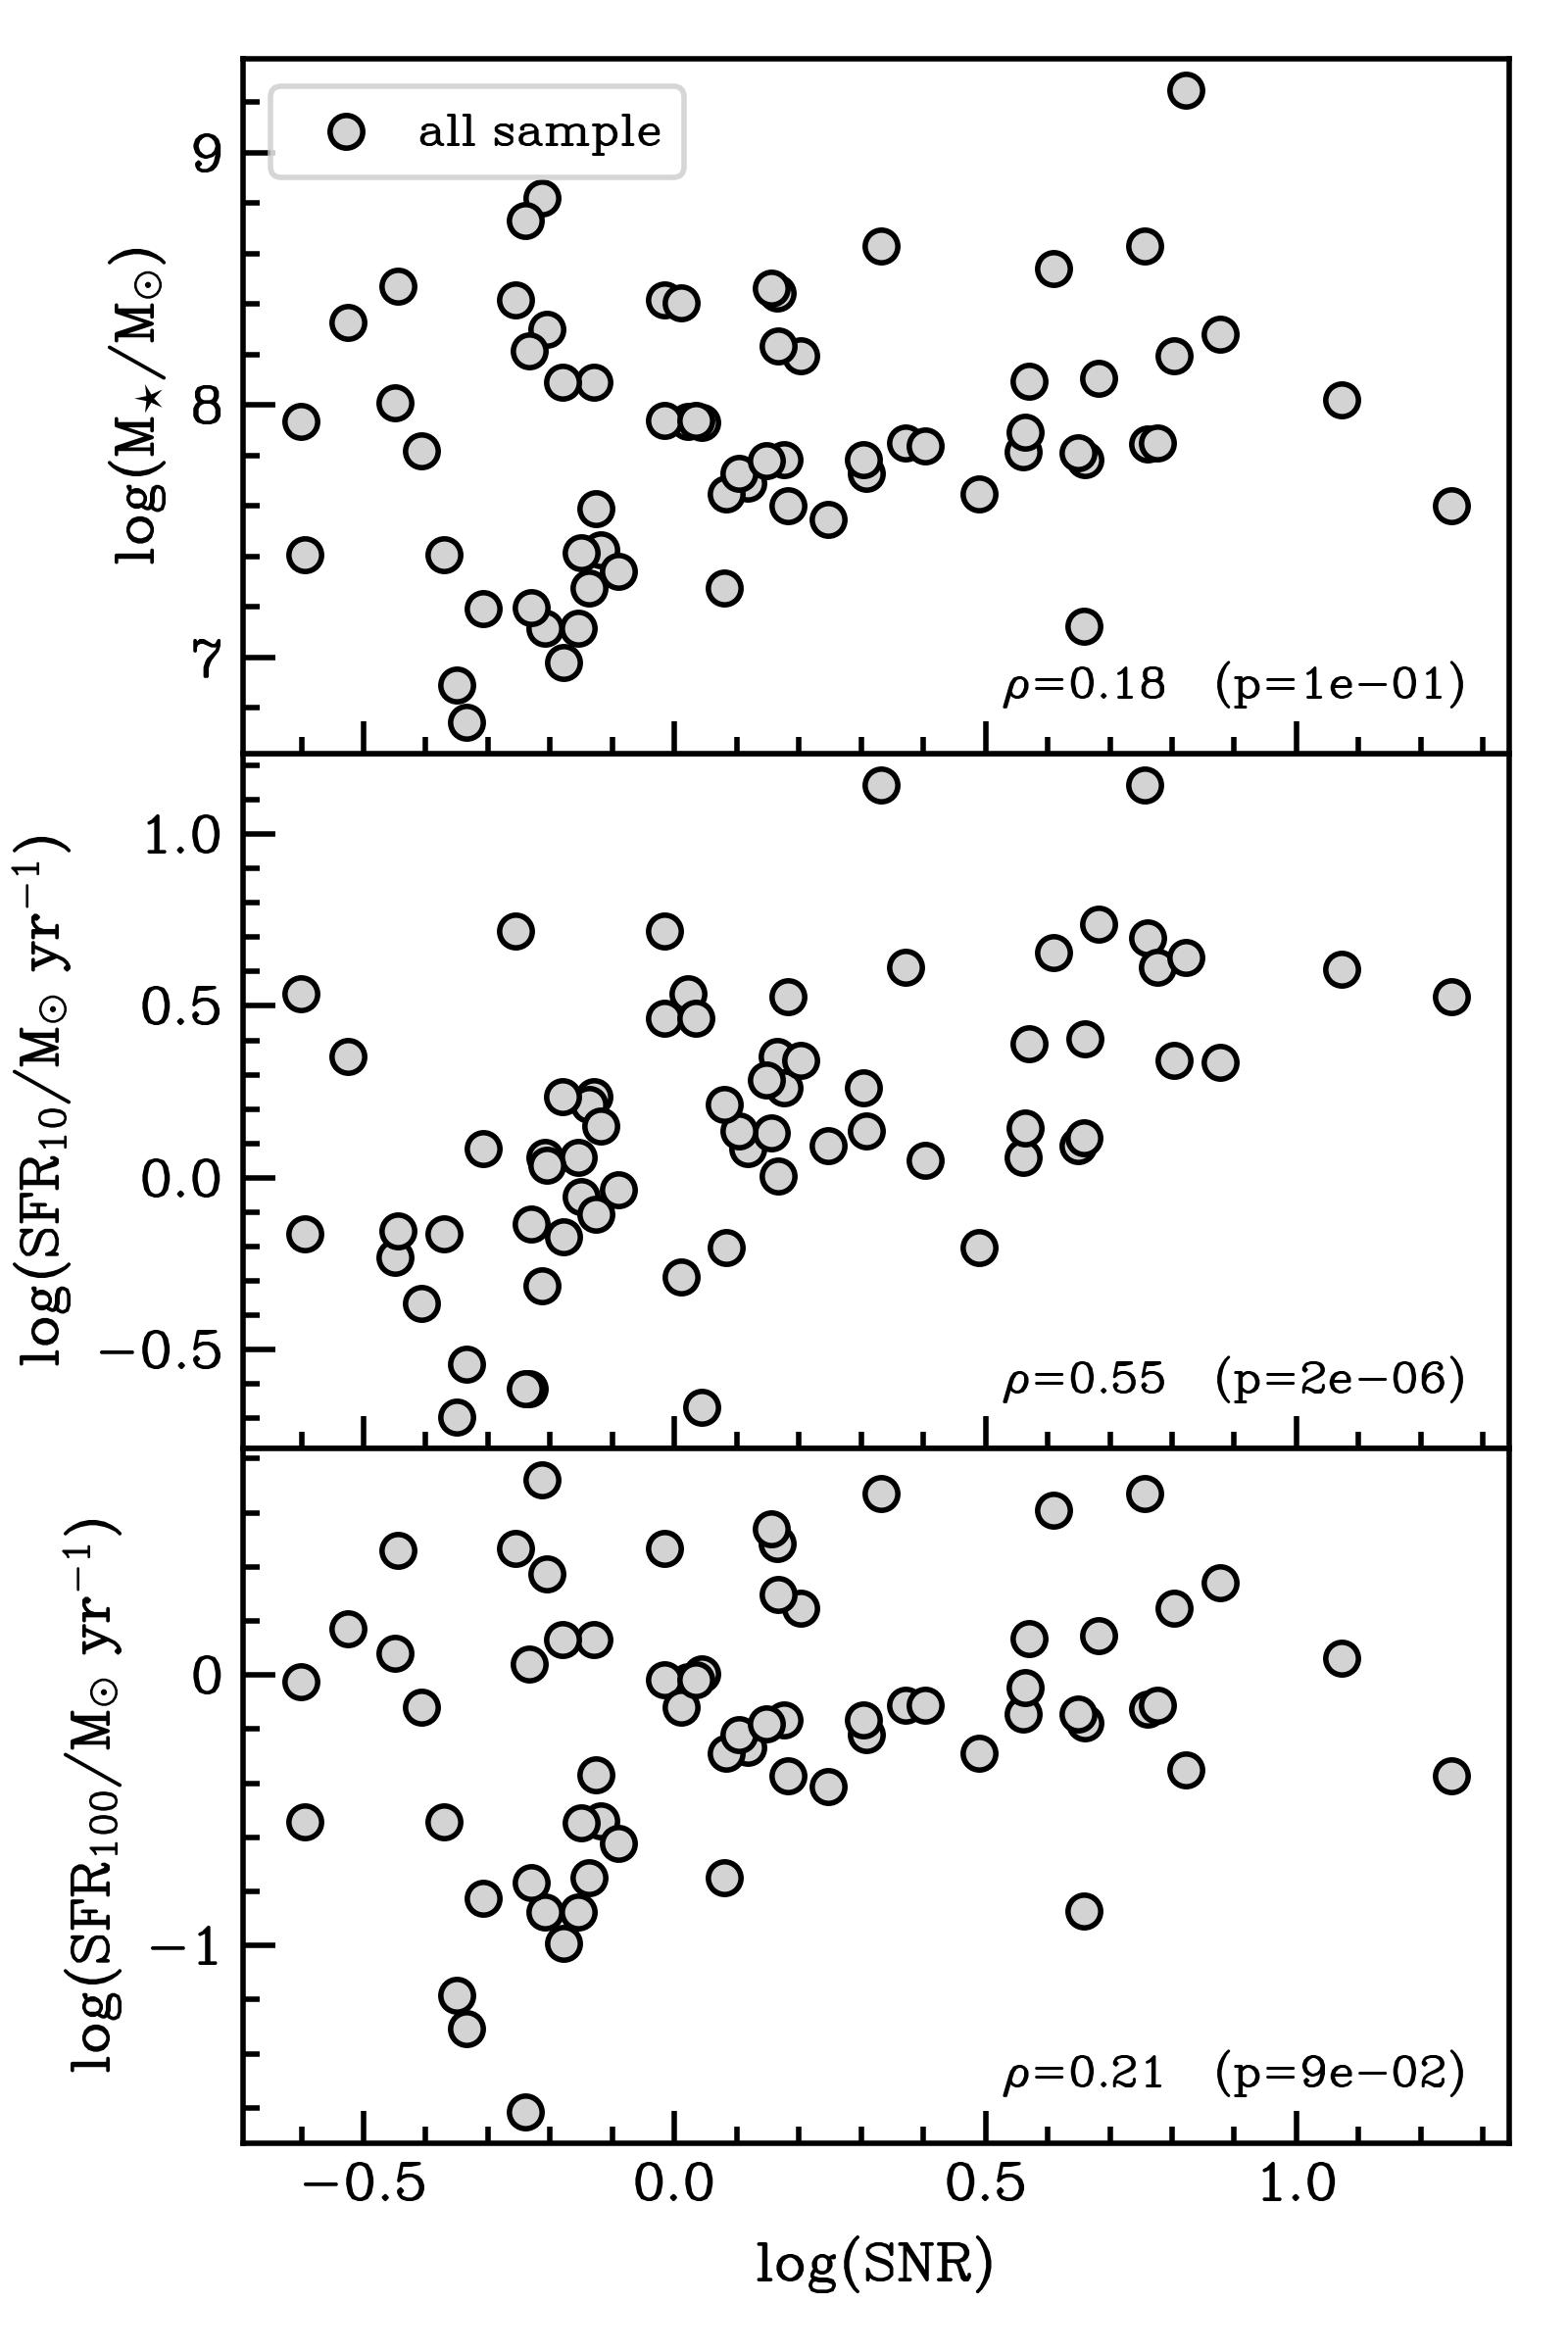
A correlation between the incidence rate of outflows and both stellar mass and SFR may arise from the fact that more massive and starburst galaxies have stronger emission lines which increase the chance of detecting a broad component. To test this, we analyzed whether the stellar mass and SFR estimates in our sample scale directly with the signal-to-noise ratio of the optical lines. Top and middle panels of Figure 10 show the distribution of stellar mass and SFR over the last 10 Myr, and report the non-parametric Spearman rank and p-value correlation parameter to test the hypothesis of correlation between the parameters. A value of the Spearman rank combined with a low p-value () indicates the presence of a statistically significant correlation between SFR and SNR. This suggests that the increase of outflow incidence with SFR is primarily driven by SNR. The bottom panel of Figure 10 reports the SFR averaged over the last 100 Myr (SFR100) as a function of the SNR. The estimated Spearman rank is much smaller than 0.5 (0.2), which indicates a weak correlation of SFR100 with the SNR of the nebular lines. The same applies to the galaxy mass. Based on these results, we conclude that the observed correlation between outflow incidence and both M⋆ and SFR100 trace a genuine dependence between these quantities, while the correlation with the instantaneous (over 10 Myr) SFR is partly an effect of the SNR ratio of the lines.
Appendix C Outflow properties
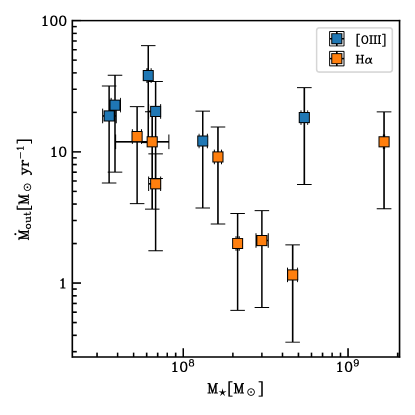
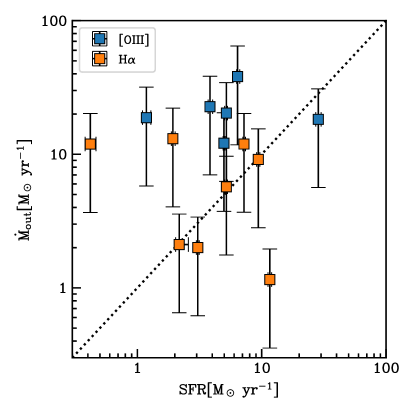
Figure 11 reports the mass outflow rate estimates as a function of stellar mass and star formation rate. We do not find any clear correlation between mass outflow rate and galaxy properties.