Mueller matrix based characterization of Cervical tissue sections: A quantitative comparison of Polar and Differential decomposition methods
Abstract
Detection of cervical intraepithelial Neoplasia (CIN) at the early stage enables prevention of cervical cancer, which is one of the leading cause of cancer deaths among women. Recently there is a great interest to use the optical polarimetry as a non-invasive diagnosis tool to characterize the cervical tissues. In this context, it is crucial to validate the performance of various Mueller matrix decomposition techniques, that are utilized to extract the intrinsic polarization properties of complex turbid media, such as biological tissues.
To quantitatively compare the performance of polar and differential MM decomposition methods for probing the polarization properties in various complex optical media. Also to utilize the derived individual polarization parameters through differential decomposition method as useful metrics to distinguish between the cervical tissue sections with different grades of CIN.
Complete polarization responses of the cervical tissue sections, and other media are recorded by preparing a home-built Mueller matrix imaging set up with a spatial resolution of . The Mueller matrices are then processed with the polar and differential decomposition methods to separate, and quantify the individual polarization parameters.
Pronounced differences in the extracted polarization properties are observed for different CIN grades with both the decomposition methods. While a significant increase in the depolarization parameter is observed with progression of CIN stages ( for CIN-I, and for CIN-II), a trend reversal is seen for the linear diattenuation parameter , where the magnitude of the decreases from to with the growth of CIN, in case of differential decomposition method.
Our results indicate that the differential decomposition of MM have certain advantages over the polar decomposition method to extract the intrinsic polarization properties of a complex tissue medium. The quantified polarization parameters obtained through the decomposition methods can be used as useful metrics to distinguish between the different grades of CIN, and to describe the healing efficiency of a self-healing organic crystal. Thus the Mueller matrix polarimetry shows great potential as an label-free, non-invasive diagnostic and imaging tool with potential applications in biomedical clinical research, and in various other disciplines.
I Introduction
Many of the natural objects with biological or non-biological origin possess some intrinsic polarization anisotropy such as birefringence, dichroism, and depolarization. Quantification of these polarization anisotropic parameters with desirable spatial resolution, can provide essential morphological structural, and functional information regarding a specimen, and hence quantitative polarimetry has emerged as an powerful tool for the characterization of a wide range of optical media in various disciplines[1, 2, 3, 4]. In the realm of quantitative polarimetry, polarization resolved Mueller matrix imaging is a widely adopted technique as it enables probing and quantifying complete polarization response of a sample in a single experimental embodiment[1, 2, 5, 6, 7]. Owing to the recent developments in the field of Mueller matrix polarimetry such as, increasing the measurement precision by optimising the calibration methods[1], adoption of snapshot techniques to extract the polarization information of dynamic objects[8], establishment of various Mueller matrix decomposition and analysis techniques to extract the polarization anisotropy parameters, and etc;[9] the MM imaging has gained a special place in biomedical and clinical applications.[1, 10]
However, carrying out quantitative polarimetry in optically thick turbid media like biological tissues is still a challenge[11, 12, 2]. Although such complex media possess intrinsic polarization anisotropy, the inevitable depolarization through multiple scattering and simultaneous exhibition of several polarization effects obstruct the quantification of these polarization parameters. Therefore, in recent years a number of Mueller matrix decomposition methods were proposed aiming to separately quantify the polarization anisotropy parameters in a lumped system [13, 1, 14, 15] . These extracted polarization parameters contain a wealth of information regarding the medium properties. The proposed techniques come with different assumptions, and hence one has to be judicious while choosing an appropriate decomposition techniques according to the targeted real-life applications.
Some of the recent studies have shown that among the various decomposition methods, the polar and differential matrix decomposition are the efficient techniques to extract the polarization parameters in a complex media, where alongside several polarization anisotropic effects, the medium possess significant depolarization effect. In polar decomposition, a given Mueller matrix is decomposed into sequential products of three basis matrices corresponding to the three general polarization effects (depolarization, diattenuation (linear and circular), retardance (linear and circular)). Yet owing to the non-comuting nature of the matrix multiplication, there is an ambiguity in the derived anisotropic parameters depending on the order of multiplication[7]. On the other hand differential matrix formalism is a more general kind of decomposition methods, which consider simultaneous exhibition of multiple polarization effects, hence is more appropriate for complex turbid media such as biological tissues. Several researchers have utilized the MM polarimetry for the early stage detection of the cervical cancer.[16, 17, 18]
In this work, we have used MM polarimetry to characterize cervical tissue sections with different grades of CIN. Detection of cervical intraepithelial Neoplasia (CIN) at the early stage enables prevention of cervical cancer, which is a leading cause of cancer death among women[19, 20]. Polarization resolved MM imaging of the cervical tissues are recorded, and processed with both polar and differential decomposition methods to extract the associated polarization properties. Individual polarization parameters are obtained by plotting the histogram of spatially quantified polarization images of cervical tissues, and its subsequent fitting with the Gaussian distribution. The obtained parameters are then used as useful metrics to distinguish between the different grades of CIN. Our results not-only enables realization of a non-invasive, label free polarimetric diagnostic tool for the early detection of cervical cancer, but also facilitates quantitative comparison of the performance of various MM decomposition methods in complex turbid media. In addition we have also presented the quantified polarization properties of a self-healing organic crystal to further validate the utilization of different MM decomposition techniques in complex optical media.
II Materials and Methods
II.1 Materials
Sections of thickness from the stromal region of the cervical tissues are used in this study. The cervical tissues are obtained from G.S.V.M. medical college, Kanpur and the sectioning of these cervical tissues are done by Dr. Asha agarwal.
II.2 Mueller matrix polarimetry set-up
We have utilized a custom-designed polarization microscopic arrangement, where one can determine the complete polarization response of a sample by recording the Mueller matrix [21, 22](Figure 1a). The experimental system employs broadband white light excitation and the subsequent recording of the polarization resolved images of the sample at any selected wavelengths between (). Alongside imaging, the spectral Mueller matrix of a given sample can also be recorded simultaneously with the Mueller matrix polarimetry system utilized in our experimental configuration. The thirty six projective polarization measurements required for the construction of Mueller matrix is recorded by sequentially generating and analyzing six different linear and circular polarization states[23, 24]. A collimated white light from the microscope’s (Olympus, IX-71) inbuilt illumination source (halogen lamp, JC 12V 100W) is passed through a polarization state generator unit which comprises of a rotatable (i) linear polarizer and (ii) achromatic quarter wave plate (QWP, Thorlabs AQWP05M-600 ). Polarization of the scattered light is subsequently analyzed by the polarization state analyzer unit that consists of a rotatable achromatic QWP and a linear polarizer. All the optical polarizing elements are mounted on computer controlled motorized rotational mounts (PRM1/M-Z7E, Thorlabs, USA) for precision control. For recording the spectral Mueller matrices of the WPCs, the scattered light is relayed to a spectrometer (HR 4000, Ocean Optics) for spectrally resolved signal detection (resolution ). The Mueller matrix images at selected wavelengths were recorded by using an EM CCD camera (Andor, IXON 3). The polarization resolved intensity images of the cervical tissue sections (dimension = ) are recorded using a band-pass filter . The imaging Mueller matrices are constructed using 36 polarization-resolved projective measurements (given in the table below)[23].
| HH+HV+VH+VV | HH+HVVHVV | PH+PVMHMV | RH+RVLHLV |
|---|---|---|---|
| HHHV+VHVV | HHHVVH+VV | PHPVMH+MV | RHRVLH+LV |
| HP+VPHMVM | HPVPHM+VM | PPPMMP+MM | RPRMLP+LM |
| HR+VRHLVL | HRVRHL+VL | PRPRMR+ML | RRRLLR+LL |
III Theory
Here we will briefly describe the theoretical treatment for the extraction of polarization anisotropy parameters using both polar and differential MM decomposition methods[7, 11, 13]. In the polar decomposition method, a given Mueller matrix is decomposed into sequential product of three basis matrices.
| (1) |
Where corresponds to the depolarization effect associated with the medium, and describe the retardance (linear and circular), and diattenuation (linear and circular) effects respectively. The magnitudes of the anisotropy parameters, diattenuation , retardance , and depolarization are calculated using the respective basis matrices.
On the other hand, in the differential matrix formalism, the anisotropic polarization and depolarization effects are stored simultaneously in various elements of a differential matrix [14, 15]. The differential matrix is related to the Mueller matrix and its spatial derivative along the direction of propagation of light as[25]:
| (2) |
The above equation assumes that the sample is laterally homogeneous and both polarization and depolarization effects are occurring simultaneously. In uniformly distributed polarization properties along the propagation direction the integration of differential matrix equation yields:
| (3) |
Here is the matrix logarithm of recorded Mueller matrix and represents the optical pathlength in the medium. The polarization properties of the underlying system can be constructed using the Lorentz symmetric and Lorentz antisymmetric components of logarithmic Mueller matrix as:
| (4) |
is the Minkowski metric tensor represented as . The corresponding anisotropic parameters can be calculated directly from the respective matrix elements of the matrix.
IV Results and Discussion
The cervix is composed of squamous epithelium, connective tissues, and other components. Collagen is a primary components of the cervical connective tissue, and cross linking between the individual collagen molecules lead to the formation of microfibril and collagen fibers. Anisotropic organization of these collagen fibers makes the cervix polarization anisotropy. Thus, through quantitative MM polarimetric imaging, essential morphological information regarding the cervical tissue sections can be captured. More importantly in case of most cancers, the structural organization of the collagen fibers gets distorted. Consequently it leads to the alteration of the polarization properties of the cervical tissue sections. This enables quantitative MM imaging to be a non-invasive diagnostic tool for pre cancer detection, where quantitative polarimetric analysis can distinguish between a healthy and defected cervical tissue section.
Here we have quantitatively analysed the polarization properties of an essential cervical pathologies, the cervical intraepithelial Neoplasia (CIN), which is of particular interest for the early detection of cervical cancer. Polarization MM imaging of cervical tissue sections with CIN grade one (CIN-I) and grade two (CIN-II) are recorded using the MM imaging set up (Fig. 1a). Polarization resolved images of both these tissue sections are captured with a spatial resolution of . Consequently the full MM is constructed from the projective polarization measurements as described in the table 1. The experimentally observed MM for both CIN-I (Fig. 1b) and CIN-II (Fig. 1c) tissue sections demonstrate simultaneous presence of multiple polarization effects such as linear diattenuation , linear retardance , and depolarization . This is evident from the non-zero magnitude of the respective MM elements. Besides the linear diattenuation descriptor elements , pronounced magnitude of the elements describing the linear birefringence properties are also observed. Significant depolarization of the incident polarized light is also observed, which is expected owing to the multiple scattering in the turbid tissue media.
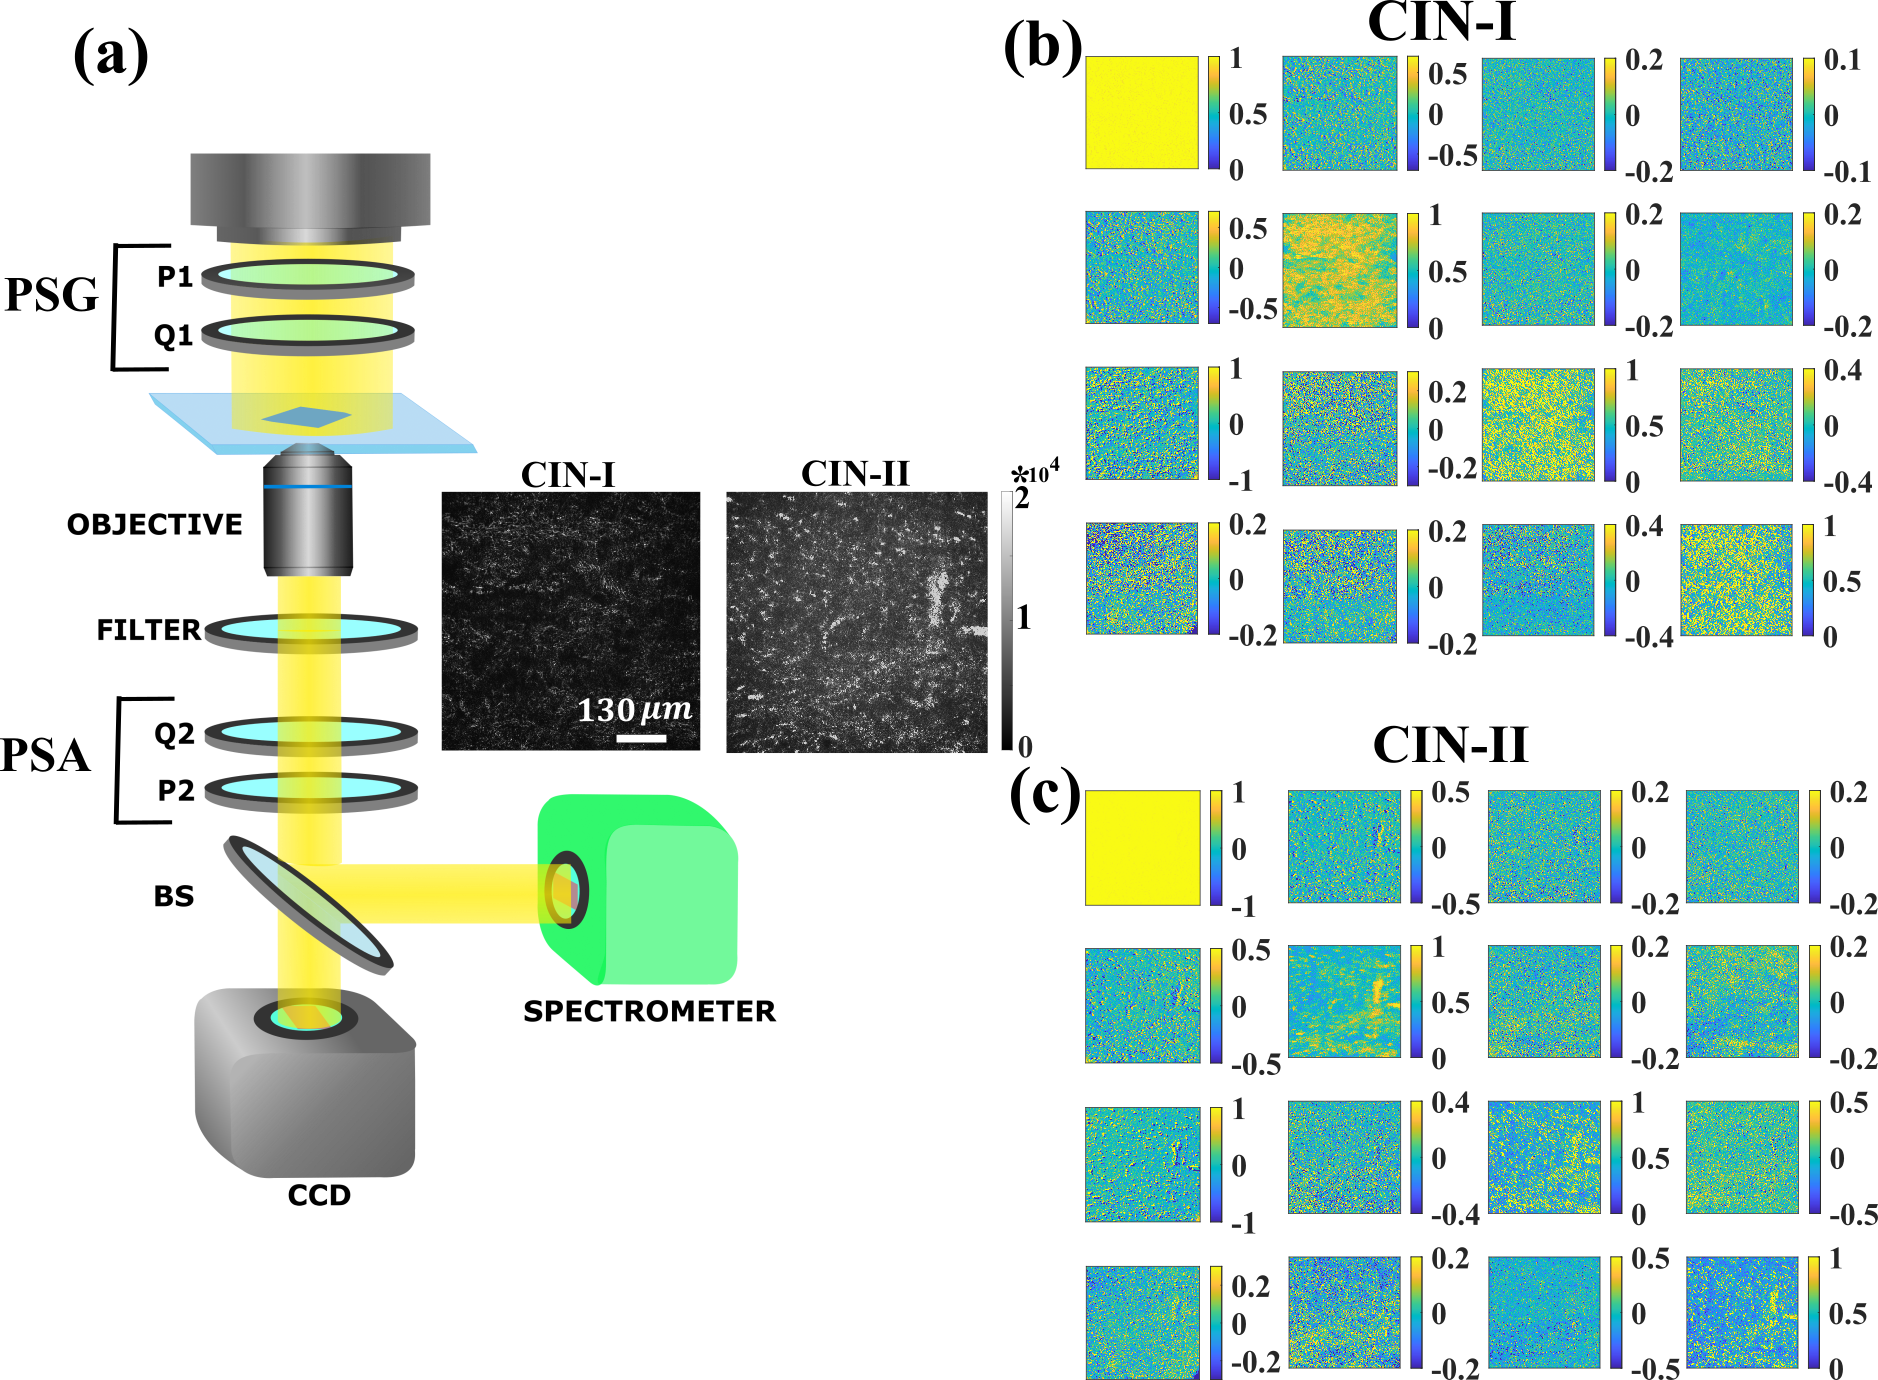 |
It is pertinent to note that although the intrinsic polarization properties of the cervical tissue sections are reflected in the respective MM elements, the obtained Mueller matrices (fig. 1b, 1c) does not possess a proper symmetry as generally observed for the conventional polarizing optical elements[24]. This deviation originates due to the presence of significant depolarization effect and simultaneous occurrence of multiple polarization effects, which are manifested in a complex inter-related way in the MM. Thus to extract and quantify the polarization properties, Processing of the observed MM with decomposition methods is indispensable. The derived polarization parameters then can be utilized as useful diagnostic metrics to distinguish between the different grades of CIN, This highlights the significance of MM decomposition technique to establish the quantitative MM polarimetry as a diagnostic tool. The associated decomposed matrices are discussed in the supplementary information.
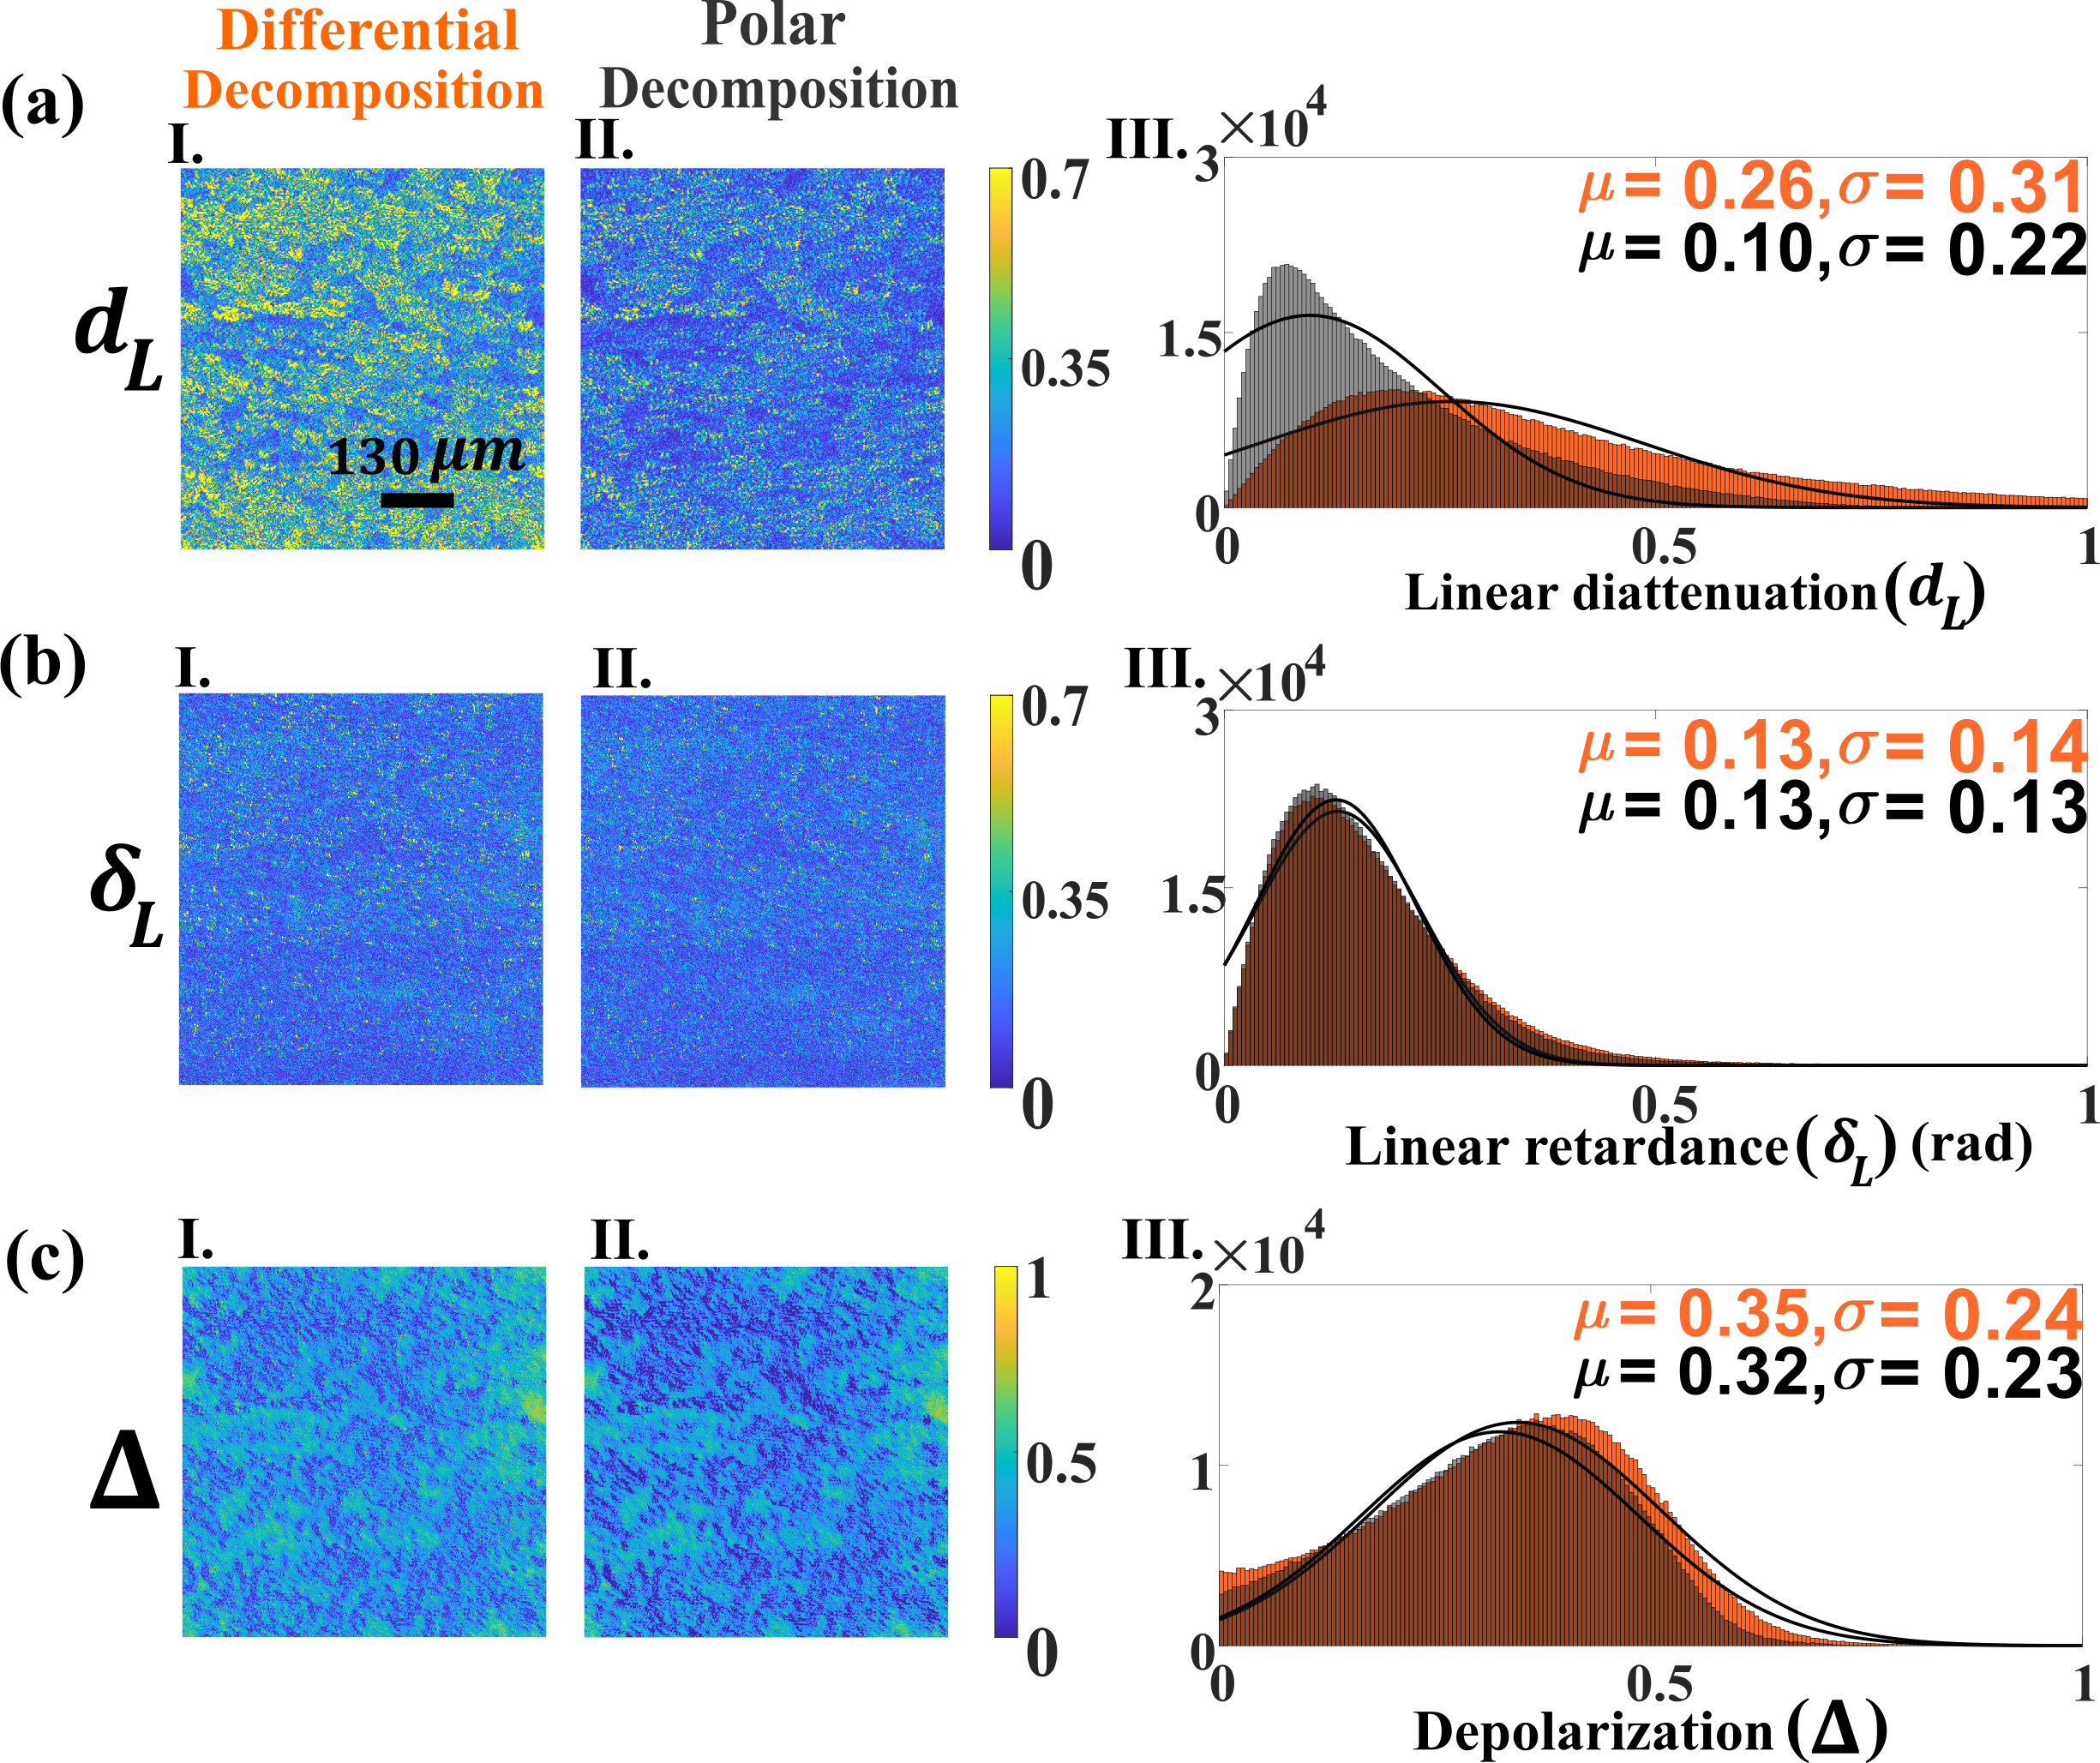
The experimental recorded Mueller matrices (Fig. 1b, 1c) are processed with both polar and differential decomposition methods to obtain the spatial distribution of the individual polarization parameters throughout the tissue sections. Utilizing the corresponding algorithms spatial various polarization anisotropic properties are derived, and the corresponding results are presented in Figure 2. All the obtained polarization parameters; linear diattenuation (Fig. 2a), linear retardance (Fig. 2b), and depolarization (Fig. 2c) show significant strength to be considered as potential metrics to describe the morphological properties of the cervical tissue sections. However, there is an spatial inhomogenity for all the extracted polarization parameters (Fig. 2a(I),(II), b(I)(II), c(I)(II)). Hence we go on to plot histograms for the respective polarization images, which enables a better quantitative presentation of the polarization properties. Histograms shown in Fig. 2a(III), 2b(III) and 2c(III) are plotted by taking the magnitude of the polarization parameters with no. of pixels attaining that particular magnitude. Furthermore, the histograms are fitted with the Gaussian distribution, and the statistical moments of the distributions (mean , standard deviation ) are calculated. These can serve as more precise and convenient metrics to distinguish between the different grades of CIN.Comparing the magnitude of the mean value obtained with polar and differential decomposition methods, a significant difference in the magnitude of the linear diattenuation parameter is clearly visible in the gaussian fit of the histogram (Fig. 2a(III)). Magnitude of the mean values of correspond to the differential and polar decomposition are found out to be 0.26 and 0.10 respectively. On the other hand, the phase anisotropy parameter (mean values: and ) and depolarization (mean values: and ) does not show much of the variation in the magnitudes for the polar and differential decomposition methods.
 |
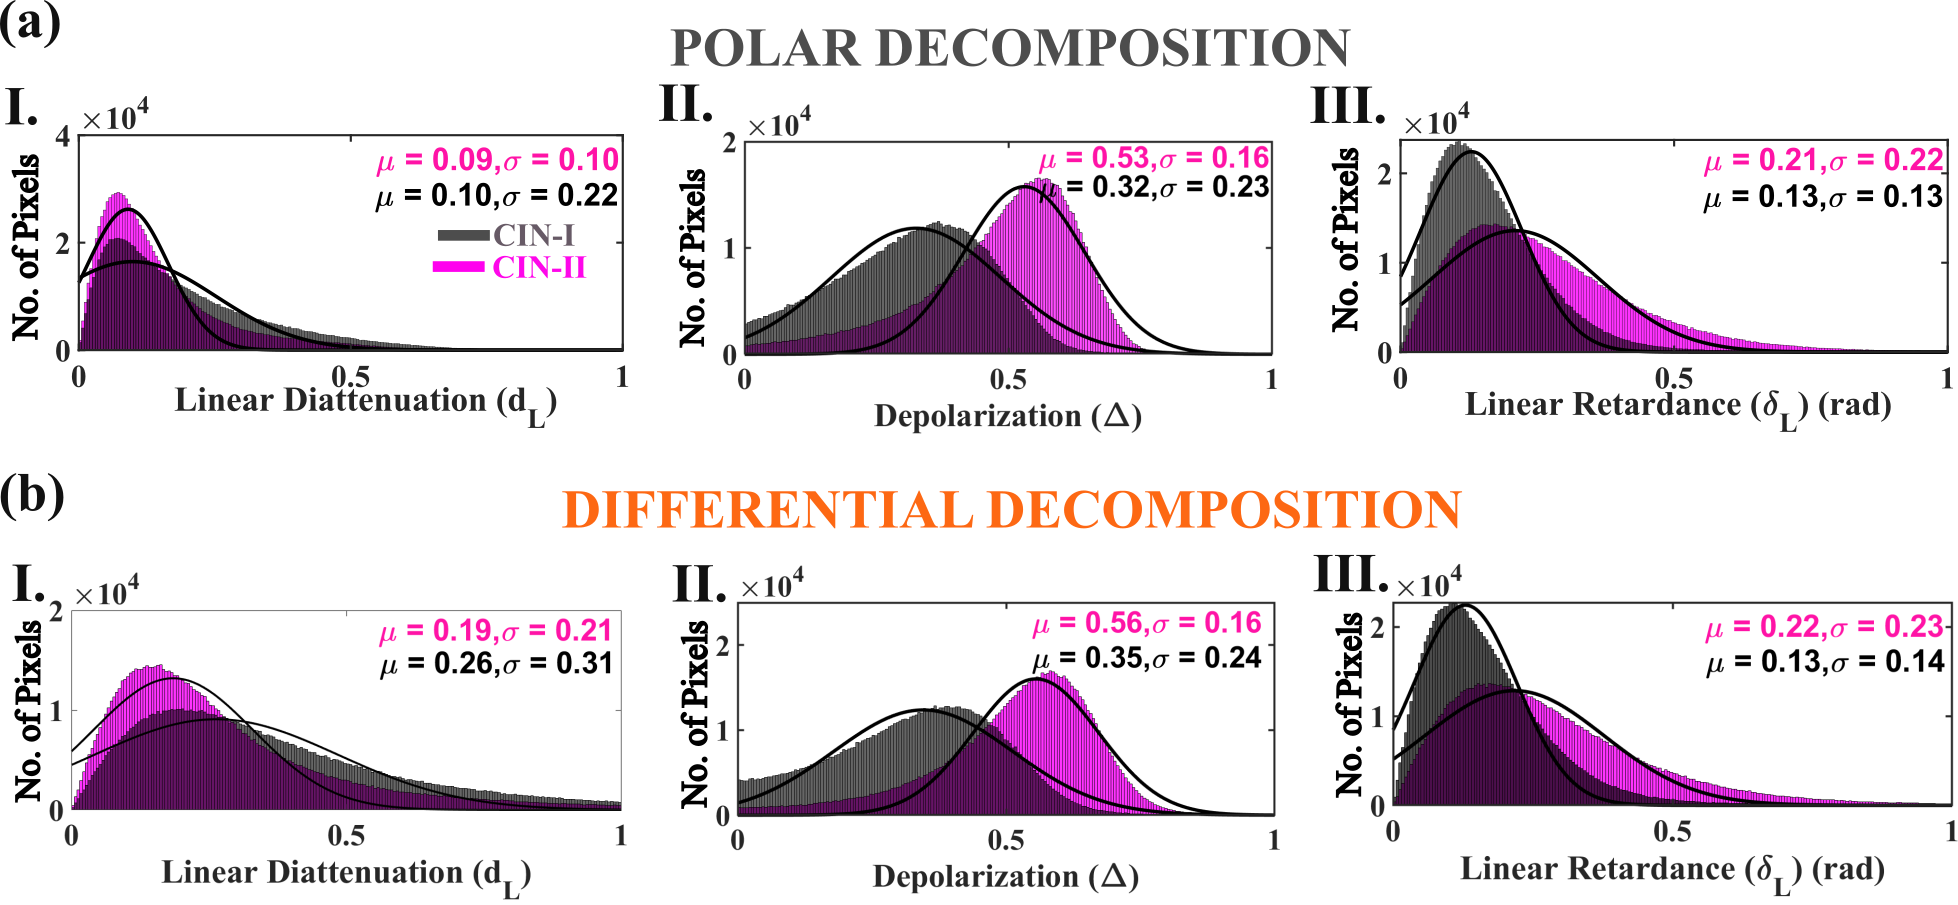
The mean values obtained from the Gaussian fitting of the histograms are used to distinguish between the cervical tissue sections with CIN grade one (CIN-I) and two (CIN-II). The results are presented for both polar (Fig. 3a) and differential decomposition method (Fig. 3b), so that besides demonstrating a polarimetric diagnosis tool, we can quantitatively compare the performance of the polar and differential decomposition of MM in case of the cervical tissue sections or in more general for optical interaction in complex turbid media. While the histograms with grey colour corresponds to the CIN-I cervical tissue sections, the magenta colour histograms describe the polarization properties of CIN-II cervical tissue sections. With polar decomposition method, the mean value of the linear diattenuation parameter obtained for both CIN-I and CIN-II are nearly equal (Fig. 3a (I)). However, a pronounced difference in the depolarization (Fig. 3a (II))and linear retaradance (Fig. 3a (III)) parameters between the CIN-I and CIN-II is observed. The mean value of the significantly increases for CIN-II as compared to the CIN-I indicating the change in the morphology of the cervical tissue sections. The disruption or randomization of the collagen fibers can lead to the rise of depolarization effect in the cervical tissue. The mean value of the also exhibit dissimilarities, where the CIN-II has a relatively higher magnitudes with respect to the CIN-I tissue. Now coming to the MM processing with differential decomposition method, unlike to the case of polar decomposition, there is a pronounced change in the linear diattenuation parameter between the CIN-I and CIN-II tissues (Fig. 3b (I)). The obtained mean value of decreases with the progress of CIN stages, and the obtained mean values for CIN-I and CIN-II are , and respectively. This describes the degradation of the structural orientation of the anisotropic collagen fibers. The results obtained for depolarization also validates this, where a significant growth in the depolarization magnitude is observed in the CIN-II as compared to the CIN-I tissue sections (Fig. 3b (II)). A deviation in the trend is also observed for the case of linear retardance , (Fig. 3b (III)) which is consistent with the results obtained with the polar decomposition method. Altogether, these exclusively demonstrates that, the quantitative MM imaging with incorporation of appropriate decomposition techniques can serve as an efficient label free diagnostic tool for early detection of cervical cancer. We also want to note that the other parameters of the Gaussian distributions such as skewness, kurtosis can also be used as useful metrics to distinguish between the cervical tissues with different grades of CIN.[26]
 |
Looking at the results demonstrated above, it is evident that the differential decomposition of MM have certain advantages over the polar decomposition method to extract relevant information regarding the polarization properties of a complex tissue medium. To further compare the performance of both these decomposition techniques, we now consider an anisotropic organic crystal and discuss it’s polarization properties.
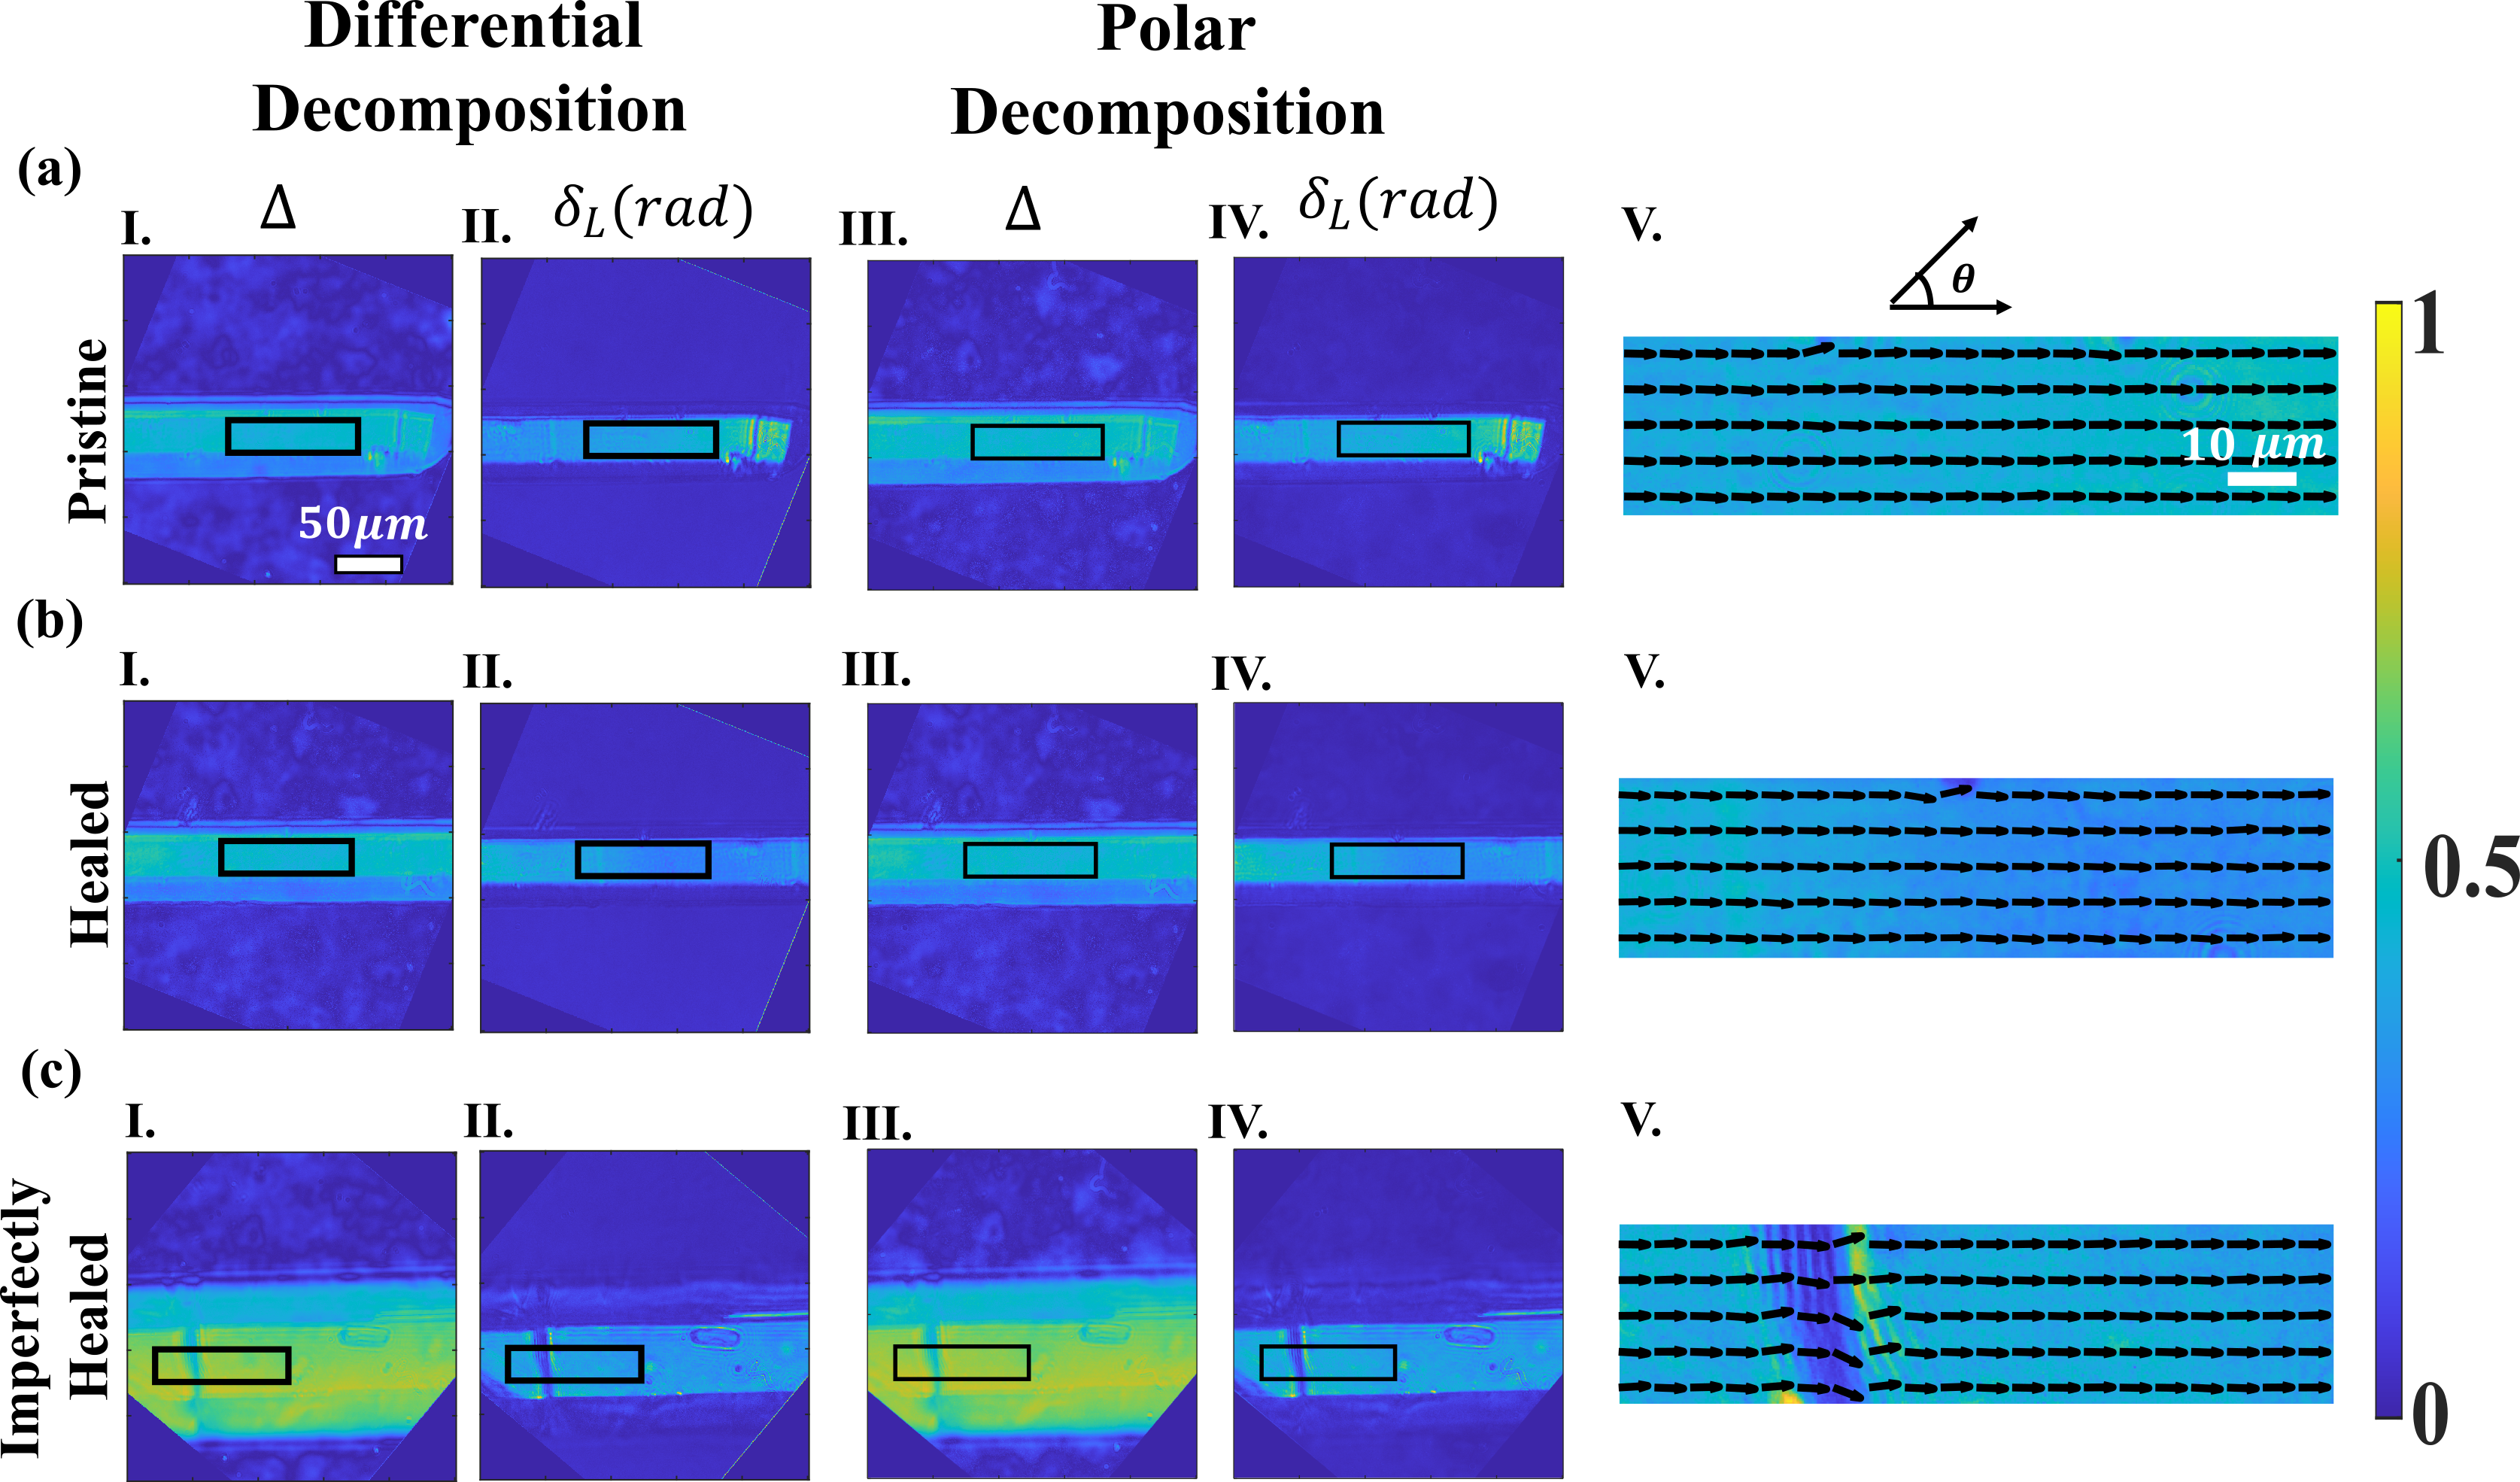
In our recent work, we have utilized MM polarimetry to probe the healing efficiency of a self-healing bipyrazole piezoelectric crystal. Such extraordinary crystals heal themselves anonymously when subjected to the mechanical fracture through a three-point bending test. Highly ordered crystalline structure of crystals make them a polarization rich entity which shows the strong anisotropic effects. We are examining the different stages of crystals in a similar way as it was shown for the cervical tissues. Three different crystal stages; pristine, neatly healed and imperfectly healed are taken for carrying out the MM imaging, and subsequent quantification of the polarization parameters (, and ) through both polar and differential decomposition methods. In all the scenarios, the magnitude of linear diattenuation is found to be very low, showing a very little presence of amplitude anisotropy due to lack of the imaginary part of the refractive index. Hence the other two polarization parameters (linear retardance , and depolarization ) are considered for the comparative study of the crystals in different stages. The corresponding results are shown in figure 4. A region of dimension (shown with a rectangle in images of the Figure 4) is selected in each crystal through the microscope eyepiece and verified by calculating the higher correlation values for the specific dimensions between the pristine and healed crystals. Linear retardance mean values with their standard deviation for the pristine and neatly healed crystal were and respectively resulting in the retrieval of the phase anisotropy of the crystal in healing process (Fig. 4a(II),(IV), 4b(II)(IV)). Depolarization shows the comparable values for the pristine and healed (Fig. 4a(I)(III), 4b(I)(III)) . In case of the imperfectly healed, crack junction is clearly observed in the crystal (Fig. 4c), in left and right part of the crystal is remain intact with respect to the pristine while depolarization magnitude has increased. While being under mechanical fractures, the order of the crystalline structure gets scrambled leading to the decrease in anisotropic parameters and store their order as the crystal heals itself. Orientation angle of linear retarder axis provide a better understanding for the efficient repairing of the fractured crystal (Fig. 4a(V), 4b(V), 4c(V)). While the long-range crystalline order remains intact for both pristine (Fig. 4a(V)) and the healed crystal (Fig. 4b(V)), a clear disorder in the orientation of the retarder axis is observed for the imperfectly healed crystal (Fig. 4c(V)). Important thing to note here is that, both the polar and differential decomposition of the MM gives rise to the near-equal magnitude of the extracted polarization parameters which was not the case for the cervical tissue sections. A table containing all the mean and standard deviation values of the respective polarization parameters is given in the supplementary information.
 |
V Conclusion
In summary, we have demonstrated that the differential decomposition of MM have certain advantages over the polar decomposition method to extract the intrinsic polarization properties of a complex turbid media. For this purpose, cervical tissue sections with different grades of CIN are considered, which alongside significant depolarization, exhibits multiple polarization effect simultaneously. The polarization properties of these cervical tissue sections are quantified through the incorporation of both polar and differential MM decomposition methods. We have shown that, the individual derived polarization parameters through differential decomposition can be treated as useful metrics to distinguish between different stages of CIN, which enables realization of a non-invasive, label-free diagnosis tool for early detection of the cervical cancer. In addition we have also investigated the performance of both polar and differential decomposition MM methods to quantify the healing efficiency of a self-healing organic crystal. This highlights the ability of MM polarimetry with an appropriate decomposition technique to be an efficient diagnosis and imaging tool with potential applications in various disciplines.
Disclosures
The authors declare no conflict of interests.
Code, Data, and Materials Availability
The data, utilized algorithms for the decomposition of Mueller matrix supporting the results that have been reported in this study are available from the corresponding authors upon reasonable request.
Acknowledgments
Jeeban Kumar Nayak and Nirmalya Ghosh acknowledge the support of the Indian Institute of Science Education and Research (IISER) Kolkata, an autonomous institute under the Ministry of Human Resource Development (MHRD), Government of India. Nishkarsh Kumar and Asima Pradhan acknowledge the support from Indian Institue of Technology (IIT) Kanpur. The authors acknowledge Dr. Kiran Pandey from GSVM medical college for providing the cervical tissues and Dr. Asha Agarwal for the histopathology sectioning. We acknowledge Dr. Chilla Malla Reddy and Dr. Surojit Bhunia for providing the self-healing crystals.
References
- He et al. [2021] C. He, H. He, J. Chang, B. Chen, H. Ma, and M. J. Booth, Polarisation optics for biomedical and clinical applications: a review, Light: Science & Applications 10, 194 (2021).
- Ramella-Roman et al. [2020] J. C. Ramella-Roman, I. Saytashev, and M. Piccini, A review of polarization-based imaging technologies for clinical and preclinical applications, Journal of Optics 22, 123001 (2020).
- Li et al. [2022] X. Li, Y. Han, H. Wang, T. Liu, S.-C. Chen, and H. Hu, Polarimetric imaging through scattering media: A review, Frontiers in Physics , 153 (2022).
- Gil and Ossikovski [2022] J. J. Gil and R. Ossikovski, Polarized light and the Mueller matrix approach (CRC press, 2022).
- KU et al. [2019] S. KU, K. Mahato, and N. Mazumder, Polarization-resolved stokes-mueller imaging: a review of technology and applications, Lasers in medical science 34, 1283 (2019).
- Le et al. [2022] H.-M. Le, T. H. Le, Q. H. Phan, et al., Mueller matrix imaging polarimetry technique for dengue fever detection, Optics Communications 502, 127420 (2022).
- Pezzaniti and Chipman [1995] J. L. Pezzaniti and R. A. Chipman, Mueller matrix imaging polarimetry, Optical engineering 34, 1558 (1995).
- Hagen et al. [2007] N. Hagen, K. Oka, and E. L. Dereniak, Snapshot mueller matrix spectropolarimeter, Optics letters 32, 2100 (2007).
- Lu and Chipman [1996] S.-Y. Lu and R. A. Chipman, Interpretation of mueller matrices based on polar decomposition, JOSA A 13, 1106 (1996).
- Singh et al. [2022] M. D. Singh, N. Ghosh, and I. A. Vitkin, Mueller matrix polarimetry in biomedicine: Enabling technology, biomedical applications, and future prospects, in Polarized Light in Biomedical Imaging and Sensing: Clinical and Preclinical Applications (Springer, 2022) pp. 61–103.
- Ghosh and Vitkin [2011] N. Ghosh and I. A. Vitkin, Tissue polarimetry: concepts, challenges, applications, and outlook, Journal of biomedical optics 16, 110801 (2011).
- Novikova et al. [2016] T. Novikova, I. Meglinski, J. C. Ramella-Roman, and V. V. Tuchin, Special section guest editorial: polarized light for biomedical applications, Journal of biomedical optics 21 (2016).
- Kumar et al. [2012] S. Kumar, H. Purwar, R. Ossikovski, I. A. Vitkin, and N. Ghosh, Comparative study of differential matrix and extended polar decomposition formalisms for polarimetric characterization of complex tissue-like turbid media, Journal of biomedical optics 17, 105006 (2012).
- Ortega-Quijano and Arce-Diego [2011] N. Ortega-Quijano and J. L. Arce-Diego, Mueller matrix differential decomposition, Optics letters 36, 1942 (2011).
- Ossikovski [2011] R. Ossikovski, Differential matrix formalism for depolarizing anisotropic media, Optics letters 36, 2330 (2011).
- Shukla and Pradhan [2009] P. Shukla and A. Pradhan, Mueller decomposition images for cervical tissue: Potential for discriminating normal and dysplastic states, Optics express 17, 1600 (2009).
- Zaffar and Pradhan [2020a] M. Zaffar and A. Pradhan, Mapping of retardance, diattenuation and polarizance vector on poincare sphere for diagnosis and classification of cervical precancer, Journal of Biophotonics 13, e201960139 (2020a).
- Zaffar and Pradhan [2020b] M. Zaffar and A. Pradhan, Assessment of anisotropy of collagen structures through spatial frequencies of mueller matrix images for cervical pre-cancer detection, Applied Optics 59, 1237 (2020b).
- Khan et al. [2023] S. Khan, M. Qadir, A. Khalid, S. Ashraf, and I. Ahmad, Characterization of cervical tissue using mueller matrix polarimetry, Lasers in Medical Science 38, 46 (2023).
- Sung et al. [2021] H. Sung, J. Ferlay, R. L. Siegel, M. Laversanne, I. Soerjomataram, A. Jemal, and F. Bray, Global cancer statistics 2020: Globocan estimates of incidence and mortality worldwide for 36 cancers in 185 countries, CA: a cancer journal for clinicians 71, 209 (2021).
- Bhunia et al. [2021] S. Bhunia, S. Chandel, S. K. Karan, S. Dey, A. Tiwari, S. Das, N. Kumar, R. Chowdhury, S. Mondal, I. Ghosh, et al., Autonomous self-repair in piezoelectric molecular crystals, Science 373, 321 (2021).
- Ray et al. [2017] S. K. Ray, S. Chandel, A. K. Singh, A. Kumar, A. Mandal, S. Misra, P. Mitra, and N. Ghosh, Polarization-tailored fano interference in plasmonic crystals: a mueller matrix model of anisotropic fano resonance, ACS nano 11, 1641 (2017).
- Baba et al. [2002] J. S. Baba, J.-R. Chung, A. H. DeLaughter, B. D. Cameron, and G. L. Cote, Development and calibration of an automated mueller matrix polarization imaging system, Journal of Biomedical Optics 7, 341 (2002).
- Gupta et al. [2015] S. D. Gupta, N. Ghosh, and A. Banerjee, Wave optics: Basic concepts and contemporary trends (CRC Press, 2015).
- Jones [1948] R. C. Jones, A new calculus for the treatment of optical systems. vii. properties of the n-matrices, Josa 38, 671 (1948).
- Zaffar and Pradhan [2020c] M. Zaffar and A. Pradhan, Spatial autocorrelation analysis on two-dimensional images of mueller matrix for diagnosis and differentiation of cervical precancer, Journal of Biophotonics 13, e202000006 (2020c).