Learning-based sound speed reconstruction and aberration correction in linear-array photoacoustic/ultrasound imaging
Abstract
Photoacoustic (PA) image reconstruction involves acoustic inversion that necessitates the specification of the speed of sound (SoS) within the medium of propagation. Due to the lack of information on the spatial distribution of the SoS within heterogeneous soft tissue, a homogeneous SoS distribution (such as 1540 m/s) is typically assumed in PA image reconstruction, similar to that of ultrasound (US) imaging. Failure to compensate the SoS variations leads to aberration artefacts, deteriorating the image quality. In this work, we developed a deep learning framework for SoS reconstruction and subsequent aberration correction in a dual-modal PA/US imaging system sharing a clinical US probe. As the PA and US data were inherently co-registered, the reconstructed SoS distribution from US channel data using deep neural networks was utilised for accurate PA image reconstruction. On a numerical and a tissue-mimicking phantom, this framework was able to significantly suppress US aberration artefacts, with the structural similarity index measure (SSIM) of up to 0.8109 and 0.8128 as compared to the conventional approach (0.6096 and 0.5985, respectively). The networks, trained only on simulated US data, also demonstrated a good generalisation ability on data from ex vivo tissues and the wrist and fingers of healthy human volunteers, and thus could be valuable in various in vivo applications to enhance PA image reconstruction.
Index Terms:
Photoacoustic imaging, ultrasound imaging, deep learning, speed of sound reconstruction, image reconstruction, aberration correctionI Introduction
PA imaging is a hybrid modality that combines rich optical contrast from optical imaging, and high spatial resolution and large imaging depths from US imaging. In the past two decades, PA imaging has demonstrated great potentials for a wide range of applications in preclinical and clinical settings [1, 2, 3]. It involves the illumination of biological tissues from pulsed or modulated continuous-wave light sources such as solid-state lasers and light-emitting diodes (LEDs). The light is then selectively absorbed by endogenous chromophores such as hemoglobin, water and lipids, and exogenous contrast agents, leading to local temperature increases and transient thermal expansion in conjunction with US wave generation. The amplitudes, frequencies, and time-of-flights of the US signals provide information of the optical absorption, sizes and spatial locations of the optical absorbers, respectively. In PA tomography configurations, the generated US waves propagate through tissue and are then detected with US sensors located on the tissue surface. Subsequently, acoustic inversion is performed on the acquired time series US data to reconstruct PA images representing optical absorption contrast. Here, the SoS in the propagation medium is usually stipulated to be homogeneously distributed (typically 1540 m/s as an average for soft tissue). However, SoS of soft tissue is highly dependent on tissue types, varying from around 1450 m/s (fat) to 1580 m/s (muscle) [4]. As such, this assumption can lead to significant US aberration artefacts, degrading the image contrast and spatial resolution [5].
Various methods were proposed to mitigate the SoS induced aberration artefacts in PA tomography [6, 7, 8, 9, 10, 11, 12, 13, 14, 15, 16, 17, 18, 19]. In 2011, Treeby et al. reported an autofocus algorithm to arrive at an optimal single SoS for the medium by iterative optimistion [6]. The automated selection of the optimal SoS can be achieved by maximising resolution metrics such as image sharpness [6] and a coherent factor [7]. These methods implemented the global optimisation of SoS, therefore the resolution metrics were optimised over the whole focus area and local variations on SoS in heterogeneous tissue were neglected. To incorporate the heterogeneity effect, parameterised SoS maps can be directly reconstructed using PA measurements. Several works investigated concurrent recovery of both SoS distributions and initial pressure distributions or optical absorption from PA measurements, which was referred to as a joint reconstruction (JR) problem. Jiang et al. reported a JR approach by seeking numerical solutions to the Helmholtz equation using a finite element method [9]. Zhang et al. proposed a time-domain method based on explicitly exploring two-fold data redundancy in a generalized Radon transform imaging model [10]. Zhang et al. further reported an implicit method by iteratively optimising a cost function with respect to the SoS map and optical absorption simultaneously [11]. In fact, accurate JR may not be achievable due to the numerical instability, as shown in Refs[12, 20]. Therefore, prior information of SoS distributions and detection geometries was usually incorporated for more accurate JR [14, 21]. Cai et al. proposed a feature coupling (FC) based JR method integrated with a full ring array photoacoustic computational tomography (PACT) system [18]. The SoS distributions were obtained through an iterative process that maximised the similarity between two PA images reconstructed by the two half-ring data. Validation on an in vivo mouse liver model demonstrated its superiority on distortion mitigation. However, the performance of the FC method can be significantly deteriorated when the image sparsity is high. To address this issue, a multi-segment feature coupling (MSFC) method was developed. The full ring array was partitioned into finer groups, and the FC method was applied to each group individually to estimate a direction-specific SoS [19].
SoS distributions can be independently measured with US transmission tomography and used for correcting PA image reconstruction in dedicated systems combining US and PA measurements [22]. In adjunction to PACT, US tomography can be implemented in a transmission mode by positioning a US transmitter and a receiver in an opposite position [10], or utilising passive elements which transmit US waves based on the PA effect [23, 24]. Furthermore, Mercep et al. proposed a transmission-reflection optoacoustic US (TROPUS) imaging platform that can retrieve multiple acoustic properties including SoS, acoustic attenuation and reflectivity [25]. In such hybrid systems, SoS maps acquired via US transmission tomography are employed for optimising PA image quality during the reconstruction. However, these methods are usually associated with a high degree of complexity, both in the hardware design and algorithm developments.
Pulse-echo US can be readily integrated with PA imaging by sharing a clinical US array probe for real-time imaging. Such dual-modal imaging systems can provide complementary morphological and molecular information of tissue based on optical absorption. Therefore, this configuration could facilitate clinical translation of the PA imaging technique and has thus attracted significant attention [26, 27, 28, 29]. With recent advances in deep learning (DL), Jeon et al. proposed a DL-based framework for mitigating SoS aberration and streak artefacts resulting from sparse sampling in a linear-array PA imaging system [16]. The DL model was trained on simulated PA data based on homogeneous SoS assumptions, which may affect its performance on highly heterogeneous tissues.
In this work, for the first time to the best of our knowledge, we propose a DL framework that retrieves the SoS distribution to inform PA image reconstruction using co-registered US raw data in a dual-modal PA/US imaging system with a clinical linear array US probe. The main contributions of this work can be summarised as follows:
-
•
We designed a detailed simulation pipeline to generate randomised and realistic US channel data based on a clinical linear-array US probe.
-
•
We trained a deep neural network to reconstruct SoS distributions from single plane wave US transmission using exclusively in silico data.
-
•
The trained network demonstrated remarkable generalisation capabilities by accurately reconstructing SoS distributions on digital phantoms with previously unseen structures, as well as on agar-based tissue-mimicking phantoms, ex vivo samples, and in vivo data of human fingers and wrist acquired from healthy volunteers.
-
•
We demonstrated the viability of utilising SoS information inherent in co-registered US data for compensating PA reconstruction. This approach showcased its effectiveness in enhancing image quality without the need for additional algorithmic development or hardware extensions.
II Methods and materials
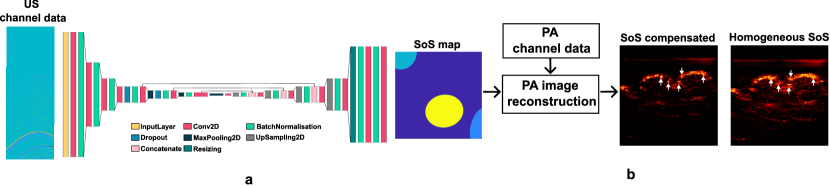
As illustrated in Fig.1, a deep neural network was trained on US channel data acquired from in silico simulations based on single plane wave transmission. The trained neural network was then used to parameterise SoS distribution within the medium. Sequentially, the estimated SoS map was incorporated into PA image reconstruction using a time-reversal-based algorithm. This section is structured as follows: Sec. II-A describes the generation of in silico US dataset for training. Sec.I introduces the architecture of the deep neural network used for retrieving SoS distribution from US channel data, followed by the training setup. For the model evaluation, Sec.II-C outlines the experimental design including evaluations with a numerical phantom, ex vivo tissues, a tissue-mimicking phantom, and human volunteers and image metrics for quantification.
II-A Ultrasound simulations
Due to the lack of diverse US data with known SoS distribution as ground truth, the training dataset was prepared using US simulations in K-Wave [30]. The US imaging process was modelled based on the geometry of a linear array US probe that is used in a commercially available LED-based PA/US imaging system (AcousticX, CYBERDYNE INC, Tsukuba, Japan) capable of performing single plane-wave US imaging and PA imaging. The probe had 128 elements spanning 38.4 mm with a pitch size of 0.3 mm and a central frequency of 7 MHz. The dimension of the simulation grid was 1536 1536 with a grid size of 0.025 mm. The probe was located at one side of the grid, with 11 grid points per piezo element and 1 grid point per kerf. The plane wave transmission pulse was simulated using 2-cycle tone burst signals with a central frequency of 7 MHz.
The anatomies in the simulation were based on simplified tissue models of organs and lesions used in [31]. Ellipses with various dimensions and orientations were randomly distributed within the medium. SoS values were randomly chosen from a uniform distribution for a homogeneous background and from a [1% - 7%] higher range for the inclusions. The echogenicity was considered by simulating elliptical-shaped inclusions as being hyperechoic. This was achieved by either increasing the SoS values or the density of the speckles inside the inclusions for an enhanced contrast [32]. In this work, the hyperechoic features were simulated by randomly assigning the SoS values with [7% - 11%] increments to the background to 10 % of the grid points. Acoustic attenuation and mass intensity were fixed to 0.5 dB/(MHzcm) and 1020 kg/m3 according to human soft tissue. The speckle density had a mean distribution of 3 speckles per 2 ( is the wavelength of the transmit pulse). The intensity was assigned by sampling the scatterers with a uniform distribution .
The simulations were also subject to noise. Thermal noise resulting from electrons’ agitation in US imaging systems was modelled using a white Gaussian noise. The noise amplitude at each channel was determined by the signal-to-noise ratios that were randomly sampled from -80 dB to -40 dB. The noise associated with transmission interference was sampled from the US measurements using AcousticX. For each channel, signals from the first 50 time steps were extracted and added onto the simulated US data accordingly. A time gain compensation of 0.5 dB/MHz.cm at 1540 m/s was implemented.
II-B Deep neural networks for SoS reconstruction
The deep learning model was modified from the structure proposed in [33, 32] where the input and output were defined as:
| (1) |
The US channel data acquired with a single plane wave transmission were taken as the input with a size of , where =128 is the number of channels and =1024 is the number of time steps at a sampling rate of 20 MHz. The output is the corresponding SoS map with dimensions of 384384 () and a spatial resolution of 0.1 mm.
As depicted in Fig. 1a, the model was based on a fully convolutional neural network in an encoder-decoder configuration. For the encoder, strided convolutional layers were adopted at the first three layers for accommodating the non-square input size and improving the smoothness of the SoS predictions, followed by LeakyReLU, and Batch Normalisation (BN). The next four layers consisted of convolution, LeakyReLU, MaxPooling, and BN. The decoder path had four layers consisting of convolution, LeakyReLU, bilinear upsampling, and BN. After resizing the output, 11 convolution was applied to generate the final SoS map. The encoding and decoding paths were connected by combining the output feature maps of the layer 5, 6, 7 to the corresponding layer 9, 10, 11.
Before being fed into the network, the input US channel data was normalised to have a mean of 0 and a standard deviation of 1 for each channel. The network was trained on 6000 samples with a train/valid spilt of 0.9. Mean Square Error (MSE) was used as the loss function. Stochastic gradient descent with a mini batch size of 10 and a learning rate of 0.0001 was used for training. After 100 epochs, the network converged to a Root Mean Square Error (RMSE) of 22.90 on the training set and 26.74 on the validation set, respectively. No further improvements in performance were observed beyond this point. The US simulations took around 2 days with an NVIDIA Quadro RTX 5000 GPU. The model was trained using Keras 2.12.0 with Python 3.10.11. The experiments were conducted on NVIDIA DGX cluster equipped with 8 A100 GPUs. Codes and data can be found in https://github.com/MengjieSHI/learning-based-sos-correction-us-pa.
II-C Model evaluation
The trained model was then validated using numerical phantoms, tissue mimicking phantoms, ex vivo, and in vivo data, respectively. The reconstructed SoS maps from the trained model were directly used to inform co-registered PA image reconstruction using a time-reversal (TR) algorithm implemented in K-Wave [34].
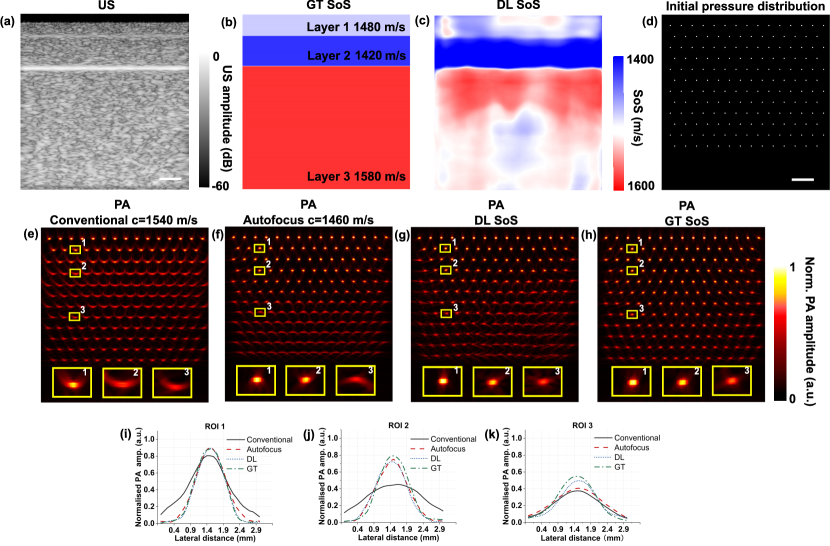
To assess its performance beyond homogeneous background, numerical layered phantoms with point optical absorbers were simulated. Each layer had a random thickness between [5 - 13] mm with a single SoS randomly chosen from [1400 - 1600] m/s. The echogenicity was kept as being hyperechoic. The point optical absorbers were simplified as a series of 2-D grid coordinates with a constant initial pressure. In comparison, classical assumption of the SoS in soft tissue (1540 m/s) and an optimal SoS value based on an autofocus method [6] were used for the PA reconstruction. Local structure similarity index measure (SSIM) was calculated for each layer using the PA images reconstructed with the conventional SoS assumption, and two SoS correction methods: autofocus approach and DL, respectively.
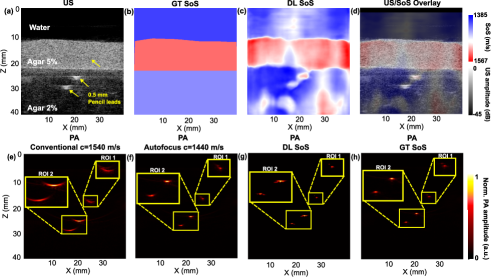
The trained model was then tested on real data acquired from agar-based tissue mimicking phantoms, ex vivo tissues and in vivo human wrist and fingers. The tissue mimicking phantom was composed of two layers of agar, with the upper layer having a 5% w/v concentration and the bottom layer having a 2% w/v concentration. Glass beads (0–63 m, Boud Minerals Limited, UK) with 1% w/v concentration were used for both layers. Three pencil leads (Faber-Castell, Stein, Germany) with a diameter of 0.5 mm were positioned at the different layers within the phantom. The literature SoS values for agar 2% and agar 5% phantoms were utilised for comparison [35]. The local SSIM was evaluated at two Regions of Interest (ROIs) manually selected at each layer. These ROIs were carefully chosen to encompass the PA signals emitted by the pencil leads. The ex vivo data were acquired from two tissue phantoms made of chicken breast tissue and pork belly, respectively. For the chicken breast tissue phantom, a cylindrical 2% agar phantom (O.D. around 4 mm) containing carbon fibre bundles was included to introduce local SoS variations. The pork belly tissue comprised layers of skin, fat, and muscle. A clinical needle (20G, BD, USA) was inserted into the pork belly tissue for emulating the structural distortions of the needle in PA images, which were induced by SoS inhomogeneity of the medium. Furthermore, the established model was tested on in vivo data from the wrist and fingers of a human volunteer acquired with AcousticX. The human volunteer experiments were approved by the King’s College London Research Ethics Committee (study reference: HR-18/19-8881).
III Results
III-A Numerical phantoms
| SSIM | |||
| \CenterstackConventional | |||
| (c=1540 m/s) | \CenterstackAutofocus | ||
| (c=1460 m/s) | DL | ||
| Layer 1 | 0.7476 | 0.8760 | 0.9035 |
| Layer 2 | 0.4915 | 0.8446 | 0.8532 |
| Layer 3 | 0.5896 | 0.4765 | 0.6760 |
| Global Avea. | 0.6096 | 0.7324 | 0.8109 |
| aAverage of the SSIM at each layer | |||
The trained model was tested on numerical phantoms that contained layered structures not present in the training set. Fig. 2 shows an exemplar that had three layers. Layer 1, 2, and 3 had a thickness of 5.00 mm, 6.75 mm, and 28.25 mm with a homogeneous SoS of 1480 m/s, 1420 m/s, and 1580 m/s for each layer, respectively. The DL model was able to detect the layer boundaries with SoS predictions close to the ground truth values, especially for the first and second layers. As expected, the performance was degraded at larger depths (lager than 3 cm) due to the limited penetration depth and low signal-to-noise ratios with single plane wave transmissions. PA images reconstructed using a conventional SoS value in soft tissue (c = 1540 m/s), an optimal SoS value obtained by an autofocus method, a SoS map retrieved by the DL model, and the GT SoS are shown in Fig. 2 (e)-(h). Regions enclosing three representative point targets (ROI 1 to 3) distributed within different layers with different background SoS values were chosen for comparing the reconstruction performance by inspecting their lateral profiles (Fig. 2 (i)-(k)). With conventional reconstructions (SoS of 1540 m/s), US aberration artefacts were visible at all depths and manifested as arc-shaped structures as shown in the insets. The optimal SoS value of 1460 m/s estimated by the autofocus approach was close to the average SoS of the top two layers. Thus, it effectively corrected the PA reconstructions of the targets in these areas (ROI 1 and 2). Aberration artefacts were apparent in ROI 3 where there was a substantial divergence between the true (1580 m/s) and the estimated optimal SoS (1460 m/s). In contrast, the performance of the DL-based approach was largely consistent at different depths. The SoS values calculated from the reconstructed SoS map for the three layers were 1472 m/s, 1414 m/s, 1542 m/s, with standard deviations of 28.16 m/s, 11.33 m/s, and 26.14 m/s, respectively. This represents a mean percentage error of 0.54%, 0.42%, and 2.41% for layer 1, 2, and 3, respectively. Besides, compared to the autofocus approach, the PA images corrected by the DL approach achieved better spatial resolution; for the point target at ROI 3, the full width at half maximum (FWHM) of the lateral profile was 0.65 mm using the DL based method, compared to 1.05 mm with the autofocus approach. This corresponds to an improvement in the lateral resolution by around 38%. The superiority was also quantified by SSIM as shown in Table I. The DL method exhibited the highest local SSIM values across all the three layers, achieving a global average of 0.8109. It is worth noting that the PA reconstructions of the point targets that were far from the sensors were distorted since the estimation errors of the model accumulated at the deep layer. In contrast to the central area, the distortion was also legitimately enhanced at the peripheral regions where the PA waves travelled through longer distances towards the distal sensors.
III-B Tissue mimicking phantoms
| SSIM | |||
| \CenterstackConventional | |||
| (c=1540 m/s) | \CenterstackAutofocus | ||
| (c=1460 m/s) | DL | ||
| ROI 1 | 0.4760 | 0.7751 | 0.8105 |
| ROI 2 | 0.7156 | 0.8221 | 0.8151 |
| Global Avea. | 0.5985 | 0.7986 | 0.8128 |
| aAverage of the SSIM at each ROI | |||
As a second validation step of the trained model, its performance was evaluated using real US data by imaging an agar-based tissue-mimicking phantom. As shown in Fig.3, the phantom consisted of two layers of different agar concentrations. Agar has been widely used as a tissue-mimicking material for PA and US phantoms [36]. According to the acoustic properties of selected tissue phantom materials for US imaging measured in [35], the SoS of 2% and 4.8% agar phantoms at a room temperature of 20.2°C was measured as 14976m/s and 15166 m/s, respectively, which were employed as the ground truth values for SoS parameterisation. In the DL-predicted SoS map, even though the model was trained using a pure in silico dataset without layered structures, the model was able to infer the SoS differences of the two-layered phantoms in agreement with our expectations. The average SoS for the water layer was around 1491 m/s with a standard deviation of 21 m/s (water SoS at 20°C is around 1480 m/s [4]). Noticeably, the SoS for the initial layer of the dual-layered phantom was effectively estimated, yielding a mean value of 1533 m/s and an average deviation of 23 m/s in comparison to the literature value of 15166 m/s. Likewise, the mean prediction for the bottom layer was 1431 m/s with a higher deviation of 30 m/s than the first layer. This discrepancy may be attributed to the US reflections artefacts originated from the bottom of the water tank as well as the pencil leads. Finally, the predicted SoS was applied to PA image reconstruction and compared against a homogeneous SoS assumption of 1540 m/s and 1440 m/s (given by the autofocus algorithm). As shown in Fig. 3(e) and (f), the PA signals of the pencil leads, especially those positioned at the bottom layer, were distorted under the constant SoS values. In contrast, it was observed that the distortion was mitigated when using the parameterised SoS map by the DL model (Fig. 3(g). Table II compares the local and the global average SSIM values for various PA reconstruction methods using the PA reconstruction with the ground-truth SoS as the reference. These methods included the conventional reconstruction and SoS compensation based on the autofocus or DL method. The proposed DL-based method demonstrated the highest global average SSIM of 0.8128, outperforming the conventional method with an SSIM of 0.5985, as well as the autofocus method with an SSIM of 0.7986.
III-C Ex vivo tissue and tissue phantoms
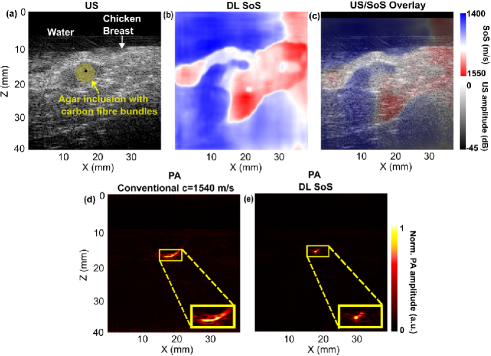
To further assess the generalisation capability of the trained networks, ex vivo chicken breast tissue with an agar inclusion was assembled for imaging. The US image in Fig. 4 indicates the structure of the phantom where the agar inclusion was sandwiched by two pieces of chicken breast tissue. Carbon fibre bundles were embedded in the agar phantom as the PA targets. The retrieved SoS distribution with DL revealed the boundaries between the coupling medium (water at around 16 °C), the chicken breast tissue, and the agar inclusion. The predicted SoS values in each area were close to those found in literature (about 1460 m/s for water at 16 °C[4]; 1516 m/s for the 5% agar phantom [35]). The mean SoS prediction for chicken breast tissue within a depth range of 10 mm to 20 mm was 1530 m/s with a variation of up to 50 m/s. This can be attributed to the inherent tissue heterogeneity caused by non-uniform water content and the presence of tendons. It is noticeable that the gap between the chicken breast and the agar inclusion was also detected with the predicted SoS close to that of the background. SoS reconstruction was less accurate for some hypoechoic regions in the US image (bottom-left corner), which could be explained by the similar US appearance with water and as such they could be misinterpreted as water by the trained networks. By employing the predicted SoS map for PA reconstruction, the SoS aberration artefacts were significantly suppressed as compared to those in the conventional reconstruction (yellow boxes).
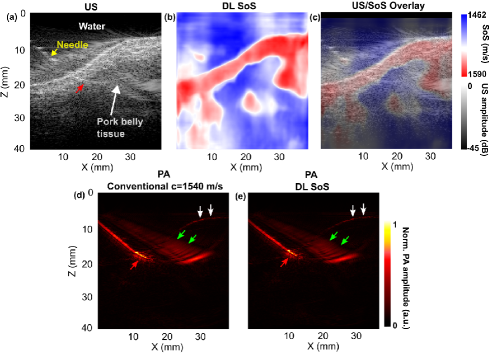
The pork belly tissue phantom also demonstrated the effect of US aberration on structural PA targets such as metallic needles (Fig. 5). In the non-corrected PA image (SoS was 1540 m/s), the distal segment of the needle suffered from a bending distortion (denoted by a red arrow). The signal at the tip exhibited a deviation from the shaft, accompanied by the presence of reflection artefacts in the vicinity of the tip region. It could lead to the ambiguity of the tip localisation in PA images. However, the tissue boundary was clearly detected in the predicted SoS distribution by the networks, following the skin anatomy in the corresponding US image. The average SoS estimation of the skin layer was 1572 m/s. Similar to the chick breast tissue phantom, SoS reconstruction was also less accurate at large depths (3-4 cm), where the signal-to-noise ratios are low. The SoS aberration at the needle tip area was effectively alleviated in the corrected PA image, and the artefacts were suppressed as well.
III-D In vivo human data
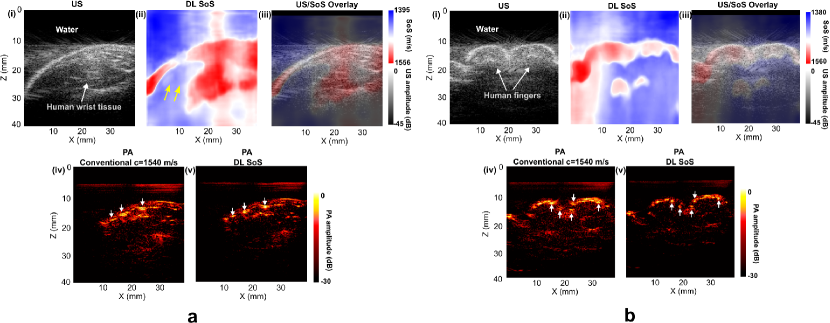
The model was further tested using co-registered PA and US data obtained from the wrist and fingers of healthy human volunteers. As shown in Fig. 6a, for the human wrist data, although the ground truth SoS was not accessible, the predicted SoS map demonstrated a good correspondence with the anatomy depicted by the corresponding US image, particularly, the boundary between skin and water. The recovered SoS value for soft tissue (1515.8 m/s 14.5 m/s) matched the value found in the literature [4], whilst the SoS of water (1438.5 m/s 23.9 m/s) was slightly underestimated. The SoS for a region within the tissue (denoted by yellow arrows in Fig. 6a) was also underestimated. This could be ascribed to local signal degradation which resulted in a US appearance similar to that of water. The reconstructed PA images exhibited a significant improvement in the visualisation of the cross-sections of blood vessels (indicated by the white arrows). This improvement was notable when compared to the results obtained under the constant SoS assumption, where the cross-sections of blood vessels were significantly extended laterally due to US aberrations. It was further observed that PA images of the vessels with DL-based SoS compensation also suffered from slight deformation, which could be attributed to the external force applied by handheld imaging probe and the limited-view angle of the linear probe.
With the human finger experiment (Fig. 6b), the reconstructed SoS map enabled a distinct differentiation between water and the fingers, as shown in the overlay with the US image. The estimated SoS was around 1491.6 m/s 28.2 m/s for the water and 1566.4 m/s 20.1 m/s for the muscle, which was consistent with the values reported in the literature [4]. It is worth emphasising that the PA signals emanating at large depths ( 1.5 cm) were not prominent due to strong light attenuation. Therefore, the improvements due to SoS corrections were only apparent on the superficial vessels, as denoted by white arrows.
IV Discussion & Conclusions
A long-standing challenge in PA image reconstruction is the lack of accurate information of SoS variations in heterogeneous biological tissue. Failure to compensate the variation in SoS can result in severe image distortions and artefacts, which compromise the image quality. Prior studies have explored different approaches to incorporate the SoS heterogeneity during PA image reconstruction. Although promising results have been reported, they usually involve certain complexities such as dedicated imaging hardware and sophisticated algorithm developments. Recent works demonstrated that deep learning was able to directly retrieve SoS distributions from raw channel data of pulse-echo US imaging [33, 37, 31]. Feign et al. proposed a SoS inversion method using a fully convolutional deep neural network [33]. The network was trained using simulated plane wave US raw data. Results on the human neck and calf muscles provided promising indications of SoS variations. Similarly, Jush et al. explored a deep neural network for SoS reconstruction for US breast imaging using single plane wave US acquisition [31] and further extended to in-phase and quadrature data as the input [38]. Inspired by the feasibility of retrieving SoS distributions from US channel data with deep neural networks, a learning-based SoS correction method for PA imaging was proposed based on a dual-modal PA/US imaging system.
The dual-modal system can acquire interleaved PA and US data for real time applications, making it possible for enhancing PA image reconstruction using SoS information inherited in the corresponding co-registered US data. The training dataset was prepared in silico, taking into consideration the variations of acoustic properties and structures present in the real-world scenario. Noise including thermal noise and system noise from real measurements was added. The networks’ performance was evaluated with a numerical phantom, tissue-mimicking phantoms, ex vivo tissues, and in vivo human data.
With the numerical phantom and the tissue-mimicking phantom experiment, US imaging was able to separate the layers with different SoS. The trained DL model was able to retrieve the SoS values at each layer using the channel data. This could be useful for identifying tissue boundaries that may not be detectable in B-mode US images. Conventional and the autofocus methods resulted in deformations in point source reconstructions as evidenced by degradation in the lateral resolution. The DL-reconstructed SoS map can compensate the SoS variations over the entire field-of-view. As a result, the PA image quality was consistently enhanced, especially for the targets that were far from the detector as indicated by the significant improvements in SSIM.
Although the DL model was trained on pure in silico data, promising results were observed with measurements on ex vivo tissue and in vivo human data. With ex vivo tissue measurements, the boundaries of the chicken breast tissue and the agar inclusion can be discriminated from the SoS output. The predicted SoS values for each structure were situated in the range of the values reported in the literature and was found to be effective for mitigating the SoS-related artefacts in the conventional PA reconstruction. Similarly, the model can identify the SoS changes from the coupling medium (water) to the skin layer in the pork belly tissue. The SoS aberration artefacts distorted the image of the subcutaneous needle due to the large SoS discrepancy between the water and animal skin. With the SoS information from the networks, the position of the in-plane needle was corrected with reduced artefacts originated from the tip area. This could be advantageous for tracking the needle tip relative to the patient anatomy during various US-guided minimally invasive procedures such as peripheral nerve blocks and tumour biopsy [27, 39, 40, 41]. Similarly, with the in vivo data from human wrist and fingers, although quantitative assessment of the estimated SoS map was impossible due to the lack of the ground truth SoS, it demonstrated a good correspondence with the anatomy in the corresponding B-mode US images. By applying the predicted SoS, the cross-sections of the blood vessels at the superficial areas were effectively enhanced.
The performance of the networks deteriorated when the depth was larger than approximately 2.5 cm, leading to underestimated SoS values. This could be explained by the intrinsically restricted generalisation and robustness ability of the networks that were built on simulated data. Besides, the US channel data based on single wave transmission had low signal-to-noise ratios. As such, a single wave transmission may not be adequate for a full-field recovery, which is also reported in [33]. Advanced US transmission strategies such as coherent compounding could be potentially helpful for acquiring data with improved signal-to-noise ratios [42]. To increase the fidelity and realism of the simulation, the effects of inhomogeneous acoustic attenuation and the frequency response of the US transducer could be incorporated during US simulations. Simulated data merit further investigation in terms of well-defined ultrasonic and optical properties and easy accessed ground truths, but the model trained with simulated data may be less efficient on certain measurement data due to the presence of a domain gap. Further studies can be performed on circumventing the model bias by incorporating measurement data from US tissue-mimicking phantoms, of which the SoS can be well controlled during fabrication as the ground truth for training.
Acknowledgements
This project was supported by the Wellcome Trust, United Kingdom (203148/Z/16/Z), the Engineering and Physical Sciences Research Council (EPSRC), United Kingdom (NS/A000049/1), and King’s–China Scholarship Council PhD Scholarship Program (K-CSC) (202008060071). For the purpose of open access, the authors have applied a CC BY public copyright license to any author-accepted manuscript version arising from this submission.
T.V. is co-founder and shareholder of Hypervision Surgical Ltd, London, UK. He is also a shareholder of Mauna Kea Technologies, Paris, France.
References
- [1] P. Beard, “Biomedical photoacoustic imaging,” Interface Focus, vol. 1, no. 4, pp. 602–631, 2011.
- [2] T. Zhao, A. E. Desjardins, S. Ourselin, T. Vercauteren, and W. Xia, “Minimally invasive photoacoustic imaging: Current status and future perspectives,” Photoacoustics, vol. 16, p. 100146, 2019.
- [3] L. V. Wang and J. Yao, “A practical guide to photoacoustic tomography in the life sciences,” Nature Methods, vol. 13, no. 8, pp. 627–638, 2016.
- [4] J. Mamou and M. L. Oelze, Quantitative ultrasound in soft tissues. Springer, 2013.
- [5] X. L. Deán-Ben, V. Ntziachristos, and D. Razansky, “Effects of small variations of speed of sound in optoacoustic tomographic imaging,” Medical Physics, vol. 41, no. 7, p. 073301, 2014.
- [6] B. E. Treeby, T. K. Varslot, E. Z. Zhang, J. G. Laufer, and P. C. Beard, “Automatic sound speed selection in photoacoustic image reconstruction using an autofocus approach,” Journal of Biomedical Optics, vol. 16, no. 9, p. 090501, 2011.
- [7] C. Yoon, J. Kang, S. Han, Y. Yoo, T.-K. Song, and J. H. Chang, “Enhancement of photoacoustic image quality by sound speed correction: Ex vivo evaluation,” Optics Express, vol. 20, no. 3, p. 3082, 2012.
- [8] M. Anastasio, J. Zhang, X. Pan, Y. Zou, G. Ku, and L. Wang, “Half-time image reconstruction in thermoacoustic tomography,” IEEE Transactions on Medical Imaging, vol. 24, no. 2, pp. 199–210, 2005.
- [9] H. Jiang, Z. Yuan, and X. Gu, “Spatially varying optical and acoustic property reconstruction using finite-element-based photoacoustic tomography,” Journal of the Optical Society of America A, vol. 23, no. 4, p. 878, 2006.
- [10] J. Zhang and M. A. Anastasio, “Reconstruction of speed-of-sound and electromagnetic absorption distributions in photoacoustic tomography,” in Biomedical Optics 2006, A. A. Oraevsky and L. V. Wang, Eds., San Jose, CA, 2006, p. 608619.
- [11] J. Zhang, K. Wang, Y. Yang, and M. A. Anastasio, “Simultaneous reconstruction of speed-of-sound and optical absorption properties in photoacoustic tomography via a time-domain iterative algorithm,” in Biomedical Optics (BiOS) 2008, A. A. Oraevsky and L. V. Wang, Eds., San Jose, CA, 2008, p. 68561F.
- [12] C. Huang, K. Wang, R. W. Schoonover, L. V. Wang, and M. A. Anastasio, “Joint Reconstruction of Absorbed Optical Energy Density and Sound Speed Distributions in Photoacoustic Computed Tomography: A Numerical Investigation,” IEEE transactions on computational imaging, vol. 2, no. 2, pp. 136–149, 2016.
- [13] C. Huang, K. Wang, L. Nie, L. V. Wang, and M. A. Anastasio, “Full-Wave Iterative Image Reconstruction in Photoacoustic Tomography With Acoustically Inhomogeneous Media,” IEEE transactions on medical imaging, vol. 32, no. 6, pp. 1097–1110, 2013.
- [14] T. P. Matthews, J. Poudel, L. Li, L. V. Wang, and M. A. Anastasio, “Parameterized joint reconstruction of the initial pressure and sound speed distributions for photoacoustic computed tomography,” SIAM journal on imaging sciences, vol. 11, no. 2, pp. 1560–1588, 2018.
- [15] T. P. Matthews and M. A. Anastasio, “Joint reconstruction of the initial pressure and speed of sound distributions from combined photoacoustic and ultrasound tomography measurements,” Inverse Problems, vol. 33, no. 12, p. 124002, 2017.
- [16] S. Jeon, W. Choi, B. Park, and C. Kim, “A Deep Learning-Based Model That Reduces Speed of Sound Aberrations for Improved In Vivo Photoacoustic Imaging,” IEEE Transactions on Image Processing, vol. 30, pp. 8773–8784, 2021.
- [17] G. Chen, X. Wang, J. Wang, Z. Zhao, Z.-P. Nie, and Q. H. Liu, “TR ADJOINT IMAGING METHOD FOR MITAT,” Progress In Electromagnetics Research B, vol. 46, pp. 41–57, 2013.
- [18] C. Cai, X. Wang, K. Si, J. Qian, J. Luo, and C. Ma, “Feature coupling photoacoustic computed tomography for joint reconstruction of initial pressure and sound speed in vivo,” Biomedical Optics Express, vol. 10, no. 7, p. 3447, 2019.
- [19] K. Deng, X. Wang, C. Cai, M. Cui, H. Zuo, J. Luo, and C. Ma, “Multi-segmented feature coupling for jointly reconstructing initial pressure and speed of sound in photoacoustic computed tomography,” Journal of Biomedical Optics, vol. 27, no. 7, p. 076001, 2022.
- [20] P. Stefanov, G. Uhlmann, ,Department of Mathematics, Purdue University, 150 N University Street, West Lafayette, IN 47907, and ,Department of Mathematics, University of Washington, Seattle, WA 98195-4350, “Instability of the linearized problem in multiwave tomography of recovery both the source and the speed,” Inverse Problems & Imaging, vol. 7, no. 4, pp. 1367–1377, 2013.
- [21] A. Kirsch and O. Scherzer, “Simultaneous Reconstructions of Absorption Density and Wave Speed with Photo Acoustic Measurements,” SIAM Journal on Applied Mathematics, vol. 72, no. 5, pp. 1508–1523, 2012.
- [22] J. Xia, C. Huang, K. Maslov, M. A. Anastasio, and L. V. Wang, “Acoustic-speed correction of photoacoustic tomography by ultrasonic computed tomography based on optical excitation of elements of a full-ring transducer array,” in Photons Plus Ultrasound: Imaging and Sensing 2014, vol. 8943. International Society for Optics and Photonics, 2014, p. 89432G.
- [23] S. Manohar, R. G. H. Willemink, F. van der Heijden, C. H. Slump, and T. G. van Leeuwen, “Concomitant speed-of-sound tomography in photoacoustic imaging,” Applied Physics Letters, vol. 91, no. 13, p. 131911, 2007.
- [24] J. Jose, R. G. H. Willemink, S. Resink, D. Piras, J. C. G. van Hespen, C. H. Slump, W. Steenbergen, T. G. van Leeuwen, and S. Manohar, “Passive element enriched photoacoustic computed tomography (PER PACT) for simultaneous imaging of acoustic propagation properties and light absorption,” Optics Express, vol. 19, no. 3, pp. 2093–2104, 2011.
- [25] E. Merčep, J. L. Herraiz, X. L. Deán-Ben, and D. Razansky, “Transmission–reflection optoacoustic ultrasound (TROPUS) computed tomography of small animals,” Light: Science & Applications, vol. 8, no. 1, p. 18, 2019.
- [26] M. Kuniyil Ajith Singh, W. Steenbergen, and S. Manohar, “Handheld Probe-Based Dual Mode Ultrasound/Photoacoustics for Biomedical Imaging,” in Frontiers in Biophotonics for Translational Medicine: In the Celebration of Year of Light (2015), ser. Progress in Optical Science and Photonics, M. Olivo and U. S. Dinish, Eds. Singapore: Springer, 2016, pp. 209–247.
- [27] M. Shi, S. Bodian, S. J. West, S. Sathasivam, R. J. Gordon, P. Collier, T. Vercauteren, A. E. Desjardins, S. Noimark, and W. Xia, “Enhanced Photoacoustic Visualisation of Clinical Needles by Combining Interstitial and Extracorporeal Illumination of Elastomeric Nanocomposite Coatings,” Sensors, vol. 22, no. 17, p. 6417, 2022.
- [28] M. Shi, T. Zhao, S. J. West, A. E. Desjardins, T. Vercauteren, and W. Xia, “Improving needle visibility in LED-based photoacoustic imaging using deep learning with semi-synthetic datasets,” Photoacoustics, vol. 26, p. 100351, 2022.
- [29] W. Xia, M. Kuniyil Ajith Singh, E. Maneas, N. Sato, Y. Shigeta, T. Agano, S. Ourselin, S. J. West, and A. E. Desjardins, “Handheld Real-Time LED-Based Photoacoustic and Ultrasound Imaging System for Accurate Visualization of Clinical Metal Needles and Superficial Vasculature to Guide Minimally Invasive Procedures,” Sensors, vol. 18, no. 5, p. 1394, 2018.
- [30] B. E. Treeby and B. T. Cox, “K-Wave: MATLAB toolbox for the simulation and reconstruction of photoacoustic wave fields,” Journal of Biomedical Optics, vol. 15, no. 2, p. 021314, 2010.
- [31] F. K. Jush, M. Biele, P. M. Dueppenbecker, O. Schmidt, and A. Maier, “DNN-based Speed-of-Sound Reconstruction for Automated Breast Ultrasound,” in 2020 IEEE International Ultrasonics Symposium (IUS), 2020, pp. 1–7.
- [32] F. K. Jush, M. Biele, P. M. Dueppenbecker, and A. Maier, “Deep Learning for Ultrasound Speed-of-Sound Reconstruction: Impacts of Training Data Diversity on Stability and Robustness,” 2022.
- [33] M. Feigin, D. Freedman, and B. W. Anthony, “A Deep Learning Framework for Single-Sided Sound Speed Inversion in Medical Ultrasound,” IEEE Transactions on Biomedical Engineering, vol. 67, no. 4, pp. 1142–1151, 2020.
- [34] B. E. Treeby, E. Z. Zhang, and B. T. Cox, “Photoacoustic tomography in absorbing acoustic media using time reversal,” Inverse Problems, vol. 26, no. 11, p. 115003, 2010.
- [35] M. D. Gu, “Investigating a relationship between speed of sound and hydrogel water content via ultrasound for future articular cartilage applications,” Ph.D. dissertation, Case Western Reserve University, 2013.
- [36] R. M. Souza, T. Q. Santos, D. P. Oliveira, A. Alvarenga, and R. Costa-Felix, “Standard operating procedure to prepare agar phantoms,” in Journal of Physics: Conference Series, vol. 733, no. 1. IOP Publishing, 2016, p. 012044.
- [37] V. Vishnevskiy, S. J. Sanabria, and O. Goksel, “Image Reconstruction via Variational Network for Real-Time Hand-Held Sound-Speed Imaging,” in Machine Learning for Medical Image Reconstruction, ser. Lecture Notes in Computer Science, F. Knoll, A. Maier, and D. Rueckert, Eds. Cham: Springer International Publishing, 2018, pp. 120–128.
- [38] F. Khun Jush, P. M. Dueppenbecker, and A. Maier, “Data-Driven Speed-of-Sound Reconstruction for Medical Ultrasound: Impacts of Training Data Format and Imperfections on Convergence,” in Medical Image Understanding and Analysis, ser. Lecture Notes in Computer Science, B. W. Papież, M. Yaqub, J. Jiao, A. I. L. Namburete, and J. A. Noble, Eds. Cham: Springer International Publishing, 2021, pp. 140–150.
- [39] W. Xia, J. M. Mari, S. J. West, Y. Ginsberg, A. L. David, S. Ourselin, and A. E. Desjardins, “In-plane ultrasonic needle tracking using a fiber-optic hydrophone,” Medical Physics, vol. 42, no. 10, pp. 5983–5991, 2015.
- [40] W. Xia, E. Maneas, D. I. Nikitichev, C. A. Mosse, G. Sato Dos Santos, T. Vercauteren, A. L. David, J. Deprest, S. Ourselin, P. C. Beard, and A. E. Desjardins, “Interventional Photoacoustic Imaging of the Human Placenta with Ultrasonic Tracking for Minimally Invasive Fetal Surgeries,” Medical image computing and computer-assisted intervention: MICCAI … International Conference on Medical Image Computing and Computer-Assisted Intervention, vol. 9349, pp. 371–378, 2015.
- [41] C. Baker, M. Xochicale, F.-Y. Lin, S. Mathews, F. Joubert, D. I. Shakir, R. Miles, C. A. Mosse, T. Zhao, W. Liang, Y. Kunpalin, B. Dromey, T. Mistry, N. J. Sebire, E. Zhang, S. Ourselin, P. C. Beard, A. L. David, A. E. Desjardins, T. Vercauteren, and W. Xia, “Intraoperative Needle Tip Tracking with an Integrated Fibre-Optic Ultrasound Sensor,” Sensors (Basel, Switzerland), vol. 22, no. 23, p. 9035, 2022.
- [42] R. R. Entrekin, B. A. Porter, H. H. Sillesen, A. D. Wong, P. L. Cooperberg, and C. H. Fix, “Real-time spatial compound imaging: Application to breast, vascular, and musculoskeletal ultrasound,” Seminars in Ultrasound, CT and MRI, vol. 22, no. 1, pp. 50–64, 2001.