Benchmarking Deep Learning Architectures for Urban Vegetation Points Segmentation
Abstract
Vegetation is crucial for sustainable and resilient cities providing various ecosystem services and well-being of humans. However, vegetation is under critical stress with rapid urbanization and expanding infrastructure footprints. Consequently, mapping of this vegetation is essential in the urban environment. Recently, deep learning for point cloud semantic segmentation has shown significant progress. Advanced models attempt to obtain state-of-the-art performance on benchmark datasets, comprising multiple classes and representing real world scenarios. However, class specific segmentation with respect to vegetation points has not been explored. Therefore, selection of a deep learning model for vegetation points segmentation is ambiguous. To address this problem, we provide a comprehensive assessment of point-based deep learning models for semantic segmentation of vegetation class. We have selected four representative point-based models, namely PointCNN, KPConv (omni-supervised), RandLANet and SCFNet. These models are investigated on three different datasets, specifically Chandigarh, Toronto3D and Kerala, which are characterized by diverse nature of vegetation, varying scene complexity and changing per-point features. PointCNN achieves the highest mIoU on the Chandigarh (93.32%) and Kerala datasets (85.68%) while KPConv (omni-supervised) provides the highest mIoU on the Toronto3D dataset (91.26%). The paper develops a deeper insight, hitherto not reported, into the working of these models for vegetation segmentation and outlines the ingredients that should be included in a model specifically for vegetation segmentation. This paper is a step towards the development of a novel architecture for vegetation points segmentation.
Index Terms:
Convolutional neural network (CNN), deep learning, point cloud semantic segmentation, urban forests, vegetation points, mobile laser scanning, vegetation points segmentation.I Introduction
In the backdrop of low-cost and compact sensors [1], the deployment of Mobile Laser Scanning (MLS) sensors has seen a steady rise for capturing 3D point clouds in the urban environment. These MLS sensors acquire centimeter-level accurate point clouds with a density up to a few thousand points/m2 [2]. The points are captured from multiple angles and perspectives, providing enhanced scene representation. The point clouds, which are the simplest representation of 3D scenes, can be utilized to extract various objects of interests. Some of the dominant classes in point cloud of urban scenes are buildings, roads, ground, pavements, vegetation, poles and vehicles [3, 4, 5, 6]. Although, each class has its own relevance, vegetation is of notable significance in view of the growing concerns related to sustainable cities and deteriorating urban environment [7, 8, 9]. Accurate extraction of vegetation points from point cloud, herein called as vegetation points segmentation, is crucial for estimation of various metrics related to vegetation. Vegetation points will pave the way for mapping trees and subsequent carbon stock estimation among other contributions [10, 11].
In recent years, there has been a significant advancement in deep learning (DL) technology for point cloud segmentation, enabling enhanced spatial scene understanding in the urban environment. DL models are capable of learning rich semantic features necessary for segmentation and demonstrate state-of-the-art results on various point cloud benchmark datasets [3, 4, 5, 12, 13, 14]. However, models achieving leading results on benchmark datasets may not necessarily achieve similar outcome on datasets collected in a different area, typically on account of varying class-wise composition, point-wise features and the nature of objects within the dataset. In general, a model with higher mean Intersection over Union (mIoU) does not mean that the Intersection over Union (IoU) is higher across all classes. Therefore, overall best model does not guarantee comparable performance to each class [3]. Accordingly, the selection of a model while dealing with a class specific segmentation is ambiguous. Comprehensive experiments with multiple DL models are required to have some insights in this regard. Furthermore, the employed datasets should incorporate varying scenarios in terms of scene complexity.
As stated above, the selection of DL model for vegetation points segmentation from LiDAR data is ambiguous in the current literature. Consequently, how to select an appropriate model for vegetation points segmentation from amongst several available DL models, remains an unanswered question. Further, there is no understanding, if such a model is invariant to changing scene complexities and per-point features in the dataset. To the problem, we have performed a benchmarking study with four representative DL models, namely PointCNN, KPConv (omni-supervised), RandLANet and SCFNet. Datasets from three study areas are employed, specifically Chandigarh, Toronto3D and Kerala, characterizing multifaceted vegetation along with varying scene complexity and per-point features. The contributions of our research can be summarized as follows:
-
1.
To the best of our knowledge, this is the first paper to provide benchmarking of representative point-based DL models for vegetation points segmentation from MLS data. We have implemented the models on datasets from three sites for comprehensive assessment.
-
2.
We have developed a correspondence between (a) the physical characteristics of dataset and associated performance, and (b) the architectural designs and functioning behaviour of DL models.
-
3.
We have provided specific recommendations towards the selection of a DL model for vegetation points segmentation considering scene complexity and per-point features. Further, we have identified the limitations of DL models while proposing resolutions for better representation and enhanced segmentation accuracy. The suggested components will facilitate a novel architecture for vegetation points segmentation.
II Related Works
Multiple DL architectures have been conceptualized for effective semantic segmentation of point cloud data. There are some projection-based methods [15, 16, 17, 18, 19] which convert the raw point cloud into images before utilizing 2D CNN for feature learning. Inherent structure and geometrical properties of point cloud are lost while taking projections. Another class of methods are voxel-based [20, 21, 22] which arrange the point cloud into regular 3D grids called voxels before resorting to 3D CNN for extracting semantic characteristics. These methods are computationally expensive as the number of voxels increase cubically with resolution. To effectively leverage the rich contextual relationship between points, Graph Convolution Networks (GCNs) [23, 24, 25, 26] are proposed. Then there are some attention-based methods [27, 28, 29, 30, 31, 32] capable of learning enhanced feature representation through long range relationships between points. Finally we have point-based methods which operate on points directly learning per-point features through Multi-layer Perceptron (MLP) or aggregate local features through convolution or utilize a combination of both. Point-based methods can be classified into the following categories:
II-A Point-Wise Deep Learning Based on MLP
These methods employ MLP to map per-point features to a high-dimensional embedding space. The concept was pioneered by PointNet [33]. It uses shared MLP to learn point-wise features while applying max-pooling to obtain a global feature vector for classification. For segmentation, this is concatenated with intermediate feature maps before employing MLP for dimensionality reduction. Symmetric function and T-Net were used for attaining permutation and translation invariance, respectively. Further, PointNet++ [34] was proposed by the same authors to exploit the semantic characteristics of local point features derived from the K-nearest neighbors point set. In PointNet++, the K-nearest neighbors may fall in one orientation. To resolve this, Jiang et al. [35] designed PointSIFT for enhanced local feature representation. PointSIFT module consists of orientation sensitive units capable of encoding scale adaptive information from different orientations. It can be integrated in the PointNet architecture to learn rich semantic features. To extract discriminative contextual features from local neighborhood, Zhao et al. [36] proposed PointWeb. PointWeb consists of Adaptive Feature Adjustment (AFA) module to aggregate features by adaptively learning the impact map signifying element-wise impact indicator between point pairs. To make the best use of local contextual features, some models have been proposed to leverage the geometrical correlation between neighboring points. RandLANet [37] utilizes shared MLP with Local Feature Aggregation (LFA) module to learn per-point semantics. Features are concatenated with their spatial locations while increasing the receptive field for better representation of neighborhood. To resolve the issue of orientation sensitive features, SCFNet [38] was proposed. It uses local polar representation in concatenation with absolute coordinates. Both feature and geometric distances are combined before employing volume ratio for global contextual features.
II-B Point-Wise Deep Learning Based on Convolution
KPConv [39] or Kernel Point Convolution applies the convolution operation directly on the input points without any intermediate representation of an MLP. Input points are mapped to uniformly distributed kernel points within a spherical domain. These kernel points learn weights in correspondence to the relative position of kernel points and original point cloud. KPConv can be applied in rigid or deformable configurations. In rigid variant of KPConv, the kernel points are constrained to stay within the sphere at predetermined locations while in deformable version, the location of kernel points is learnable. As part of upsampling, nearest neighbor has been employed. To improve the upsampling process of KPConv, Gong et al. [40] proposed Receptive Field Component Reasoning (RFCR). It generates target Receptive Field Component Codes (RFCC) to represent existing categories within the receptive field at different layers during the convolution and down-sampling operations. During the decoding stage, the network will reason these RFCCs to have an omni-scale supervision for the predicted semantic labels. To learn rich semantic contextual features, Dense connection-based Kernel Point Network (DenseKPNet) [41] was proposed. It consists of multi-scale KPConv module to extract multilevel features while increasing the receptive field for effective segmentation. Kernel Point Convolution Attention Module (KPCAM) has been added to aggregate local and global semantic features.
II-C Point-Wise Deep Learning Based on a combination of MLP and Convolution
PointConv [42] uses MLP and inverse density scale to extend the discretized convolutional filters to continuous point cloud. The network feeds the kernel density estimation into an MLP for computing inverse density and achieves permutation invariance by sharing the weights across all points again by an MLP. SpiderCNN [43] parameterized the convolutional filters as a product of step functions to capture the coarse geometry defined by local geodesic information and Taylor polynomial to express intricate geometric variations. SpiderCNN has been shown to be efficient in association with PointNet. PointCNN [44] employs the X-Conv operator, which combines the X-transformation with the convolution operation. With X-Conv, the input features associated with points are weighed and permuted into a canonical order, followed by the convolution operation on the transformed features.
With regard to separating vegetation points from the remaining points, Pu et al. [45] used several characteristics of point cloud segments such as shape, size, orientation and topological relationships. Zhang et al. [46] used Normalized Difference Vegetation Index (NDVI) values derived from hyperspectral data in combination with Airborne Laser Scanning (ALS) data to separate vegetation points. Li et al. [47] used machine learning based detectors trained on statistical features such as width, depth, elevation, density and others, for segregating vegetation points from MLS point cloud data. Although these studies have similar objectives, the approach is heuristic [45], suffers from lower resolution problem [46], or utilizes hand-crafted features [47]. Concerning the vegetation points segmentation using DL models, Luo et al. [10] have performed such binary semantic segmentation by using the network MS-RRFSegNet [48]. However, the selected network was chosen arbitrarily and has been unable to demonstrate dominant results among the selected models. Subsequently, the selection of an appropriate DL model for vegetation points segmentation remains contentious. To resolve the issue, we have performed benchmarking study involving four DL models.
To accommodate the wide range of models, we have selected some representative DL models from each category of point-based methods. Further, the models are selected owing to their strong performance on outdoor point cloud benchmark datasets such as Semantic3D [3]. The shortlisted models offer adequate potential for vegetation points segmentation and differ considerably in terms of their approach and architectural designs. The selected models are PointCNN, KPConv (omni-supervised), RandLANet and SCFNet. It may be noted that KPConv (omni-supervised) with deformable kernel points, has been implemented which is a modified version of KPConv [39]. For simplicity, deformable KPConv (omni-supervised) will be herein referred to as KPConv within the scope of this manuscript. Although, RandLANet and SCFNet belong to a single category but they differ significantly in terms of employed modules.
III Materials and Methods
To comprehensively demonstrate the effectiveness of DL models for vegetation points segmentation, three different MLS datasets have been employed, namely, Chandigarh, Toronto3D [5] and Kerala. Toronto3D is an open dataset while the remaining two are developed in-house. Chandigarh and Kerala datasets have been manually labeled into large number of classes and are available at LiDAVerse.com. The concerned datasets will be published soon and available for researchers. These will be the first of their kind datasets with objects being segmented at instance level. With Chandigarh and Kerala belonging to northern and southern parts of India, respectively, it is pivotal to accommodate the diversity in vegetation. Kerala dataset has the highest point density followed by Chandigarh and Toronto3D datasets in order.
III-A Datasets
III-A1 Chandigarh
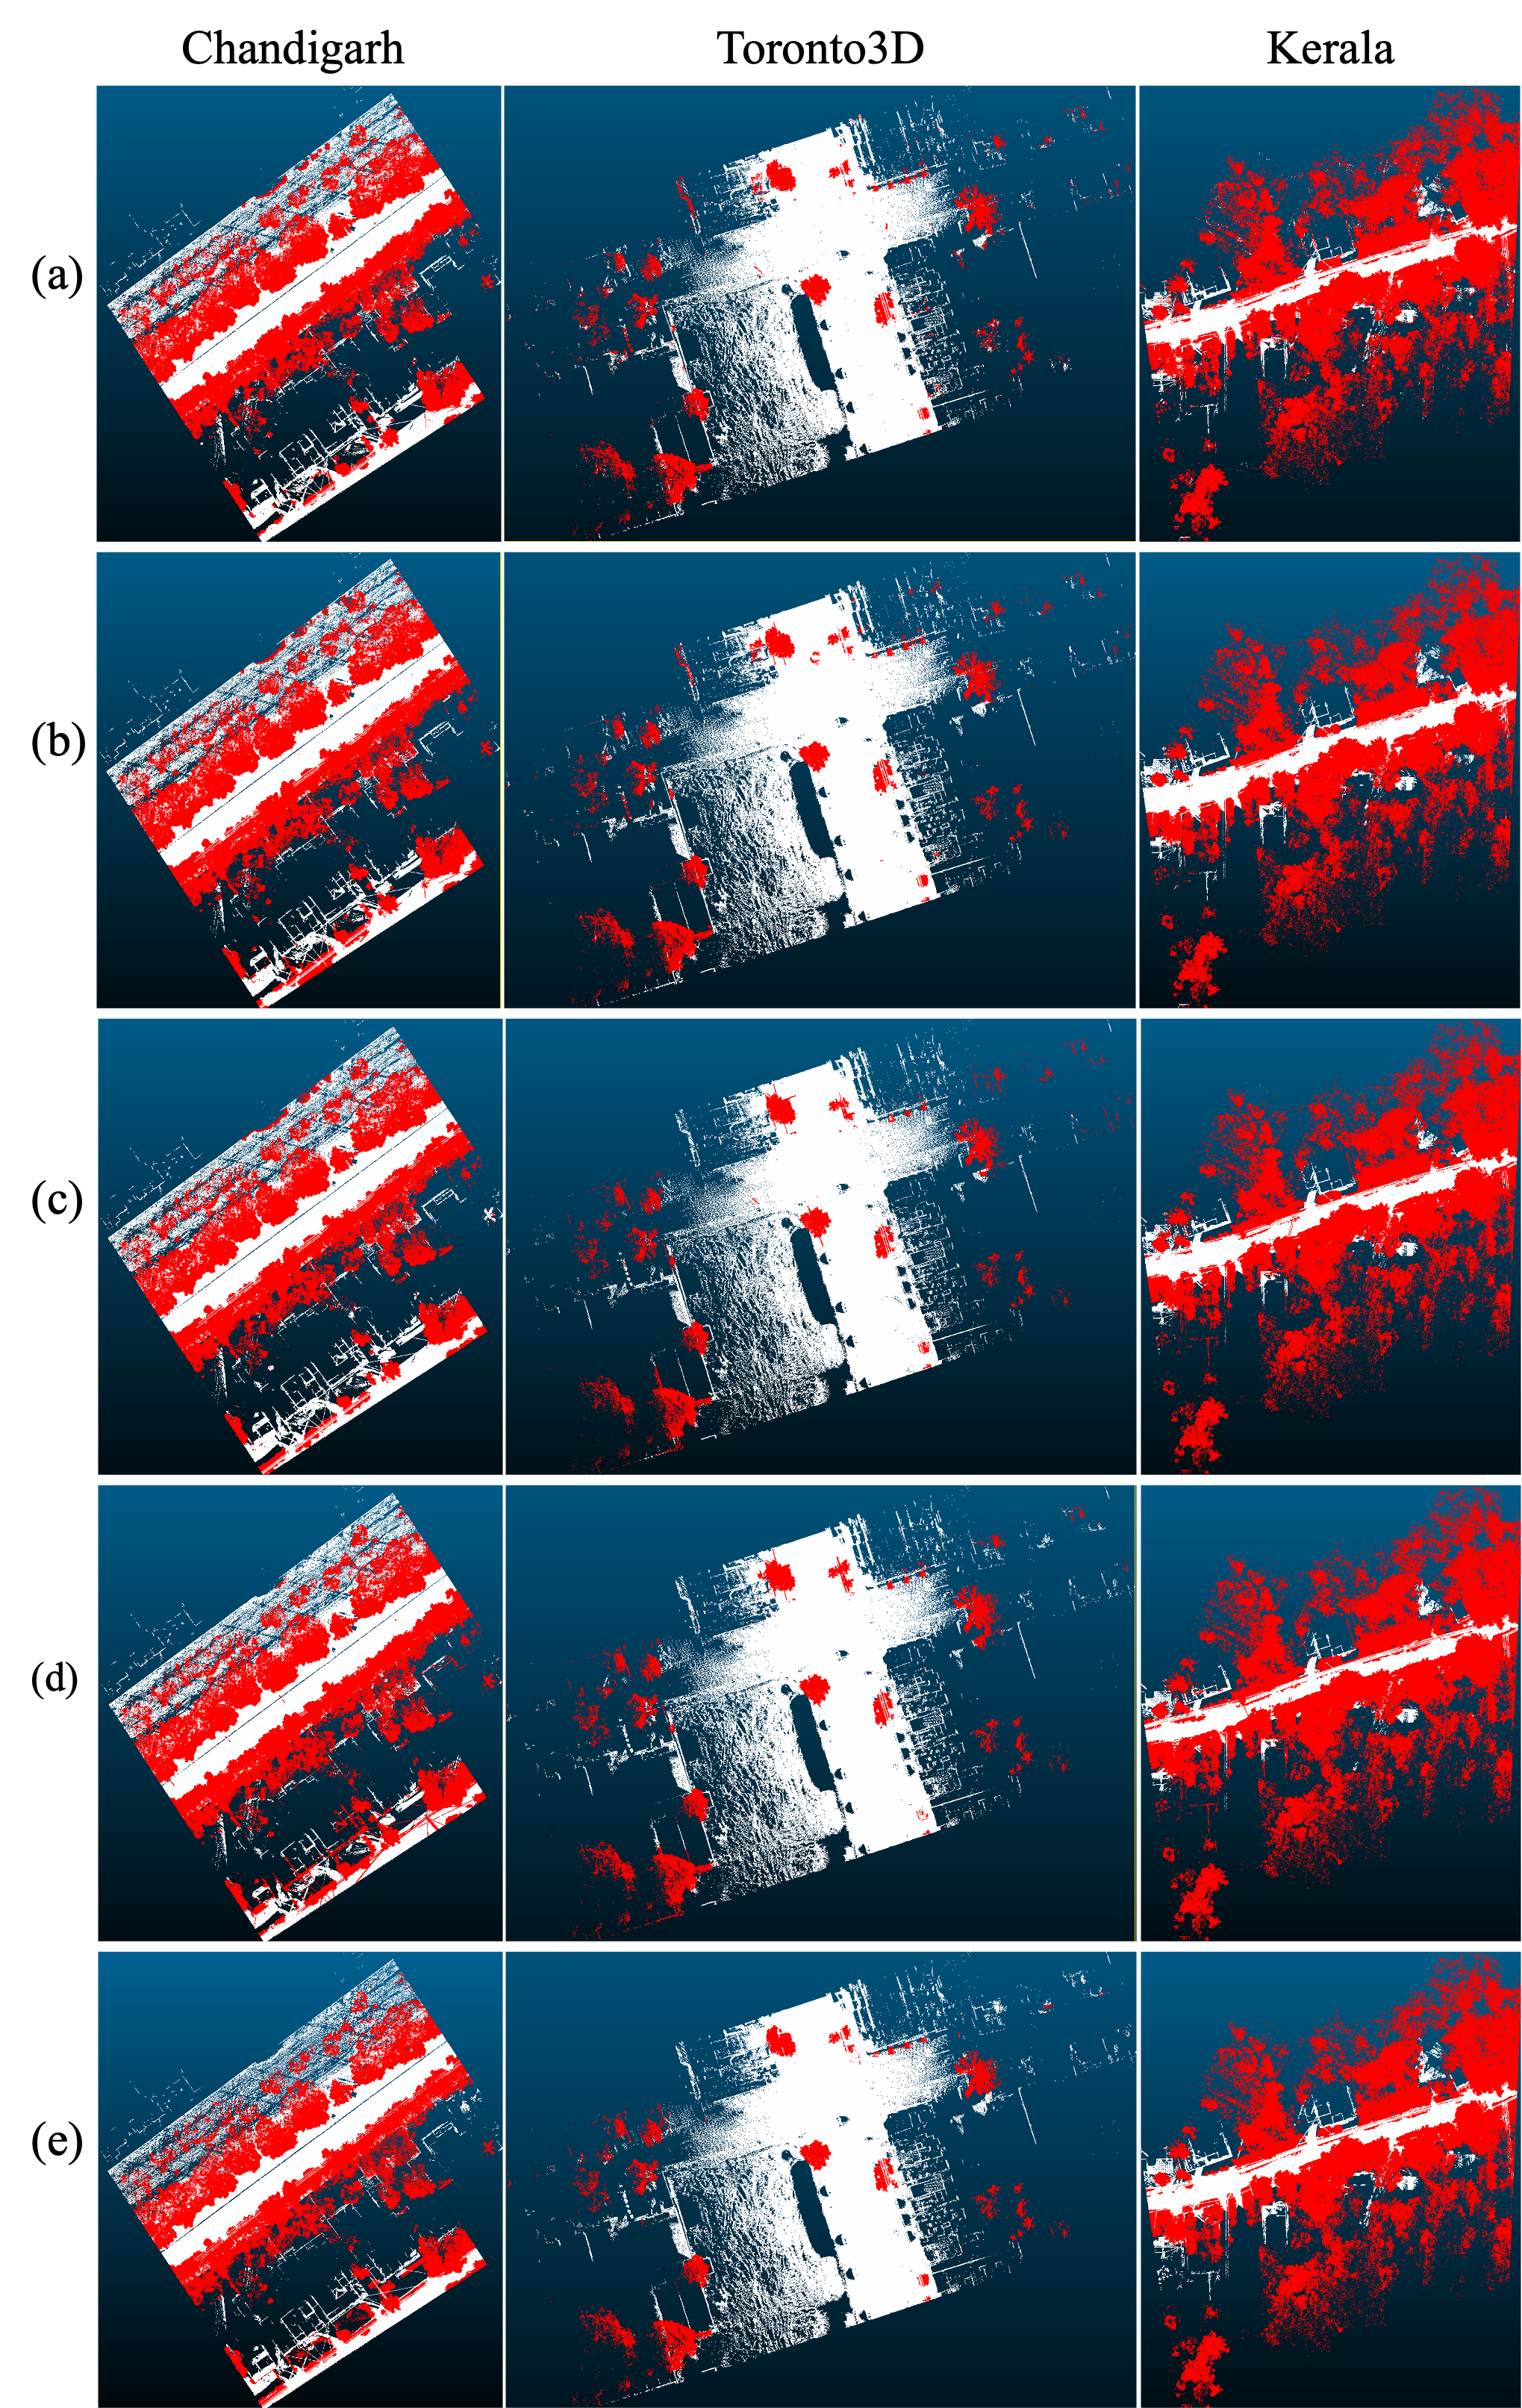
Chandigarh dataset has been acquired by a vehicle mounted MLS system (Riegl VQ-450) in the city of Chandigarh, India by Geokno India Private Limited. The field of view (FOV) was 360∘ while the scan rate and pulse rate were 200 lines/sec and 380 kHz, respectively. The LiDAR range was 330 meters. The data covers a distance of around one kilometer with nearly 195 million points. Each point has five attributes including X, Y, Z, I and class label. These attributes are also referred to as original per-point features in this manuscript. The dataset represents a typical well-planned urban environment with low scene complexity. It covers a wide road with regularly planted trees on both sides accompanied by a boundary wall spanning alongside. The dataset has been processed to represent two classes, namely, vegetation and non-vegetation. A segment of Chandigarh data is shown in Fig. 1(a). The average proportion of vegetation points out of the total points in the dataset is 37.32% (Fig. 2).
III-A2 Toronto3D
Toronto3D [5] is a large scale publicly available point cloud dataset collected by a vehicle mounted MLS system (Teledyne Optech Maverick) in Toronto, Canada. The data represents the urban outdoor environment with low scene complexity. The data consists of around 78 million points collected across a stretch of one kilometer. The data has been segmented into eight classes such as road, road marking, building, natural, utility line, car, fence and unclassified points. Each point has eight attributes including X, Y, Z, I, R, G, B and class label. There is a large variation of point density in the dataset because of the repeated scans at some portions and far range measurements. A segment of Toronto3D data is shown in Fig. 1(b). The average proportion of vegetation points out of the total points in the dataset is 11.73% (Fig. 2).
III-A3 Kerala
Kerala dataset has been captured in the state of Kerala, India with the help of Riegl VQ-450 mounted on an SUV (Tata Xenon) by Geokno India Private Limited. The FOV was 360∘ while the scan rate and pulse rate were 200 lines/sec and 550 kHz, respectively. The LiDAR range was 200 meters. The data has been collected for around one kilometer and consists of about 222 million points. Each point has five attributes including X, Y, Z, I and class label. The dataset represents an environment encompassing a road covered with dense vegetation on both sides with intermittent settlements. The dataset exhibits high scene complexity on account of numerous object categories and multifaceted vegetation. On similar lines to Chandigarh dataset, the data has been processed to represent two classes, namely, vegetation and non-vegetation. A segment of Kerala data is shown in Fig. 1(c). The average proportion of vegetation points out of the total points in the dataset is 60.75% (Fig. 2).
III-B Models
Four representative DL models have been selected, at least one from each category of point-based methods for the binary segmentation process. These are PointCNN, KPConv (omni-supervised), RandLANet and SCFNet.
III-B1 PointCNN
As convolution cannot be directly applied to irregular and unordered point clouds, PointCNN [44] uses an X-Conv operator, which is a combination of X-transformation and convolution operation. X-Conv weighs and permutes the input features associated with the points into a canonical order with X-transformation. Further, it applies the convolution operation on the transformed features. X-Conv is applied in a hierarchical manner to aggregate the features from the local neighborhood into a set of representative points but each with rich semantic features. Farthest point sampling has been utilized for segmentation as it provides a uniform distribution of sampled points.
III-B2 KPConv (omni-supervised)
Kernel Point Convolution (KPConv) [39, 40] performs the convolution operation directly on the input points without any intermediate representation of an MLP. It maps the input points to uniformly distributed kernel points in a spherical domain around each point. Weights are learned by these kernel points along with a correlation factor, which are dependent on the relative positions of kernel points and the original point cloud. Grid subsampling has been used to accommodate varying densities in input data while increasing the cell size in subsequent layers to expand the receptive field. During the decoding stage, the network will reason RFCCs to have an omni-scale supervision for the predicted semantic labels.
III-B3 RandLANet
RandLANet [37] is an efficient and lightweight neural architecture to segment large-scale point clouds. It utilizes random point sampling and a Local Feature Aggregation (LFA) module to infer per-point semantics. LFA consists of a Local Spatial Encoding (LocSE) unit to embed the coordinates so that the features are aware of their relative spatial locations. Further, there is an Attentive Pooling (AP) block to aggregate features and Dilated Residual Block (DRB) to increase the receptive field to preserve geometric details. Initially grid subsampling has been employed followed by random sampling for downsampling procedures. For upsampling, nearest neighbor has been utilized in the decoder part with skip connections.
III-B4 SCFNet
SCFNet [38] is a neural architecture to learn effective features from large-scale point clouds to provide better representation of neighborhood. It employs a Local Polar Representation (LPR) block to furnish a z-axis rotation invariant spatial representation to accommodate orientation sensitive features. In addition, there is a Dual Distance Attentive Pooling (DDAP) block to learn differentiating features considering both the geometric and feature distances. Finally, there is a Global Contextual Feature (GCF) block which takes into account the volume ratio of neighborhood to the global point cloud. To begin with, grid subsampling was employed, followed by random sampling for downsampling operations. As part of upsampling, nearest neighbor has been applied in the decoder part with skip connections.
III-C Evaluation Metrics
Overall Accuracy (OA) (Eq. 1), Intersection over Union (IoU) (Eq. 2) and mean Intersection over Union (mIoU) (Eq. 3) are used to evaluate the performance of models. OA gives the proportion of correctly segmented points out of the total number of points in the dataset [49]. However, it does not takes into account class-imbalance as well as the potential costs associated with incorrect segmentation [50]. To address the issues, IoU has been used. IoU compensates for varying class frequencies and is indicative of the alignment between the predicted and original point cloud for a particular class [51]. The mIoU is calculated by averaging the IoU values across all classes. These metrics are defined as follows:
| (1) | ||||
| (2) | ||||
| (3) |
where TP, TN, FP and FN denote the true positives, true negatives, false positives and false negatives, respectively. i represents a particular class and n is the number of classes which is two in our case.
IV Experimental Results and Discussion
IV-A Methodology and Implementation Details
The experimentation is a three-step procedure (Fig. 3). In the first step, the available labeled datasets from LiDAVerse.com and the Toronto3D dataset, are relabeled to represent only two classes namely, vegetation and non-vegetation. In the next step, all the three datasets are divided into ten tiles for training and testing purposes. In a single experiment, nine tiles are used for training and validation while the remaining single tile is used for testing. In the final step, the four DL models are implemented in a ten-fold cross validation mode where every tile has the opportunity to act as a testing tile while the other nine are used for training. The experiments have been performed on TensorFlow framework utilizing a Nvidia Tesla V100 (32 GB) and processor Intel Xeon Gold 5218 2.30 Ghz X 32. Further details on implementation are mentioned in Tab. I.
| Hyperparameters | PointCNN | KPConv | RandLANet | SCFNet |
|---|---|---|---|---|
| Epochs | 50* | 250 | 50 | 50 |
| Batch Size | 12 | 16 | 4 | 3 |
| Optimizer | Adam | MGD | Adam | Adam |
| Learning Rate | 0.01 | 0.001 | 0.01 | 0.01 |
IV-B Semantic Segmentation Results by Datasets
Dataset-wise segmentation results (Tab. II) have been presented for assessing the behaviour of the models with changing data characteristics such as scene complexity, vegetation diversity and proportion of vegetation points in the dataset. Scene complexity is described by the number of different object categories occurring along with their configuration in the dataset, and variation in objects within a category as well. At large, scene complexity seems to be one of the most important factors affecting the behaviour of models. Chandigarh and Toronto3D datasets with relatively less complex scenes, are demonstrating better results than those of the Kerala dataset.
IV-B1 Chandigarh
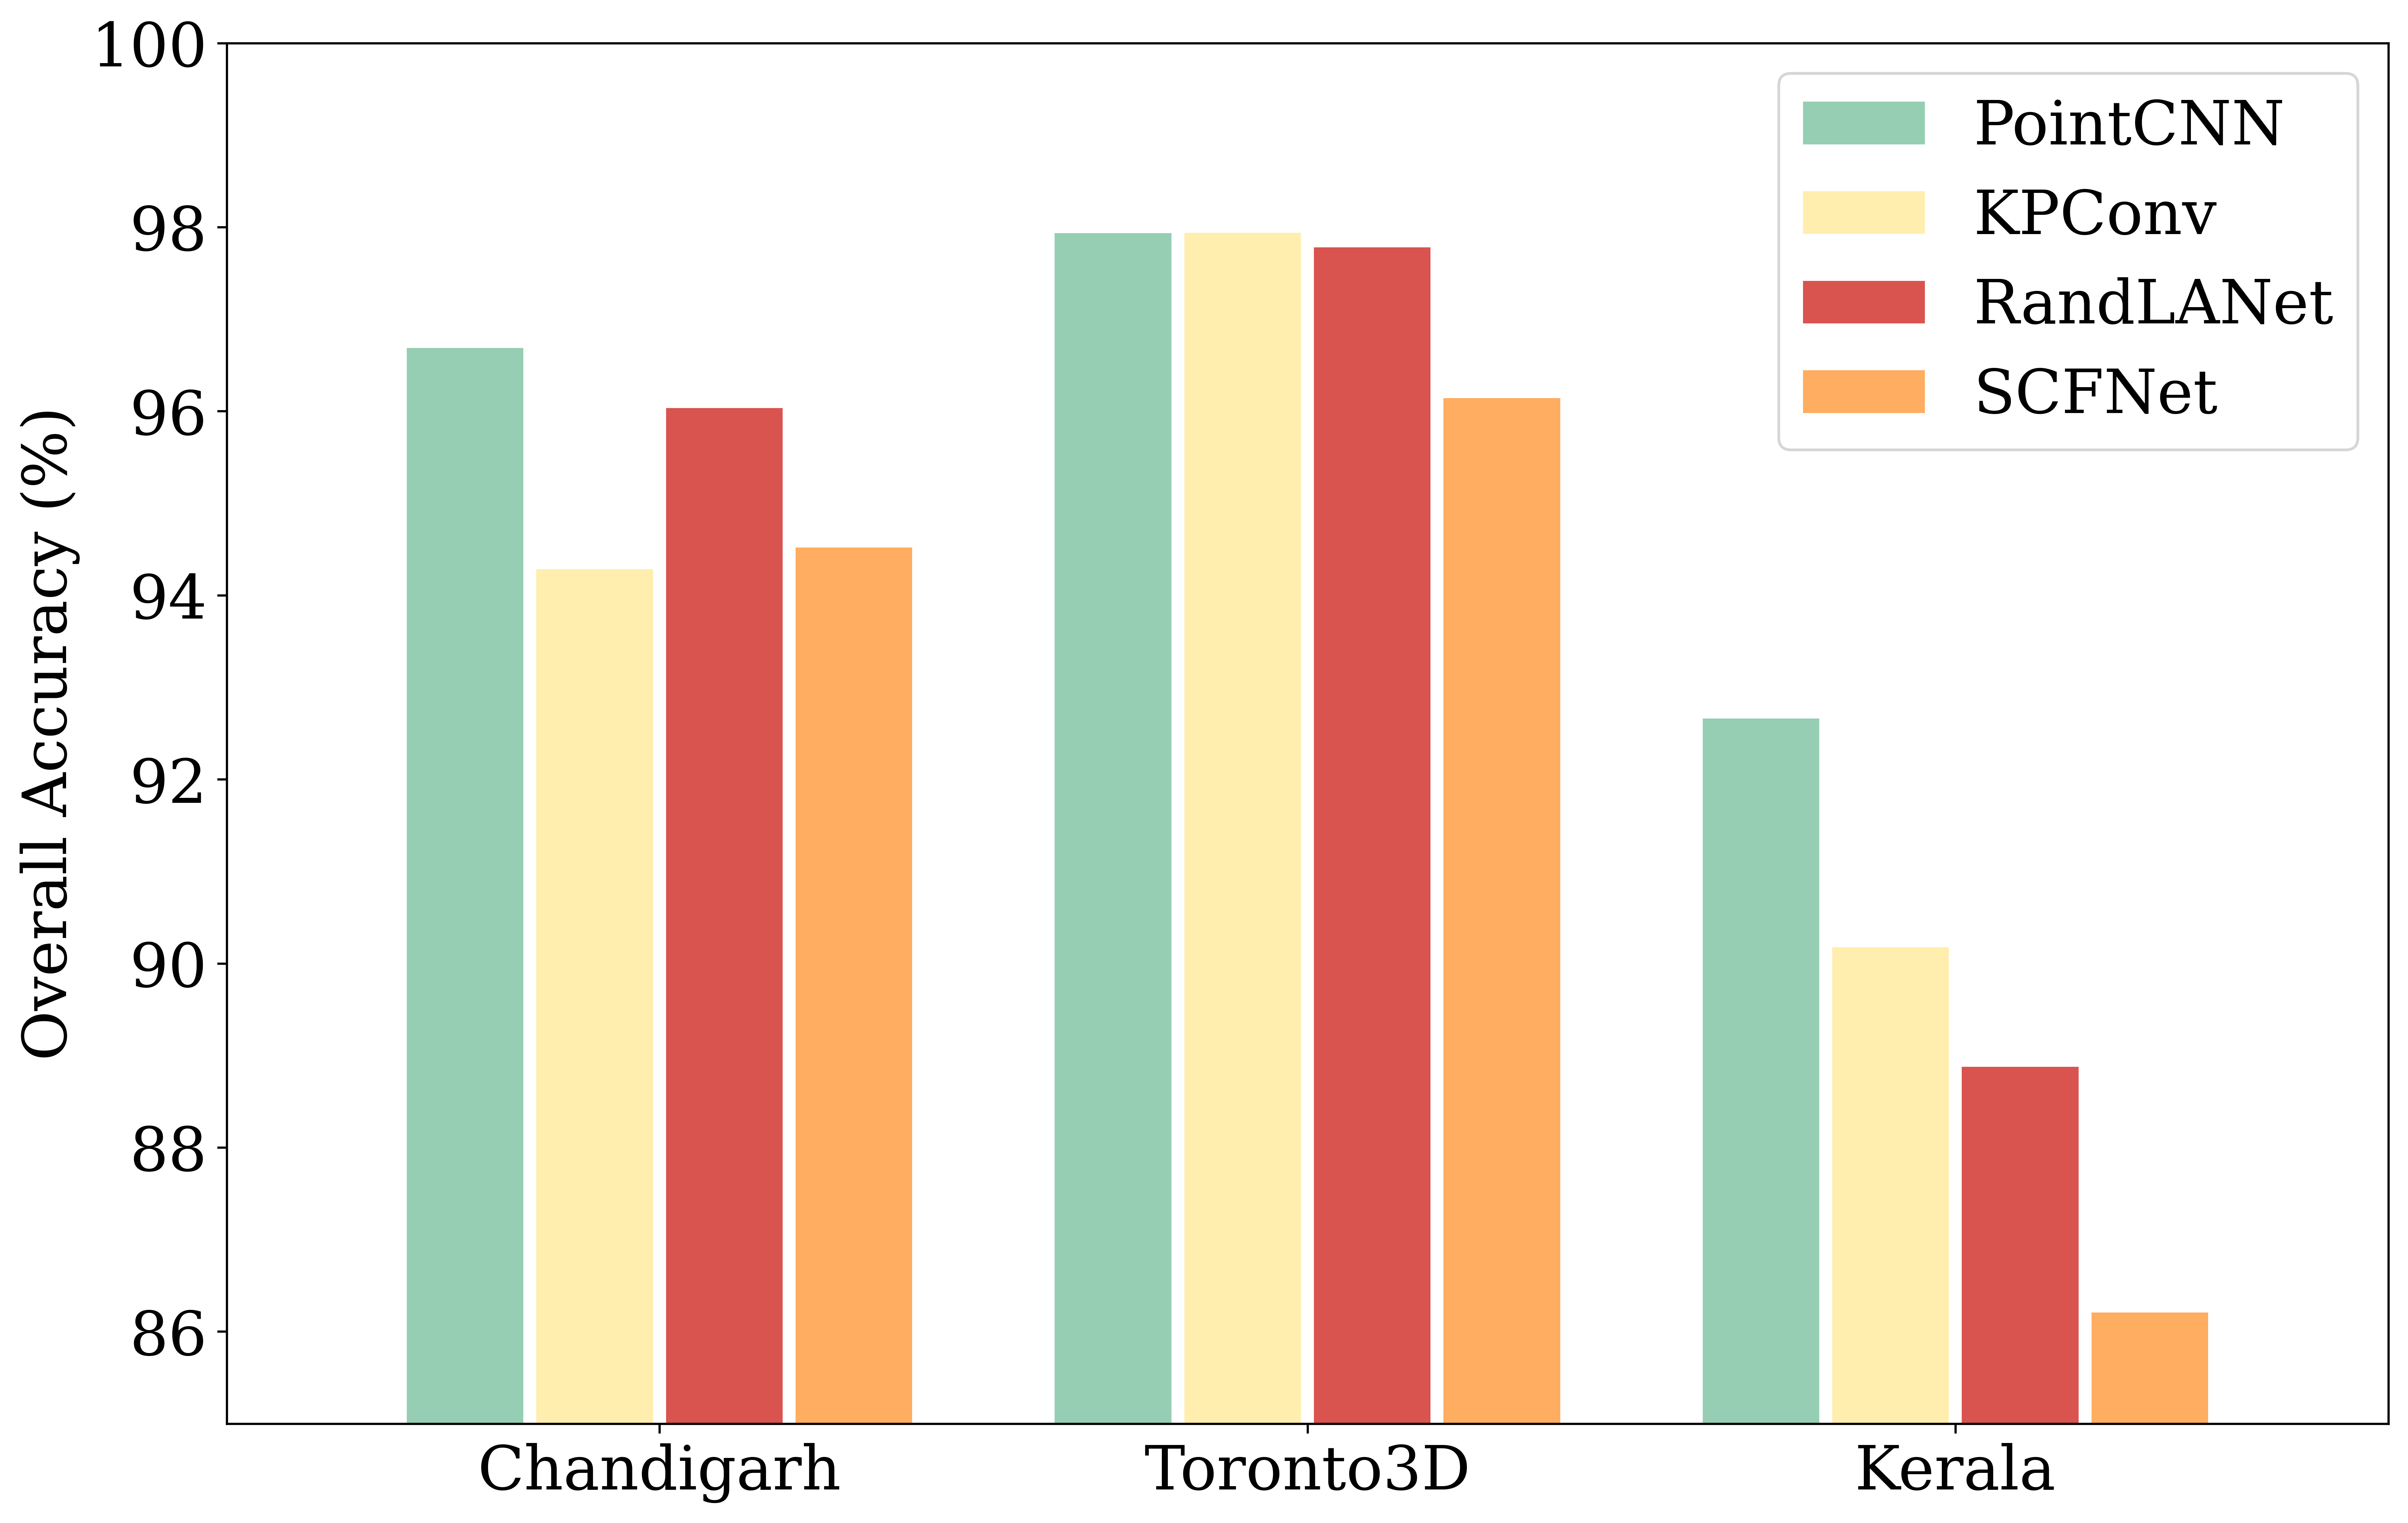
In general, highest mIoU values are observed for the Chandigarh dataset (Fig. 4). This is expected as Chandigarh is a planned city with vegetation planted almost uniformly along the roads without much species level diversification. Further, the scenes are relatively more organized and structured for the Chandigarh and Toronto3D datasets as compared to the Kerala dataset. For the Chandigarh dataset, the OA values are consistent with mIoU observations (Fig. 5).
IV-B2 Toronto3D
Second highest mIoU values are observed for the Toronto3D dataset (Fig. 4). The data has been collected from a systematic and coordinated urban road environment. However, the declining numbers can be attributed to significantly lower proportion of vegetation points in the Toronto3D dataset. Further, the vegetation points appear in a scattered manner, mostly at a distance from the roads. With regard to OA, leading values are observed for the Toronto3D dataset (Fig. 5). Again, this can be attributed to the significantly lower proportion of vegetation points in the dataset. With OA not balancing different class frequencies and being biased towards large classes, inflated results are observed in case of high class-imbalance situations [50].
IV-B3 Kerala
Further reduction in mIoU values for the Kerala dataset can be explained by its composition in terms of number of object categories (Fig. 4). The dataset exhibits complex environment comprising large number of object categories with high variability within these categories. Further, it is characterized by multifaceted vegetation both in terms of genus and structural characteristics, which are intricately blended. For this dataset, OA values are consistent with mIoU observations (Fig. 5).
It may be noted that for a particular dataset, the difference between the mIoU for the models is broadening with increasing scene complexity (Fig. 4), again emphasizing the importance of scene complexity towards the performance of models. Chandigarh and Toronto3D datasets, with organized environment, have relatively lower variance as compared to the Kerala dataset with complex scenes.
| Models | mIoU | OA | IoU Veg | IoU N-Veg | Time | ||
|---|---|---|---|---|---|---|---|
| Chandigarh | PointCNN | 93.32 | 96.69 | 91.70 | 94.93 | 92.86 | 07.0 |
| KPConv | 89.16 | 94.28 | 87.03 | 91.28 | 87.87 | 18.0 | |
| RandLANet | 92.08 | 96.03 | 90.37 | 93.79 | 91.51 | 06.0 | |
| SCFNet | 89.47 | 94.52 | 87.33 | 91.63 | 88.35 | 06.5 | |
| Toronto3D | PointCNN | 89.22 | 97.93 | 80.87 | 97.56 | 88.05 | 04.0 |
| KPConv | 91.26 | 97.94 | 84.99 | 97.52 | 90.43 | 12.0 | |
| RandLANet | 88.98 | 97.78 | 80.54 | 97.43 | 87.44 | 05.0 | |
| SCFNet | 85.61 | 96.14 | 75.59 | 95.62 | 82.51 | 03.5 | |
| Kerala | PointCNN | 85.68 | 92.66 | 88.59 | 82.77 | 84.45 | 08.0 |
| KPConv | 81.14 | 90.18 | 85.60 | 76.68 | 78.75 | 21.0 | |
| RandLANet | 78.64 | 88.88 | 84.13 | 73.15 | 75.82 | 04.5 | |
| SCFNet | 74.25 | 86.21 | 81.32 | 67.17 | 69.30 | 03.5 |
IV-C Semantic Segmentation Results by Models
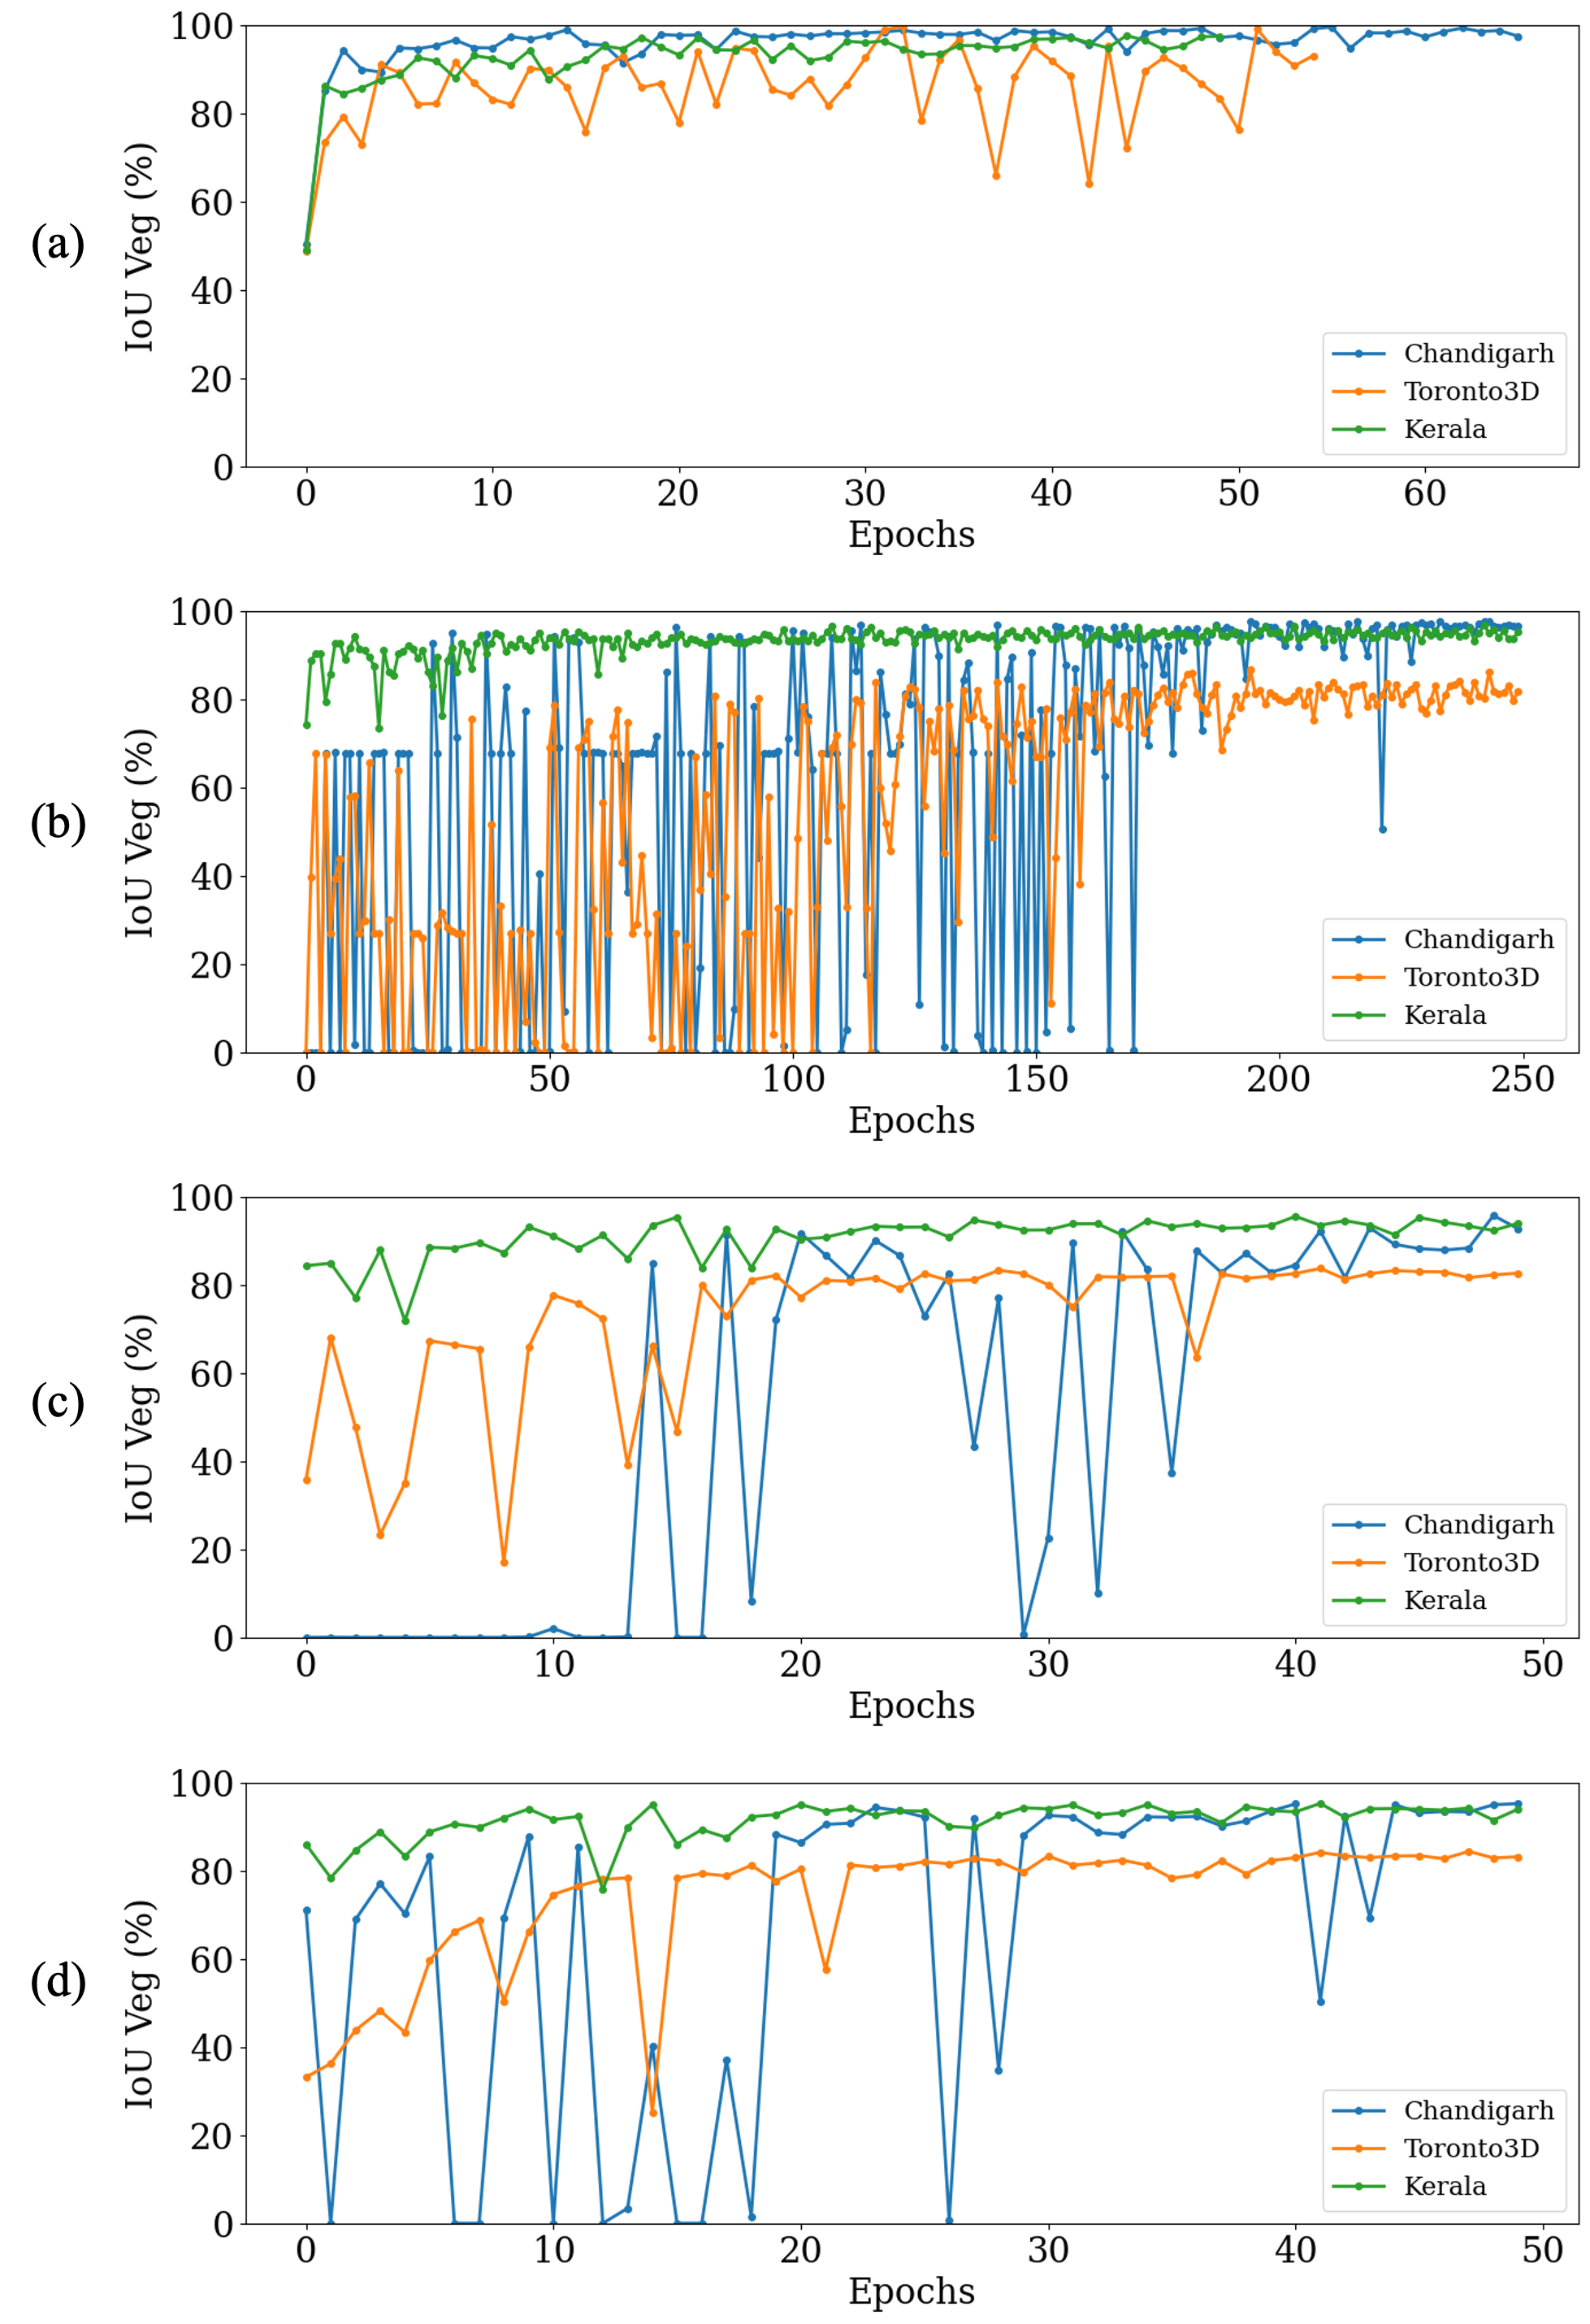
Model-wise segmentation results have been presented for assessing the behaviour of the models with regard to their architectural designs, number of epochs (Fig. 6), time consumption, computational resource utilization and original per-point features in the datasets. Original per-point features are described as initial attributes available with each point in the dataset such as coordinates (X, Y, Z), colors (R, G, B), Intensity (I) and labels. Binary segmentation results have been shown in Fig. 7.
IV-C1 PointCNN
In spite of being conceptualized earliest among the selected models, PointCNN [44] is still furnishing the highest mIoU values on Chandigarh and Kerala datasets. Further, PointCNN has shown second highest mIoU value on the Toronto3D dataset. This robust performance may be explained by the combination of MLP and convolution, integrated by the network. Initially, the model transforms the point features to a higher dimension with an MLP before using convolution to exploit the spatial relationships between them.
In terms of the number of epochs, the model converges with 50 epochs on all the datasets (Fig. 6). The convergence is explicit for Chandigarh and Kerala datasets. However, there has been some fluctuation in the case of Toronto3D dataset. This can be attributed to lower proportion of vegetation points in the Toronto3D dataset. Five tiles of the Toronto3D dataset have less than seven percent of vegetation points out of total points (Fig. 2). When the network subsamples a set of 2048 points from each training tile, the proportion of vegetation points is considerably lower. A single batch consists of 12 sets of 2048 points. This proportion varies between batches, resulting in fluctuating behaviour of IoU for vegetation. Due to the X-Conv operator integrating MLP and convolution along with permutation for canonicalization, the model becomes quite complex. Consequently, the network becomes time consuming and computationally intensive.
IV-C2 KPConv (omni-supervised)
KPConv [40] is furnishing the highest mIoU values on the Toronto3D dataset. This can be attributed to the increased parameters or original per-point features, associated with each point in case of Toronto3D dataset. The kernel-based convolution operation seems to be effective with increasing per-point features. Moreover, increased original per-point features generates effective target RFCCs during the encoding stage, supplementing the performance of the network.
With regard to the number of epochs, convergence is observed with 100 epochs for the Kerala dataset, and 250 epochs for both the Chandigarh and Toronto3D datasets (Fig. 6). However, the model has been operated for 250 epochs for each dataset. This variation in epochs can be explained by the proportion of vegetation points in the dataset. With greater proportion of vegetation points, the possibility of superimposing randomly initialized spherical kernels on vegetation points is higher, leading to faster learning and convergence. However, the convergence is slower as compared to other employed models. In general, larger epochs for convergence, can be described by the convolution operation with spherical kernels comprising deformable points. In a single epoch, the network initiates 5000 spheres and learns features for segmentation [39]. Further, each epoch is carried out in 500 optimizer steps, making the network time consuming and computationally expensive.
IV-C3 RandLANet
Although not showing the best performance, RandLANet [37] can be a preferred model in various scenarios exhibiting less scene complexity, typically in planned cities with organized environment and limited object categories. The model has shown second highest mIoU value on Chandigarh dataset. Moreover, the mIoU value for the Toronto3D dataset, is comparable to that of PointCNN. Also, the network is effective in scenarios of less vegetative heterogeneity and limited original per-point features. Designed for faster processing of large-scale point clouds, it has shown appreciable outcomes for vegetation points segmentation. The performance seems to enhance with reducing scene complexity while closing the gap with leading performer. Local Feature Aggregation (LFA) module effectively preserves the complex local geometric structures from an expanded neighborhood.
Concerning the number of epochs, RandLANet seems to converge well with 50 epochs on all datasets (Fig. 6). Further, utilization of random sampling and feed-forward MLP based modules, makes the model lightweight and highly efficient in terms of time and resource consumption.
IV-C4 SCFNet
Despite being one of the recent architectures and showing dominant performance on the Semantic3D dataset [3], SCFNet [38] seems to have issues with the vegetation points segmentation, showing the least favourable results. The model has yielded lowest mIoU values on all the datasets. This may be associated with the Global Contextual Feature (GCF) block integrated in the architecture. GCF block concatenates the location and volume ratio pertaining to local neighborhood. Volume ratio has been defined as the bounding sphere of the neighborhood to the bounding sphere of the entire point cloud in the global feature context. It considers that this ratio will not change while moving on a particular object but will change at the interface of two objects with changing densities of points. It could be effective to extract the boundaries of objects such as buildings, roads, pavements and poles where the point distribution is uniform for the object. This can be observed from the semantic segmentation results of the network on the Semantic3D dataset [3]. However, the varying density of points within the vegetation canopy seems to work in a contrary manner. Non-uniform distribution of points within a vegetation canopy will be misinterpreted as different objects particularly by the GCF block, rendering the network ineffective for vegetation points segmentation.
With reference to the number of epochs, the model seems to converge well with 50 epochs on all datasets (Fig. 6). Further, the network is efficient with respect to time and computational resources, owing to the incorporation of random sampling and feed-forward MLP based modules in the architecture.
IV-D Towards a Novel Architecture for Vegetation Points Segmentation
An urban environment is typically characterized by varying amounts of vegetation points. However, this variation may reach its extreme for some areas. Proportion of vegetation points could be significantly lower for some portions while the same can be considerably high for other regions. Similarly, the diversity can assume extreme within the vegetation itself. Some areas may exhibit homogeneous vegetation while others may express remarkably distinct vegetation points. A novel architecture should be capable of incorporating all these possible variations, within the vegetation as well as the urban environment. For the novel architecture, the vegetation points not only include points representing trees, but also points belonging to hedges, bushes and undergrowth.
Furthermore, vegetation points are the only naturally occurring objects in the urban setting. Natural objects exhibit distinctive geometrical characteristics to man-made objects which can be assimilated by a novel architecture. Vegetation point clouds exhibit a characteristic arrangement of points within the canopy that can be exploited to separate them from other classes. The laser pulses can penetrate the canopy through gaps, supplying points from the surface as well as from inside the canopy [52]. The scheme of points within canopy, will differ with varying species, orientation and location. However, this arrangement of points is fundamental to vegetation and separates it from other classes in an urban setting, thus offering a potential for their effective segmentation. The subsampling techniques employed by the selected DL models such as grid sampling or farthest point sampling [44, 40, 37, 38] result in uniform distribution of points. This potentially discards the key distinguishing feature of points distribution within the canopy. The dedicated architecture for vegetation points segmentation should employ learnable sampling method [53] that could effectively harness this differentiating pattern.
On account of architectural design, a network employing both MLP as well as convolution operations is recommended. This will ensure effective learning of rich semantic characteristics, necessary for segmentation. However, the complexity introduced by such a network can be reduced by the manner of implementing MLP and convolution, typically in a sequential fashion. Further, the architecture may be integrated with specialized modules to preserve geometrical characteristics of neighboring points. Moreover, it should have the ability to expand receptive fields in order to consider wider neighborhood. Inspired by [40], the architecture can employ some intelligent mechanism for upsampling procedures, instead of utilizing the commonly used nearest neighbor approach. These components will be crucial to the novel architecture, enabling enhanced segmentation performance as compared to the existing architectures. Essentially, the dedicated architecture has to be concerned with learning effective features for distinguishing vegetation from remaining points regardless of its ability to differentiate other classes.
V Conclusion
Declining vegetation amid the expanding city footprints and deteriorating environment, necessitates their mapping for proper management strategies, particularly in urban setting. DL for point cloud segmentation has shown significant progress recently, offering state-of-the-art results on various benchmark datasets. These benchmark datasets comprise several classes with DL models aiming to achieve higher mIoU values. However, class specific segmentation with respect to vegetation points has not been explored. Accordingly, the selection of a DL model while dealing with vegetation points segmentation, is ambiguous. To resolve the problem, we have performed a benchmarking study with four representative point-based DL models, namely PointCNN, KPConv (omni-supervised), RandLANet and SCFNet. To comprehensively demonstrate the effectiveness of models, datasets from three study sites are employed, specifically Chandigarh, Toronto3D and Kerala, characterizing multifaceted vegetation along with varying scene complexity and per-point features. The experimentation has been performed in a ten-fold cross validation mode. Binary segmentation results have been presented in both dataset-wise and model-wise manner, to gain the necessary insights.
Dataset-wise results indicate that scene complexity is one of the most important factors affecting the behavior of models. Chandigarh and Toronto3D datasets, with more organized and structured scenes, are demonstrating better results than those of the Kerala dataset. With reference to model-wise results, specific recommendations have been provided. For datasets exhibiting complex scenes, PointCNN can be preferred when per-point features are limited, while KPConv (omni-supervised) can be adopted with increasing per-point features. In connection with organized and less complicated scenes, RandLANet can be employed irrespective of the per-point features, owing to its effectiveness in terms of time and computational resource consumption. Surprisingly SCFNet, being one of latest architectures and demonstrating state-of-the-art performance on the Semantic3D dataset, has been showing the least favourable results across all the datasets. The lower mIoU values can be attributed to the GCF block integrated in the network.
Our investigations further revealed that with vegetation class being fundamentally different from other classes in terms of point cloud representation, the same can be exploited by a novel architecture for enhanced segmentation performance. With laser pulses penetrating the canopy through gaps, points are acquired from the surface as well as from inside the canopy. This characteristic arrangement of points within the canopy, can be utilized to segregate vegetation points. Moreover, a novel architecture should incorporate the following for better representation and supplementing the segmentation performance:
-
•
Learnable sampling technique.
-
•
Combination of MLP and convolution operation.
-
•
Ability to preserve geometrical characteristics of neighboring points.
-
•
Intelligent mechanism for upsampling procedures.
The future work will involve designing a novel and robust architecture for vegetation points segmentation, by eliminating the limitations of current architectures. The insights gained from this research will be crucial in such developments.
Acknowledgments
We conduct this study as a part of cluster project under the Data Science (DS) Research of Frontier and Futuristic Technologies (FFT) Division of the Department of Science and Technology (DST), Government of India, New Delhi. The authors acknowledge Geokno India Pvt. Ltd. and Chandigarh Administration for providing data from LiDAVerse.com. Further, the authors would like to thank Mobile Sensing and Geodata Science Lab, University of Waterloo, for providing the Toronto3D dataset.
References
- [1] J. Luo, Q. Ye, S. Zhang, and Z. Yang, “Indoor mapping using low-cost MLS point clouds and architectural skeleton constraints,” Automation in Construction, vol. 150, p. 104837, June 2023.
- [2] Y. Wang, Q. Chen, Q. Zhu, L. Liu, C. Li, and D. Zheng, “A Survey of Mobile Laser Scanning Applications and Key Techniques over Urban Areas,” Remote Sensing, vol. 11, p. 1540, Jan. 2019. Number: 13 Publisher: Multidisciplinary Digital Publishing Institute.
- [3] T. Hackel, N. Savinov, L. Ladicky, J. D. Wegner, K. Schindler, and M. Pollefeys, “SEMANTIC3D.NET: A NEW LARGE-SCALE POINT CLOUD CLASSIFICATION BENCHMARK,” ISPRS Annals of the Photogrammetry, Remote Sensing and Spatial Information Sciences, vol. IV-1/W1, pp. 91–98, May 2017.
- [4] X. Roynard, J.-E. Deschaud, and F. Goulette, “Paris-Lille-3D: A Point Cloud Dataset for Urban Scene Segmentation and Classification,” in 2018 IEEE/CVF Conference on Computer Vision and Pattern Recognition Workshops (CVPRW), pp. 2108–21083, June 2018. ISSN: 2160-7516.
- [5] W. Tan, N. Qin, L. Ma, Y. Li, J. Du, G. Cai, K. Yang, and J. Li, “Toronto-3D: A Large-scale Mobile LiDAR Dataset for Semantic Segmentation of Urban Roadways,” in 2020 IEEE/CVF Conference on Computer Vision and Pattern Recognition Workshops (CVPRW), pp. 797–806, June 2020. ISSN: 2160-7516.
- [6] N. Varney, V. K. Asari, and Q. Graehling, “DALES: A Large-scale Aerial LiDAR Data Set for Semantic Segmentation,” in 2020 IEEE/CVF Conference on Computer Vision and Pattern Recognition Workshops (CVPRW), (Seattle, WA, USA), pp. 717–726, IEEE, June 2020.
- [7] J. B. Turner-Skoff and N. Cavender, “The benefits of trees for livable and sustainable communities,” PLANTS, PEOPLE, PLANET, vol. 1, no. 4, pp. 323–335, 2019. _eprint: https://onlinelibrary.wiley.com/doi/pdf/10.1002/ppp3.39.
- [8] T. Alsalama, M. Koç, and R. J. Isaifan, “Mitigation of urban air pollution with green vegetation for sustainable cities: a review,” International Journal of Global Warming, vol. 25, pp. 498–515, Jan. 2021. Publisher: Inderscience Publishers.
- [9] S. Beecham, “Using Green Infrastructure to Create Carbon Neutral Cities: An Accounting Methodology,” Chemical Engineering Transactions, vol. 78, pp. 469–474, Feb. 2020.
- [10] H. Luo, K. Khoshelham, C. Chen, and H. He, “Individual tree extraction from urban mobile laser scanning point clouds using deep pointwise direction embedding,” ISPRS Journal of Photogrammetry and Remote Sensing, vol. 175, pp. 326–339, May 2021.
- [11] D. Gülçin and C. Konijnendijk van den Bosch, “Assessment of Above-Ground Carbon Storage by Urban Trees Using LiDAR Data: The Case of a University Campus,” Forests, vol. 12, p. 62, Jan. 2021.
- [12] Zhirong Wu, S. Song, A. Khosla, Fisher Yu, Linguang Zhang, Xiaoou Tang, and J. Xiao, “3D ShapeNets: A deep representation for volumetric shapes,” in 2015 IEEE Conference on Computer Vision and Pattern Recognition (CVPR), (Boston, MA, USA), pp. 1912–1920, IEEE, June 2015.
- [13] A. Dai, A. X. Chang, M. Savva, M. Halber, T. Funkhouser, and M. Nießner, “Scannet: Richly-annotated 3d reconstructions of indoor scenes,” in Proc. Computer Vision and Pattern Recognition (CVPR), IEEE, 2017.
- [14] I. Armeni, A. Sax, A. R. Zamir, and S. Savarese, “Joint 2D-3D-Semantic Data for Indoor Scene Understanding,” ArXiv e-prints, Feb. 2017.
- [15] A. H. Lang, S. Vora, H. Caesar, L. Zhou, J. Yang, and O. Beijbom, “PointPillars: Fast Encoders for Object Detection From Point Clouds,” in 2019 IEEE/CVF Conference on Computer Vision and Pattern Recognition (CVPR), (Long Beach, CA, USA), pp. 12689–12697, IEEE, June 2019.
- [16] B. Yang, W. Luo, and R. Urtasun, “PIXOR: Real-time 3D Object Detection from Point Clouds,” in 2018 IEEE/CVF Conference on Computer Vision and Pattern Recognition, (Salt Lake City, UT, USA), pp. 7652–7660, IEEE, June 2018.
- [17] H. Su, S. Maji, E. Kalogerakis, and E. Learned-Miller, “Multi-view Convolutional Neural Networks for 3D Shape Recognition,” in 2015 IEEE International Conference on Computer Vision (ICCV), (Santiago, Chile), pp. 945–953, IEEE, Dec. 2015.
- [18] A. Boulch, J. Guerry, B. Le Saux, and N. Audebert, “SnapNet: 3D point cloud semantic labeling with 2D deep segmentation networks,” Computers & Graphics, vol. 71, pp. 189–198, Apr. 2018.
- [19] Z. Han, H. Lu, Z. Liu, C.-M. Vong, Y.-S. Liu, M. Zwicker, J. Han, and C. L. P. Chen, “3D2SeqViews: Aggregating Sequential Views for 3D Global Feature Learning by CNN With Hierarchical Attention Aggregation,” IEEE Transactions on Image Processing, vol. 28, pp. 3986–3999, Aug. 2019. Conference Name: IEEE Transactions on Image Processing.
- [20] D. Maturana and S. Scherer, “VoxNet: A 3D Convolutional Neural Network for real-time object recognition,” in 2015 IEEE/RSJ International Conference on Intelligent Robots and Systems (IROS), pp. 922–928, Sept. 2015.
- [21] H.-Y. Meng, L. Gao, Y.-K. Lai, and D. Manocha, “VV-Net: Voxel VAE Net With Group Convolutions for Point Cloud Segmentation,” in 2019 IEEE/CVF International Conference on Computer Vision (ICCV), (Seoul, Korea (South)), pp. 8499–8507, IEEE, Oct. 2019.
- [22] A. A. M. Muzahid, W. Wan, F. Sohel, N. U. Khan, O. D. Cervantes Villagómez, and H. Ullah, “3D Object Classification Using a Volumetric Deep Neural Network: An Efficient Octree Guided Auxiliary Learning Approach,” IEEE Access, vol. 8, pp. 23802–23816, 2020. Conference Name: IEEE Access.
- [23] L. Landrieu and M. Simonovsky, “Large-Scale Point Cloud Semantic Segmentation with Superpoint Graphs,” in 2018 IEEE/CVF Conference on Computer Vision and Pattern Recognition, (Salt Lake City, UT), pp. 4558–4567, IEEE, June 2018.
- [24] L. Wang, Y. Huang, Y. Hou, S. Zhang, and J. Shan, “Graph Attention Convolution for Point Cloud Semantic Segmentation,” in 2019 IEEE/CVF Conference on Computer Vision and Pattern Recognition (CVPR), pp. 10288–10297, June 2019. ISSN: 2575-7075.
- [25] Y. Wang, Y. Sun, Z. Liu, S. E. Sarma, M. M. Bronstein, and J. M. Solomon, “Dynamic Graph CNN for Learning on Point Clouds,” ACM Transactions on Graphics, vol. 38, pp. 1–12, Oct. 2019.
- [26] L. Jiang, H. Zhao, S. Liu, X. Shen, C.-W. Fu, and J. Jia, “Hierarchical Point-Edge Interaction Network for Point Cloud Semantic Segmentation,” in 2019 IEEE/CVF International Conference on Computer Vision (ICCV), (Seoul, Korea (South)), pp. 10432–10440, IEEE, Oct. 2019.
- [27] W. Zhang and C. Xiao, “PCAN: 3D Attention Map Learning Using Contextual Information for Point Cloud Based Retrieval,” in 2019 IEEE/CVF Conference on Computer Vision and Pattern Recognition (CVPR), (Long Beach, CA, USA), pp. 12428–12437, IEEE, June 2019.
- [28] A. Paigwar, O. Erkent, C. Wolf, and C. Laugier, “Attentional PointNet for 3D-Object Detection in Point Clouds,” in 2019 IEEE/CVF Conference on Computer Vision and Pattern Recognition Workshops (CVPRW), (Long Beach, CA, USA), pp. 1297–1306, IEEE, June 2019.
- [29] R. Huang, Y. Xu, and U. Stilla, “GraNet: Global relation-aware attentional network for semantic segmentation of ALS point clouds,” ISPRS Journal of Photogrammetry and Remote Sensing, vol. 177, pp. 1–20, July 2021.
- [30] M. Feng, L. Zhang, X. Lin, S. Z. Gilani, and A. Mian, “Point attention network for semantic segmentation of 3D point clouds,” Pattern Recognition, vol. 107, p. 107446, Nov. 2020.
- [31] E. Y. Puang, H. Zhang, H. Zhu, and W. Jing, “Hierarchical Point Cloud Encoding and Decoding With Lightweight Self-Attention Based Model,” IEEE Robotics and Automation Letters, vol. 7, pp. 4542–4549, Apr. 2022. Conference Name: IEEE Robotics and Automation Letters.
- [32] C. Liu, D. Zeng, A. Akbar, H. Wu, S. Jia, Z. Xu, and H. Yue, “Context-Aware Network for Semantic Segmentation Toward Large-Scale Point Clouds in Urban Environments,” IEEE Transactions on Geoscience and Remote Sensing, vol. 60, pp. 1–15, 2022. Conference Name: IEEE Transactions on Geoscience and Remote Sensing.
- [33] C. R. Qi, H. Su, K. Mo, and L. J. Guibas, “Pointnet: Deep learning on point sets for 3d classification and segmentation,” in Proceedings of the IEEE conference on computer vision and pattern recognition, pp. 652–660, 2017.
- [34] C. R. Qi, L. Yi, H. Su, and L. J. Guibas, “Pointnet++: Deep hierarchical feature learning on point sets in a metric space,” Advances in neural information processing systems, vol. 30, 2017.
- [35] M. Jiang, Y. Wu, T. Zhao, Z. Zhao, and C. Lu, “PointSIFT: A SIFT-like Network Module for 3D Point Cloud Semantic Segmentation,” Nov. 2018. arXiv:1807.00652 [cs].
- [36] H. Zhao, L. Jiang, C.-W. Fu, and J. Jia, “PointWeb: Enhancing Local Neighborhood Features for Point Cloud Processing,” in 2019 IEEE/CVF Conference on Computer Vision and Pattern Recognition (CVPR), (Long Beach, CA, USA), pp. 5560–5568, IEEE, June 2019.
- [37] Q. Hu, B. Yang, L. Xie, S. Rosa, Y. Guo, Z. Wang, N. Trigoni, and A. Markham, “RandLA-Net: Efficient Semantic Segmentation of Large-Scale Point Clouds,” in 2020 IEEE/CVF Conference on Computer Vision and Pattern Recognition (CVPR), (Seattle, WA, USA), pp. 11105–11114, IEEE, June 2020.
- [38] S. Fan, Q. Dong, F. Zhu, Y. Lv, P. Ye, and F.-Y. Wang, “SCF-Net: Learning Spatial Contextual Features for Large-Scale Point Cloud Segmentation,” in 2021 IEEE/CVF Conference on Computer Vision and Pattern Recognition (CVPR), (Nashville, TN, USA), pp. 14499–14508, IEEE, June 2021.
- [39] H. Thomas, C. R. Qi, J.-E. Deschaud, B. Marcotegui, F. Goulette, and L. Guibas, “KPConv: Flexible and Deformable Convolution for Point Clouds,” in 2019 IEEE/CVF International Conference on Computer Vision (ICCV), pp. 6410–6419, Oct. 2019. ISSN: 2380-7504.
- [40] J. Gong, J. Xu, X. Tan, H. Song, Y. Qu, Y. Xie, and L. Ma, “Omni-supervised Point Cloud Segmentation via Gradual Receptive Field Component Reasoning,” in 2021 IEEE/CVF Conference on Computer Vision and Pattern Recognition (CVPR), (Nashville, TN, USA), pp. 11668–11677, IEEE, June 2021.
- [41] Y. Li, X. Li, Z. Zhang, F. Shuang, Q. Lin, and J. Jiang, “DenseKPNET: Dense Kernel Point Convolutional Neural Networks for Point Cloud Semantic Segmentation,” IEEE Transactions on Geoscience and Remote Sensing, vol. 60, pp. 1–13, 2022. Conference Name: IEEE Transactions on Geoscience and Remote Sensing.
- [42] W. Wu, Z. Qi, and L. Fuxin, “Pointconv: Deep convolutional networks on 3d point clouds,” in Proceedings of the IEEE/CVF Conference on computer vision and pattern recognition, pp. 9621–9630, 2019.
- [43] Y. Xu, T. Fan, M. Xu, L. Zeng, and Y. Qiao, “SpiderCNN: Deep Learning on Point Sets with Parameterized Convolutional Filters,” in Computer Vision – ECCV 2018 (V. Ferrari, M. Hebert, C. Sminchisescu, and Y. Weiss, eds.), vol. 11212, pp. 90–105, Cham: Springer International Publishing, 2018. Series Title: Lecture Notes in Computer Science.
- [44] Y. Li, R. Bu, M. Sun, W. Wu, X. Di, and B. Chen, “PointCNN: Convolution On X-Transformed Points,” in Advances in Neural Information Processing Systems (S. Bengio, H. Wallach, H. Larochelle, K. Grauman, N. Cesa-Bianchi, and R. Garnett, eds.), vol. 31, Curran Associates, Inc., 2018.
- [45] S. Pu, M. Rutzinger, G. Vosselman, and S. Oude Elberink, “Recognizing basic structures from mobile laser scanning data for road inventory studies,” ISPRS Journal of Photogrammetry and Remote Sensing, vol. 66, pp. S28–S39, Dec. 2011.
- [46] C. Zhang, Y. Zhou, and F. Qiu, “Individual Tree Segmentation from LiDAR Point Clouds for Urban Forest Inventory,” Remote Sensing, vol. 7, pp. 7892–7913, June 2015. Number: 6 Publisher: Multidisciplinary Digital Publishing Institute.
- [47] Q. Li, P. Yuan, X. Liu, and H. Zhou, “Street tree segmentation from mobile laser scanning data,” International Journal of Remote Sensing, vol. 41, pp. 7145–7162, Sept. 2020. Publisher: Taylor & Francis _eprint: https://doi.org/10.1080/01431161.2020.1754495.
- [48] H. Luo, C. Chen, L. Fang, K. Khoshelham, and G. Shen, “Ms-rrfsegnet: Multiscale regional relation feature segmentation network for semantic segmentation of urban scene point clouds,” IEEE Transactions on Geoscience and Remote Sensing, vol. 58, no. 12, pp. 8301–8315, 2020.
- [49] A. E. Maxwell, T. A. Warner, and L. A. Guillén, “Accuracy assessment in convolutional neural network-based deep learning remote sensing studies—part 1: Literature review,” Remote Sensing, vol. 13, no. 13, p. 2450, 2021.
- [50] A. J. Alberg, J. W. Park, B. W. Hager, M. V. Brock, and M. Diener-West, “The Use of “Overall Accuracy” to Evaluate the Validity of Screening or Diagnostic Tests,” Journal of General Internal Medicine, vol. 19, pp. 460–465, May 2004.
- [51] M. Everingham, L. Van Gool, C. K. I. Williams, J. Winn, and A. Zisserman, “The Pascal Visual Object Classes (VOC) Challenge,” International Journal of Computer Vision, vol. 88, pp. 303–338, June 2010.
- [52] A. Escolà, J. A. Martínez-Casasnovas, J. Rufat, J. Arnó, A. Arbonés, F. Sebé, M. Pascual, E. Gregorio, and J. R. Rosell-Polo, “Mobile terrestrial laser scanner applications in precision fruticulture/horticulture and tools to extract information from canopy point clouds,” Precision Agriculture, vol. 18, pp. 111–132, Feb. 2017.
- [53] I. Lang, A. Manor, and S. Avidan, “SampleNet: Differentiable Point Cloud Sampling,” in 2020 IEEE/CVF Conference on Computer Vision and Pattern Recognition (CVPR), (Seattle, WA, USA), pp. 7575–7585, IEEE, June 2020.
VI Biography Section
![[Uncaptioned image]](/html/2306.10274/assets/aditya8.png) |
Aditya received the Bachelor of Technology degree in Mining Engineering from the Indian Institute of Technology (ISM), Dhanbad. He is currently a joint PhD candidate at the Department of Infrastructure Engineering, University of Melbourne, Australia, and the Department of Civil Engineering, Indian Institute of Technology Kanpur, India. His research interests include point cloud processing, deep learning for point cloud semantic segmentation and urban forests characterization. |
![[Uncaptioned image]](/html/2306.10274/assets/aditya9.png) |
Bharat Lohani earned his PhD from the University of Reading, the UK, in 1999. He is currently a Professor at the Department of Civil Engineering, Indian Institute of Technology Kanpur, India. Dr. Lohani mainly focuses on the modeling of the physical environment using high-resolution remotely sensed data, with particular emphasis on airborne, drone, mobile, and terrestrial LiDAR data and photographs. His current research interests are in LiDAR Data Classification using Deep Learning Techniques, LiDAR application in Forest and Water Conservation, Solar Insolation Estimation, and especially LiDAR simulation for autonomous systems. |
![[Uncaptioned image]](/html/2306.10274/assets/aditya10.png) |
Jagannath Aryal holds the PhD degree in optimization and systems modelling from C-fACS, New Zealand. He is currently an Associate Professor in the Department of Infrastructure Engineering at the University of Melbourne, Australia. His research interests include optimal utilization of Earth observation, geo-information, and geo-statistics to develop new methods for object recognition in urban green space and disaster environment. Dr. Aryal serves as an Associate Editor for IEEE Transactions on Geoscience and Remote Sensing (TGRS). |
![[Uncaptioned image]](/html/2306.10274/assets/aditya11.png) |
Stephan Winter holds a PhD from the University of Bonn, and a habilitation from the Technical University Vienna. He is currently a Professor for Spatial Information Science in the Department of Infrastructure Engineering at The University of Melbourne, Australia. His interest in intelligent mobility, especially for urban sustainability, motivates also data analytics research in urban green spaces. |