High resolution spectroscopy of SN 2023ixf’s first week: Engulfing the Asymmetric Circumstellar Material
Abstract
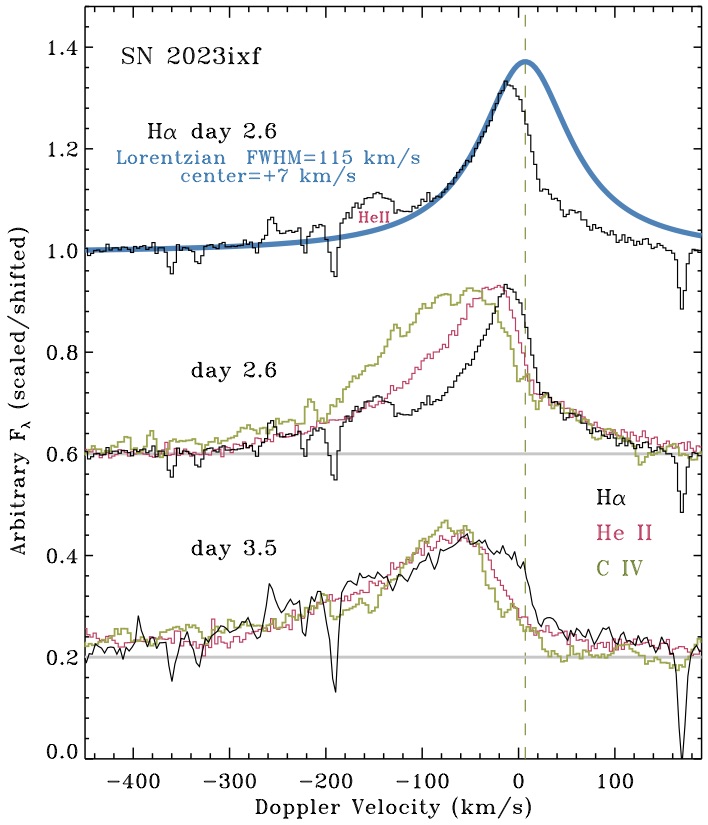
We present a series of high-resolution echelle spectra of SN 2023ixf in M101, obtained nightly during the first week or so after discovery using PEPSI on the LBT. Na i D absorption in these spectra indicates a host reddening of =0.031 mag and a systemic velocity of 7 km s-1 relative to the average redshift of M101. Dramatic changes are seen in in the strength and shape of strong emission lines emitted by circumstellar material (CSM), including He ii 4686, C iv 5801,5811, H, and N iv 7109,7123. In general, these narrow lines broaden to become intermediate-width lines before disappearing from the spectrum within a few days, indicating a limited extent to the dense CSM of around 20-30 AU (or 1014.7 cm). H persists in the spectrum for about a week as an intermediate-width emission line with P Cyg absorption at 700-1300 km s-1 arising in the post-shock shell of swept-up CSM. Early narrow emission lines are blueshifted and indicate an expansion speed in the pre-shock CSM of about 115 km s-1, but with even broader emission in higher ionization lines. This is faster than the normal winds of red supergiants, suggesting some mode of eruptive mass loss from the progenitor or radiative acceleration of the CSM. A lack of narrow blueshifted absorption suggests that most of the CSM is not along our line of sight. This and several other clues indicate that the CSM of SN 2023ixf is significantly aspherical. We find that CSM lines disappear after a few days because the asymmetric CSM is engulfed by the SN photosphere.
1 Introduction
Understanding the late evolution and end fates of massive stars remains an enduring challenge. It was recognized long ago that mass loss plays a key role in determining the outcome of stellar evolution (Paczyński, 1971; Chiosi & Maeder, 1986). In recent years, however, the traditional view where well-behaved, steady stellar winds of single stars lead to predictable outcomes with reliable metallicity-dependence (e.g., Heger et al., 2003), has gradually been eroding, giving way instead to a more complicated picture where binary interaction and eruptive events dominate the mass loss (see Smith, 2014, for a review). These modes of mass loss do not have well-established monotonic trends with initial mass or metallicity, and are challenging for models of single-star evolution.
A major reason for this shifting paradigm is that normal, steady stellar winds of hot massive stars are evidently not as strong as we used to think, reducing their ability to remove the H envelope and to strongly impact evolution (Smith & Owocki, 2006; Puls et al., 2008; Smith, 2014; Sundqvist et al., 2019). The same applies to RSG winds, indicated by recent downward revisions of normal RSG wind mass-loss rates and the general scarcity of dust-enshrouded RSGs (Beasor et al., 2020; Beasor & Smith, 2022). This shift is also influenced by results from several different lines of inquiry: (1) strong evidence for binary-stripped progenitors of H-poor supernovae (SNe) (Podsiadlowski et al., 1992; Smith et al., 2011; Drout et al., 2011), (2) observational evidence for extreme, eruptive modes of mass loss (Smith & Owocki, 2006), and (3) firmer observational estimates of a high interacting binary fraction among O-type stars (Sana et al., 2012).
Another driving factor toward a more complicated view of mass loss has been the discovery of a number of different explosive transients that simply do not fit predictions of the traditional view of a massive star evolution dominated by single-star wind mass loss. Chief among these are SNe with signatures of strong shock interaction with circumstellar material (CSM). Evolved massive stars that retain their H envelopes usually have large radii and relatively slow escape speeds, which can lead to slow CSM that produces narrow H lines in the spectrum of the SN. In this case, they are classified as Type IIn (Schlegel, 1990). The illumination or shock heating of close-in CSM can provide unique clues about the mass-loss properties of the progenitor star in the late evolutionary phases of its life, which are otherwise difficult to infer (see Smith, 2017, for a review). There is wide diversity among SNe with observed signatures of H-rich CSM interaction, ranging from super-luminous SNe IIn, scaling down through normal SNe IIn, and further down to those with barely any observable signatures of CSM interaction.
On the less extreme end, we see interacting SNe where the spectral signatures of CSM interaction are fleeting. One of these events is the topic of the current paper. The narrow lines may last for only a few days or a week before fading, and they can quickly transition to look like normal111“Normal” here means a visual-wavelength spectrum dominated by an ejecta photosphere, not by CSM interaction. SNe. This class of objects has been known for about four decades. Well-studied examples of the phenomenon include SN 1983K (Niemela et al., 1985), SN 1993J (Benetti et al., 1994; Garnavich & Ann, 1994), SN 1998S (Shivvers et al., 2015), SN 2006bp (Quimby et al., 2007), PTF11iqb (Smith et al., 2015), and SN 2013cu (Gal-Yam et al., 2014; Groh, 2014; Gräfener & Vink, 2016). Additional events studied in detail include SN 2013fs, SN 2017ahn, SN 2020pni, and SN 2020tlf (Bullivant et al., 2018; Tartaglia et al., 2021; Terreran et al., 2022; Jacobson-Galán et al., 2022). Because study of this class requires early discovery on timescales of hours or days after explosion, early examples were limited to fortuitous early detections of nearby events. With more systematic transient searches and early discovery becoming more routine, growing samples of this class have been identified (Khazov et al., 2016). Some estimates suggest that a large fraction () of otherwise normal core-collapse SNe (ccSNe) have these early CSM features (Bruch et al., 2021), which is larger than the 8-9% of ccSNe that are more traditional strongly-interacting SNe IIn (Smith et al., 2011).
The defining characteristic of this class is very short-lived (a few days) narrow emission lines in the spectrum, which are thought to result from dense and confined CSM within 10s of AU around the progenitor star. As with the broader class of SNe IIn, this is a phenomenon that is not unique to any one type of explosion or any unique progenitor type because it depends on the characteristics of the surrounding material — in principle, any SN type might be surrounded by dense and confined CSM. In practice, the observed events tend to be H rich (perhaps because narrow lines require that a progenitor had slow escape speeds due to a large H envelope), and they usually evolve into SNe IIb, II-P, or II-L when the CSM interaction signatures fade. Early spectra show high-ionization emission lines like He ii and doubly or triply ionized C and N lines with narrow cores and broad wings, and these emission lines sit atop a smooth blue continuum. The high ionization level is thought to arise from photoionization of the CSM by a hard radiation field, produced either by a UV/X-ray flash from shock breakout, or produced by the shock when the fastest SN ejecta first crash into the CSM. These high-ionization lines cause the early spectra to resemble Wolf-Rayet (WR) stars, leading to some claims that this points to WR progenitors (Gal-Yam et al., 2014). However, the WR spectral features arise because a slow, dense, H-rich wind is ionized by the SN; the progenitor star is likely to have been cool and potentially even self-obscured by its CSM, and would not have been seen as a WR star, more likely resembling a cool hypergiant (Smith et al., 2015; Groh, 2014). Of course, this would depend on when exactly the progenitor star was observed, since the confined CSM may have just been produced shortly before the SN (i.e. the star may have appeared as a normal RSG or YSG a few years earlier).
There are several remaining open questions about this class of objects, concerning the mechanism that ionized the CSM (flash from shock breakout or shock interaction), the range of physical properties of the CSM (total CSM mass or mass-loss rate of the progenitor, range of shell/envelope radii, asymmetry, composition, etc.), timescale of the mass-loss before explosion, details of the evolution of the shock through the CSM, range of initial masses for the progenitors, and so on. All of these help to inform the most important question, which concerns the physical mechanism operating within the star that caused it to suddenly eject so much mass right before core collapse. The observed velocities of the CSM and the quick disappearance of the narrow lines (and hence, the small inferred outer boundary of the CSM) imply that the strong mass loss occurred very soon before core collapse, perhaps in the last few months or the final year or two of the star’s life. This timescale is a strong hint that something is going haywire in the star during the last rapid phases of nuclear burning (Ne, O, or Si burning), and several ideas have been proposed for extreme mass loss triggered during these phases (Arnett & Meakin, 2011; Quataert & Shiode, 2012; Shiode et al., 2013; Shiode & Quataert, 2014; Smith & Arnett, 2014; Woosley & Heger, 2015; Fuller, 2017; Wu & Fuller, 2021). Since the CSM interaction is so short-lived (and the total CSM mass estimates are on the order of 0.1 ), and as these objects evolve into relatively normal SN types when the narrow lines fade (perhaps implicating moderately massive 10-20 red or yellow supergiant progenitors), it is unlikely that some other mechanisms proposed for pre-SN mass loss in SNe IIn will be applicable to this particular class. For instance, pulsational-pair instability eruptions (Woosley, 2017) are limited to only very high initial masses, and are probably ruled out for these objects. Also, it is difficult to understand why strong pulsationally driven superwinds from very luminous RSGs (Yoon & Cantiello, 2010) would only operate for 1 yr before core collapse. In any case, the range of physical parameters for the CSM deduced from studies of individual events can help inform what mechanism ejected the CSM. Perhaps it can also help to understand how/if these objects are connected to the broader class of interacting SNe IIn, or if they are a distinct phenomenon.
| Date (UTC) | MJD | Epoch (days) | Airmass |
|---|---|---|---|
| 2023-05-21 | 60085.373 | 2.62 | 1.35 |
| 2023-05-22 | 60086.244 | 3.49 | 1.08 |
| 2023-05-23 | 60087.150 | 4.40 | 1.14 |
| 2023-05-24 | 60088.155 | 5.40 | 1.12 |
| 2023-05-26 | 60090.357 | 7.60 | 1.34 |
| 2023-05-27 | 60091.183 | 8.43 | 1.08 |
| 2023-06-05 | 60100.329 | 17.56 | 1.34 |
Here we discuss a new member of this class, SN 2023ixf, which exploded in the very nearby spiral galaxy M101. It was discovered by K. Itagaki on 2023 May 19, and was soon classified as a Type II SN by Perley et al. (2023). In the following, we adopt a host redshift for M101 of =0.000804 (de Vaucouleurs et al., 1995). From examining pre-explosion archival images, a candidate progenitor consistent with a moderate-luminosity RSG progenitor has been identified (Pledger & Shara, 2023; Soraisam et al., 2023; Kilpatrick et al., 2023, Jencson et al. in perp.), suggesting a star that had an initial mass of around 12-17 .
SN 2023ixf was quickly rising at the time of discovery and was expected to become very bright, and because it was a Type II event that could potentially show early narrow lines in the spectra, we chose to initiate an intensive observing campaign to obtain high-resolution echelle spectra every night (or almost every night) for the first week or so after discovery, in order to document rapid changes in the narrow emission from CSM. These observations and initial results are described here, while companion papers describe the early light curve (Hosseinzadeh et al., 2023) and low-resolution spectra (Bostroem et al., in prep.). Section 2 describes the observations, Section 3 describes the resulting data and analysis, and Section 4 presents our interpretation of these early data.
2 Observations
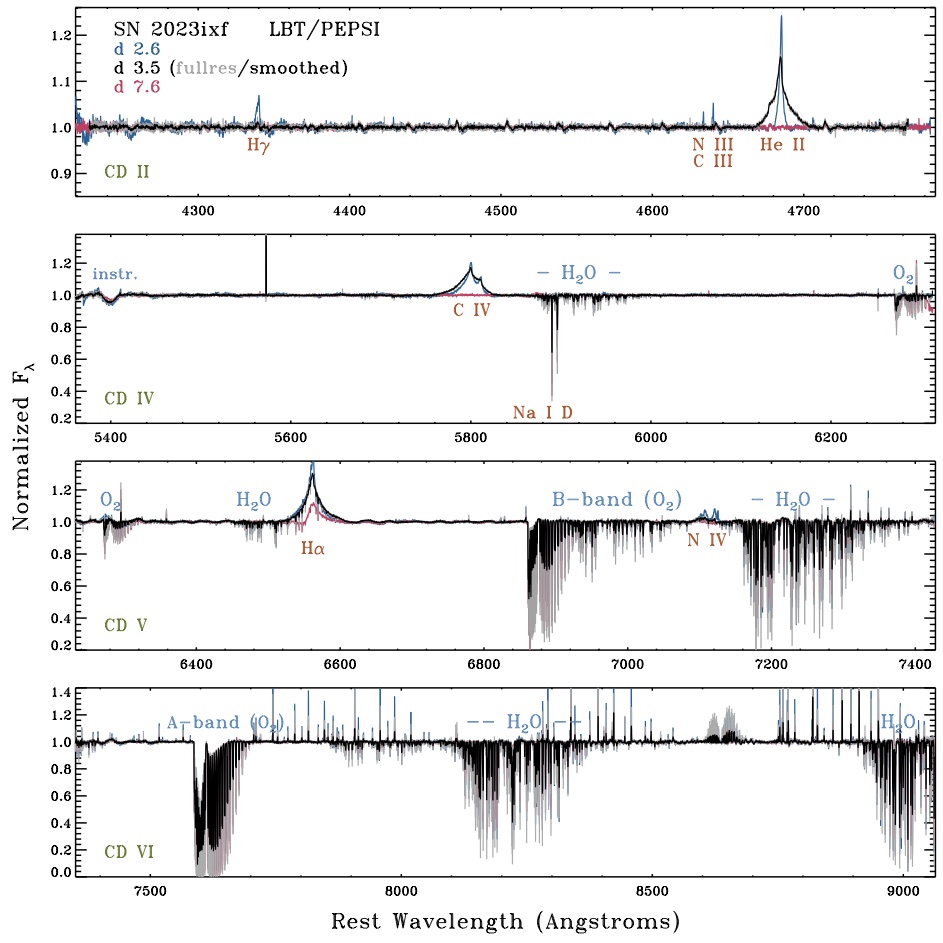
Shortly after discovery, we initiated a campaign to obtain observations of SN 2023ixf with a nearly nightly cadence using the Potsdam Echelle Polarimetric and Spectroscopic Instrument (PEPSI; Strassmeier et al. 2018) mounted on the Large Binocular Telescope (LBT) located on Mt. Graham, AZ. PEPSI is a cross-dispersed echelle spectrograph with separate blue and red channels, each with three wavelength ranges corresponding to three cross dispersers (CDs), with CD I, II, and III in the blue arm, and CD IV, V, and VI in the red arm. When combined, these are designed to cover the full optical wavelength range with no gaps. At the time of these observations, CD I and CD III were not available, so we used CD II (covering 4219-4787 Å) in the blue channel, and CD IV (5361-6316 Å), CD V (6232-7428 Å) and CD VI (7351-9064 Å) in the red channel. All observations were composed of a 60 minute blue channel exposure with CD II and three 20 minute red channel exposures with CD IV, CD V, and CD VI. We used a 300 m fiber (2.2 arcsec diameter) corresponding to a spectral resolving power of ==50,000, or a velocity resolution of about 6 km s-1.
The data were reduced using the Spectroscopic Data Systems (SDS) pipeline (Ilyin, 2000; Strassmeier et al., 2018). The pipeline performs bias subtraction and flat field correction, order tracing and optimal extraction with cosmic ray elimination, and wavelength calibration. The spectral orders are normalized in 2D with a non-linear constrained least-squares fit to account for broad emission lines spanned over adjacent spectral orders. Finally, the spectral orders are rectified into a single spectrum for each CD. The wavelength scale was reduced to the Solar System Barycentric rest frame using JPL ephemerides. The pipeline also estimates the variance in each pixel.
Based on early photometry and upper limits, (Hosseinzadeh et al., 2023) estimate a likely explosion time of MJD=60082.75. Using this as a reference, our LBT/PEPSI spectra were obtained between 2 and 9 days after explosion, plus one additional later epoch. We use this date to calculate the time since explosion for each PEPSI spectrum, listed as the 3rd column in Table 1.
3 Results
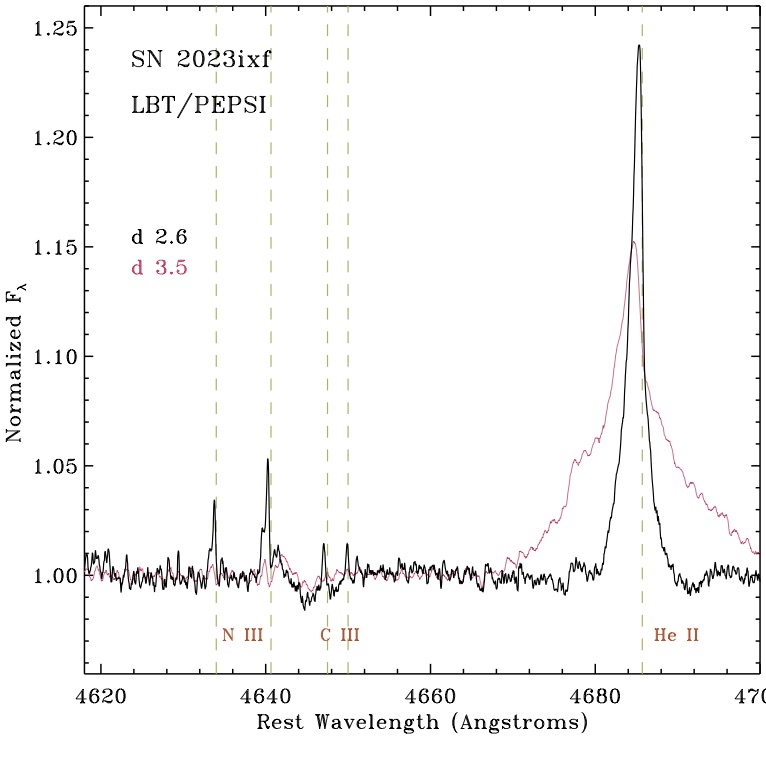
An example of the resulting normalized PEPSI spectrum of SN 2023ixf is shown in Figure 1. This shows the spectra on days 2.6 (blue), 3.5 (black), and 7.6 (magenta). Although the spectrum appears somewhat complicated, most of the structure results from complex telluric absorption bands, which are labeled in blue in Figure 1. Overall, the spectrum of SN 2023ixf at these early times is dominated by a very smooth blue continuum (although the continuum slope is normalized here) plus a small number of prominent lines labeled in red-orange in Figure 1. At this early epoch within only about a week after explosion, it does not yet show any emission or absorption from very broad features associated with the fast SN ejecta. Besides the interstellar absorption from Na i D, the most interesting features are the strong narrow emission lines in the spectrum that dramatically change strength and shape with time over only a few days: He ii 4686, C iv 5801,5811, and H. The spectra also show weak narrow emission N iii 4634,4641 and C iii 4648,4650 seen only in our first epoch, as well as weak emission from N iv 7109,7123 and He i 5876, the latter of which grows in strength with time (see Fig. 2). We discuss each of these lines in turn, after briefly examining the narrow interstellar absorption.
3.1 Na I D and Interstellar Reddening
Because the line of sight Milky Way reddening toward M101 of =0.0074 mag (Schlafly & Finkbeiner, 2011) is quite low and because we are primarily examining line profiles in normalized spectra (where the continuum flux is divided out anyway), we make no reddening correction to our echelle spectra. However, high-resolution echelle spectra afford an opportunity to provide a precise constraint on the equivalent width (EW) of the narrow Na i D interstellar absorption lines arising along the line of sight through the host galaxy.
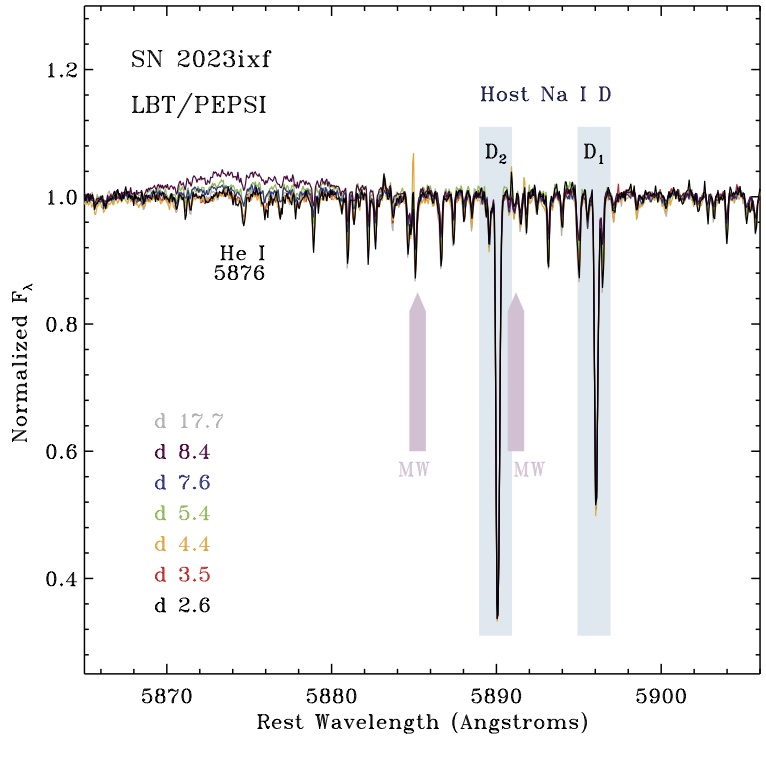
Figure 2 shows a detail of the region of the spectrum around the Na i D1 and D2 resonance doublet, which has been corrected for a redshift of =0.000804. Each epoch of PEPSI spectra is shown, and the nature of narrow absorption lines in the spectrum is remarkably consistent over the various epochs. The blue boxes in Figure 2 indicate the expected positions of the two Na i lines in M101. Indeed there are two strong narrow absorption features detected here. These are seen to be mixed amid a large number of other weaker narrow absorption features, which may arise from various clouds along the line of sight through the Milky Way at various rotation velocities and a cluster of telluric water absorption lines. This suggests that high spectral resolution is important to accurately estimate the reddening within M101, because its low redshift means that its interstellar absorption features may overlap with those from the Milky Way and these telluric features.
We measure Na i EW values of 0.156 Å for D1 and 0.187 Å for D2. The measured EWs were consistent to better than 1% from one epoch to the next; the main uncertainty in the absolute measurement of the EW values is the choice of continuum level, and how much contamination there might be from overlapping lines. Although there are many other weak narrow lines, the continuum level in these spectra is well determined to about 1% of the flux level as well. Following the relations from Poznanski et al. (2012), these EWs translate to a reddening value of = 0.036 mag. Following Poznanski et al. (2012), we multiply this by 0.86 to account for the conversion to Schlafly & Finkbeiner (2011) values, yielding a host reddening along the line of sight to SN 2023ixf of = 0.031 mag. The uncertainty in the relation from Poznanski et al. (2012) is 30-40 %, which is much larger than any error in introduced by measurement error in these PEPSI spectra. This resulting value of = 0.031 mag is larger than the Milky Way reddening, indicating that the local host dust in M101 is the dominant source of extinction along the line of sight. This may, of course, vastly underestimate the extinction toward the progenitor star arising from dust that may have been present in the pre-SN CSM.
The velocities of these deep Na i D absorption features are also useful later in our analysis, especially when interpreting velocities of narrow emission components. We measure the centroid velocity of the strongest components of the D1 and D2 lines. After correcting the spectra for the adopted host redshift of =0.000804, we take the average of the two lines to derive a Doppler velocity for the Na i D absorption of +7 (1) km s-1, relative to the adopted redshift of M101 (which is about 241 km s-1). When we interpret the observed velocities below in Section 4, we take this value of 7 km s-1 as representative of the velocity of interstellar material in the vicinity of SN 2023ixf that results from galactic rotation, and therefore as a likely indication of the progenitor star’s systemic velocity. In figures in this manuscript showing the observed line profiles, the velocity scale is only corrected for =0.000804, but we show this +7 km s-1 systemic velocity with a vertical green dashed line.
3.2 High ionization Features
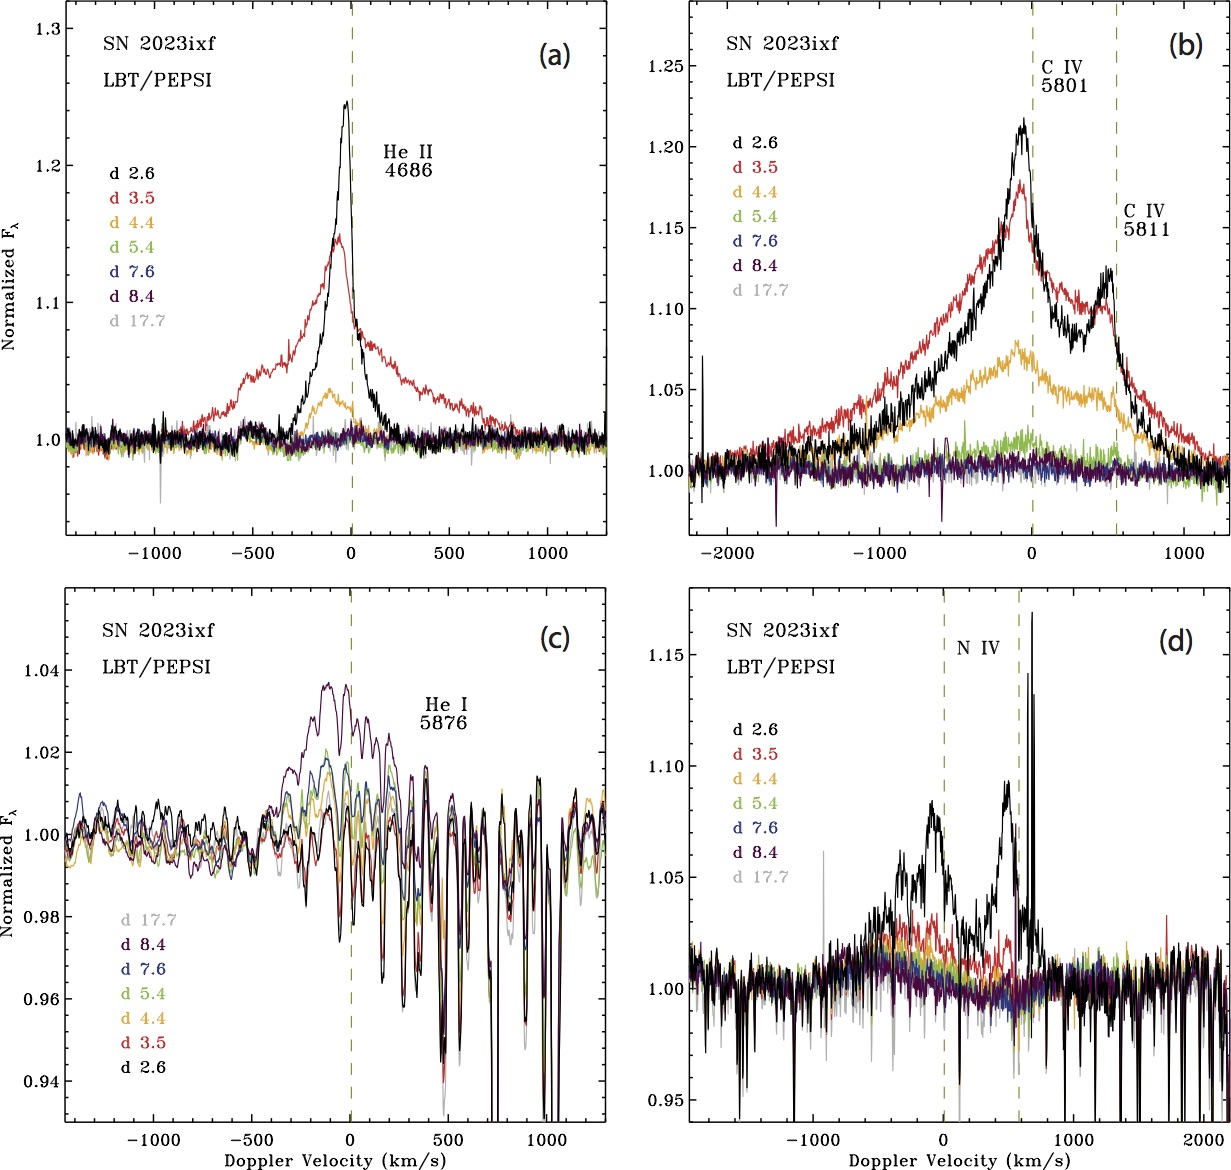
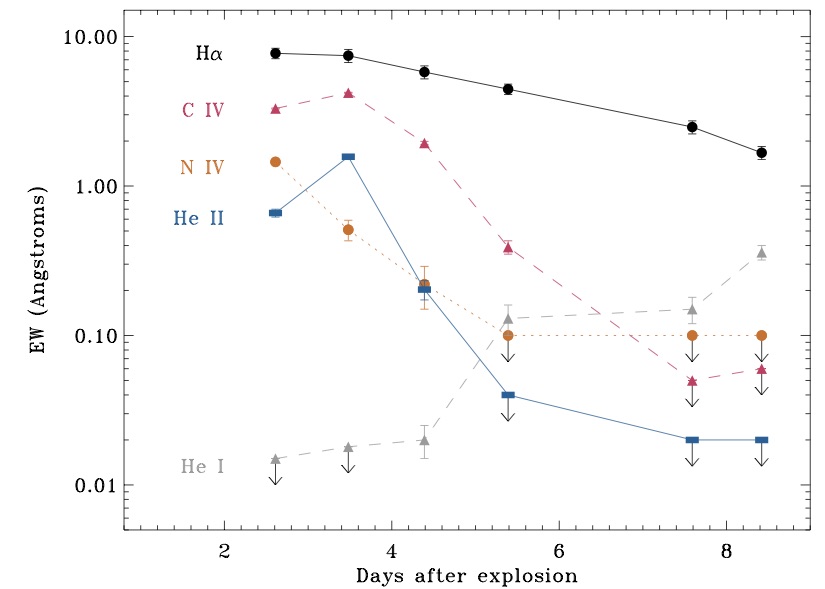
Notable high ionization lines in these early-time echelle spectra are He ii 4686, C iv 5801,5811, and N iv 7109,7123. The line profile evolution of each of these can be seen in Figures 3a, 3b, and 3d, respectively (Panel 3c shows He i 5876, discussed in the next section). If we take into account the fact that C iv and N iv are closely spaced doublets or blends, the evolution of strength and line profile shape in each of these is similar. All three have relatively strong, narrow (100 km s-1), blueshifted (50 to 150 km s-1) emission peaks with broader wings at the first epoch. These lines then appear to broaden and fade over the next 2-3 days, and completely disappear 3-4 days later. The evolution of the equivalent widths (EWs) of these emission lines measured in our PEPSI spectra are shown in Figure 4. All the high-ionization lines fade by factors of 10-20 or more over a time period of 4 days.
The change in width of He ii over only 1 day from May 21 to 22 is particularly stunning, where the broad 1000 km s-1 emission wings come and go very quickly. The He ii profile on day 2.6 is narrow, lacking the broad electron scattering wings seen in H on that same date (as we show below, when we subtract off a 1000 km s-1 Lorentzian profile from H, the two line profiles are very similar).222We note that some lower-resolution spectra of SN 2023ixf do show broader wings of He ii 4686 at very early epochs comparable to our observations (Jacobson-Galan et al., 2023). Because PEPSI spectra are cross-dispersed, the “continuum” level that is normalized in the pipeline reduction may include some of the broadest emission wings if it stretches across more than one order. We find this to be likely, so we caution the reader about the absence of broad He ii emission in these spectra, and we do not emphasize this result in our discussion. He ii then fades and disappears by day 5.4. Of these high-ionization lines, C iv 5801,5811 has the broadest wings (extending to 2000 km s-1 on the blue side) and it lingers the longest before fading, disappearing from the spectrum about a day later than He ii. In any case, all narrow and intermediate-width emission from these high-ionization features is completely absent from the spectrum by day 7.6. The narrow emission component fades more quickly, leaving only a fainter intermediate-width component to persist for a few days. High-ionization emission might fade either because the gas cools and recombines, or because the CSM is overtaken by the SN; we return to this topic later in Section 4.
There is a persistent weak emission feature on the blue wing of He ii at about km s-1, possibly with a P Cygni profile. This is most likely an artifact that arises where edges of echelle orders are merged (see the top panel of Figure 1, as noted earlier). This is probably not emission from N iii 4679.4,4679.8, which is, however, seen in low-resolution spectra a day earlier (Bostroem et al., in prep.).
Notable for their general absence in our PEPSI spectra are N iii 4634,4641 and C iii 4648,4650. Together with He ii 4686, these lines constitute the so-called blue WR bump. In many examples of SNe II with fleeting CSM interaction signatures, these N iii/C iii lines are very strong (often equal in strength to He ii 4686), and with strong electron scattering wings (Niemela et al., 1985; Leonard et al., 2000; Gal-Yam et al., 2014; Smith et al., 2015; Terreran et al., 2022; Jacobson-Galán et al., 2022). In fact, these N iii/C iii lines are seen in our spectra of SN 2023ixf, but only in our first spectrum on day 2.6, where they are extremely weak (Fig 5). For N iii 4634,4641 we measure EWs of 0.022 0.004 and 0.035 0.005 Å, respectively, and for C iii 4648,4650 we measure EWs of 0.013 0.003 and 0.008 0.002 Å, respectively. The lines disappear the next day. Also, when seen on day 2.6, they only show the narrow emission components with no broad wings; these narrow components have the same blueshift and approximately the same width as He ii (Fig 5). These lines are stronger the previous day in lower-resolution spectra (Bostroem et al., in prep.), as noted above for N iii 4679.4,4679.8. Over the same period from day 2.6 to 3.5 when these lines vanish from our spectra, the strengths of C iv and He ii are still increasing (Fig. 4). This indicates that even as late as 2-3 days after explosion, the compact CSM is still increasing in ionization level, even though the light travel time to 20-30 AU is only about 3 hrs. This suggests that a sudden flash of ionization from shock breakout is probably not the primary ionization source for the CSM, which may instead be photoionized by emission from the ongoing shock/CSM interaction (Smith et al., 2015; Terreran et al., 2022).
3.3 Recombination of He II to He I
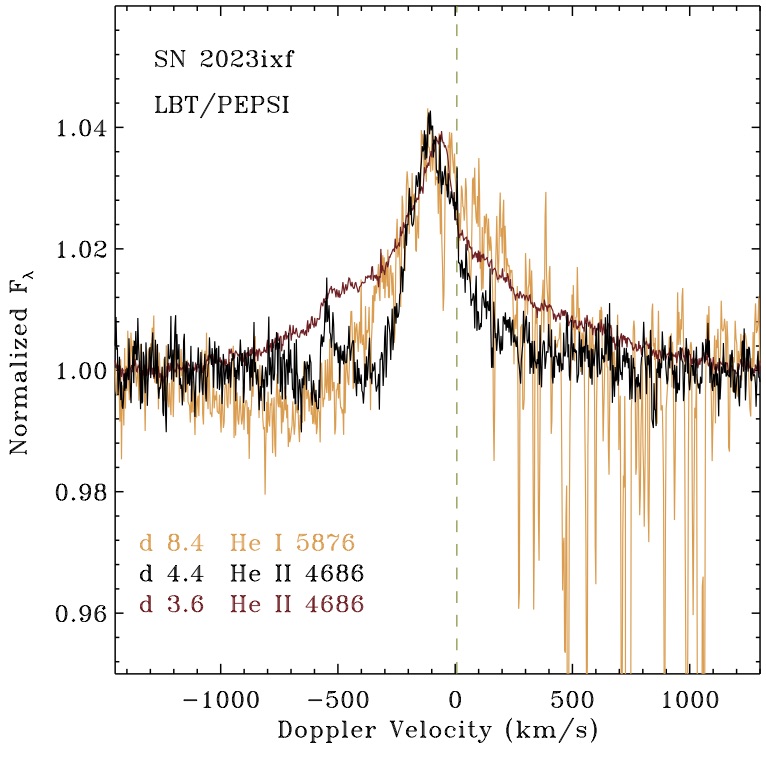
The detailed evolution of He i 5876 is shown in Figure 3c. This line is often seen as a strong narrow emission line in early SNe II with CSM signatures, and in SNe IIn, but it is totally absent in the first two epochs of our echelle spectra of SN 2023ixf. Interestingly, however, He i 5876 starts to grow in strength and becomes an admittedly still very weak intermediate-width emission feature by days 7.6 and 8.4 (blue and violet in Figure 3c; note that this line is found amid a forest of telluric H2O absorption features). Figure 4 shows the equivalent widths of He i emission as compared to other lines, demonstrating how the strength of He i emission increases as He ii and the other high-ionization lines fade away over 4-5 days. (Note that while the actual value of the EW for He i is quite uncertain because of all the overlapping telluric absorption, the relative increase in strength of He i shown in Figure 4 is real because the forest of telluric lines does not alter the flux passing between them.) The line profiles of He i during this evolution can be seen in Figure 2 as noted earlier, but are shown more clearly in Figure 3c. The emission component of He i has a width of about 500-1000 km s-1; there is no narrow emission from He i 5876 that would correspond to the blueshifted, narrow (50-100 km s-1) peak of He ii in the first epoch. He i 5876 shows weaker intermediate-width P Cyg absorption, discussed more below.
This lack of narrow emission indicates that the weak He i 5876 emission detected in these spectra is arising from accelerated gas that has already been swept up by the shock and is now cooling and recombining. Accordingly, this indicates that the narrow component of He ii (and by extension, the narrow components of N iv and C iv) disappear because the slow gas is accelerated by the shock, not because it survives as pre-shock CSM and recombines.
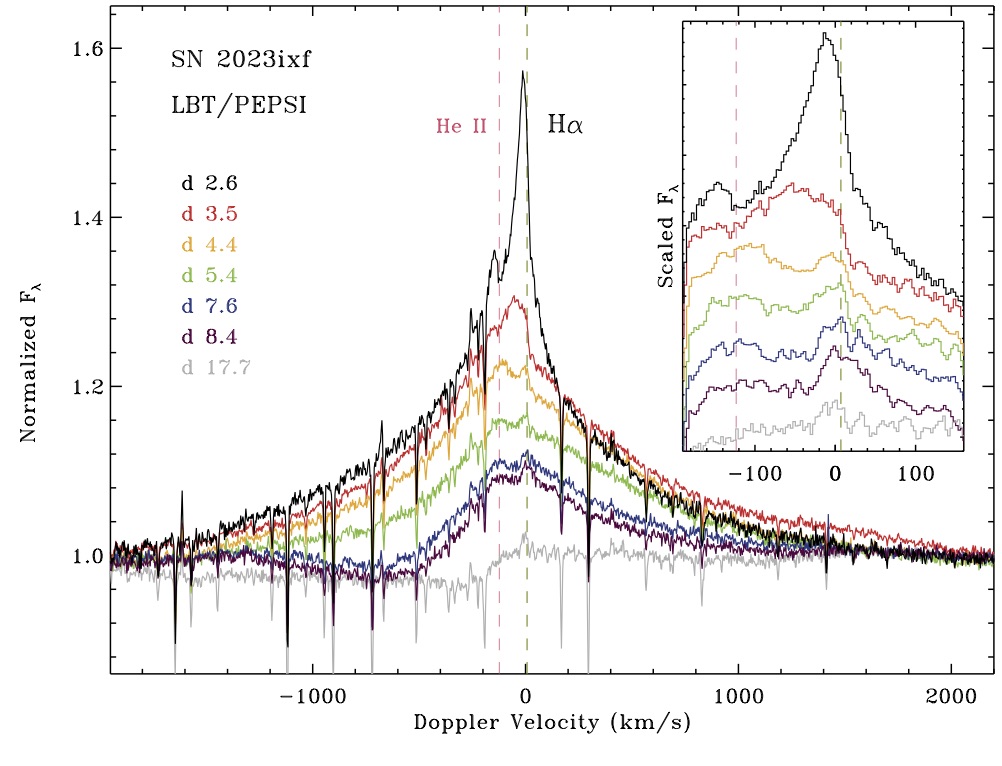
Figure 6 compares profiles of the fading He ii 4686 emission to the last epoch of He i 5876 emission. Note that as He ii 4686 emission wings within 1000 km s-1 fade away, the He i 5876 emission and P Cygni absorption over the same range of velocities become stronger. This suggests that the gas expanding at around 1000 km s-1 is cooling and recombining. These velocities are significantly faster than the narrow (50-100 km s-1) component from the unshocked CSM seen in the first-epoch spectra. Again, this confirms that the He i-emitting gas has been accelerated, probably because it is now in the post-shock shell of swept-up CSM. The He i 5876 profile on day 8.4 also shows a weak and broad P Cygni absorption feature at 500 to 1200 km s-1, which is similar to the later epochs of H discussed below.
Interestingly, we do not see a similar ionization transition in alpha elements. While C iv and N iv fade quickly over a few days, we do not see a corresponding growth in the strength of N iii or C iii lines that are seen in several other SNe II with early narrow CSM features, as noted above. At the end of our spectral series, the C iii and N iii emission features do not turn on as the C iv and N iv fade. This implies that the C iv and N iv is not fading primarily because the N and C ions are recombining to a lower ionization state. Instead, it may suggest that the CSM and shocked shell are largely getting enveloped by the expanding SN photosphere after a week; this is discussed more below.
3.4 Intermediate-width and Narrow H
H exhibits the most interesting and informative evolution of the lines seen in the spectrum during the first week after explosion (Fig. 7). Overall, H displays a clear and steady evolution from a narrow line core with broad Lorentzian-shaped wings at the first epoch, transitioning to a clear intermediate-width P Cygni profile a week later. It is similar to the evolution seen in normal SNe IIn, but on a vastly compressed timescale. The narrow component fades more rapidly than the intermediate-width component. Overall, the EW of H fades by about a factor of 5 in the first week (Fig. 4), during a time when the magnitude only brightens modestly (Hosseinzadeh et al., 2023), corresponding to a factor of 1.6 increase in continuum flux. This indicates that the narrow/intermediate H line luminosity fades by a factor of 3 during the first week of observations. By 2 weeks after explosion (day 17.7 in Fig. 7), the intermediate-width emission component of H is gone. Some of the details of the line profile evolution are interesting. Note that H is blended with weak emission from He ii 6560, which produces a small bump of excess emission on the blue wing of H at 130 km s-1; this is discussed at the end of the current section.
First, we consider the evolution of the intermediate-width component. Aside from an overall fading with time, the shape of the red wing of the line changes little, with a gradual reduction in maximum velocity from about 2,000 km s-1 on the first epoch down to about 1,000 km s-1 a week later. Some of this apparent slowing may simply arise because the extremes of the line wings fade below the noise, but it may also result from cooling of the region where the electron scattering occurs.
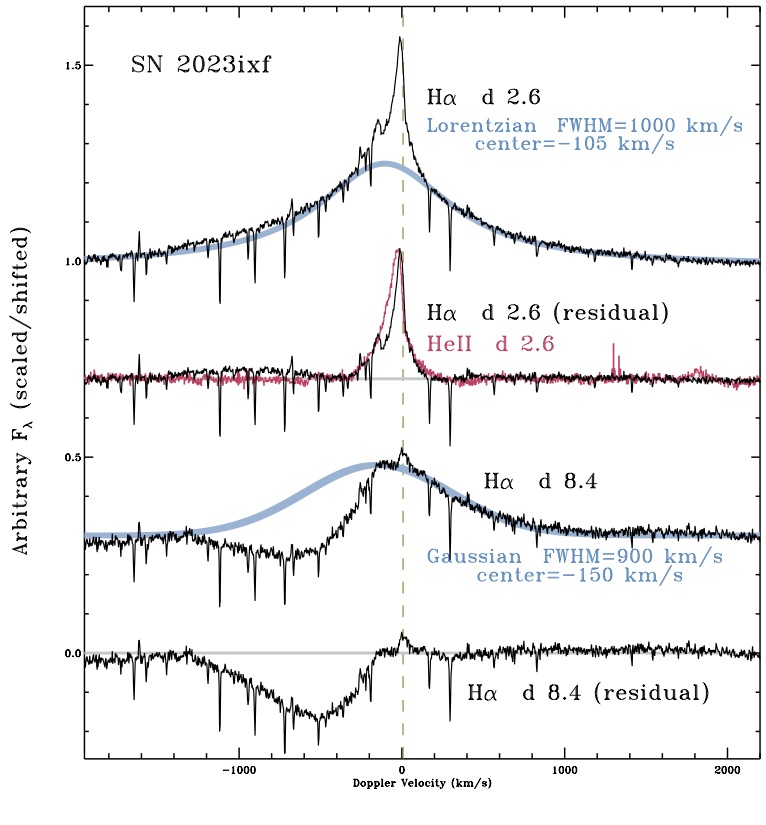
There are more dramatic and important changes occurring on the blue wing of the line. At first the blue wing appears as a nearly symmetric reflection of the red wing, extending to 2,000 km s-1. However, the blue side fades more quickly than the red wing, steadily transforming into an intermediate-width P Cygni absorption feature with a trough at 700 km s-1 and a blue edge at about 1,300 km s-1. This change is physically significant. The intermediate-width wings of interacting SNe are often presumed to be caused by thermal electron scattering of the narrow line emission, broadening those narrow line photons into wings that can be approximated by a Lorentzian shape (Chugai, 2001; Smith et al., 2008; Smith, 2017). This is the case for our first spectrum on day 2.6 (Fig. 8). A Lorentzian with a FWHM=1000 km s-1 and with a center shifted 105 km s-1 to the blue matches the line wing shapes of H on day 2.6 reasonably well, except for some low-level broad excess emission on the blue wing. Electron scattering is thermal, and the wings are expected to be symmetric about the wavelength of the original narrow-line photons.333Although note that the original velocity of the line photons that were scattered and therefore define the center of the Lorentzian (at 105 km s-1) is not necessarily the same as the velocity of the observed narrow line photons that have escaped without scattering (22 km s-1) if there is asymmetry, asymmetric illumination of the CSM, or a velocity gradient in the CSM; this is likely to be the case, as we discuss later in Section 4. However, the observed narrow emission does span a range of velocity that includes the centroid of the Lorentzian. Therefore, the 105 km s-1 blueshifted centroid of this 1000 km s-1 Lorentzian makes sense in this case, since the narrow emission that is being scattered and broadened spans a similar range of velocity.
However, electron scattering cannot turn narrow emission into a broad absorption feature. The transition of SN 2023ixf’s H line to an intermediate-width P Cygni absorption feature requires that after day 3, we are seeing Doppler-shifted absorption and emission by accelerated H atoms in the post-shock gas, and not emission from slow moving pre-shock gas that has been broadened mostly by electron scattering (although electron scattering may obviously still influence the red wing of the line, for example).
The fact that this broader absorption increases in strength over a time period when the narrow emission component mostly fades away strongly suggests that after a few days, most of the pre-shock CSM has been swept up by the shock. After that, H emission and absorption traces CSM that has been hit by the forward shock and accelerated, being swept up into a dense post-shock shell (often called the “cold dense shell”, or CDS, in SNe IIn). By day 8.4, the red wing of the line can no longer be well matched by a Lorentzian shape; instead, a Gaussian function with FWHM=900 km s-1 and with its center shifted to the blue by 150 km s-1 gives a better match (Fig. 8). The fact that the CDS is seen in absorption against the SN continuum photosphere requires that it has indeed cooled. Similar intermediate-width absorption features arising in the CDS are seen in some SNe IIn, including SN 2006gy (Smith et al., 2010) and SN 1994W (Chugai et al., 2004). We also note that the width and shape of the H P Cygni profile on day 8.4 is very similar to He i 5876 on the same date (Fig. 6).
Although the intermediate-width H persists longer than the high-ionization lines, it doesn’t last long. Figure 7 also shows the observed H profile in a PEPSI spectrum on day 17.6 (gray). While there is a gap in our spectral coverage, this shows that the intermediate-width emission component of H is gone by a little over 2 weeks after explosion. There is still a kink at around zero velocity, hinting at some persistent intermediate-width P Cygni absorption of H at this time. However, there is also a deficit of flux at high velocity (resembling a lower continuum level on the blueshifed side of the line on day 17.6; Fig 7), suggesting that the broad absorption from SN ejecta is beginning to influence the spectra by this epoch.
The narrow component of H, presumably arising from the pre-shock CSM, shows surprisingly complex profile evolution. Excluding the effects of broadening from electron scattering discussed above, one might expect to see a very narrow (10-20 km s-1) and symmetric profile shape from the core of an emission line arising from a more-or-less spherical and slow RSG wind, but this is evidently not the case in SN 2023ixf.
The inset (upper right) in Figure 7 documents changes in line profile shape of the narrow component of H (see also Fig. 8). At our first epoch (day 2.6; black), the narrow component is asymmetric (a broader blue wing and sharper drop on the red side), it has a blueshifted centroid (at about 25 km s-1), and it has a FWHM of 48 km s-1. At the second epoch on day 3.5 (red) it becomes weaker, broader (FWHM = 79 km s-1), and even more blueshifted (centroid velocity of 42 km s-1). In both of these first two epochs, the narrow component seems rather abruptly cut off at zero velocity on the red wing. After that, the narrow component becomes much weaker, and settles down to a more symmetric and narrower (FWHM 45 km s-1) emission component that has a centroid closer to zero velocity or even slightly redshifted (about +8 km s-1). At all epochs, the FWHM of the narrow component is resolved, being significantly larger than the instrumental resolution of about 6 km s-1.
How shall we interpret the changing offsets in the centroid velocities of the narrow emission component? In Section 3.1, we noted that the centroid velocities of the interstellar Na i D absorption (after correction for M101’s redshift of =0.000804) was 7 km s-1, which we take to be the likely systemic velocity of the progenitor. This agrees (to within 1 km s-1) with the centroid velocity that we measure for the narrow H component at 1 week post-explosion. One possible interpretation of this is that the lingering narrow emission centered on the systemic velocity with a resolved width of 45 km s-1 corresponds to photoionized gas in distant regions of the progenitor’s RSG wind, which may be roughly spherical, or at least symmetric about the systemic velocity. This, in turn, means that the pronounced blueshift of the narrow H component on days 2-3 (as well as the similar blueshift of narrow components of He ii and other high ionization lines on these same dates) is real. Thus, in early epochs, we are seeing emission from inner regions of the CSM that are predominantly on the near side of the SN, which are expanding toward us at 30-50 km s-1 or more (the observed blueshifts are even larger for higher ionization lines). We return to the implications of this blueshifted narrow emission later in Section 4.
At no time during the first week do the spectra show any hint of a narrow P Cygni absorption component in H that might arise from absorption along the line of sight through dense, slow, pre-shock CSM. Such narrow absorption features from the pre-shock CSM are often seen in SNe IIn, providing that spectra have sufficient resolution (e.g. Salamanca et al., 2002; Trundle et al., 2008; Chugai, 2019; Smith et al., 2010; Smith & Andrews, 2020). We note that the narrow emission bump seen at 130 km s-1 is actually weak narrow emission from He ii 6560 superposed on the blue side of the H line. It is not a separate velocity component of H, and the gap between these two is not narrow P Cygni absorption of H. The expected systemic velocity of this He ii line is marked with a vertical dashed magenta line in Figure 7. The emission feature in question is blueshifted from this reference position by about 30 km s-1, similar to the blueshift of the narrow components in other lines at the same early epoch. The lack of narrow P Cyg absorption may suggest that the CSM is asymmetric, as discussed below.
4 Discussion
4.1 Blueshifted Narrow features and the CSM Speed
As noted above, all of the emission lines seen in our first PEPSI epoch on day 2.6 have narrow emission peaks that are blueshifted (see Figures 3 and 7). Recall that the presumed systemic velocity of SN 2023ixf (indicated by Na i D absorption) is at 7 km s-1 relative to the average redshift of M101. Relative to the systemic velocity, the narrow H peak is at 22 km s-1 and the narrow emission component extends from about 15 km s-1 at the drop on the red side, reaching out to about 100 km s-1 or more on the blue side. Similarly, the high ionization lines (He ii, C iv, N iv) have their strongest narrow emission on day 2.6 ranging from about 0 km s-1 to 150 or 200 km s-1.
Thus, it appears that the narrow emission on day 2.6 is being emitted by expanding CSM that is primarily on the near (approaching) side of the SN. This has been seen before in early spectra of interacting SNe, and seems to be well understood as being due to the combined effects of light travel time in the presence of a variable illumination source and occultation by the SN photosphere (Groh, 2014; Shivvers et al., 2015; Gräfener & Vink, 2016). This does not mean that the CSM is actually one sided, but that we are not able to detect as much emission from the redshifted side of the CSM because it is blocked from our view or not yet fully illuminated, depending on the time after explosion. If much of the redshifted CSM emission is missing, this is important for interpreting the velocities.
Figure 9 shows a detail of the narrow H component in our first spectrum, after subtracting away a broad Lorentzian as in Figure 8. This is compared to a narrow Lorentzian function centered at the systemic velocity of 7 km s-1, matching the blue wing of H (note that this curve does not match the excess emission bump at 130 km s-1, which is due to emission from He ii 6560 superposed on the H line; with this assumed line center at +7 km s-1, the uncertainty in the Lorentzian FWHM is about 10 km s-1). This symmetric Lorentzian curve demonstrates what the true symmetric narrow H emission from the CSM would look like at this epoch, if we could detect all of it. This, in turn, tells us that the CSM expansion speed indicated by the narrow H profile is actually about 115 km s-1. This is much faster than a typical RSG wind of 20 km s-1.
However, interpreting this blueshifted emission is complicated by the fact that the amount of blueshift is different for different lines (tracing different ionization levels), and the amount of blueshift in the narrow components is time dependent. This is discussed next.
4.2 Acceleration of the pre-shock CSM
Figure 9 illustrates the complex time-dependent and ionization-dependent evolution of the narrow emission components from the pre-shock CSM in our first two epochs of PEPSI spectra (these are day 2.6 and 3.5, shown in the middle and bottom tracings in Fig. 9, respectively). Note that we have removed the broader wings of these profiles by subtracting Lorentzian functions with FWHM values of around 1000 km s-1 (as shown for H in Fig.8). Figure 9 includes narrow profiles of H (black), He ii (magenta), and C iv (green), which trace recombination emission from increasing ionization levels (13.6 eV, 54.4 eV, and 64.5 eV, respectively). Figure 9 does not include N iv because of its relatively low signal to noise.
On day 2.6 (middle tracings), all the narrow lines are blueshifted, but there is a remarkable and systematic increase in both width and in the amount of blueshift of the line center as we move from H to He ii and then to C iv. Basically, higher ionization lines exhibit faster outflow speed. There are two potential explanations for this.
1. The source function for each of these lines may have a slightly different radial dependence in an ionized pre-shock CSM, because of radial gradients in CSM density and ionization level (e.g., Groh, 2014). For example, one might expect higher ionization lines to arise closer the shock, and H to be emitted from a more distant region. If there is a velocity gradient in the CSM (with faster velocities at smaller radii), this might account for why higher ionization lines show faster outflow speeds. However, this would require a very steep velocity gradient (increasing by a factor of more than 2 from H to C iv) in a narrow radial zone. In the models presented by Groh (2014), the CSM velocity was assumed to be constant with radius, but new models may be able to quantify the velocity gradient that would be needed to explain the observed profiles. The required velocity gradient is not only steep, but decreases with radius (faster outflow at smaller radii). This is the opposite of what is expected for a Hubble-like flow from a sudden burst of pre-SN mass loss, and it is the opposite of an acceleration zone of a stellar wind that eventually reaches its terminal speed at a large radius. Instead, it would point to either dramatic radiative acceleration of the inner pre-shock CSM by the radiation from the shock itself, or to an outflow speed that was increasing during the few years preceding explosion. If the CSM is very dense, a small mean free path could lead to a sharp velocity gradient immediately ahead of the shock, and this would be an interesting problem for detailed models to quantify. On the other hand, a rapidly changing outflow speed in the pre-SN ejection is perhaps plausible but is ad hoc.
2. Another possibility is that the CSM is asymmetric. Imagine that the SN blast wave hits CSM with a disk or torus geometry that has a dropping density away from the equatorial plane. In the equatorial plane, the forward shock will hit the densest CSM and will be decelerated the most. Moving out of the plane, the shock will encounter relatively less dense CSM, and hence, the forward shock will decelerate less and will continue outward at a higher speed. At these intermediate latitudes, the faster shock will yield hotter post-shock gas, and so the CSM immediately ahead of the shock will be illuminated by a harder radiation field from the shock. Thus, we might expect to see higher ionization tracers (i.e. C iv) coming preferentially from higher latitudes in the immediate pre-shock environment, and lower ionization (H) emitted by CSM in the dense equatorial plane. The different velocities at different ionization might then arise because the less dense CSM out of the plane also has less inertia, and will therefore experience more radiative acceleration, or because gas at mid-latitudes was ejected with higher speeds than gas in the equator, as commonly seen in bipolar nebulae. This is a difficult scenario to investigate theoretically, because it requires 3-D radiation hydrodynamics with line transfer. However, if the pre-shock mean free path is small at these high densities, one might address the question with a series of spherical calculations with shocks running into a range of different CSM density.
So far we have only discussed the narrow profiles in our first epoch on day 2.6; the bottom tracings in Figure 9 show that the situation changes markedly one day later on day 3.5. Namely, the stark differences in velocity in the three different lines are mostly gone. While the red edge of the narrow component of H still extends closer to zero, the width and blueshifted centroid velocity are now much more similar for the three lines. The essential change is that most of the narrow peak of H is gone, making the H line appear broader and more blueshifted (see the inset of Figure 7), and He ii as well to a lesser degree, making all three lines similar. The factor of 2 difference in velocity between H and C iv is now gone. As above, there are again two potential explanations for this change:
1. We may be seeing direct evidence for the pre-shock radiative acceleration of CSM. After more time has passed, the radiation field has accelerated the rest of the slower CSM traced by H emission so that it now shares the faster expansion speeds seen in higher ionization gas. Detailed models would be needed to confirm that the timescale and amount of acceleration (as well as the difference between H and the higher ionization lines) is plausible.
2. Another possibility arises if the CSM is asymmetric. As noted earlier, the slowest and densest CSM in the equatorial plane that emitted the narrow peak of H would be at a smaller radius because the blast wave in this direction gets decelerated the most. As such, the dense and slow equatorial CSM at the narrow pinched waist would be the first to be enveloped by the expanding SN photosphere. In this scenario, the H line would appear broader simply because the narrowest emission is engulfed and hidden by the SN ejecta and therefore removed from the observed line profile, not because that slow gas is accelerated. This would be consistent with the fact that the flux of the narrow component of H drops precipitously in this first day, and with the apparent change in shape of the narrow H line (again, see the d 2.6 and d 3.5 profiles in the inset of Figure 7).
One difference that may help discriminate between these two possibilities concerns the relative density of the emitting CSM. In the spherical case (option 1 for both epochs discussed above), the narrower H emission comes from lower ionization zones at larger radii, and therefore should have lower densities compared to the He ii and C iv emitting zones. In the aspherical second case, the narrowest H is emitted by the densest CSM at the equator, while the higher speeds at higher ionization result from lower densities at higher latitudes. Perhaps future modeling of the spectrum can help quantify the physical conditions in the emitting zones. Although it is tempting to ascribe the increasing H speed from day 2.6 to day 3.5 to radiative acceleration of the CSM, it is difficult to confirm this with available information because asymmetry (which might be expected anyway) also provides a suitable and perhaps more straightforward explanation.
4.3 Disappearing narrow lines and CSM radius
Regardless of the details discussed above, the fact that the narrow emission lines disappear after a few days — a defining characteristic of this class of events — provides a straightforward way to estimate the radial extent of the dense CSM. Combined with empirical expansion speeds, this can inform the timescale for the pre-SN mass loss by the progenitor. Whether the CSM is obliterated by the forward shock or enveloped by the SN photosphere, the narrow lines should disappear from the spectrum.
Narrow lines disappear after 1-2 days in our PEPSI spectra, and the intermediate-width lines disappear after 3-4 days. We assume that our first spectrum on May 21 was taken 2.6 days after explosion, so this means that the narrow lines disappear in 3.6-4.6 days, and the intermediate-width components (except H) disappear after 5.6-6.6 days. These timescales can be used to constrain the properties of the CSM.
In these early phases, we adopt an expansion speed for the SN ejecta photosphere of 10,000 km s-1. The speed may be a bit slower as time goes on, and the fastest ejecta are faster than this, but this assumption is sufficient for a rough estimate. At this speed the relevant radius corresponding to the disappearance of the narrow components on day 3.6 is = = (3-5)1014 cm or about 20-30 AU. This is only 5-10 for a typical RSG. The corresponding timescale of the pre-SN mass ejection depends, of course, on the expansion speed of the CSM; i.e. . For CSM produced by a normal RSG wind speed of 10-20 km s-1, the CSM would have been ejected 5-10 years before explosion. For a faster CSM expansion speed corresponding to the observationally inferred expansion speed of 115 km s-1 (see Fig 9), the pre-SN timescale for mass ejection is more like 0.9-1.5 yr.
Which one of these is correct returns us to the ambiguous question of whether the CSM is aspherical and if it has already been radiatively accelerated by the time of our first PEPSI spectrum on day 2.6. A timescale of 5-10 yr, expected for a normal slow RSG wind speed, does not match any expected timescale for late nuclear burning, but it is similar to the observationally inferred timescales for some SNe IIn (Smith, 2017). We should not, however, necessarily expect a phase of extreme pre-SN mass loss to behave like a normal RSG wind. On the other hand, a pre-SN ejection timescale of 1 yr, derived from the observed CSM speed, agrees well with the expected time for Ne or O burning. This agreement may favor instabilities in late Ne or O burning as the culprit for triggering the extreme pre-SN mass loss for SN 2023ixf. However, recent studies suggest that wave driving on its own may be unlikely to drive severe mass loss, instead being more likely to inflate the star’s envelope (Leung & Fuller, 2020). As proposed by Smith & Arnett (2014), however, this type of sudden pre-SN swelling may trigger severe and asymmetric mass loss in binary systems.
4.4 Intermediate width features: Fading away, not broadening
As noted above, the intermediate-width components of emission last longer than the narrow lines, which fade after 1-2 days. This is especially true of H, which persists for at least a week after explosion as a strong, intermediate-width P Cygni line. The intermediate-width emission component of H disappears after another week or so, being gone by day 17.6 (gray spectrum in Fig. 7). Unlike H, the intermediate-width components of the higher ionization lines (He ii, C iv, N iv) do not develop any P Cygni absorption features before they vanish after a few days. Why does this happen?
One reason for high-ionization lines to fade is recombination of the gas. We noted above, however, that as the N iv and C iv lines fade and disappear, we do not see a corresponding increase in strength of N iii and C iii lines. Also, although He i 5876 (only seen as an intermediate-width component) does increase in strength as He ii fades, it never gets very strong, and it has disappeared again by day 17.7 (Fig. 3b). Thus, even though we do see some evidence of recombination and cooling in the post-shock CDS (from H P Cygni absorption and the increasing He i emission), recombination is not the primary explanation for the disappearance of the N iv and C iv lines.
Another reason why the intermediate-width emission from the post-shock shell might fade would be if the SN ejecta that feed the reverse shock are able to accelerate the shock front, essentially obliterating the slower moving post shock gas as it is swept up to become part of the fast SN ejecta moving at 5,000-10,000 km s-1. In this case, we would expect the intermediate-width lines to broaden from 1,000 to 5,000 km s-1 or more as they fade. This is not what the observational data show either. Instead, the intermediate-width components stay at about the same width or even become slightly narrower as they fade away. Importantly, on days 7.6 and 8.4 when the high-ionization lines have vanished, the P Cygni absorption seen in H and He i still maintains the same slower speeds of 500-1,300 km s-1. This directly contradicts the idea that the post-shock shell is getting faster. We therefore find it unlikely that the CSM interaction signatures fade because the post shock shell is accelerated and incorporated into the SN ejecta.
One last possibility arises if the CSM is significantly asymmetric, as in a case where the CSM is primarily equatorial. As noted above, the shock front that crashes into the densest material in the equator will be decelerated by the CSM. However, in other directions with much less dense CSM, the SN ejecta will expand unimpeded. Since the CSM here is found at radii of 20-30 AU, whereas the SN photosphere will eventually reach a radius of around 100 AU, the slower CSM interaction regions in the equatorial zones can be engulfed by the SN ejecta and hidden inside the SN photosphere. The opaque SN ejecta will wrap around the disk, if the disk is slow and thin enough. Even if the SN ejecta do not completely engulf the disk, it may be hidden from observers, as discussed in detail previously by Smith et al. (2015), and invoked as the explanation for the bizarre behavior of iPTF14hls (Andrews & Smith, 2018). In this scenario, the CSM interaction zone with its relatively slow CDS may still be there, but its emission is blocked from our view or completely thermalized by the surrounding optically thick SN ejecta. There are observed cases where the CSM interaction persists while it is hidden beneath the photosphere, and signatures of strong CSM interaction reappear when the recombination photosphere recedes (i.e. after the plateau drops), as in PTF11iqb, iPTF14hls, SN 1993J, and SN 1998S (Smith et al., 2015; Andrews & Smith, 2018; Pozzo et al., 2004; Matheson et al., 2000; Smith et al., 2017). On the other hand, if the asymmetric CSM has a low-enough total mass, it may indeed get obliterated and incorporated into the fast SN ejecta during the time when it is hidden beneath the photosphere, yielding little or no lingering CSM interaction signatures after the photosphere recedes. It will be interesting to see what happens after SN 2023ixf fades from its plateau and/or enters it nebular phase in a few months.
Note that this scenario where the CSM interaction region is engulfed by the SN photosphere only works of the CSM is highly asymmetric. Of the various pre-SN ejection mechanisms related to late-phase nuclear burning mentioned in the introduction (wave driving, super-Eddington winds, etc.), only pre-SN binary interaction triggered by envelope inflation (Smith & Arnett, 2014) is necessarily expected to produce strong asymmetry in the CSM. This may turn out to be an important clue to the pre-SN mass loss.
Overall, the observational data seem to favor a scenario where the narrow lines fade and disappear mostly because the slow-moving CSM is swept up by the shock and accelerated, or even occulted. The intermediate-width components that are emitted by this shocked and accelerated CSM disappear a few days later because they are engulfed by and hidden inside the SN photosphere, and not because they are accelerated to the same speed as the SN ejecta or because the ionized CSM recombines. Engulfing the CSM interaction region rather than accelerating to the same speed as the ejecta requires that the CSM is asymmetric, as noted above, and probably indicates that we are observing the SN from some mid-latitude direction that is offset from the equatorial plane. This, in turn, is also consistent with the lack of any narrow P Cygni features in any of the high resolution PEPSI spectra. This lack of narrow P Cygni absorption suggests asymmetry in the CSM because the slow CSM is not seen in absorption along our line of sight to the SN continuum photosphere, even though it is clearly seen in emission. This is only possible if the CSM is not spherical.
Although we argue that the CSM is asymmetric in the case of SN 2023ixf based on the observational behavior of the narrow and intermediate-width lines, this may not necessarily be the case for all SNe II with fleeting CSM interaction. It would be interesting to determine what fraction of these events show evidence of aspherical mass ejection shortly before explosion, and how many seem consistent with spherical CSM. This may help elucidate what role binary interaction may play in ejecting the mass, or shaping the mass ejected by some other mechanism.
4.5 Noteworthy things we do not see
Here we briefly comment on a few things that we do not see in the PEPSI spectra of SN 2013ixf, but which have been seen in early spectra of some other SNe II with fleeting signs of CSM interaction. These may help us to understand how SN 2023ixf fits into the observed diversity of this phenomenon.
1. Except for very weak and narrow components on day 2.6, we do not detect lines like the C iii and N iii blend in the “WR bump” just to the blue side of He ii 4686, or strong emission from narrow He i that has been seen in other early spectra of SN 1998S, PTF11iqb, 2013cu, and others (Shivvers et al., 2015; Smith et al., 2015; Gal-Yam et al., 2014).
2. We do not detect a broad emission feature near at any epoch. This broadened feature has been seen in several SNe II-P with fleeting CSM interaction signatures (Quimby et al., 2007; Bullivant et al., 2018; Hosseinzadeh et al., 2018; Andrews et al., 2019; Soumagnac et al., 2020; Pearson et al., 2023; Hosseinzadeh et al., 2022), and is often attributed to broad blueshifted He ii 4686 emission from fast (5,000-10,000 km s-1) SN ejecta crossing the reverse shock, or a blend of He ii 4686 with several other ionized features in the region. On the other hand, very broad features may be de-emphasized by the continuum normalization in these cross-dispersed spectra if a faint broad feature crosses more than one echelle order, so low-resolution spectra may be more informative about this broad He ii feature.
3. Importantly, as noted above we see no evidence for narrow P Cygni (or any) narrow absorption from unshocked CSM. While narrow absorption features can easily be lost in low-resolution spectra when they are seen next to a strong narrow emission feature, they are easily detected in echelle spectra (Smith & Andrews, 2020). The absence of this absorption in SN 2023ixf may indicate that its slow and dense CSM is not seen along our line of sight to the continuum photosphere, requiring that the CSM has a nonspherical geometry. This would allow it to be seen in emission out of our line of sight, but not in absorption.
5 Summary and Conclusions
We present a series of high-resolution echelle spectra of the recent SN 2023ixf in M101. These provide an unprecedented record of the high-resolution emission-line evolution in a SN II with early signs of CSM interaction with an almost nightly cadence. These spectra reveal rapid evolution in the strength and profile shape of narrow and intermediate-width emission lines associated with CSM interaction. Here is a summary of the main observational results:
1. As in other SN of this class, we detect strong narrow and intermediate-width emission from H and high-ionization lines such as He ii, C iv, and N iv. Unlike several other SNe of this class, however, SN 2023ixf does not show strong emission from lower-ionization species like He i or C iii/N iii, which can be very strong in these objects. These lines are seen, but they are very weak and limited in time during our observational window.
2. All narrow line components fade quickly in 1-2 days from our first observation (which is a time period of 2-4 days post-explosion), and intermediate-width components of high-ionization lines linger for another 1-2 days before fading from the spectrum.
3. All narrow emission components show a pronounced blueshift in the earliest epochs. The blueshift is understood as resulting from a combination of light travel time effects and occultation of the far side of the CSM by the photosphere. However, the amount of blueshift and the width of the narrow component depends on both time and on the ionization level of the line. Higher ionization lines are broader and more blueshifted than lower ionization in our first epoch, and this difference with ionization level diminishes after a day with all lines showing roughly the same width and blueshift as the higher ionization species. This requires either acceleration of the innermost dense CSM, or asymmetric CSM.
4. The H wings in our first epoch are consistent with electron scattering wings (i.e. they are well fit by a symmetric Lorentzian shape, with a centroid that has a similar blueshift as the narrow component). However, this changes after 1-2 days. H and He i lines develop intermediate-width P Cygni absorption, requiring that the broadening of these lines after the first day or two is tracing kinematic expansion and is not due only to electron scattering. The P Cygni absorption indicates expansion speeds of 700-1,300 km s-1, tracing CSM that has been swept up in to the post-shock shell.
5. As the intermediate-width components fade, the observed velocities do not increase. The P Cygni absorption, in particular, remains steady at 1300 km s-1. This requires that the CSM interaction signatures are not fading because the post-shock gas is getting accelerated and incorporated into the fast SN ejecta. Instead, the CSM interaction region is likely asymmetric and gets engulfed and hidden by the SN photosphere.
6. Although the narrow components are easily resolved in our echelle spectra, none of our spectra show narrow P Cyg absorption from dense pre-shock CSM along our line-of-sight to the continuum photosphere. This may require that the CSM is asymmetric.
7. The width of the narrow H component indicates a CSM expansion speed of about 115 km s-1, and this is seen in our first epoch before the H appears to get accelerated to the same blueshift and width as the higher ionization lines. This expansion speed is 5-10 times faster than a normal RSG wind.
8. The disappearance of the CSM interaction signatures after a few days suggests that the CSM is confined to a relatively compact radius of 20-30 AU (or 1014.7 cm). This radius, combined with its observed expansion speed of 115 km s-1, implies that the CSM was ejected roughly 1 yr before core collapse.
Altogether, we find several clues that the confined CSM of SN 2023ixf is asymmetric. We interpret the evolution of the line profiles as indicating that the asymmetric CSM interaction region is engulfed by the SN photosphere (e.g., Smith et al. 2015). While the narrow lines may weaken because the pre-shock gas is accelerated and incorporated into the post-shock shell, the resulting intermediate-width lines are hidden from view behind the SN photosphere, rather than the high-ionization lines fading away because the shocked shell is accelerated or because the gas recombines. While the inferred timescale for creating SN 2023ixf’s pre-SN CSM is about a year (which suggests an instability during Ne or O burning), the implied asymmetry in the CSM points to a scenario where pre-SN inflation during Ne or O burning will instigate binary interaction that ejects mass into a disk or torus. Thus, CSM interaction may continue to occur as SN ejecta hit the engulfed CSM, but it may be hidden from our view. Depending on the mass of the CSM, CSM interaction signatures may reappear after SN 2023ixf drops from its pleateau when the recombination photosphere recedes again.
References
- Andrews & Smith (2018) Andrews, J. E., & Smith, N. 2018, MNRAS, 477, 74, doi: 10.1093/mnras/sty584
- Andrews et al. (2019) Andrews, J. E., Sand, D. J., Valenti, S., et al. 2019, ApJ, 885, 43, doi: 10.3847/1538-4357/ab43e3
- Arnett & Meakin (2011) Arnett, W. D., & Meakin, C. 2011, ApJ, 741, 33, doi: 10.1088/0004-637X/741/1/33
- Beasor et al. (2020) Beasor, E. R., Davies, B., Smith, N., et al. 2020, MNRAS, 492, 5994, doi: 10.1093/mnras/staa255
- Beasor & Smith (2022) Beasor, E. R., & Smith, N. 2022, ApJ, 933, 41, doi: 10.3847/1538-4357/ac6dcf
- Benetti et al. (1994) Benetti, S., Patat, F., Turatto, M., et al. 1994, A&A, 285, L13
- Bruch et al. (2021) Bruch, R. J., Gal-Yam, A., Schulze, S., et al. 2021, ApJ, 912, 46, doi: 10.3847/1538-4357/abef05
- Bullivant et al. (2018) Bullivant, C., Smith, N., Williams, G. G., et al. 2018, MNRAS, 476, 1497, doi: 10.1093/mnras/sty045
- Chiosi & Maeder (1986) Chiosi, C., & Maeder, A. 1986, ARA&A, 24, 329, doi: 10.1146/annurev.aa.24.090186.001553
- Chugai (2001) Chugai, N. N. 2001, MNRAS, 326, 1448, doi: 10.1111/j.1365-2966.2001.04717.x
- Chugai (2019) —. 2019, Astronomy Letters, 45, 71, doi: 10.1134/S106377371902004X
- Chugai et al. (2004) Chugai, N. N., Blinnikov, S. I., Cumming, R. J., et al. 2004, MNRAS, 352, 1213, doi: 10.1111/j.1365-2966.2004.08011.x
- de Vaucouleurs et al. (1995) de Vaucouleurs, G., de Vaucouleurs, A., Corwin, H. G., et al. 1995, yCat, 7155, 0. https://ui.adsabs.harvard.edu/abs/1995yCat.7155....0D
- Drout et al. (2011) Drout, M. R., Soderberg, A. M., Gal-Yam, A., et al. 2011, ApJ, 741, 97, doi: 10.1088/0004-637X/741/2/97
- Fuller (2017) Fuller, J. 2017, MNRAS, 470, 1642, doi: 10.1093/mnras/stx1314
- Gal-Yam et al. (2014) Gal-Yam, A., Arcavi, I., Ofek, E. O., et al. 2014, Nature, 509, 471, doi: 10.1038/nature13304
- Garnavich & Ann (1994) Garnavich, P. M., & Ann, H. B. 1994, AJ, 108, 1002, doi: 10.1086/117130
- Gräfener & Vink (2016) Gräfener, G., & Vink, J. S. 2016, MNRAS, 455, 112, doi: 10.1093/mnras/stv2283
- Groh (2014) Groh, J. H. 2014, A&A, 572, L11, doi: 10.1051/0004-6361/201424852
- Heger et al. (2003) Heger, A., Fryer, C. L., Woosley, S. E., Langer, N., & Hartmann, D. H. 2003, ApJ, 591, 288, doi: 10.1086/375341
- Hosseinzadeh et al. (2018) Hosseinzadeh, G., Valenti, S., McCully, C., et al. 2018, ApJ, 861, 63, doi: 10.3847/1538-4357/aac5f6
- Hosseinzadeh et al. (2022) Hosseinzadeh, G., Kilpatrick, C. D., Dong, Y., et al. 2022, ApJ, 935, 31, doi: 10.3847/1538-4357/ac75f0
- Hosseinzadeh et al. (2023) Hosseinzadeh, G., Farah, J., Shrestha, M., et al. 2023, arXiv e-prints, arXiv:2306.06097, doi: 10.48550/arXiv.2306.06097
- Ilyin (2000) Ilyin, I. V. 2000, PhD thesis, University of Oulu, Division of Astronomy
- Jacobson-Galán et al. (2022) Jacobson-Galán, W. V., Dessart, L., Jones, D. O., et al. 2022, ApJ, 924, 15, doi: 10.3847/1538-4357/ac3f3a
- Jacobson-Galan et al. (2023) Jacobson-Galan, W. V., Dessart, L., Margutti, R., et al. 2023, arXiv e-prints, arXiv:2306.04721, doi: 10.48550/arXiv.2306.04721
- Khazov et al. (2016) Khazov, D., Yaron, O., Gal-Yam, A., et al. 2016, ApJ, 818, 3, doi: 10.3847/0004-637X/818/1/3
- Kilpatrick et al. (2023) Kilpatrick, C. D., Foley, R. J., Jacobson-Galán, W. V., et al. 2023, arXiv. https://arxiv.org/abs/2306.04722
- Leonard et al. (2000) Leonard, D. C., Filippenko, A. V., Barth, A. J., & Matheson, T. 2000, ApJ, 536, 239, doi: 10.1086/308910
- Leung & Fuller (2020) Leung, S.-C., & Fuller, J. 2020, ApJ, 900, 99, doi: 10.3847/1538-4357/abac5d
- Matheson et al. (2000) Matheson, T., Filippenko, A. V., Ho, L. C., Barth, A. J., & Leonard, D. C. 2000, AJ, 120, 1499, doi: 10.1086/301519
- Niemela et al. (1985) Niemela, V. S., Ruiz, M. T., & Phillips, M. M. 1985, ApJ, 289, 52, doi: 10.1086/162863
- Paczyński (1971) Paczyński, B. 1971, ARA&A, 9, 183, doi: 10.1146/annurev.aa.09.090171.001151
- Pearson et al. (2023) Pearson, J., Hosseinzadeh, G., Sand, D. J., et al. 2023, ApJ, 945, 107, doi: 10.3847/1538-4357/acb8a9
- Perley et al. (2023) Perley, D. A., Gal-Yam, A., Irani, I., & Zimmerman, E. 2023, Transient Name Server AstroNote, 119, 1
- Pledger & Shara (2023) Pledger, J. L., & Shara, M. M. 2023, arXiv e-prints, arXiv:2305.14447, doi: 10.48550/arXiv.2305.14447
- Podsiadlowski et al. (1992) Podsiadlowski, P., Joss, P. C., & Hsu, J. J. L. 1992, ApJ, 391, 246, doi: 10.1086/171341
- Poznanski et al. (2012) Poznanski, D., Prochaska, J. X., & Bloom, J. S. 2012, MNRAS, 426, 1465, doi: 10.1111/j.1365-2966.2012.21796.x
- Pozzo et al. (2004) Pozzo, M., Meikle, W. P. S., Fassia, A., et al. 2004, MNRAS, 352, 457, doi: 10.1111/j.1365-2966.2004.07951.x
- Puls et al. (2008) Puls, J., Vink, J. S., & Najarro, F. 2008, A&A Rev., 16, 209, doi: 10.1007/s00159-008-0015-8
- Quataert & Shiode (2012) Quataert, E., & Shiode, J. 2012, MNRAS, 423, L92, doi: 10.1111/j.1745-3933.2012.01264.x
- Quimby et al. (2007) Quimby, R. M., Wheeler, J. C., Höflich, P., et al. 2007, ApJ, 666, 1093, doi: 10.1086/520532
- Salamanca et al. (2002) Salamanca, I., Terlevich, R. J., & Tenorio-Tagle, G. 2002, MNRAS, 330, 844, doi: 10.1046/j.1365-8711.2002.05167.x
- Sana et al. (2012) Sana, H., de Mink, S. E., de Koter, A., et al. 2012, Science, 337, 444, doi: 10.1126/science.1223344
- Schlafly & Finkbeiner (2011) Schlafly, E. F., & Finkbeiner, D. P. 2011, ApJ, 737, 103, doi: 10.1088/0004-637X/737/2/103
- Schlegel (1990) Schlegel, E. M. 1990, MNRAS, 244, 269
- Shiode & Quataert (2014) Shiode, J. H., & Quataert, E. 2014, ApJ, 780, 96, doi: 10.1088/0004-637X/780/1/96
- Shiode et al. (2013) Shiode, J. H., Quataert, E., Cantiello, M., & Bildsten, L. 2013, MNRAS, 430, 1736, doi: 10.1093/mnras/sts719
- Shivvers et al. (2015) Shivvers, I., Groh, J. H., Mauerhan, J. C., et al. 2015, ApJ, 806, 213, doi: 10.1088/0004-637X/806/2/213
- Smith (2014) Smith, N. 2014, ARA&A, 52, 487, doi: 10.1146/annurev-astro-081913-040025
- Smith (2017) —. 2017, in Handbook of Supernovae, ed. A. W. Alsabti & P. Murdin, 403, doi: 10.1007/978-3-319-21846-5_38
- Smith & Andrews (2020) Smith, N., & Andrews, J. E. 2020, MNRAS, 499, 3544, doi: 10.1093/mnras/staa3047
- Smith & Arnett (2014) Smith, N., & Arnett, W. D. 2014, ApJ, 785, 82, doi: 10.1088/0004-637X/785/2/82
- Smith et al. (2008) Smith, N., Chornock, R., Li, W., et al. 2008, ApJ, 686, 467, doi: 10.1086/591021
- Smith et al. (2010) Smith, N., Chornock, R., Silverman, J. M., Filippenko, A. V., & Foley, R. J. 2010, ApJ, 709, 856, doi: 10.1088/0004-637X/709/2/856
- Smith et al. (2011) Smith, N., Li, W., Filippenko, A. V., & Chornock, R. 2011, MNRAS, 412, 1522, doi: 10.1111/j.1365-2966.2011.17229.x
- Smith & Owocki (2006) Smith, N., & Owocki, S. P. 2006, ApJ, 645, L45, doi: 10.1086/506523
- Smith et al. (2015) Smith, N., Mauerhan, J. C., Cenko, S. B., et al. 2015, MNRAS, 449, 1876, doi: 10.1093/mnras/stv354
- Smith et al. (2017) Smith, N., Kilpatrick, C. D., Mauerhan, J. C., et al. 2017, MNRAS, 466, 3021, doi: 10.1093/mnras/stw3204
- Soraisam et al. (2023) Soraisam, M., Matheson, T., Andrews, J., et al. 2023, Transient Name Server AstroNote, 139, 1
- Soumagnac et al. (2020) Soumagnac, M. T., Ganot, N., Irani, I., et al. 2020, ApJ, 902, 6, doi: 10.3847/1538-4357/abb247
- Strassmeier et al. (2018) Strassmeier, K. G., Ilyin, I., & Steffen, M. 2018, A&A, 612, A44, doi: 10.1051/0004-6361/201731631
- Sundqvist et al. (2019) Sundqvist, J. O., Björklund, R., Puls, J., & Najarro, F. 2019, A&A, 632, A126, doi: 10.1051/0004-6361/201936580
- Tartaglia et al. (2021) Tartaglia, L., Sand, D. J., Groh, J. H., et al. 2021, ApJ, 907, 52, doi: 10.3847/1538-4357/abca8a
- Terreran et al. (2022) Terreran, G., Jacobson-Galán, W. V., Groh, J. H., et al. 2022, ApJ, 926, 20, doi: 10.3847/1538-4357/ac3820
- Trundle et al. (2008) Trundle, C., Kotak, R., Vink, J. S., & Meikle, W. P. S. 2008, A&A, 483, L47, doi: 10.1051/0004-6361:200809755
- Woosley (2017) Woosley, S. E. 2017, ApJ, 836, 244, doi: 10.3847/1538-4357/836/2/244
- Woosley & Heger (2015) Woosley, S. E., & Heger, A. 2015, ApJ, 810, 34, doi: 10.1088/0004-637X/810/1/34
- Wu & Fuller (2021) Wu, S., & Fuller, J. 2021, ApJ, 906, 3, doi: 10.3847/1538-4357/abc87c
- Yoon & Cantiello (2010) Yoon, S.-C., & Cantiello, M. 2010, ApJL, 717, L62, doi: 10.1088/2041-8205/717/1/L62