Statistics for Galaxy Outflows at with Imaging and Spectroscopic Signatures
Identified with JWST/NIRCam and NIRSpec Data
Abstract
We present statistics of galaxy outflows indicated by spatially-extended gas emission and broad lines. With a total of 61 spectroscopically confirmed galaxies at in the JWST CEERS, GLASS, and ERO data, we find five galaxies with [Oiii]+H ionized gas emission significantly extended beyond the kpc-scale stellar components on the basis of the emission line images constructed by the subtraction of NIRCam broadband (line on/off-band) images. By comparison with low- galaxies, the fraction of galaxies with the spatially extended gas, 5/61, at is an order of magnitude higher than those at , which can be explained by events triggered by frequent major mergers at high redshift. We also investigate medium- and high-resolution NIRSpec spectra of 30 galaxies at , and identify five galaxies with broad ( km s-1) lines in the [Oiii] forbidden line emission, suggestive of galaxy outflows. One galaxy at shows both the spatially-extended gas emission and the broad lines, while none of the galaxies with the spatially-extended gas emission or broad lines present a clear signature of AGN either in the line diagnostics or Type 1 AGN line broadening ( km s-1), which hint outflows mainly driven by stellar feedback. The existence of galaxies with/without spatially-extended gas emission or broad lines may suggest that these are galaxies in the early, late, post phases of galaxy outflows at high redshift, where the relatively large fractions of such galaxies indicate the longer-duration and/or more-frequent outflows at the early cosmic epoch.
1 Introduction
Feedback has been known as the key to understanding galaxy formation and evolution. According to the cold dark matter (CDM) model, galaxies build up their mass from the cool gas in the dark matter (DM) halos. Throughtout this process, different feedback mechanisms will affect the mass assembly of galaxies. For example, young, massive stars and/or active galactic niclei (AGNs) powered by the central supermassive black holes can produce feedback in the forms of ionizing radiation, stellar wind, and supernova explosion, heating the gas or expelling it from the star forming (SF) regions, thus limiting the SF activities. With the difficulty in fully reproducing these complicated physical processes solely with hydrodynamical simulations, observations, especially at the early epochs of galaxy formation, is in need to constrain and improve the simulation results.
One of the direct phenomena of feedback is the gas outflow, which has been intensively studied with different techniques. From the Local Universe out to , outflow is systematically investigated and identified with the metal absorption lines (e.g., Heckman et al., 2000, 2015; Rupke et al., 2005a, b; Steidel et al., 2010), emission lines in the rest-frame optical (e.g., Cicone et al., 2016; Finley & Matt, 2017; Förster Schreiber et al., 2019; Wylezalek et al., 2020) and sub-mm wavelengths (e.g., Walter et al., 2002; Gallerani et al., 2018; Ginolfi et al., 2020), and absorption features in the background QSO continua (e.g., Bouché et al., 2012; Kacprzak et al., 2015; Muzahid et al., 2015). These studies have found that outflow is positively correlated with stellar mass () and star formation rate (SFR) or galaxies, and are more frequently found in AGN.
With outflow evacuating gas from SF regions into the circum galactic medium (CGM) or even intergalactic medium (IGM), the gas sometimes is observed to be spatially extended beyond the galaxy continua. For example, Harikane et al. (2014) identified spatially extended [Oii] emission around a SF galaxy. Yuma et al. (2013, 2017) systematically investigated and identified the spatial extension of ionized gas traced by the rest-frame optical emission lines of [Oii], H, [Oiii], and H. At the higher redshift of , Fujimoto et al. (2020) identified the [Cii] metal emission lines in the rest-frame far-infrared (FIR) that extended to the CGM scale at kpc in of their galaxies. With ALMA data, Ginolfi et al. (2020) also found the extended metal-enriched gas out to kpc scale from stacking analysis. These studies have suggested that outflow driven by intensive SF activities or AGN may (partly) explain such spatially extended gas. However, the physical mechanism that triggers and connects the spatially extended gas and outflow activities still remain unclear.
With the launch of James Webb Space Telescope (JWST), it is now possible to directly observe and study galaxies at early epochs. For example, Nakajima et al. (2023) compiled the NIRSpec spectroscopy taken with three different JWST large programs and obtained a sample of 185 spectroscopically confirmed galaxies at . These high-z galaxies open a new door to testing the evolution of the physical properties of galaxies, such as size, morphology, and metallicity. They also serve as a good sample from which systematic search for AGN and outflow activities can be performed.
In this paper, we search for ionized gas outflow traced by rest-frame optical [Oiii] 4959, 5997 emission lines using JWST/NIRCam imaging and NIRSpec spectroscopy. From the Nakajima et al. (2023) sample, we identify spatial extension of [Oiii] emission around galaxies via the broadband excess technique, obtaining the [Oiii] emission line images by subtracting the stellar continua from the NIRCam broadband images that cover [Oiii] emission lines. We separately search for ongoing [Oiii] outflow by fitting the emission line profiles in the medium to high resolution NIRSpec spectroscopy. Section 2 summarizes the dataset and sample used in this study. In Section 3 and 4 we select and analyze the galaxies with spatially extended [Oiii] emission and with ongoing [Oiii] outflow, respectively. Section 5 discusses the possible connection and origins of spatially extended [Oiii] emission and ongoing outflow, as well as the redshift evolution of their number fractions. Our findings are summarized in Section 6. Throughout the paper, we use AB magnitude and the cosmological parameters of Planck Collaboration et al. (2020).
2 Data and Sample
2.1 JWST/NIRSpec Galaxies
We use the JWST/NIRSpec spectroscopic dataset in Nakajima et al. (2023). Here we briefly summarize the sample construction, and refer the readers to Nakajima et al. (2023) for the details of the JWST/NIRSpec observations and data reductions.
The spectroscopic dataset include Early Release Observations (ERO; Pontoppidan et al., 2022) targeting the lensing cluster SMACS-0723, as well as two of the Early Release Sciences (ERS) observations, GLASS (Treu et al., 2022) that targets the lensing cluster of Abell-2744 and Cosmic Evolution Early Release Science (CEERS; Bagley et al., 2023; Finkelstein et al., 2023) that includes 12 pointings in the Extended Groth Strip (EGS) field. ERO data were taken with two medium resolution () filter-grating pairs, F170LP-G235M and F290LP-G395M, covering the wavelength ranges of and m, respectively. The total exposure time of the ERO data is 4.86 hours for each filter- grating pair. GLASS data were taken with three high resolution () filter-grating pairs, F100LP-G140H, F170LP-G235H, and F290LP-G395H, that cover 1.0-1.6, 1.7-3.1, and 2.9-5.1 m, respectively. For each filter-grating pair used in GLASS observations, the total integration time was 4.9 hours. CEERS observations used both the Prism () covering 0.6-5.3 and medium resolution filter-grating pairs of F100LP-G140M, F170LP-G235M, and F290LP-G395M covering 1.0-1.6, 1.7-3.1, and 2.9-5.1 m, respectively. The on-source integration time for CEERS is 0.86 hours.
The aforementioned spectroscopic data were reduced in Nakajima et al. (2023) with the JWST pipeline version 1.8.5 and the Calibration Reference Data System (CRDS) files jwst_1027.pmap and jwst_1028.pmap. Additional processes were taken to improve the flux calibtaion, noise estimation and stacking. From the composite spectra, Nakajima et al. (2023) visually identified the emission lines and measured the spectroscopic redshifts. In total, there are 185 galaxies with spectroscopically confirmed redshift at .
2.2 JWST/NIRCam Imaging
We utilize the JWST/NIRCam images covering the ERO, GLASS, and CEERS fields. ERO includes JWST/NIRCam data covering a arcmin2 area around the lensing field of SMACS-0723 taken with the F090W, F150W, F200W, F277W, F356W, and F444W bands. CEERS program includes JWST/NIRCam images in 10 pointings with a total area of arcmin2 taken with F115W, F150W, F200W, F277W, F356W, F410M, and F444W bands. For the GLASS NIRSpec field, we use the JWST/NIRCam data from the Ultradeep NIRSpec and NIRCam ObserVations before the Epoch of Reionization (UNCOVER; Bezanson et al., 2022) program. The UNCOVER team carried out NIRCam observations in a arcmin2 area around the lensing field of Abell-2744 with seven bands, F090W, F115W, F150W, F200W, F277W, F356W, and F444W.
The ERO and CEERS NIRCam imaging data were reduced in Harikane et al. (2023a) and Harikane et al. (in preparation). They downloaded the raw data (_uncal.fits) from the Mikulski Archive for Space Telescopes (MAST). Data reduction were performed with the JWST pipeline development version 1.6.3 and the CRDS file jwst_0995.pmap. The pixel scale is set to 0.”015/pixel. See Harikane et al. (2023a) and Harikane et al. (in preparation) for the details of data reduction. For the UNCOVER NIRCam data, we use the reduced images provided by the UNCOVER team 111https://jwst-uncover.github.io that have a pixel scale of 0.”02/pixel in the short-wavelength bands (F090W, F115W, F150W) and 0.”04/pixel in the long-wavelength bands (F200W, F277W, F356W, F444W) (Bezanson et al., 2022).
3 Spatially extended [Oiii] emission
3.1 Selection
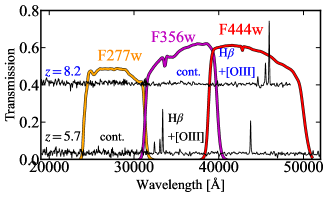
From the NIRCam images in Section 2.2, we construct the emission line images. For star-forming galaxies , the H and [Oiii] emission lines fall into the wavelength range of F356W (F444W) band with the optical continua covered by the F277W (F356W) band. By subtracting the continuum images of F277W (F356W) band from those of F356W (F444W) band that contains the emission lines, we can obtain the emission line images without the optical continua. Before subtraction, we match the point spread function (PSF) of the continuum images to that of the F444W images in the same manner as Harikane et al. (2023a). The typical FWHM of the PSF in F444W images is . The typical noise level of the emission line images obtained is erg s-1 cm-2 arcsec-2.
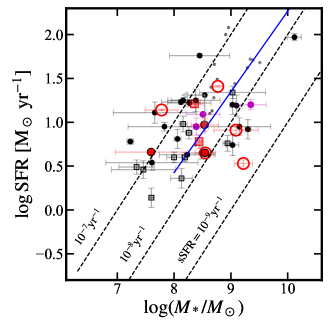
We find 37 (24) out of 52 (34) objects at in Nakajima et al. (2023) catalog (Section 2.1) are covered by JWST/NIRCam footprint. These objects represents our sample. The relation of the Nakajima et al. (2023) objects at with and without NIRCam coverage are presented in Figure 2. Our sample includes typical star-forming galaxies at .
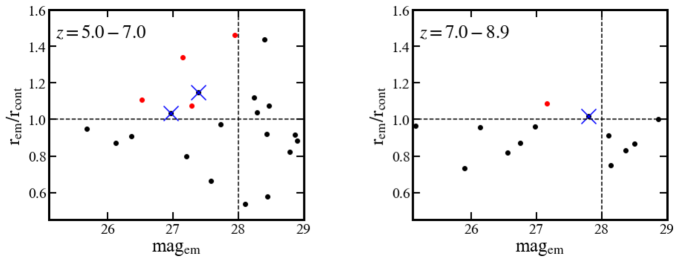
To select extended [Oiii] emission, we compare the effective radius () of the continuum and emission line images. We obtain with SExtractor, which is defined as the aperture radius containing of the total flux of the object. We select bright emission line objects (mag) that have in the emission line images larger than those in the continuum images (i.e., ). We then derive the radial profiles of the continuum images and emission line images, requiring the radial profile of emission line images to be larger than the one of continuum images. Figure 3 shows our selection procedure, where the red circles shows our Extended [Oiii] emission candidates and the magenta crosses indicates the objects excluded based on radial profiles.
Based on the selection criteria mentioned above, we identify five galaxies with spatially extended [Oiii] emissions at . Through examination of emission line images and radial profiles, we also serendipitously identify two objects whose [Oiii] emissions are spatially offset from the stellar continua, and another objects that potentially has multiple [Oiii]-emitting regions. The details of these objects will be presented in Section 3.3.
3.2 Our Spatially Extended [Oiii] Emission Candidates
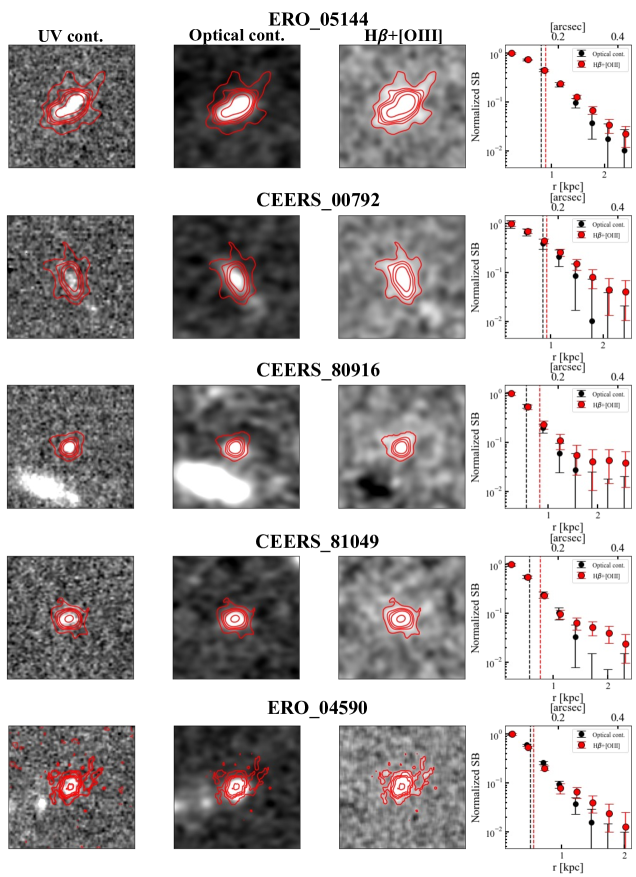
We present the IDs, coordinates, and basic physical properties of the five extended [Oiii] emission candidates in Table 1. Interestingly, we do not find a strong correlation with either or SFR for these five objects. At , there are four out of 37 galaxies that have extended [Oiii] emissions. One of the four objects, ERO_05144, is a lensed galaxy with a magnification factor . In Figure 4, we present the rest-frame ultraviolet (UV), rest-frame optical continuum, and the [Oiii] emission images, together with the radial profiles derived with respect to the center positions in the rest-frame optical continuum images. In the [Oiii] emission line images, all of these four objects have [Oiii] emission extended beyond the stellar continua, while the radial profiles also confirm such extensions beyond kpc.
At , we identify only one out of 24 galaxies that has extended [Oiii] emissions, which is ERO_04592. This objects, which is a lensed galaxy with , has been investigated in Fujimoto et al. (2022). As shown in Figure 4, masking out the neiboring foreground objects, we identify a marginal filamentary structure in the emission line image.
| ID | R.A. | Decl. | SFR | Spec_flag aaP: Prism; M: Medium-resolution filter-grating pair | Ongoing Outflow | |||
|---|---|---|---|---|---|---|---|---|
| (deg.) | (deg.) | (mag.) | () | ( yr-1) | ||||
| ERO_05144 | 110.8396739 | -73.445357 | 6.378 | M | True | |||
| CEERS_00792 | 214.8717663 | 52.8331673 | 6.257 | M | False | |||
| CEERS_80916 | 214.89163 | 52.815943 | 5.674 | P | - | |||
| CEERS_81049 | 214.789822 | 52.730789 | 6.738 | P | - | |||
| ERO_04590 | 110.8593287 | -73.4491656 | 8.496 | M | False | |||
3.3 Spatially Offset and Multi-Component Emission
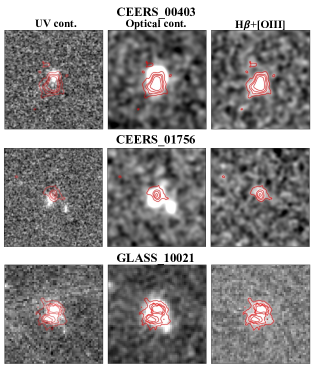
As mentioned in Section 3.1, we identify three objects that, although do not satisfy the criteria of extended [Oiii] emissions, have [Oiii] emissions that are spatially offset from their stellar continua or have multiple components. Figure 5 shows the images of these three objects. For CEERS_00403 and CEERS_01756, We find that the [Oiii] emission is offset from the rest-frame UV and optical continuum, which may indicate the regions inside the galaxies where intense SF activities are ongoing. GLASS_10021 is a lensed galaxy at with a lensing factor of . From Figure 5, we tentatively observe two components in the emission line image, although these two components are unresolved. The peak positions of the two components are separated by . Because such a multi-component feature is not observed in the stellar continuum, it is unlikely that the multi-component [Oiii] emission is due to lensing effect.
3.4 Spectroscopy of Extended [Oiii] Emission
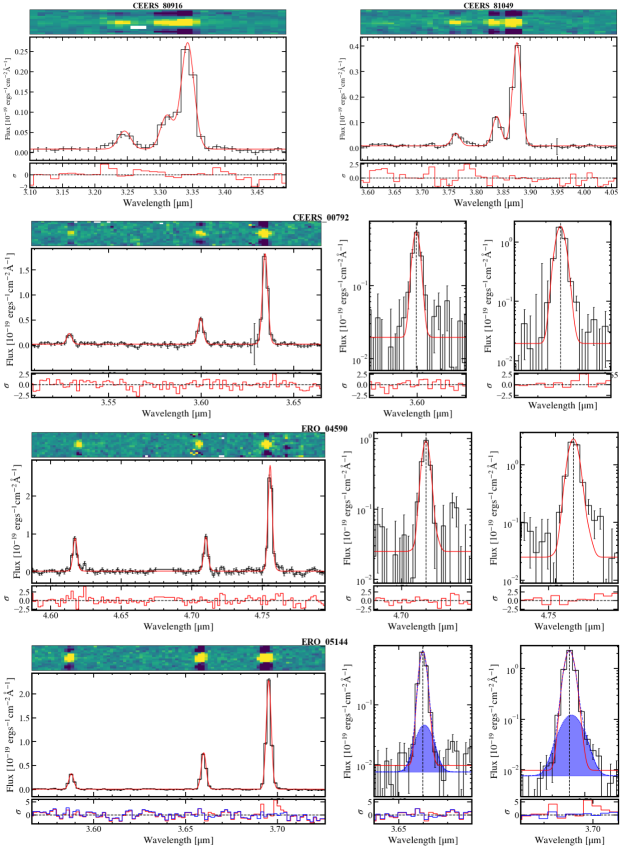
We examine the existence of ongoing [Oiii] outflow in NIRSpec spectra of the five objects with extended [Oiii] emission (Section 3.2). In Figure 6, we show the H and [Oiii] emission lines of these five objects. Two of the objects, CEERS_80916 and CEERS_81049, were taken with Prism that has a low spectral resolution of , while the remaining three objects were taken with medium resolution filter-grating pairs.
We conduct emission line fitting on H and [Oiii]4959, 5007 simultaneously, assuming a model with a flat continuum and one Gaussian profile for each of the three emission lines (hereafter “no-outflow model”). For the Gaussian components, we tie the rest-frame central wavelength of H, [Oiii]4959, and [Oiii]5007 to 4862.68Å, 4960.30Å, and 5008.24Å, respectively, and assume H and [Oiii]4959, 5007 have the same line widths (FWHMn) in the unit of km s-1. We then convolve our model with the line spread function (LSF) of Isobe et al. (2023) and fit it to the observed data. We obtain the best-fit model with Monte Carlo simulations, making 500 mock spectra by adding random noise to the observed flux density of each spectral pixel. The random noise is generated following a Gaussian distribution, whose standard deviation is defined by the uncertainty in the observed spectra. The best-fit parameters and their errors are obtained with the mean and standard deviation of the distribution of the output parameters through 500 iterations.
As shown in Figure 6 and Table 1, four out of the five objects have H and [Oiii]4959, 5007 emission lines that can be well-fitted with single, narrow Gaussian profiles without large residuals. For the two objects observed with Prism, CEERS_80916 and CEERS_81049, the spectral resolution is too low to resolve the outflow components. No conclusions can be made on the existence of ongoing outflow in these two objects. For CEERS_00792 and ERO_04590 that were observed with medium-resolution filter-grating pairs, we find no outflow components in their spectra. The remaining object, ERO_04590, has a residual around the [Oiii]5007 emission line, indicating the possible existence of ongoing outflow.
We fit the H and [Oiii]4959, 5007 emission lines of ERO_05144 again, adding a broad Gaussian component to the [Oiii]4959 and [Oiii]5007 emission line, respectively (hereafter “outflow model”). We tie the velocity shifts (, in km s-1) and the line widths (FWHMout, in km s-1) of these two Gaussian components, requiring FWHMFWHMn. We also fix the flux ratio () of the broad and narrow components for [Oiii]4959 and [Oiii]5007 emission lines. We then repeat the fitting process, obtaining the best-fit model (blue curves in Figure 6) and parameters (Table 2). It is clearly seen that the outflow model is preferred over the no-outflow one for the spectra of ERO_05144. We compare the difference in Bayesian information criterion (BIC; Schwarz, 1978) for the two models, which is given by . Here () and () refers to the and number of free parameters for no-outflow (outflow) model, respectively. For ERO_04590, we obtain BIC , suggesting that the outflow model better describes the observed data.
We also examine the NIRSpec data of the three objects that have offset or multi-component [Oiii] spatial distribution. One of the objects, GLASS_10021, has a FWHMb that is almost identical to FWHMn with two components separated by 76 km s-1. This objects, mentioned previously in Section 3.3, also has two components in the [Oiii] emission line image. It is possible that we are observing the rotation disk of this object. For the other two objects, CEERS_00403 and CEERS_01756, the emission lines are well fitted with the no-outflow model, indicating that the offset spatial distribution of [Oiii] is unlikely driven by stellar outflow.
4 Ongoing [Oiii] outflow in NIRSpec Spectroscopy
| ID | FWHMn | FWHMb | Fluxb aaFlux of the broad component of [Oiii]5007. | (S/N)b | BIC | |||
|---|---|---|---|---|---|---|---|---|
| (km s-1) | (km s-1) | (km s-1) | (km s-1) | |||||
| ERO_05144 | 6.378 | 4.88 | 46.4 | |||||
| GLASS_50038 | 5.772 | 3.63 | 263.3 | |||||
| GLASS_110000 | 5.763 | 15.66 | 148.5 | |||||
| ERO_06355 | 7.665 | 5.26 | 159.5 | |||||
| ERO_10612 | 7.660 | 3.21 | 36.02 | |||||
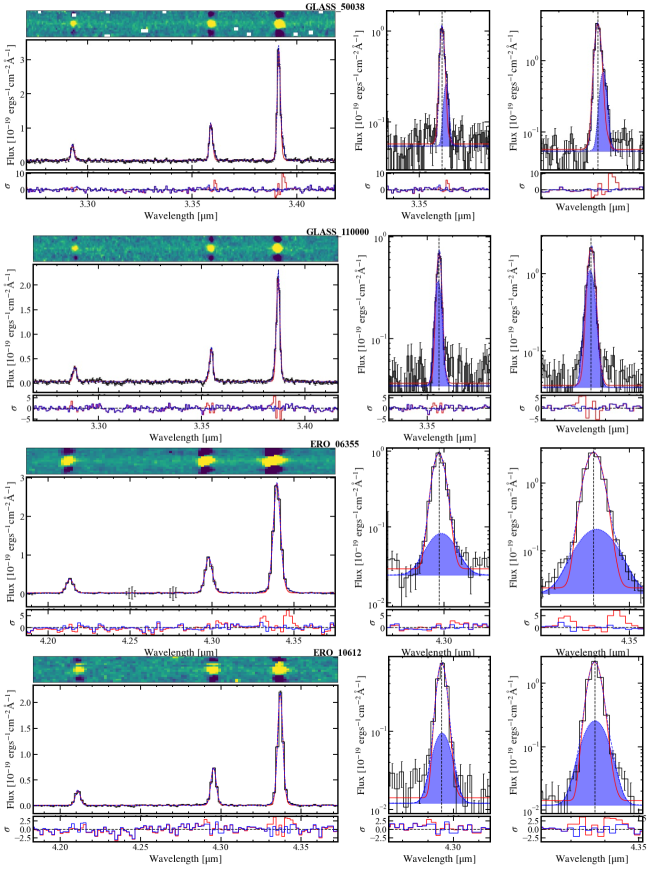
In this section we investigate ongoing [Oiii] outflow with medium and high resolution NIRSpec data. With the difficulty in resolving outflow components with the low resolution of Prism spectroscopy (), we focus on objects at taken with the medium and high resolution filter-grating pairs in Nakajima et al. (2023) sample, giving a total number of 30 galaxies.
For each of the 30 galaxies, we conduct emission line fitting on H and [Oiii]4959, 5007 as mentioned in Section 3.4, with no-outflow and outflow models. We select objects with ongoing outflow based on the following two criteria:
-
•
The observed data is preferred by the outflow model over the no-outflow one, which is quantified by .
-
•
The best-fit outflow components of [Oiii]4959, 5007 have a signal to noise ratio (S/N) greater than 3.
With the two criteria mentioned above, we obtain five out of 30 objects that have [Oiii] outflow components whose emission line properties are listed in Table 2. As shown in Figure 2, these five galaxies do not have significant dependence on either or SFR, which is similar to spatially extended objects (Section 3.2). Out of five galaxies with ongoing outflow, only one object, ERO_05144, shows spatially extended [Oiii] emission.
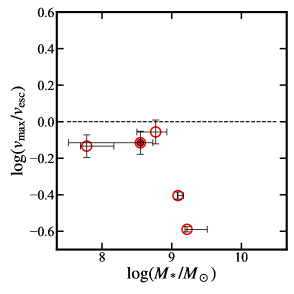
From the FWHM measurement of the narrow and broad [Oiii] components, we calculated the maximum velocity that is defined as the line-of-sight velocity in the direction:
| (1) |
We compare with the escape velocity () to estimate whether or not the ionized gas outflow can escape from the host dark matter (DM) halo. To obtain , we first estimate the circular velocity () that is dependent on the DM halo mass () with the following relations (Mo & White, 2002) :
| (2) |
| (3) |
where and its scatter is obtained from the relation at presented in Behroozi et al. (2019). We convert the derived to with as adopted in previous studies (e.g., Xu et al., 2022). In Figure 8, we present the relation between and for our galaxies with ongoing outflow. All of the five galaxies have , indicating that the ongoing outflow wind is unlikely to escape from the DM halos.
5 Discussions
5.1 Origins of [Oiii] Spatial Extension and Ongoing Outflow
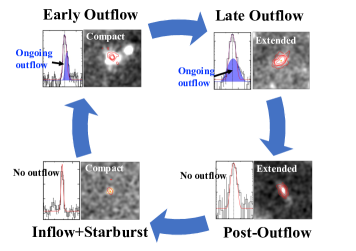
As presented in Section 3.2 and 4, out of the 30 galaxies with both NIRCam imaging and medium- or high-resolution NIRSpec spectra, there are two galaxies with spatially extended [Oiii] but without ongoing outflow, one object with both spatially extended [Oiii] and ongoing outflow, and four objects without spatially extended [Oiii] but with ongoing outflow. Such a discrepancy between the galaxies with spatially extension and ongoing outflow of ionized gas can be possibly explained by the gas cycle in the periodic SF history. In Figure 9 we classify our galaxies into four evolutional phases of outflow. In the first phase of early outflow, ionized gas is evacuated from the vicinity of SF regions due to stellar wind or AGN feedback but yet to reach the CGM of galaxies. This phase corresponds to the three galaxies in our sample that show ongoing outflow in NIRSpec spectra but without spatially extended gas emission in NIRCam images. As the outflowing gas extends to the CGM during the second phase of late outflow, we can now observe both ongoing outflow as well as spatial extension of ionized gas, whose example is given by ERO_05144. When gas outflow finally subsides due to the lack of gas in SF regions, a spatially extended shell of ionized gas would form around the CGM of galaxies if the outflow wind is not energetic enough to escape from the DM halos of galaxies, which is the case for our high- galaxies shown in Section 4. This marks the third phase, post-outflow, during which only spatially extended gas emission can be observed while ongoing outflow is absent (i.e., the three galaxies in Table 1 without ongoing outflow). Finally, the gas falls back to the SF region due to gravitation and fuels the SF activities that would initiate another cycle of gas outflow. This marks the last phase of inflow+starburst, which is like represented by the compact SF galaxies without spatially extended gas emission or ongoing outflow. Such a cycle of gas outflow, also knwon as “gas fountain”, is consistent with the predictions given by hydrodynamic simulations (e.g., Somerville & Davé, 2015; Hayward & Hopkins, 2017).
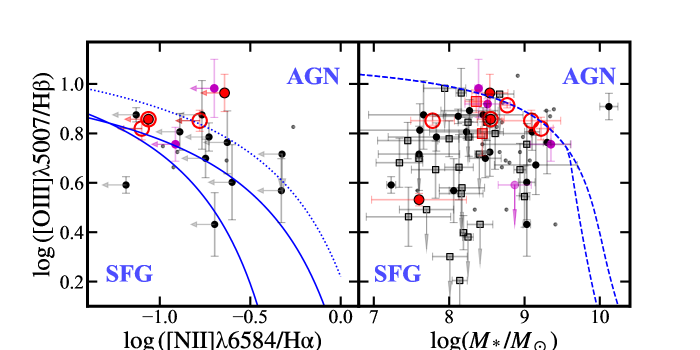
There are several plausible origins that can trigger the aforementioned cycle of gas outflow traced by spatial extension of [Oiii] emission and/or ongoing outflow. At low redshift, both SF galaxies and AGN have been found to drive the [Oiii] spatial extension (e.g., Yuma et al., 2017) and ongoing outflow (e.g., Zakamska et al., 2016; Vayner et al., 2021). We first examine the existence of type 1 AGN in the nine objects that have ongoing [Oiii] outflow and/or spatial extension (Section 3.2 and 4) by checking their H and H emission lines. We find that none of these nine objects have broad components (FWHM km s-1) in H and H emission lines that are similar to previously reported type 1 AGN identified in JWST NIRSpec spectra (e.g., Harikane et al., 2023b; Kocevski et al., 2023; Larson et al., 2023; Übler et al., 2023). The absent of broad components in Balmer lines suggest that our ongoing [Oiii] outflow and/or spatial extension are not caused by type 1 AGN. Next, we investigate the existence of type 2 (obscured) AGN with two typical diagnostics, BPT and mass-excitation (MEx) diagram. In the left panel of Figure 10, we plot the six galaxies that have [Oiii] spatial extension and/or ongoing outflow and with [Nii]+H complex covered by the wavelength range of NIRSpec. Although these six galaxies have relatively high [Oiii]/H line ratios of , we can only obtain the upper limits of [Nii]/H line ratio, indicating that they can be either SF galaxies or AGN. For the MEx diagram (right panel of Figure 10), most of the nine galaxies with [Oiii] spatial extension and/or ongoing outflow locate in the SF galaxy regime but close to the curve that separates the SF galaxy and AGN regimes. It should also be noted that the MEx diagram was calibrated with galaxies at , and has been found to mis-classify AGN with low masses and SF galaxies with high ionization parameters at higher redshift (e.g., Coil et al., 2015). We thus cannot rule out the existence of obscured AGN in these galaxies. It is also possible that the spatially extended [Oiii] and ongoing outflow are the remnants of past AGN activity. In such cases, previous AGN episodes initiated the ionized gas outflow and subsided while the outflow signatures are still observable (e.g., Ishibashi & Fabian, 2015; Wylezalek et al., 2020).
5.2 Number Fractions of [Oiii] Spatial Extension and Ongoing Outflow
In Section 3.2, we obtain 4/37 and 1/24 galaxies with spatially extended [Oiii] emission at and , respectively. With these numbers, we estimate the number fraction of spatially extended [Oiii] emission () in galaxies to be and at and , respectively. In the top panel of Figure 11, we compare these number fractions with those obtained at by Yuma et al. (2017), who identified spatially extended [Oiii] emission from galaxies, which is similar to our sample, using the narrowband excess technique. With a surface brightness limit of erg s-1 cm-2 arcsec-2, they reported values of 7/985 and 13/930 at and 0.83, respectively. Accounting for the surface brightness dimming, this limit corresponds to objects with erg s-1 cm-2 arcsec-2 that is fainter than our flux limit. The estimated in this study should thus be treated as the lower limit when comparing with the results from Yuma et al. (2017), as our dataset may miss some diffused, spatially extended [Oiii] emission compared with Yuma et al. (2017). With the shallower surface brightness limit, our results at are still dex higher than those from Yuma et al. (2017), indicating spatially extended [Oiii] emission is considerably more common in high-z galaxies. Such a redshift evolution of , as shown in Figure 11, is consistent with the redshift evolution of halo merger rate that increases towards high redshift (Fakhouri et al., 2010). Contrastingly, the redshift evolution of deviates from the cosmic SFR density (SFRD; Madau & Dickinson, 2014), which peaks at and decreases towards high . Our results suggest that the spatial extension of [Oiii] is likely connected with outflow triggered by the more frequent halo mergers at high-. The relatively large number fraction of spatially extended gas emission may also indicate that the post-outflow phase in the outflow cycle (Figure 9) at high redshift has a longer duration that at low redshift, which is likely due to the low velocity of outflow wind in high- galaxies (Figure 8).
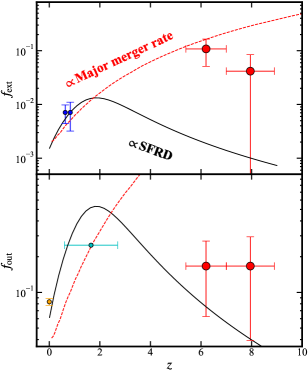
Similarly, we estimate the ongoing outflow fraction with our results in Section 4, where we identify ongoing outflow in 3/18 and 2/12 galaxies at at and , respectively. In the right panel of Figure 11, we compare our ongoing outflow fraction with those at lower redshift traced by ionized gas. At , Wylezalek et al. (2020) used SDSS-IV MANGA data to identified 257/3086 (8%) galaxies have ongoing ionized gas outflow. At , Förster Schreiber et al. (2019) derived a outflow fraction of 25% with 599 SF main sequence galaxies ranging from to . Considering the errors due to the limited sample size, our results are comparable with the the and values, deviating from the evolution trend of major merger rate that increase rapidly towards high redshift. However, our results are derived from a parent sample with ranging from to that is smaller than the low-z studies. As outflow are more likely to occur in objects with higher stellar mass and/or SFR (e.g., Förster Schreiber et al., 2019), our sample should be treated as the lower limit when comparing with the values at lower redshift. We thus cannot rule out the possibility that increases towards high redshift following the trend of major merger rate. Future observations on a larger sample of high-z galaxies with the high-resolution NIRSpec spectroscopy or IFU will improve the estimation in both and , which may reaveal the driving force of ongoing gas outflow and spatial extension.
6 Summary
We investigate the spatial extension and ongoing outflow of ionized gas traced by rest-frame optical [Oiii] emission in 61 galaxies at that are confirmed by NIRSpec data and covered by NIRCam footprints. Locating around the SFR main sequence, these galaxies represent typical star forming galaxies with . Utilizing NIRCam multiband imaging data, we construct [Oiii] emission line images by subtracting the stellar continua from the broadband images that contain [Oiii] emission. Our results are summarized below:
We identify 4/37 and 1/24 galaxies at and , respectively, have [Oiii] emission spatially extended beyond their stellar continua at kpc scale, yielding to a total of five galaxies. We do not find significant trends in the SFR distribution of these galaxies, indicating the complex physical origins of [Oiii] spatial extension. Two of these five galaxies were observed with the low-resolution Prism with , which is too low to determine the existence of ongoing outflow through spectral fitting. Among the other three galaxies observed with medium-resolution filter-grating pairs, only one galaxy, ERO_05144, has ongoing gas outflow features suggested by a second broad Gaussian component of [Oiii] emission lines in NIRSpec.
We search for ongoing [Oiii] outflow by fitting the H and [Oiii]4059,5007 emission lines of 30/61 galaxies that were observed with medium- or high-resolution filter-grating pairs, obtaining a total of five galaxies with ongoing [Oiii] outflow indicated by a second broad Gaussian components in [Oiii]4059,5007 emission lines. Apart from ERO_05144 that has spatial extension, the other four galaxies do not show spatially extended [Oiii] emission. All of the five galaxies with ongoing outflow have values smaller than unity, indicating that the ionized gas ouflow is unlikely to escape from the DM halos.
The discrepancy between galaxies with spatially extended [Oiii] emission and with ongoing outflow can be explained by the gas cycle in a periodic SF history of early, late, and post-outflow phases, during which the ionized gas is first expelled from the vicinity of SF regions, extending to the CGM while losing their energy, and being trapped in the CGM after outflow phases subsides due to the low outflow velocity. Such a gas cycle is likely driven by stellar wind, although the possibilities of type 2 AGN and previous AGN activities cannot be excluded.
Finally, we derive the number fraction of spatially extended [Oiii] emission and ongoing outflow. The number fractions of spatially extended [Oiii] emission at are considerably higher than the local values due to the higher merger rate in the earlier epochs, suggesting that the outflow activities in high- galaxies may be triggered by the frequent major mergers events, or that the post-outflow phase in the gas cycle has a longer duration for high- galaxies.
7 Acknowledgments
This work is based on observations made with the NASA/ESA/CSA James Webb Space Telescope. The data were obtained from the Mikulski Archive for Space Telescopes at the Space Telescope Science Institute, which is operated by the Association of Universities for Research in Astronomy, Inc., under NASA contract NAS 5-03127 for JWST. These observations are associated with programs ERS-1324 (GLASS), ERS-1345 (CEERS), GO-2561 (UNCOVER), and ERO-2736. The authors acknowledge the teams of JWST commissioning, ERO, GLASS, UNCOVER, and CEERS led by Klaus M. Pontoppidan, Tommaso Treu, Ivo Labbe/Rachel Bezanson, and Steven L. Finkelstein, respectively, for developing their observing programs with a zero-exclusive-access period. This publication is based upon work supported by the World Premier International Research Center Initiative (WPI Initiative), MEXT, Japan, and KAKENHI (JP23KJ0589, 20H00180, 21H04467, and 21J20785) through Japan Society for the Promotion of Science. Y.Z. acknouledges the support from JST SPRING (JPMJSP2108), as well as the joint research program of the Institute for Cosmic Ray Research (ICRR), University of Tokyo.
References
- Astropy Collaboration et al. (2013) Astropy Collaboration, Robitaille, T. P., Tollerud, E. J., et al. 2013, A&A, 558, A33, doi: 10.1051/0004-6361/201322068
- Astropy Collaboration et al. (2018) Astropy Collaboration, Price-Whelan, A. M., Sipőcz, B. M., et al. 2018, AJ, 156, 123, doi: 10.3847/1538-3881/aabc4f
- Bagley et al. (2023) Bagley, M. B., Finkelstein, S. L., Koekemoer, A. M., et al. 2023, ApJ, 946, L12, doi: 10.3847/2041-8213/acbb08
- Behroozi et al. (2019) Behroozi, P., Wechsler, R. H., Hearin, A. P., & Conroy, C. 2019, MNRAS, 488, 3143, doi: 10.1093/mnras/stz1182
- Bertin & Arnouts (1996) Bertin, E., & Arnouts, S. 1996, A&AS, 117, 393, doi: 10.1051/aas:1996164
- Bezanson et al. (2022) Bezanson, R., Labbe, I., Whitaker, K. E., et al. 2022, arXiv e-prints, arXiv:2212.04026, doi: 10.48550/arXiv.2212.04026
- Bouché et al. (2012) Bouché, N., Hohensee, W., Vargas, R., et al. 2012, MNRAS, 426, 801, doi: 10.1111/j.1365-2966.2012.21114.x
- Cicone et al. (2016) Cicone, C., Maiolino, R., & Marconi, A. 2016, A&A, 588, A41, doi: 10.1051/0004-6361/201424514
- Coil et al. (2015) Coil, A. L., Aird, J., Reddy, N., et al. 2015, ApJ, 801, 35, doi: 10.1088/0004-637X/801/1/35
- Fakhouri et al. (2010) Fakhouri, O., Ma, C.-P., & Boylan-Kolchin, M. 2010, MNRAS, 406, 2267, doi: 10.1111/j.1365-2966.2010.16859.x
- Finkelstein et al. (2023) Finkelstein, S. L., Bagley, M. B., Ferguson, H. C., et al. 2023, ApJ, 946, L13, doi: 10.3847/2041-8213/acade4
- Finley & Matt (2017) Finley, A. J., & Matt, S. P. 2017, ApJ, 845, 46, doi: 10.3847/1538-4357/aa7fb9
- Förster Schreiber et al. (2019) Förster Schreiber, N. M., Übler, H., Davies, R. L., et al. 2019, ApJ, 875, 21, doi: 10.3847/1538-4357/ab0ca2
- Fujimoto et al. (2020) Fujimoto, S., Silverman, J. D., Bethermin, M., et al. 2020, ApJ, 900, 1, doi: 10.3847/1538-4357/ab94b3
- Fujimoto et al. (2022) Fujimoto, S., Ouchi, M., Nakajima, K., et al. 2022, arXiv e-prints, arXiv:2212.06863, doi: 10.48550/arXiv.2212.06863
- Gallerani et al. (2018) Gallerani, S., Pallottini, A., Feruglio, C., et al. 2018, MNRAS, 473, 1909, doi: 10.1093/mnras/stx2458
- Ginolfi et al. (2020) Ginolfi, M., Jones, G. C., Béthermin, M., et al. 2020, A&A, 633, A90, doi: 10.1051/0004-6361/201936872
- Harikane et al. (2014) Harikane, Y., Ouchi, M., Yuma, S., et al. 2014, ApJ, 794, 129, doi: 10.1088/0004-637X/794/2/129
- Harikane et al. (2023a) Harikane, Y., Ouchi, M., Oguri, M., et al. 2023a, ApJS, 265, 5, doi: 10.3847/1538-4365/acaaa9
- Harikane et al. (2023b) Harikane, Y., Zhang, Y., Nakajima, K., et al. 2023b, arXiv e-prints, arXiv:2303.11946, doi: 10.48550/arXiv.2303.11946
- Hayward & Hopkins (2017) Hayward, C. C., & Hopkins, P. F. 2017, MNRAS, 465, 1682, doi: 10.1093/mnras/stw2888
- Heckman et al. (2015) Heckman, T. M., Alexandroff, R. M., Borthakur, S., Overzier, R., & Leitherer, C. 2015, ApJ, 809, 147, doi: 10.1088/0004-637X/809/2/147
- Heckman et al. (2000) Heckman, T. M., Lehnert, M. D., Strickland, D. K., & Armus, L. 2000, ApJS, 129, 493, doi: 10.1086/313421
- Ishibashi & Fabian (2015) Ishibashi, W., & Fabian, A. C. 2015, MNRAS, 451, 93, doi: 10.1093/mnras/stv944
- Isobe et al. (2023) Isobe, Y., Ouchi, M., Nakajima, K., et al. 2023, arXiv e-prints, arXiv:2301.06811, doi: 10.48550/arXiv.2301.06811
- Juneau et al. (2014) Juneau, S., Bournaud, F., Charlot, S., et al. 2014, ApJ, 788, 88, doi: 10.1088/0004-637X/788/1/88
- Kacprzak et al. (2015) Kacprzak, G. G., Muzahid, S., Churchill, C. W., Nielsen, N. M., & Charlton, J. C. 2015, ApJ, 815, 22, doi: 10.1088/0004-637X/815/1/22
- Kauffmann et al. (2003) Kauffmann, G., Heckman, T. M., Tremonti, C., et al. 2003, MNRAS, 346, 1055, doi: 10.1111/j.1365-2966.2003.07154.x
- Kewley et al. (2001) Kewley, L. J., Dopita, M. A., Sutherland, R. S., Heisler, C. A., & Trevena, J. 2001, ApJ, 556, 121, doi: 10.1086/321545
- Kewley et al. (2013) Kewley, L. J., Maier, C., Yabe, K., et al. 2013, ApJ, 774, L10, doi: 10.1088/2041-8205/774/1/L10
- Kocevski et al. (2023) Kocevski, D. D., Onoue, M., Inayoshi, K., et al. 2023, arXiv e-prints, arXiv:2302.00012, doi: 10.48550/arXiv.2302.00012
- Larson et al. (2023) Larson, R. L., Finkelstein, S. L., Kocevski, D. D., et al. 2023, arXiv e-prints, arXiv:2303.08918, doi: 10.48550/arXiv.2303.08918
- Madau & Dickinson (2014) Madau, P., & Dickinson, M. 2014, ARA&A, 52, 415, doi: 10.1146/annurev-astro-081811-125615
- Mo & White (2002) Mo, H. J., & White, S. D. M. 2002, MNRAS, 336, 112, doi: 10.1046/j.1365-8711.2002.05723.x
- Muzahid et al. (2015) Muzahid, S., Kacprzak, G. G., Churchill, C. W., et al. 2015, ApJ, 811, 132, doi: 10.1088/0004-637X/811/2/132
- Nakajima et al. (2023) Nakajima, K., Ouchi, M., Isobe, Y., et al. 2023, arXiv e-prints, arXiv:2301.12825, doi: 10.48550/arXiv.2301.12825
- Planck Collaboration et al. (2020) Planck Collaboration, Aghanim, N., Akrami, Y., et al. 2020, A&A, 641, A6, doi: 10.1051/0004-6361/201833910
- Pontoppidan et al. (2022) Pontoppidan, K. M., Barrientes, J., Blome, C., et al. 2022, ApJ, 936, L14, doi: 10.3847/2041-8213/ac8a4e
- Rupke et al. (2005a) Rupke, D. S., Veilleux, S., & Sanders, D. B. 2005a, ApJS, 160, 87, doi: 10.1086/432886
- Rupke et al. (2005b) —. 2005b, ApJS, 160, 115, doi: 10.1086/432889
- Santini et al. (2017) Santini, P., Fontana, A., Castellano, M., et al. 2017, ApJ, 847, 76, doi: 10.3847/1538-4357/aa8874
- Schwarz (1978) Schwarz, G. 1978, Annals of Statistics, 6, 461
- Somerville & Davé (2015) Somerville, R. S., & Davé, R. 2015, ARA&A, 53, 51, doi: 10.1146/annurev-astro-082812-140951
- Steidel et al. (2010) Steidel, C. C., Erb, D. K., Shapley, A. E., et al. 2010, ApJ, 717, 289, doi: 10.1088/0004-637X/717/1/289
- Treu et al. (2022) Treu, T., Roberts-Borsani, G., Bradac, M., et al. 2022, ApJ, 935, 110, doi: 10.3847/1538-4357/ac8158
- Übler et al. (2023) Übler, H., Maiolino, R., Curtis-Lake, E., et al. 2023, arXiv e-prints, arXiv:2302.06647, doi: 10.48550/arXiv.2302.06647
- Vayner et al. (2021) Vayner, A., Zakamska, N. L., Riffel, R. A., et al. 2021, MNRAS, 504, 4445, doi: 10.1093/mnras/stab1176
- Walter et al. (2002) Walter, F., Weiss, A., & Scoville, N. 2002, ApJ, 580, L21, doi: 10.1086/345287
- Wylezalek et al. (2020) Wylezalek, D., Flores, A. M., Zakamska, N. L., Greene, J. E., & Riffel, R. A. 2020, MNRAS, 492, 4680, doi: 10.1093/mnras/staa062
- Xu et al. (2022) Xu, Y., Ouchi, M., Rauch, M., et al. 2022, ApJ, 929, 134, doi: 10.3847/1538-4357/ac5e32
- Yuma et al. (2017) Yuma, S., Ouchi, M., Drake, A. B., et al. 2017, ApJ, 841, 93, doi: 10.3847/1538-4357/aa709f
- Yuma et al. (2013) —. 2013, ApJ, 779, 53, doi: 10.1088/0004-637X/779/1/53
- Zakamska et al. (2016) Zakamska, N. L., Hamann, F., Pâris, I., et al. 2016, MNRAS, 459, 3144, doi: 10.1093/mnras/stw718