LAMOST J2043+3413 - a Fast Disk Precession SW Sextans Candidate in Period Gap
Abstract
We present follow-up photometric observations and time-series analysis of a nova-like, SW Sextans-type, cataclysmic variable (CV) candidate, LAMOST J204305.95+341340.6 (here after J2043+3413), with Gaia G-band magnitude of 15.30 and a distance of 990 pc, which was identified from the LAMOST spectrum. The photometric data were collected with the Tsinghua-NAOC 0.8-m telescope (TNT), TESS, ZTF, and ASAS-SN. The TESS light curve reveals the presence of two prominent periods of 2.587(8) hours and 1.09(5) days, corresponding to the orbital and superorbital (precession) period, respectively. The TNT data obtained in 2020 shows a possible quasi-periodic oscillation of 1426 seconds. The precession period is about three times shorter than that of CVs with similar orbital periods, indicating an unusually fast precessing accretion disk. The ZTF data is found to show a sudden decline of mag on MJD 58979. From the intermittent behavior of the eclipse, we deduce that J2043+3413 is an intermediate inclination system of CV, similar to V795 Her, which is also situated in the period gap.
1 Introduction
A cataclysmic variable (CV) consists of a white dwarf (WD) primary and a low-mass Roche-lobe filling secondary (Warner, 1995, hereafter WA95). In CVs with sufficiently weak WD magnetic fields (G, which include classical novae, nova remnants, dwarf novae, and nova-like variables (NLs)), the material transferred from the secondary spreads into an accretion disk surrounding the primary. If the magnetic field of a CV WD is larger (G), the accretion disk will be partially disrupted, and material will flow through the magnetic lines. These are called as intermediate polar (IP). For the strongest magnetic CV (G, polar), an accretion disk can not form (Cropper, 1990; Cropper et al., 2002; Dai et al., 2016).
CVs can be discovered either during their outbursts or through their spectroscopic features. Over the last decade, the Large Sky Area Multi-Object Fiber Spectroscopic Telescope (LAMOST: Wang et al. 1996; Cui et al. 2012) has obtained millions of stellar spectra. Hou et al. (2020) identified 245 CV candidates, 58 of which are new discoveries, using machine learning methods. These spectroscopically identified CVs lack relevant photometric observations. In this work, we chose one of them, LAMOST J204305.95+341340.6 (J2043+3413 for brevity), for follow up photometric study.
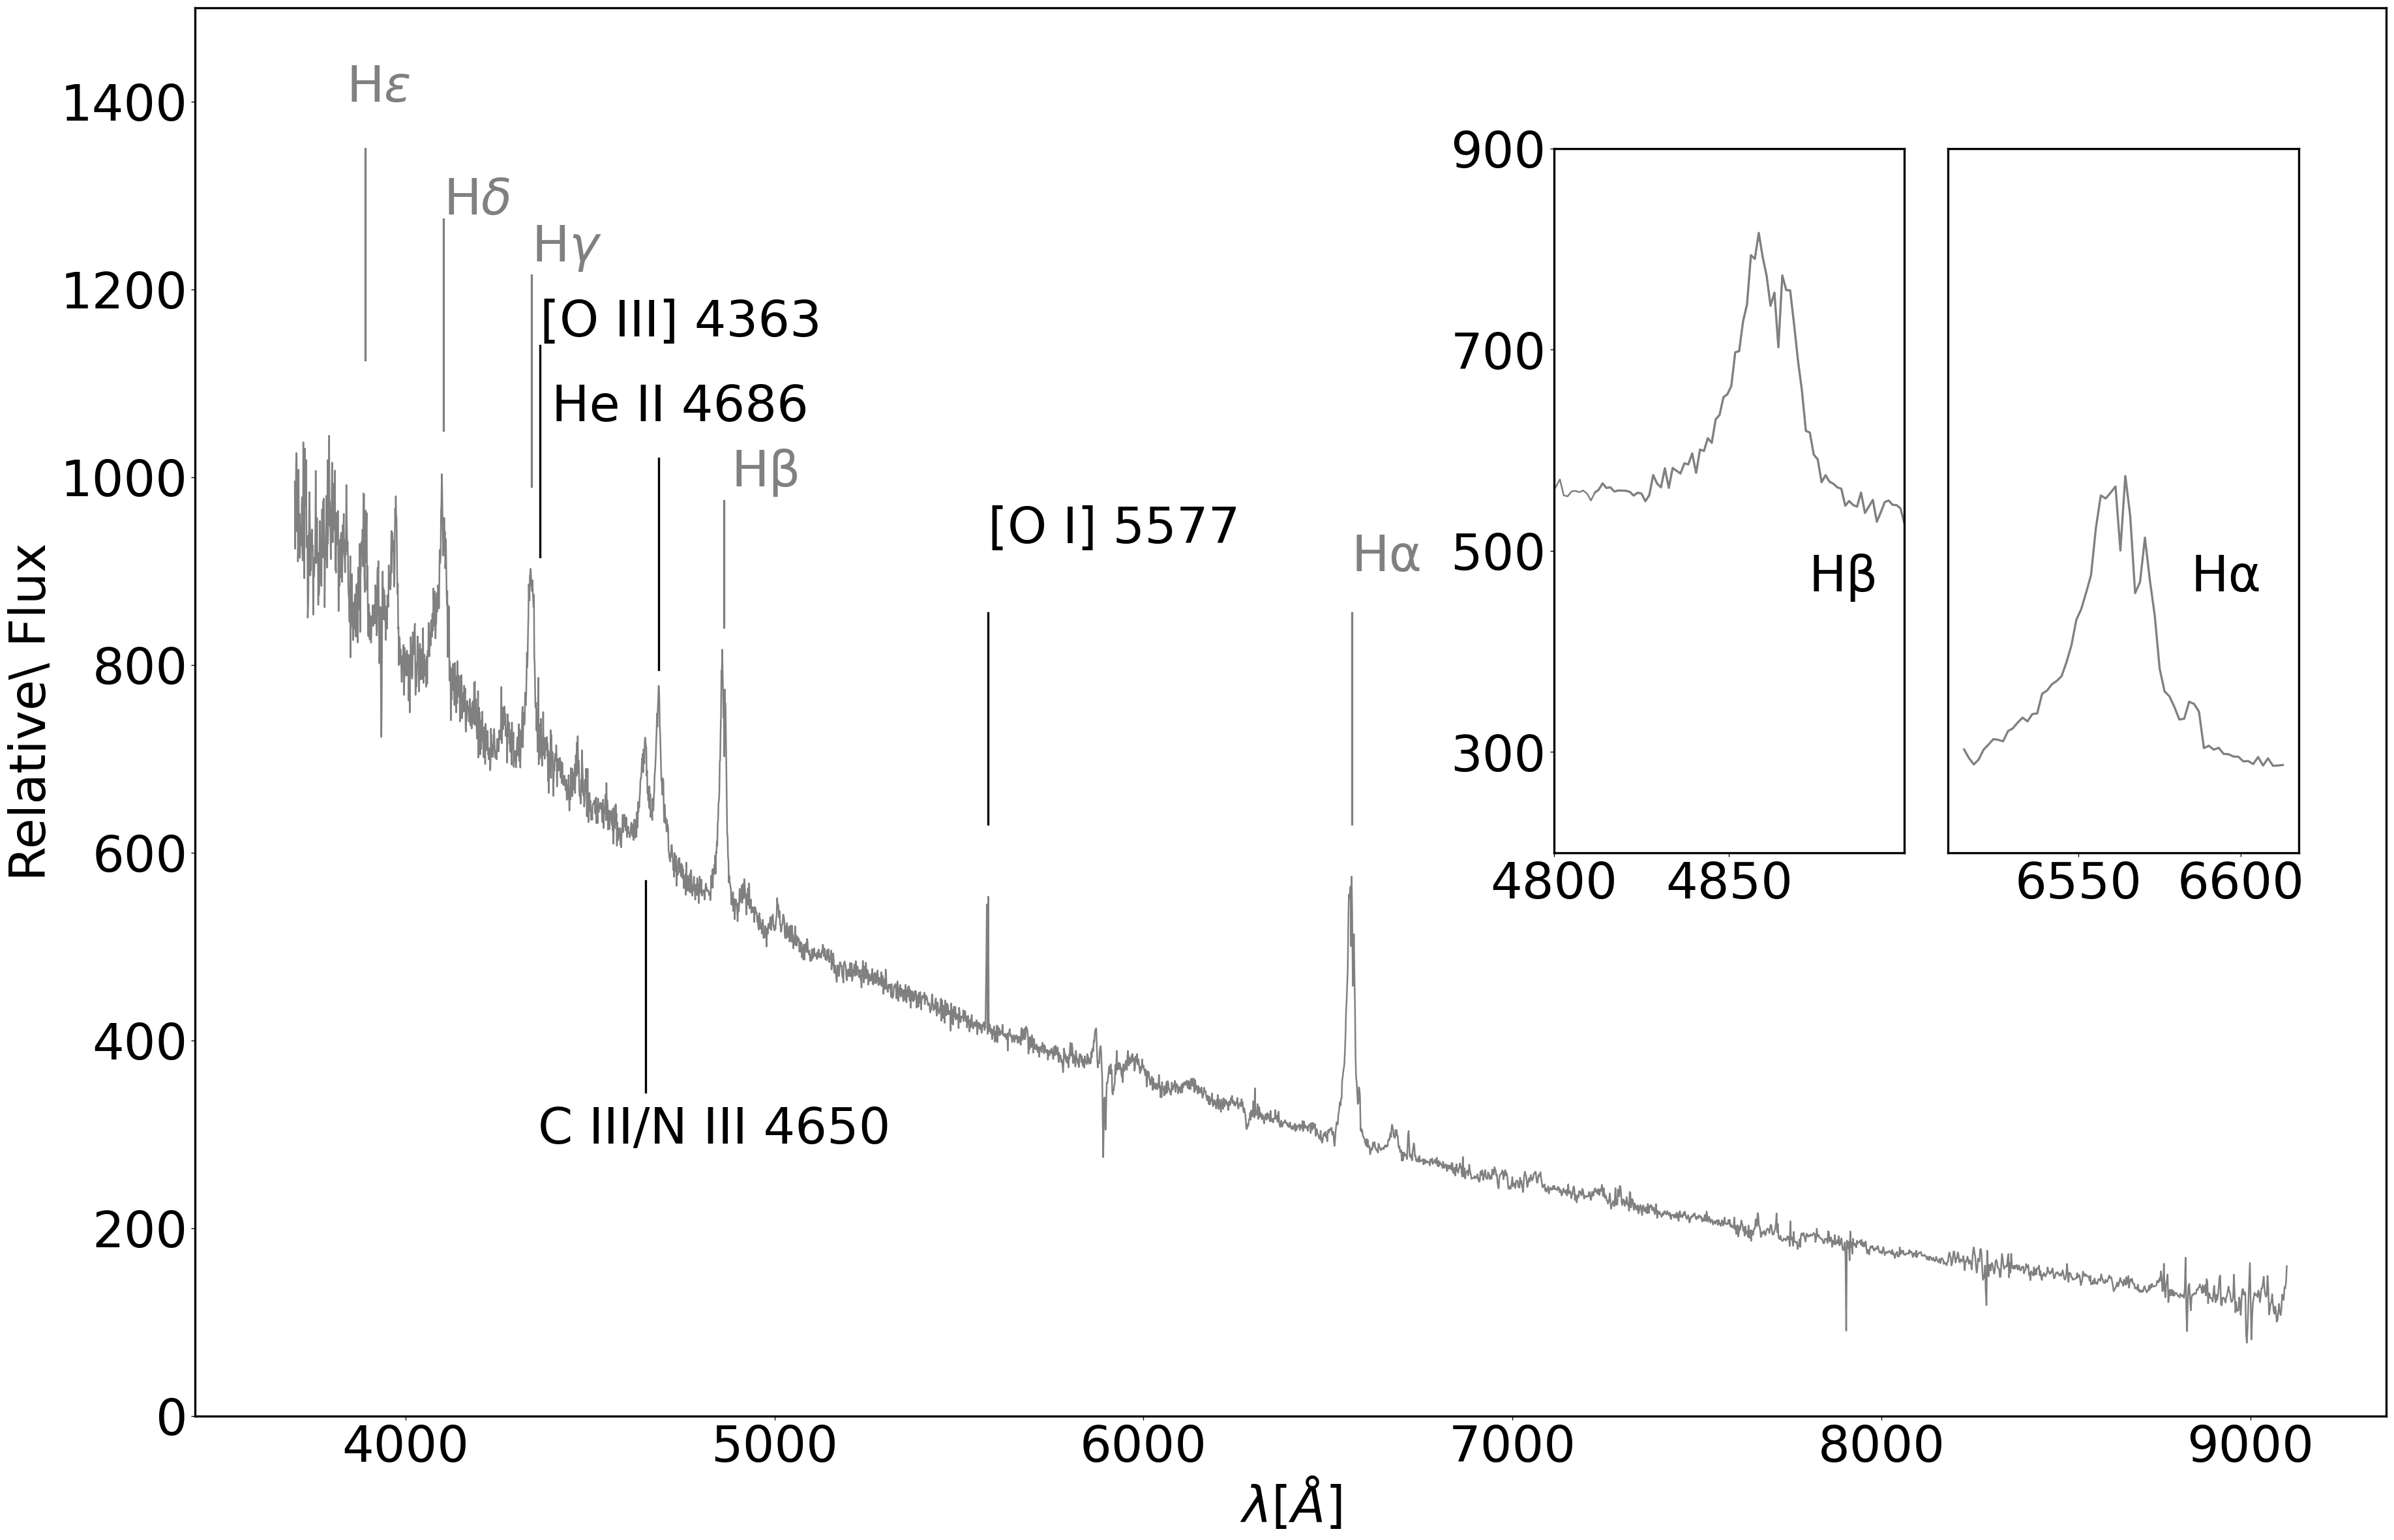
J2043+3413 was initially discovered by Margoni & Stagni (1984) in a low-Galactic-latitude field survey. It has time-series archived photometry data from the Transiting Exoplanet Survey Satellite (TESS; Ricker et al. 2014) mission, the Zwicky Transient Facility (ZTF; Bellm et al. 2019; Szkody et al. 2020, 2021), and the All Sky Automated Survey for SuperNovae (ASAS-SN; Kochanek et al. 2017). J2043+3413 was also recently studied with time-series spectra by Thorstensen (2020, hereafter TH20). The LAMOST spectrum of J2043+3413 is shown in Fig. 1, where one can see prominent Balmer emission lines, HeII 4686 and CIII/NIII 4650 lines. These emission lines show double-peak features, suggesting the presence of disk structure in J2043+3413. Moreover, the appearance of the prominent He II 4686 emission line suggests the presence of a magnetic field (WA95) in J2043+3413, and the measured ratio of HeII 4686/H characterizes it as a candidate of NL subtype (Hou et al., 2020). The basic information from Gaia (Gaia Collaboration et al., 2016, 2018, 2022) and parameters estimated from this work are given in Table 1.
In this paper, we examine the detailed photometric properties of J2043+3413 with our own multi-band photometry, as well as the data from TESS and ZTF. Observations, data reduction and collections of other datasets are described in Section 2. The analysis and parameter estimations are presented in Section 3. Discussion and conclusion are given in Section 4.
| Parameter | Value | |
| Right ascension a | [h:m:s] | 20:43:05.955 |
| Declination a | [d:m:s] | +34:13:40.73 |
| Apparent magnitude b | [mag] | 15.30 |
| BP-RP c | [mag] | 0.372 |
| DistanceG d | d [pc] | |
| Reddening e | [mag] | |
| Apparent absolute magnitude f | [mag] | |
| Orbital period g, h | [h] | |
| Superorbital period g, h | [d] |
-
•
Notes.
-
a
Positions are referred to the International Coordinate Reference System (ICRS; essentially the reference frame for J2000).
-
b
is the mean apparent magnitude from Gaia G-band.
-
c
The Blue (BP) and Red (RP) prism photometers collect low resolution spectrophotometric measurements of source spectral energy distribution over the wavelength ranges 330680 nm and 6301050 nm, respectively.
-
d
The distance and its error are derived by the inverse of DR3 parallax.
-
e
The extinction was taken from the 3D reddening map (Green et al., 2019).
-
f
The absolute G-band mean magnitude is calculated from and DistanceG (Andrae et al., 2018) as listed in this table.
- g
-
h
Analysis with the data in TESS sectors 14 and 15 (spanning from MJD 58682 to 58737).
2 Observation and Data Acquisition
2.1 TNT Observation and Data Reduction
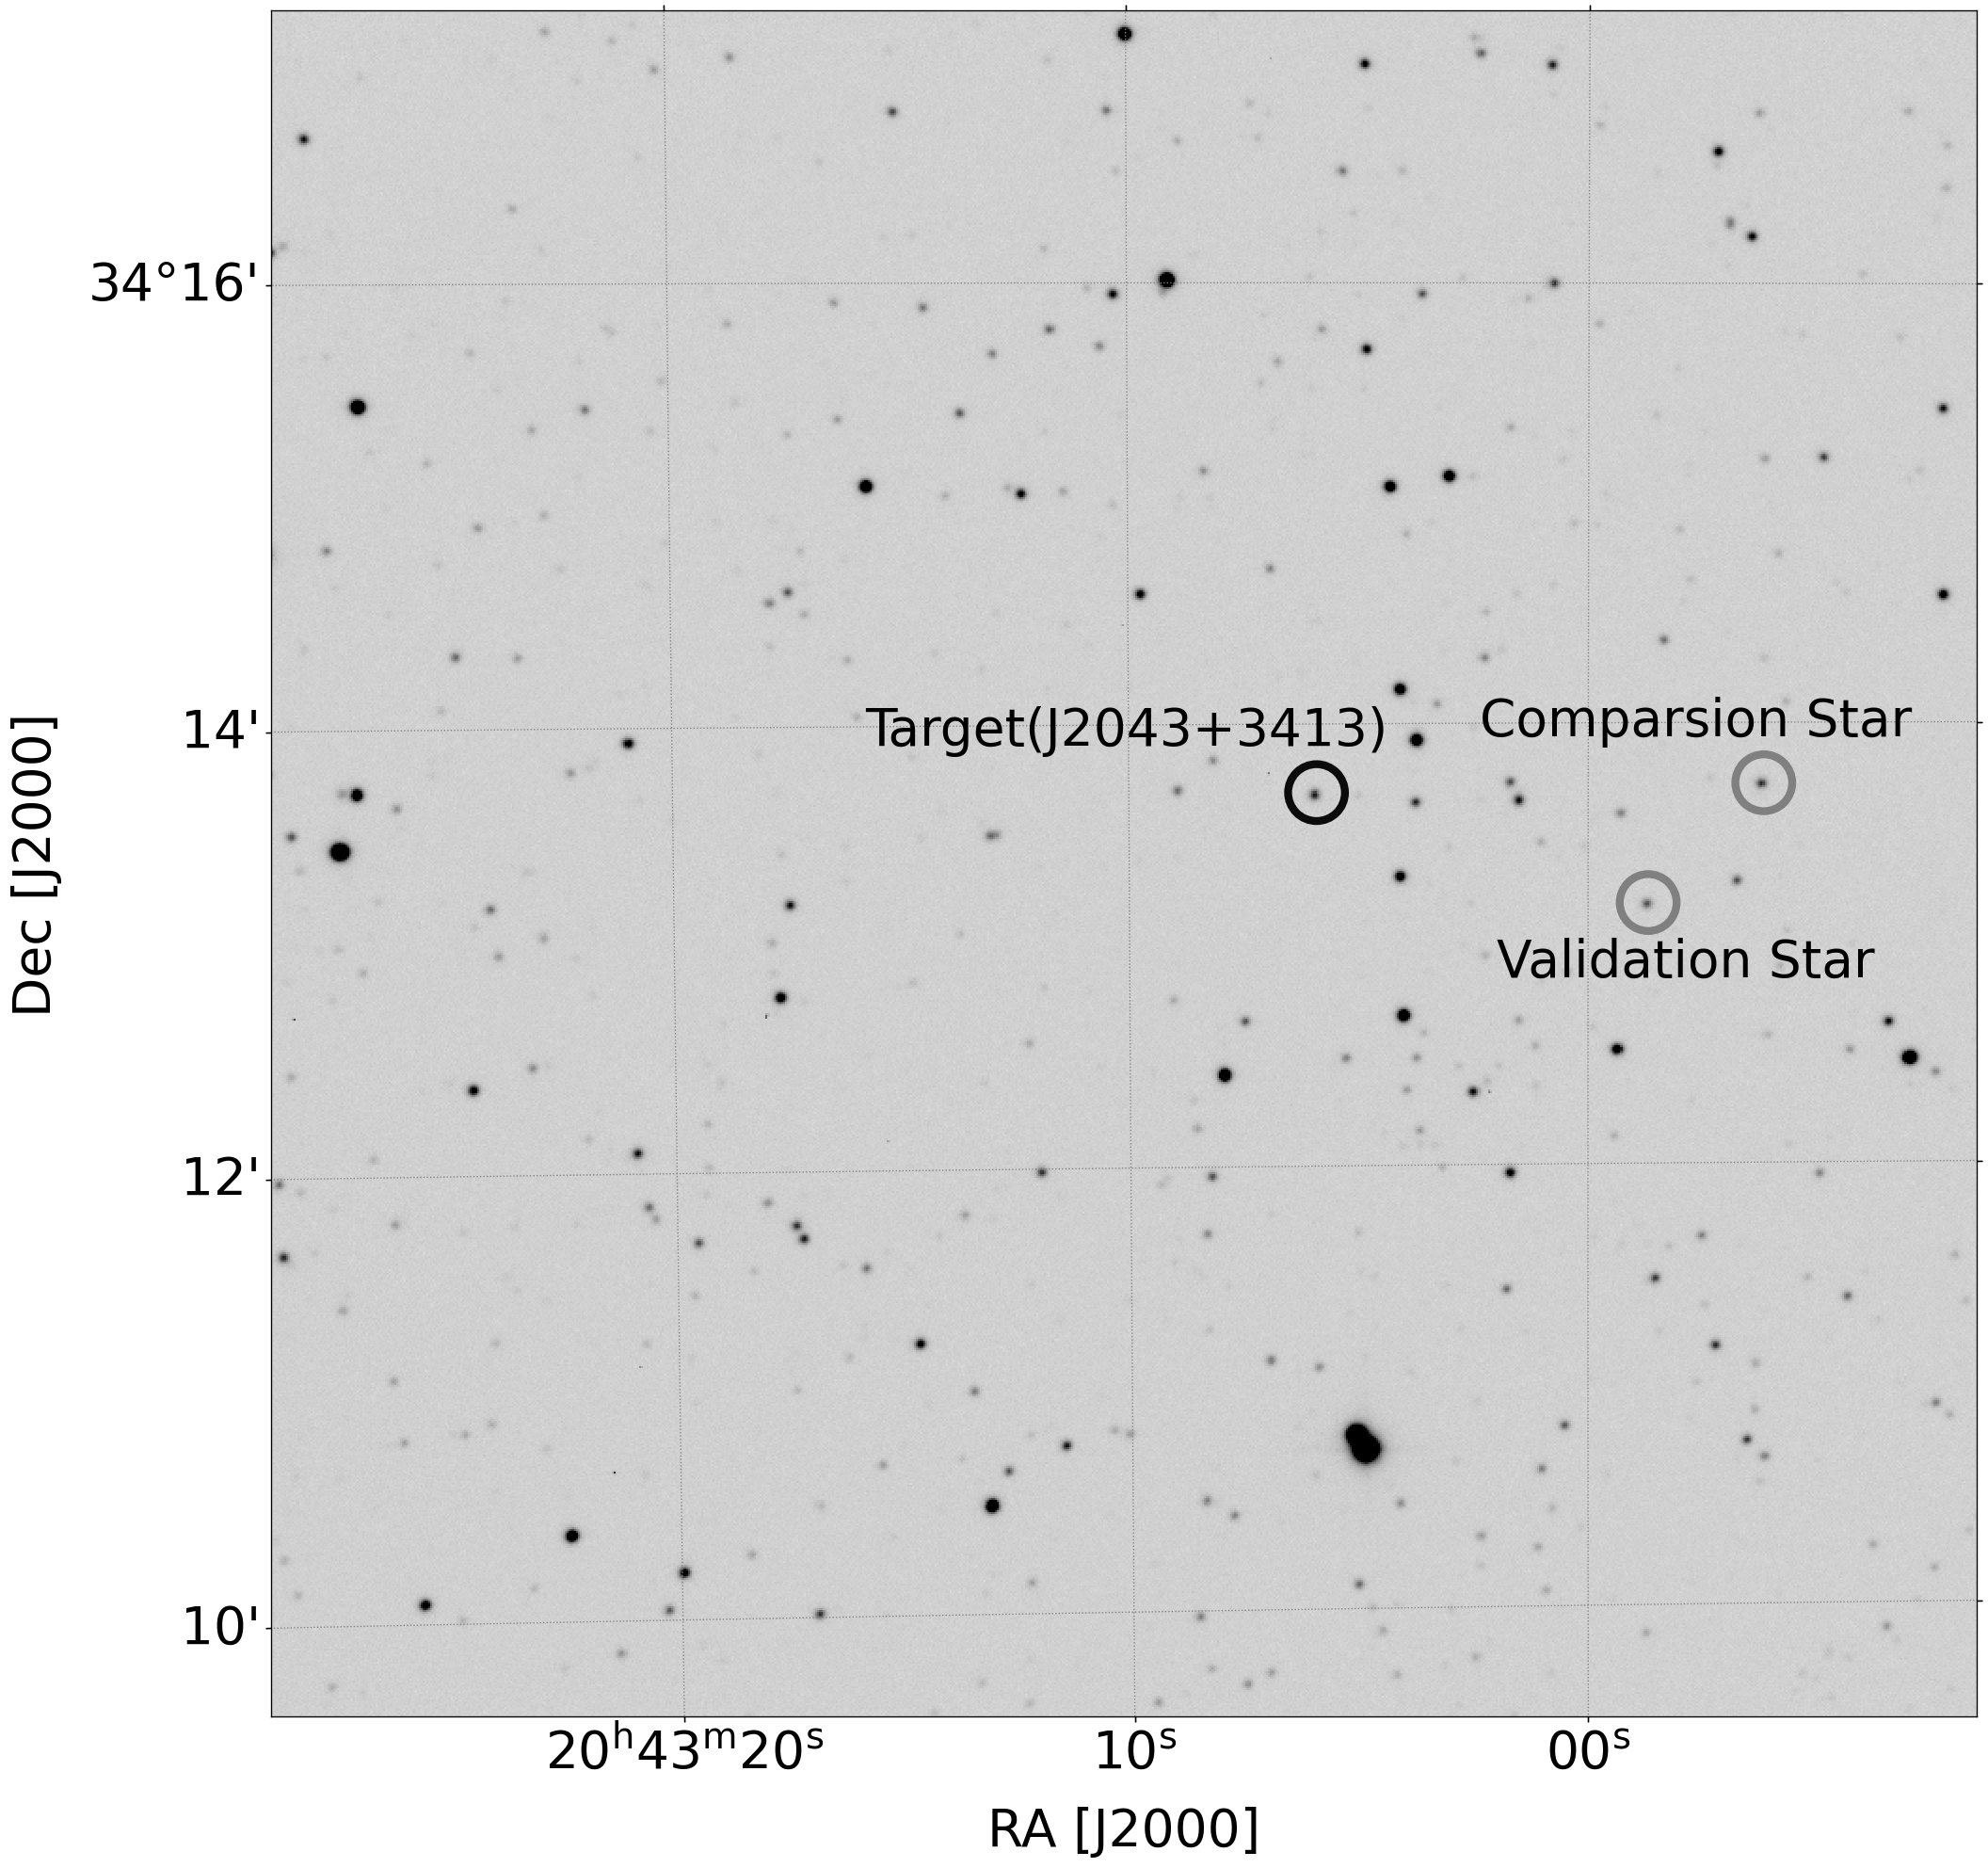
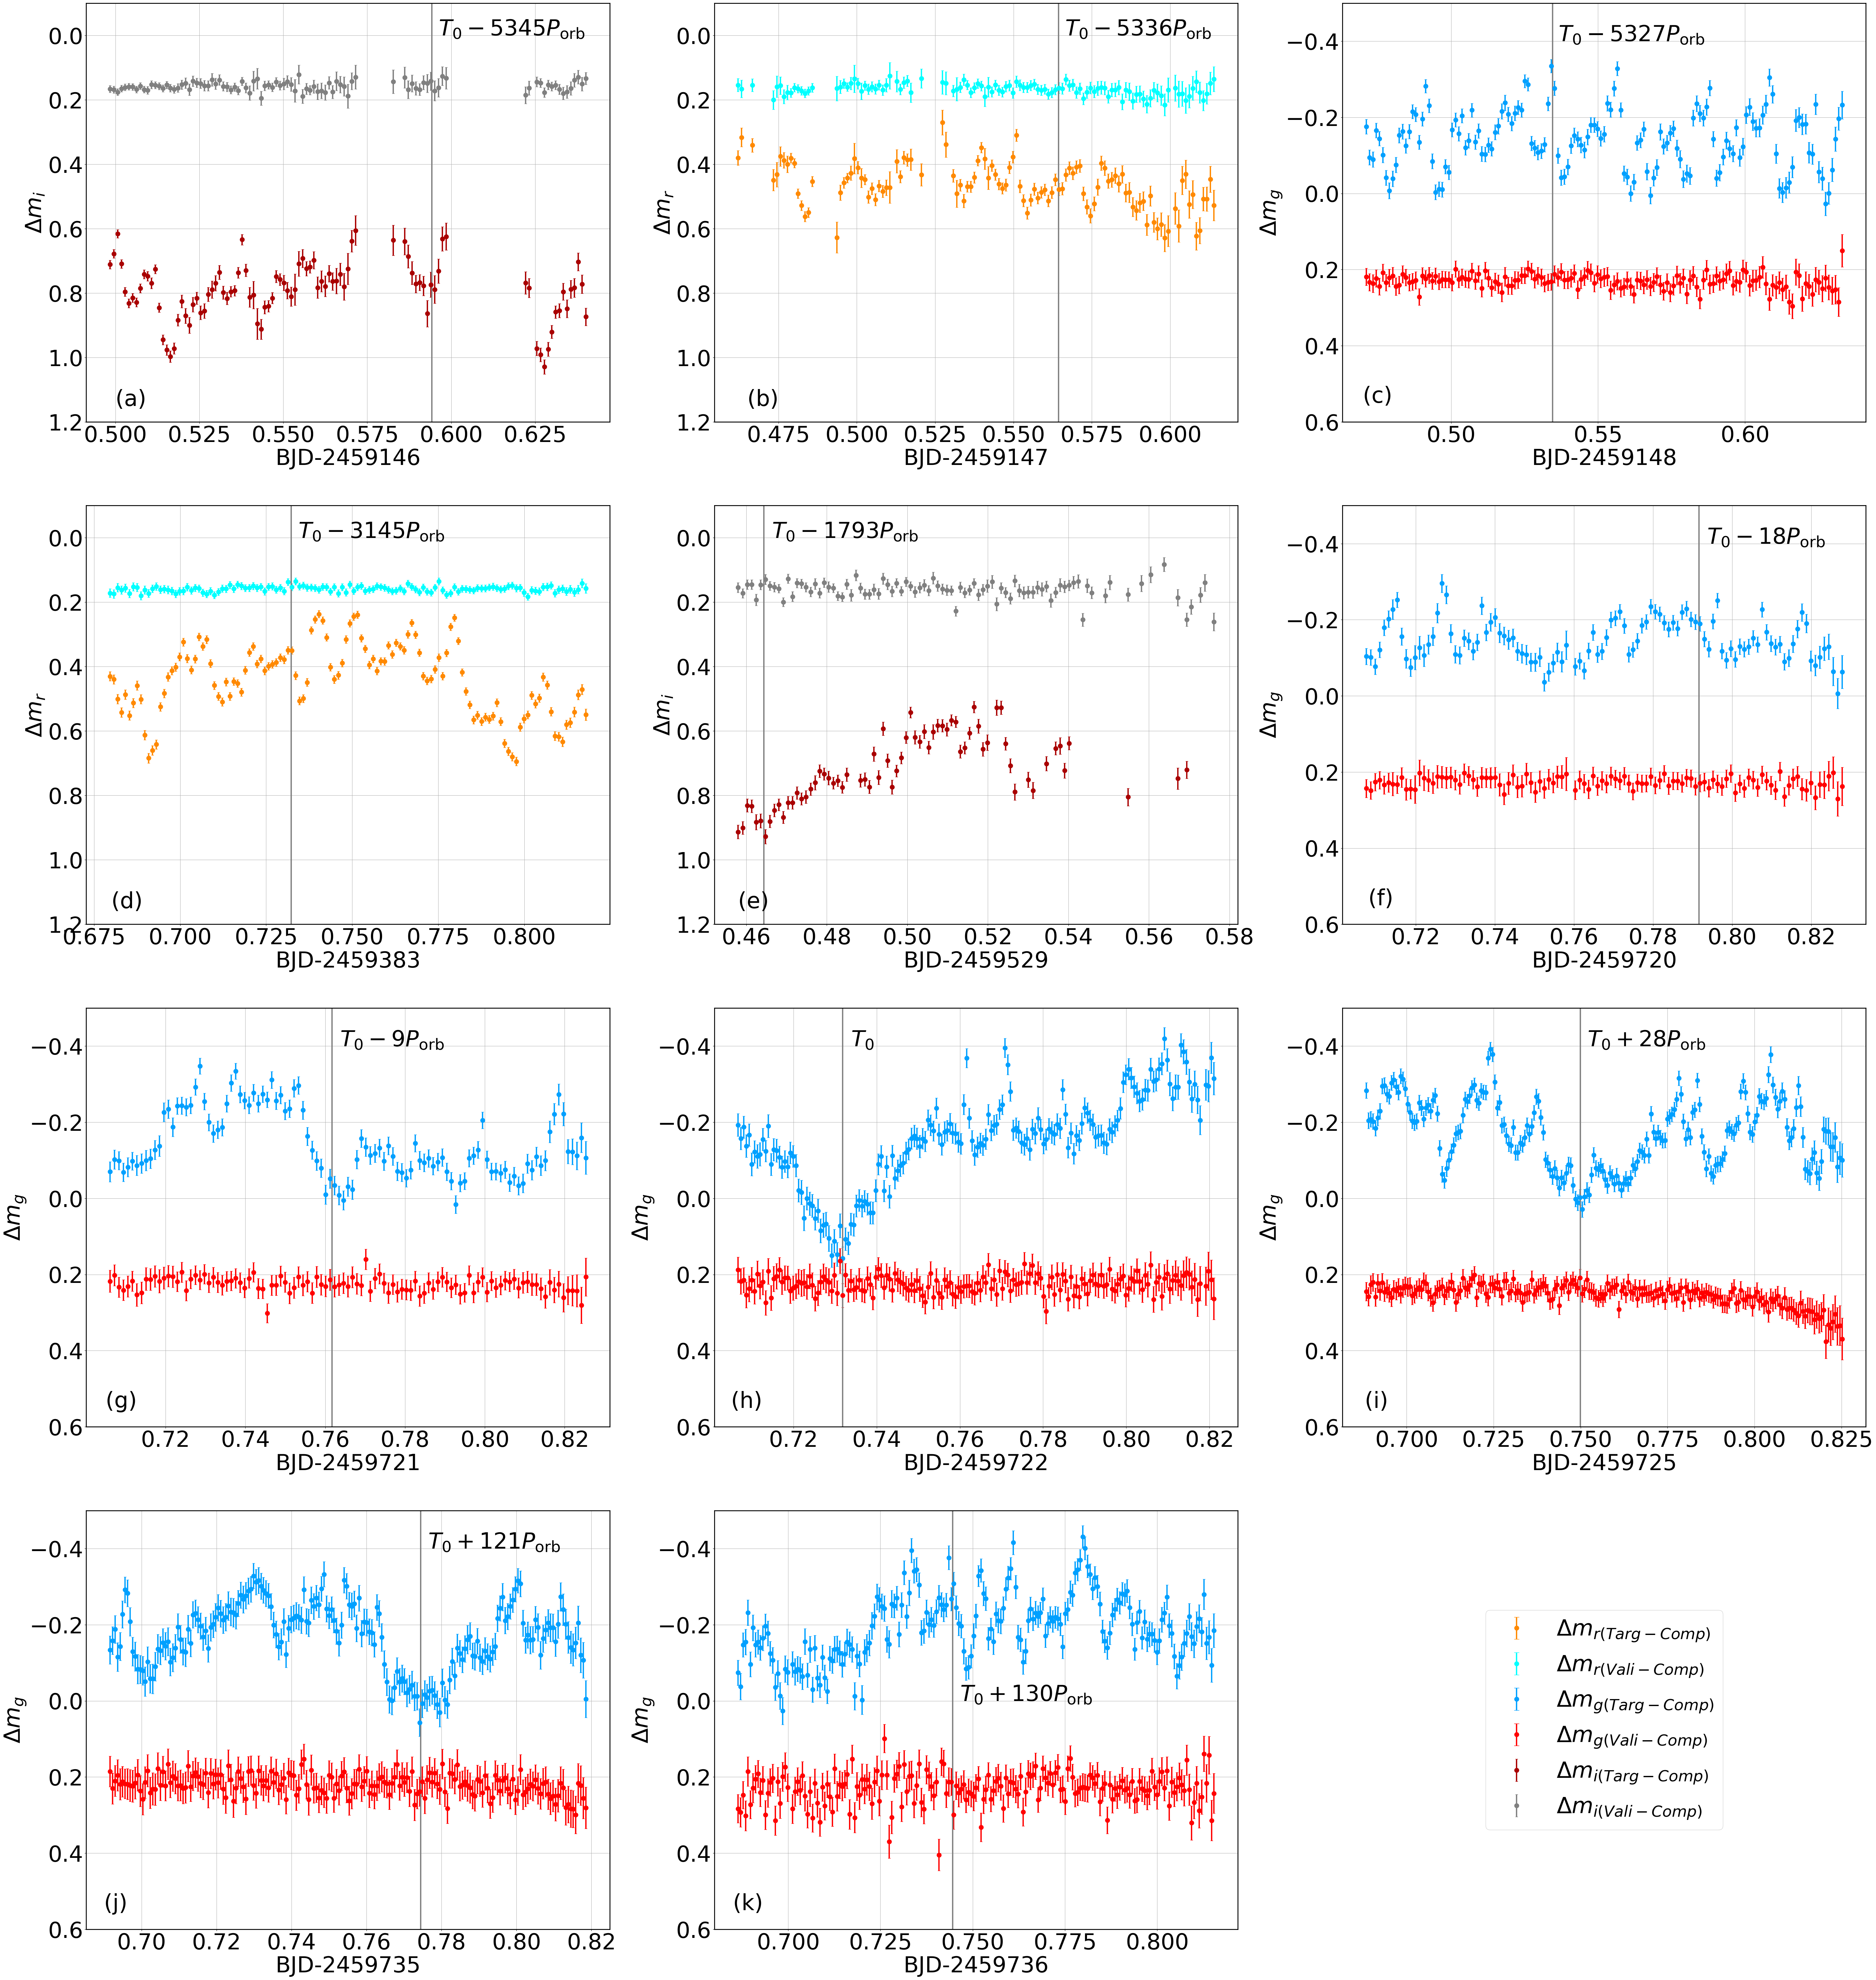
From October 2020 to June 2022, we observed J2043+3413 in Sloan - bands (Doi et al., 2010) on eleven nights using the Tsinghua-NAOC 0.8-m telescope (TNT) at the Xinglong Station (Wang et al., 2008; Huang et al., 2012). The observation log of J2043+3413 is given in Table 2. One image of this object is shown in Fig. 2. For long-term time-series photometric observations, the differential photometry is sufficient for our work. We select two stars with constant luminosity in the field of J2043+34 as a comparison star and validation star. All the time of our observation have been converted to Barycentric Julian Day (BJD) in Barycentric Dynamical Time (TDB) (Eastman et al., 2010).
| UT Date | Filter | Number of Effective Image | Exposure Time(s) | Panel in Fig 6 |
|---|---|---|---|---|
| 2020 Oct. 24 | i | 95 | 80 | (a) |
| 2020 Oct. 25 | r | 113 | 80 | (b) |
| 2020 Oct. 26 | g | 145 | 80 | (c) |
| 2021 Jun. 18 | r | 124 | 80 | (d) |
| 2021 Nov. 11 | i | 69 | 80 | (e) |
| 2022 May. 21 | g | 108 | 80 | (f) |
| 2022 May. 22 | g | 106 | 80 | (g) |
| 2022 May. 23 | g | 173 | 40 | (h) |
| 2022 May. 26 | g | 208 | 40 | (i) |
| 2022 Jun. 05 | g | 190 | 40 | (j) |
| 2022 Jun. 06. | g | 191 | 40 | (k) |
2.2 TESS Data
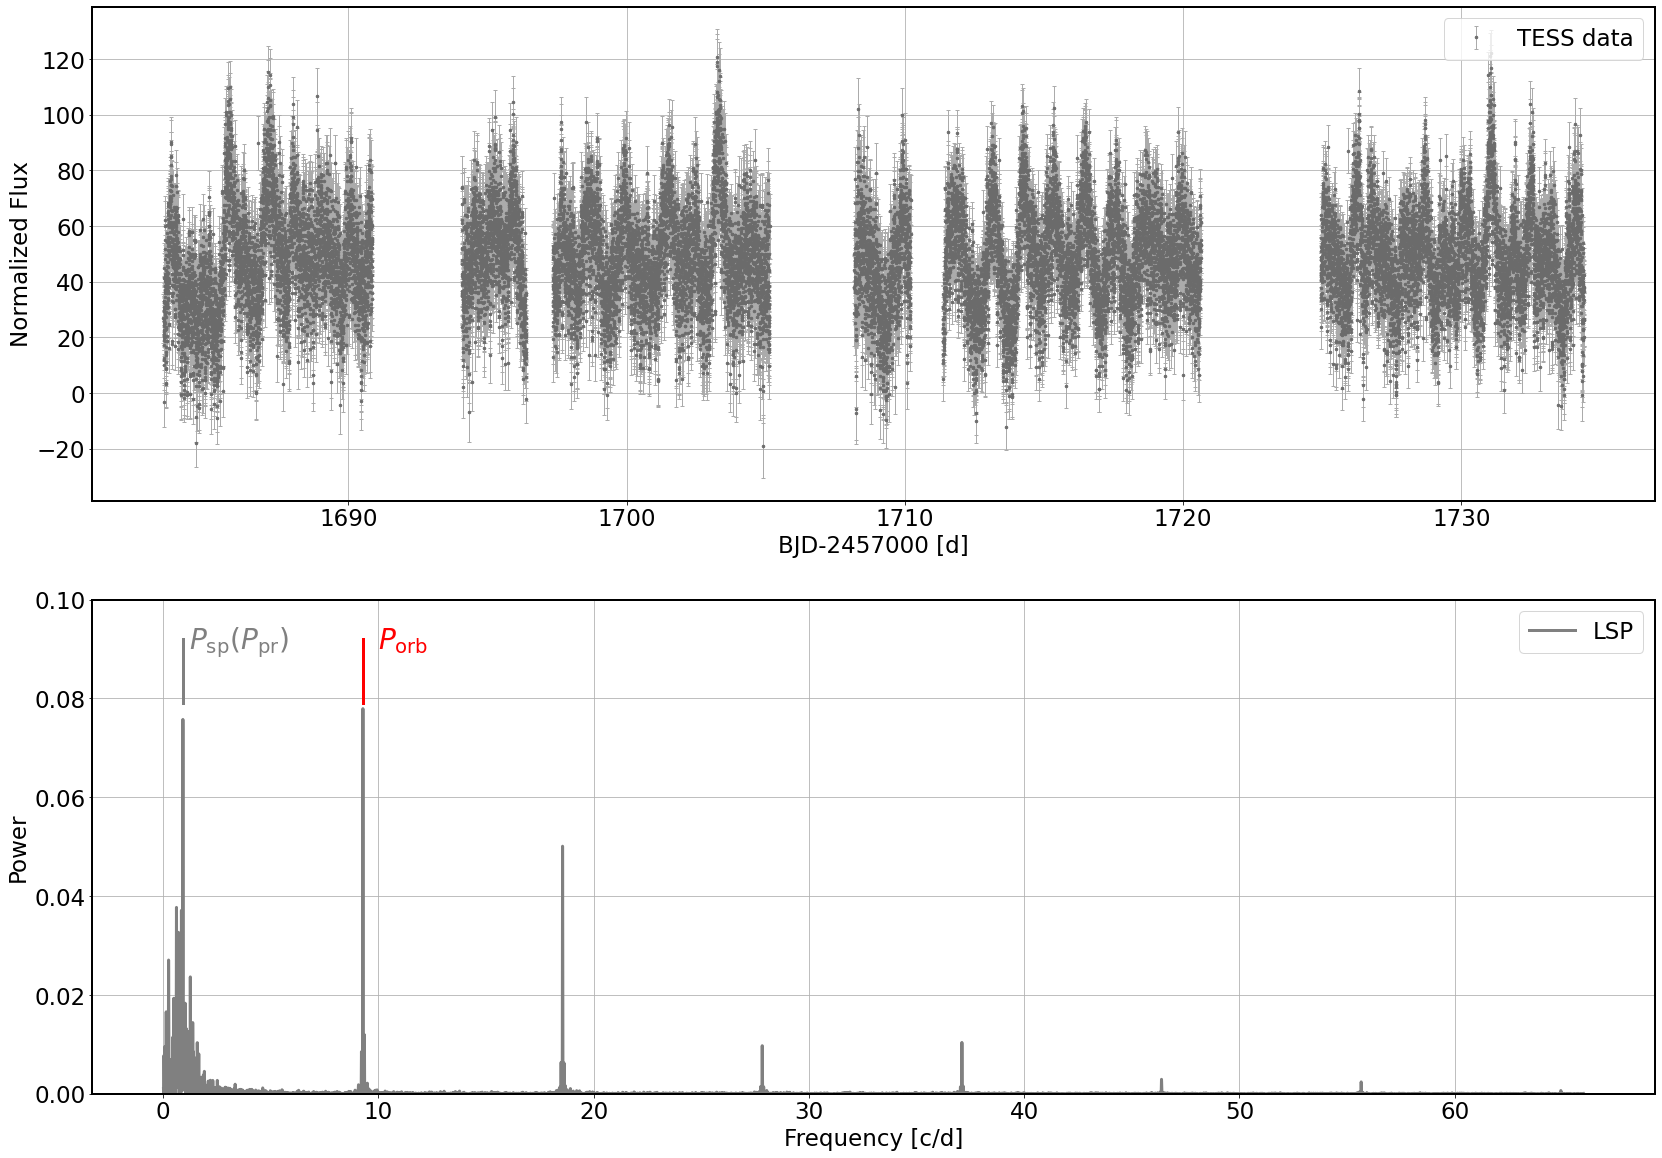
TESS works in the visible and near-infrared bands, covering wavelengths 6001000 nm. During the first two years of its mission, TESS divided 85% of the sky area into 26 sectors and conducted continuous observations of each sector for 27 days. For some stars located at high ecliptic latitude areas, the continuous observation can be up to 351 days due to overlapping sectors. The light curves of stars monitored by TESS are produced with MIT’s Quick-Look Pipeline (Huang et al., 2020). J2043+3413 (corresponding to TIC 100234005 in the TESS catalog) has been monitored by TESS in its sectors 14 and 15, and the observations lasted for 49 days with a cadence of 120s. Some of the lower quality data caused several gaps. The normalized TESS light curve of this source is shown in the upper panel of Fig. 3.
2.3 Other Survey Data
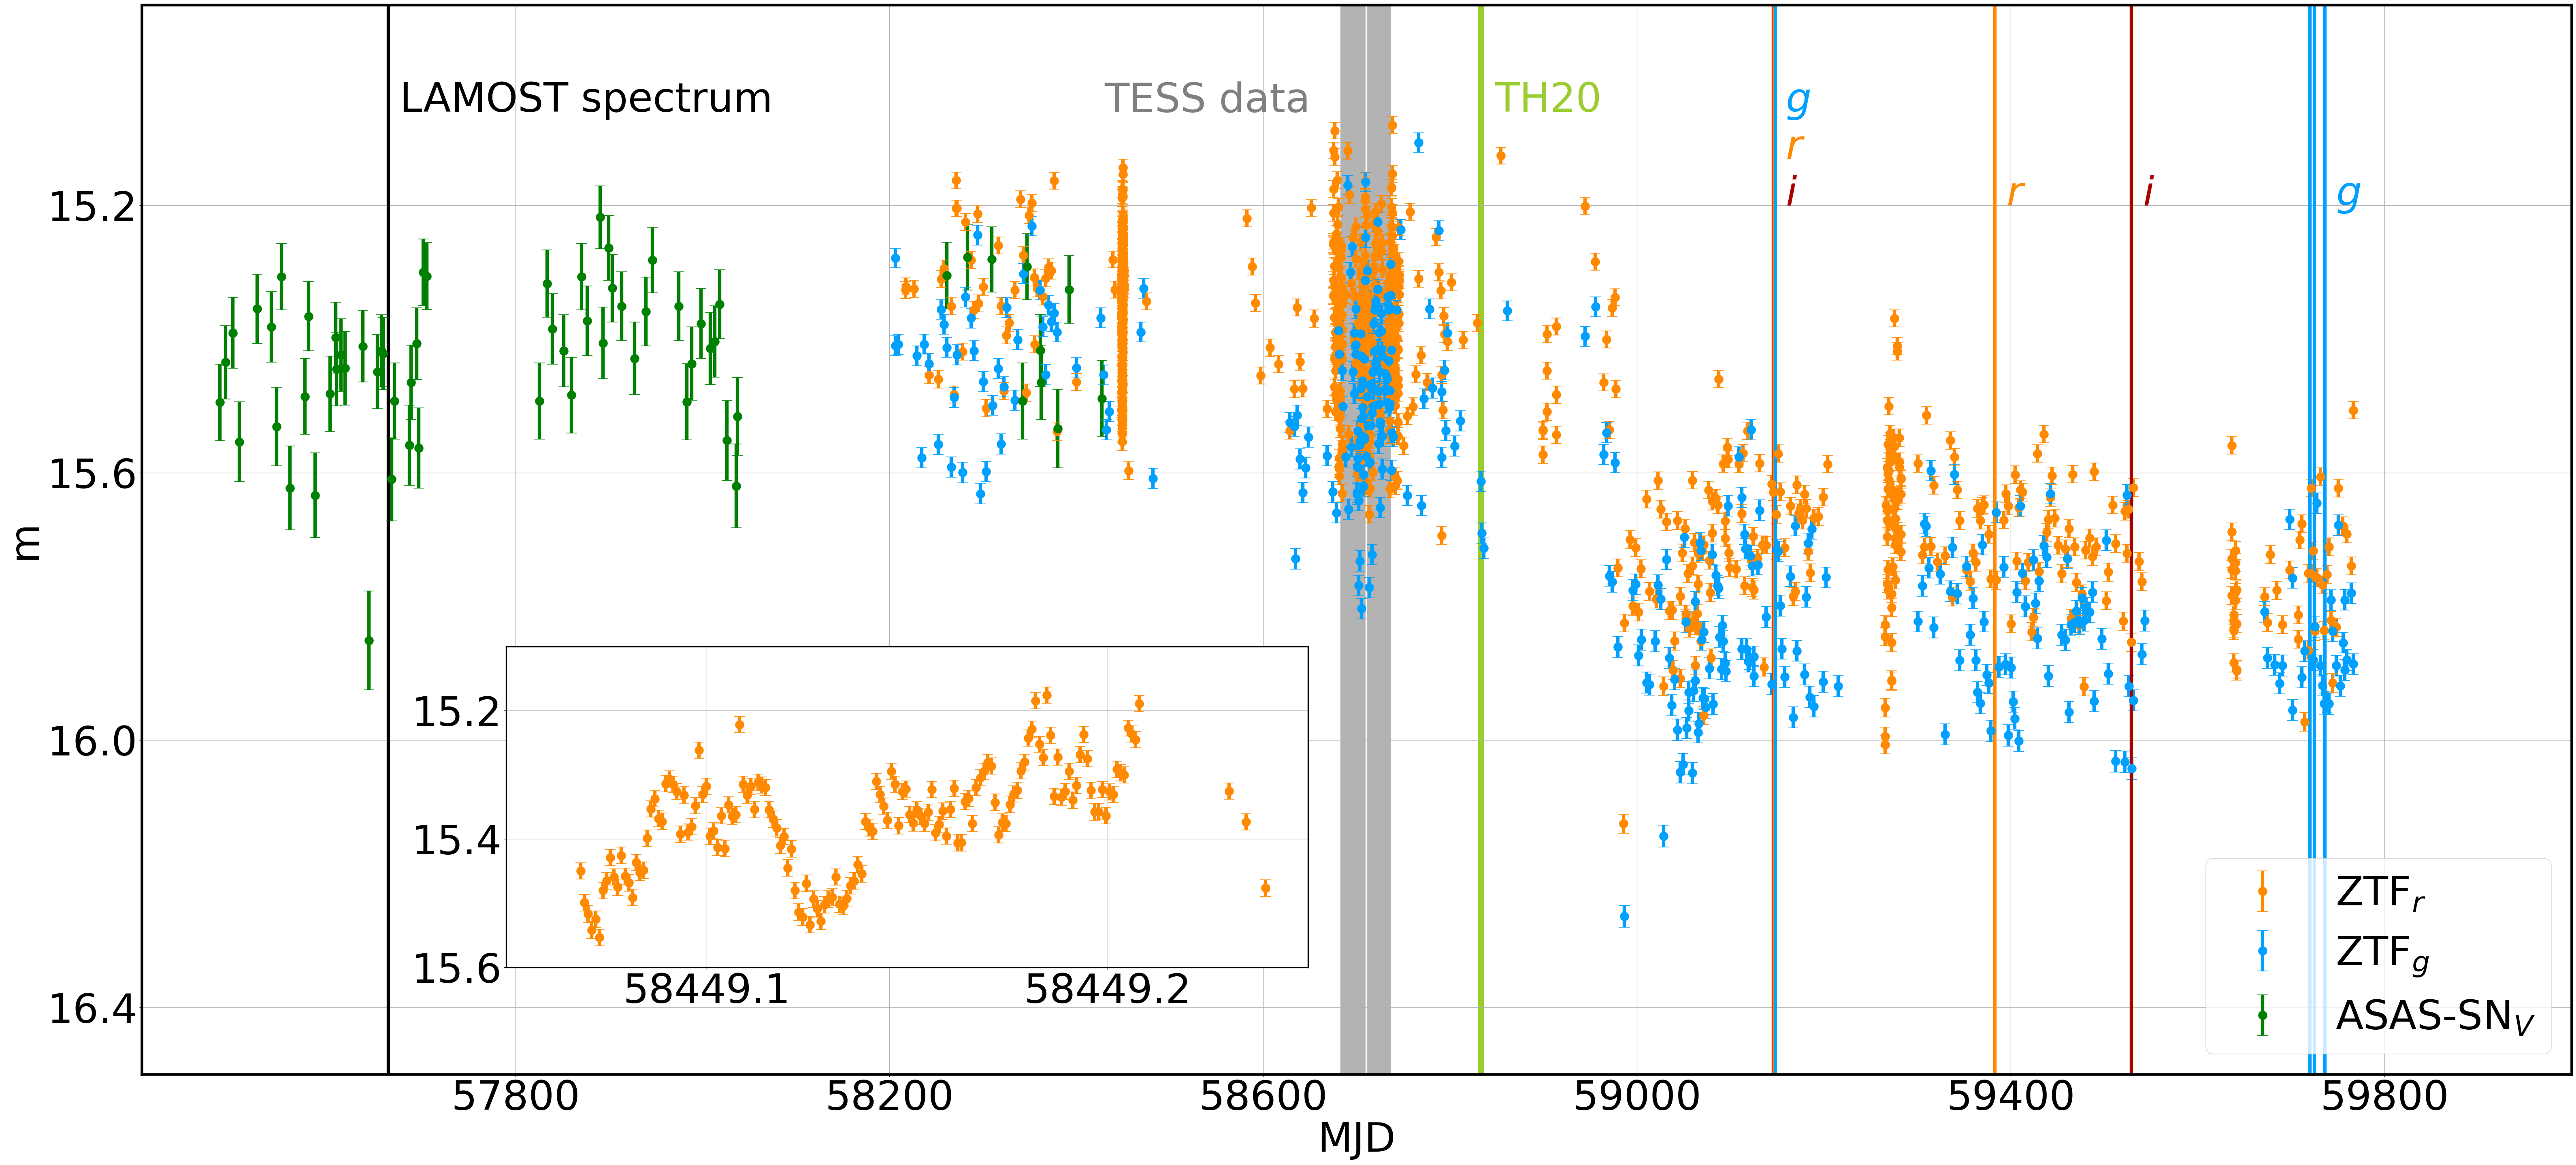
J2043+3413 has also been covered by ground-based surveys such as ZTF and ASAS-SN, which provide long-term ZTF g/r-bands and ASAS-SN V/g-bands data. Notice that both the ZTF and ASAS-SN data are under-sampled, and only one data point is available for most sidereal days. The ZTF data lasted for more than 1200 days, and the corresponding light curves of J2043+3413 are shown in Fig. 4. Only one consecutive observation was performed on the night of MJD 58449 (see the subgraph of Fig. 4).
The observation by ASAS-SN lasted for about 2000 days. Some of the -band data from ASAS-SN are overplotted in Fig. 4. As the photometric errors of ASAS-SN data are relatively large, we use the ASAS-SN data only for qualitative analysis.
3 Photometric analysis
As can be seen from the ZTF and ASAS-SN data in Fig. 4, J2043+3413 shows a sudden decline around MJD 58979. The mean brightness of J2043+3413 is 15.47 mag in ZTF g-band and 15.37 mag in ZTF r-band before MJD 58979, but after that, it declined to 15.84 mag in g-band and 15.71 mag in r-band. Its color index also changed from 0.10 mag to 0.13 mag after MJD 58979.
3.1 Orbital and superorbital period
Relatively few CVs have been found in the orbital period range of 23 hours (h), the so-called CV period gap (King, 1988; Kolb et al., 1998). The analysis of TH20 revealed two possible periods for J2043+3413, i.e., 2.586(3) and 2.899(3) h based on the velocities of H emission line, and the later one was attributed to a daily cycle-count alias. Both of these two periods lie in the CV period gap.
We search for periodic signals using the python package Astropy (Astropy Collaboration et al., 2018). We normalized all of the light curves and computed their Lomb-Scargle periodogram (LSP here after, Lomb 1976; Scargle 1982). The LSP for the TESS data is shown in the bottom panel of Fig. 3.
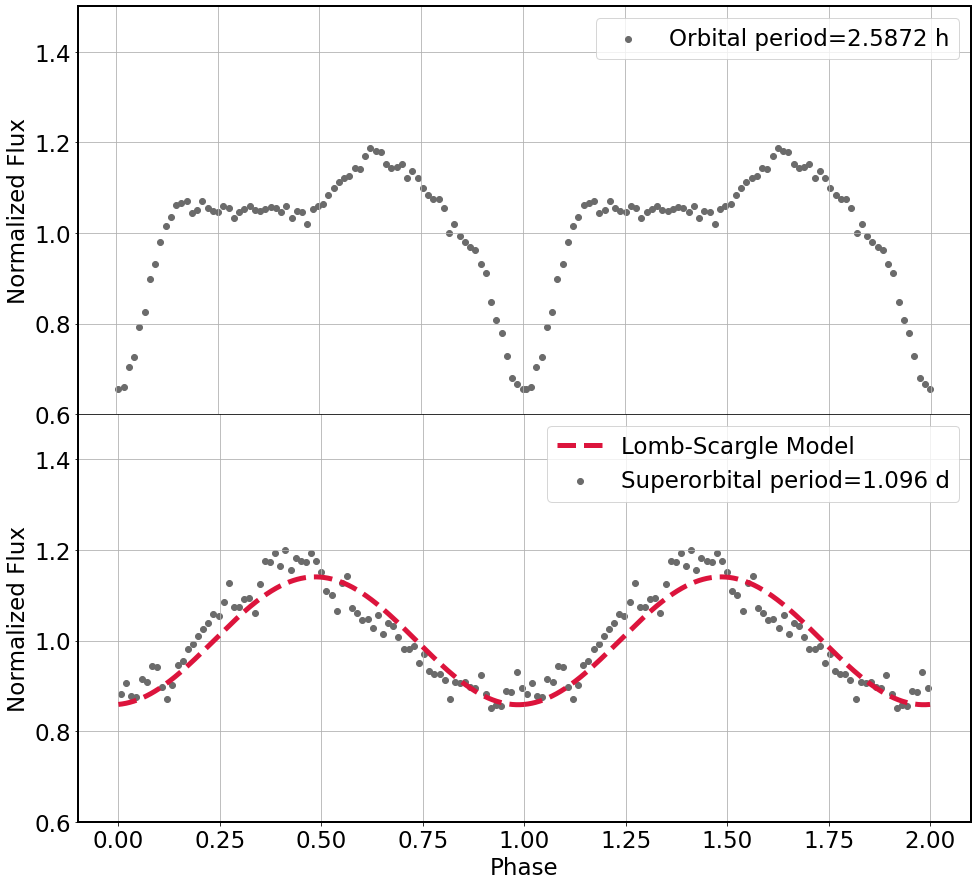
As can be seen, the LSP of the TESS data reveals several prominent peaks, the most significant ones are around 0.9127 c/d (1.096 d) and 9.2764 c/d (2.5872 h). The less significant peaks above 10 c/d are the harmonics of the fundamental frequency of 9.2764 c/d. In order to show the orbital variability, we folded the data with the period 2.5872 h, and the 120s bin-averaged normalized flux is presented in the upper panel of Fig. 5. The orbital light curve shows an eclipse and a pre-eclipse hump.
To estimate the error of the orbital period, we follow the method from VanderPlas (2018). The scaling of frequency is approximated by
| (1) |
where is the half-width of peak at half-maximum and the height of peak. We obtain an error of the orbital period as 0.008 h. The orbital period derived from TESS data is h, which is the same, within the uncertainties, as the 2.586(3) h period derived by TH20.
The day-scale LSP peak around 0.9127 c/d (1.096 d) is likely a superorbital period (). We estimated an error of 0.05 d. The 1200 s bin-averaged normalized flux, which is folded with superorbital periods, is shown in the bottom panel of Fig. 5. It can be well fitted with a sine curve (Lomb-Scargle model (VanderPlas, 2018)).
3.2 Photometric variations of TNT data
The light curves of TNT data observed on eleven nights with error bars are shown in Fig. 6. It is interesting to note that the light curves on different nights are quite different. It could be seen that the light curve on 2022 May 22 (BJD 2459722) shows an eclipse-like feature, with a duration about 0.7 h, similar to the eclipsing duration of the TESS orbital profile (see the upper panel of Fig. 5). Based on the eclipse-like feature, we define an ephemeris of eclipse as , where 0.1078 d is the orbital period () obtained from TESS data. The predicted eclipse times of the other nights are plotted as vertical lines in Fig. 6. is the time of an eclipse-like feature, which is BJD 2459722.73184. The predicted eclipse times seem to coincide with the minimum of the light curve on , , and , but not on .
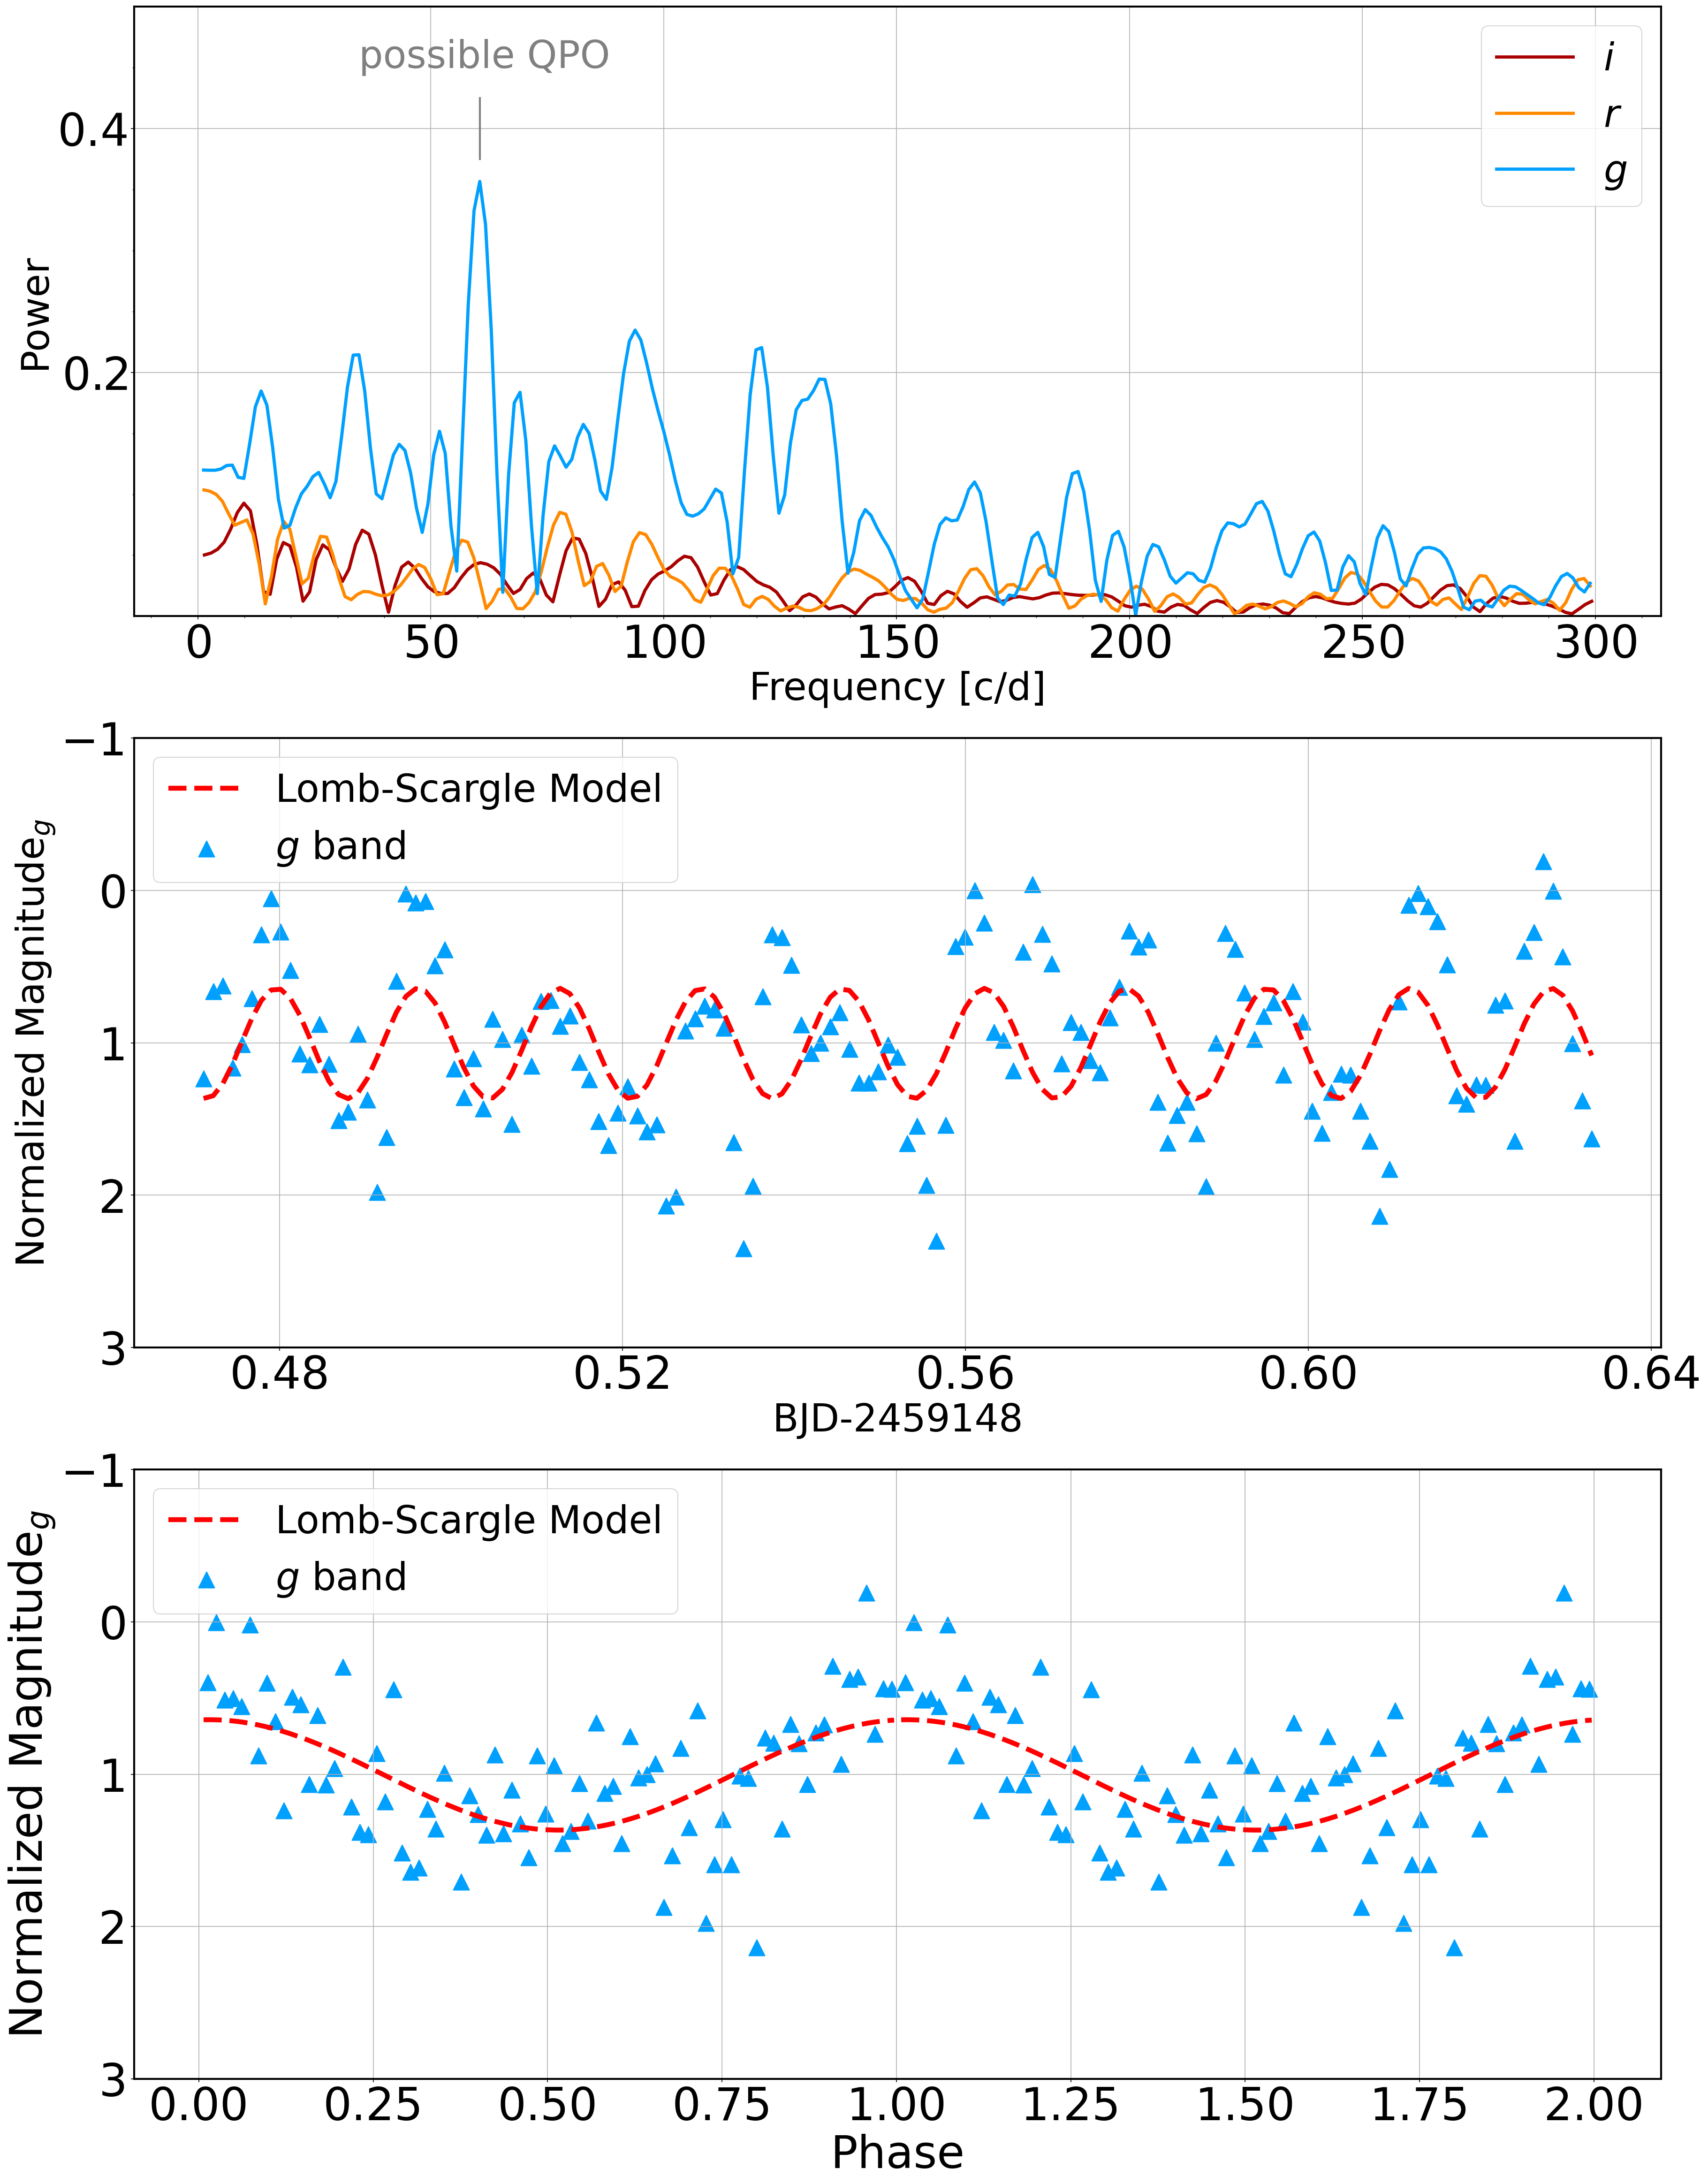
The top panel of Fig. 7 shows the LSP of the TNT observations from 2020. We see that the LSP of i- and r-bands data are similar, while that of the g-band data looks quite different. The g-band LSP shows a feature around period 1426 s (60.52 c/d), which might be a kilosecond quasi-periodic oscillation (QPO; Woudt & Warner 2002). The folded g-band light curve with 1426 s is presented in the bottom panel of Fig. 7, with the g-band data in the middle panel. The folded light curve looks like a sine function, as represented by the Lomb-Scargle model in the figure. We also checked the LSP of TNT data on other nights and found no apparent feature.
4 Discussion and conclusion
We have analyzed the photometric data of J0243, including TESS and ZTF survey data, as well as our own TNT data. The LSP of TESS data shows two prominent peaks (2.587 h and 1.09 d), corresponding to the orbital and super orbital periods, respectively. The superorbital period is generally attributed to the precession period of the accretion disk () in CV system (Patterson, 1979; Osaki, 1989; Armstrong et al., 2013). The observed of J2043+3413 is approximately 10. The orbital profile of the TESS data shows an eclipse and a pre-eclipse bump. Some of the TNT data also show eclipse-like features, while others do not.
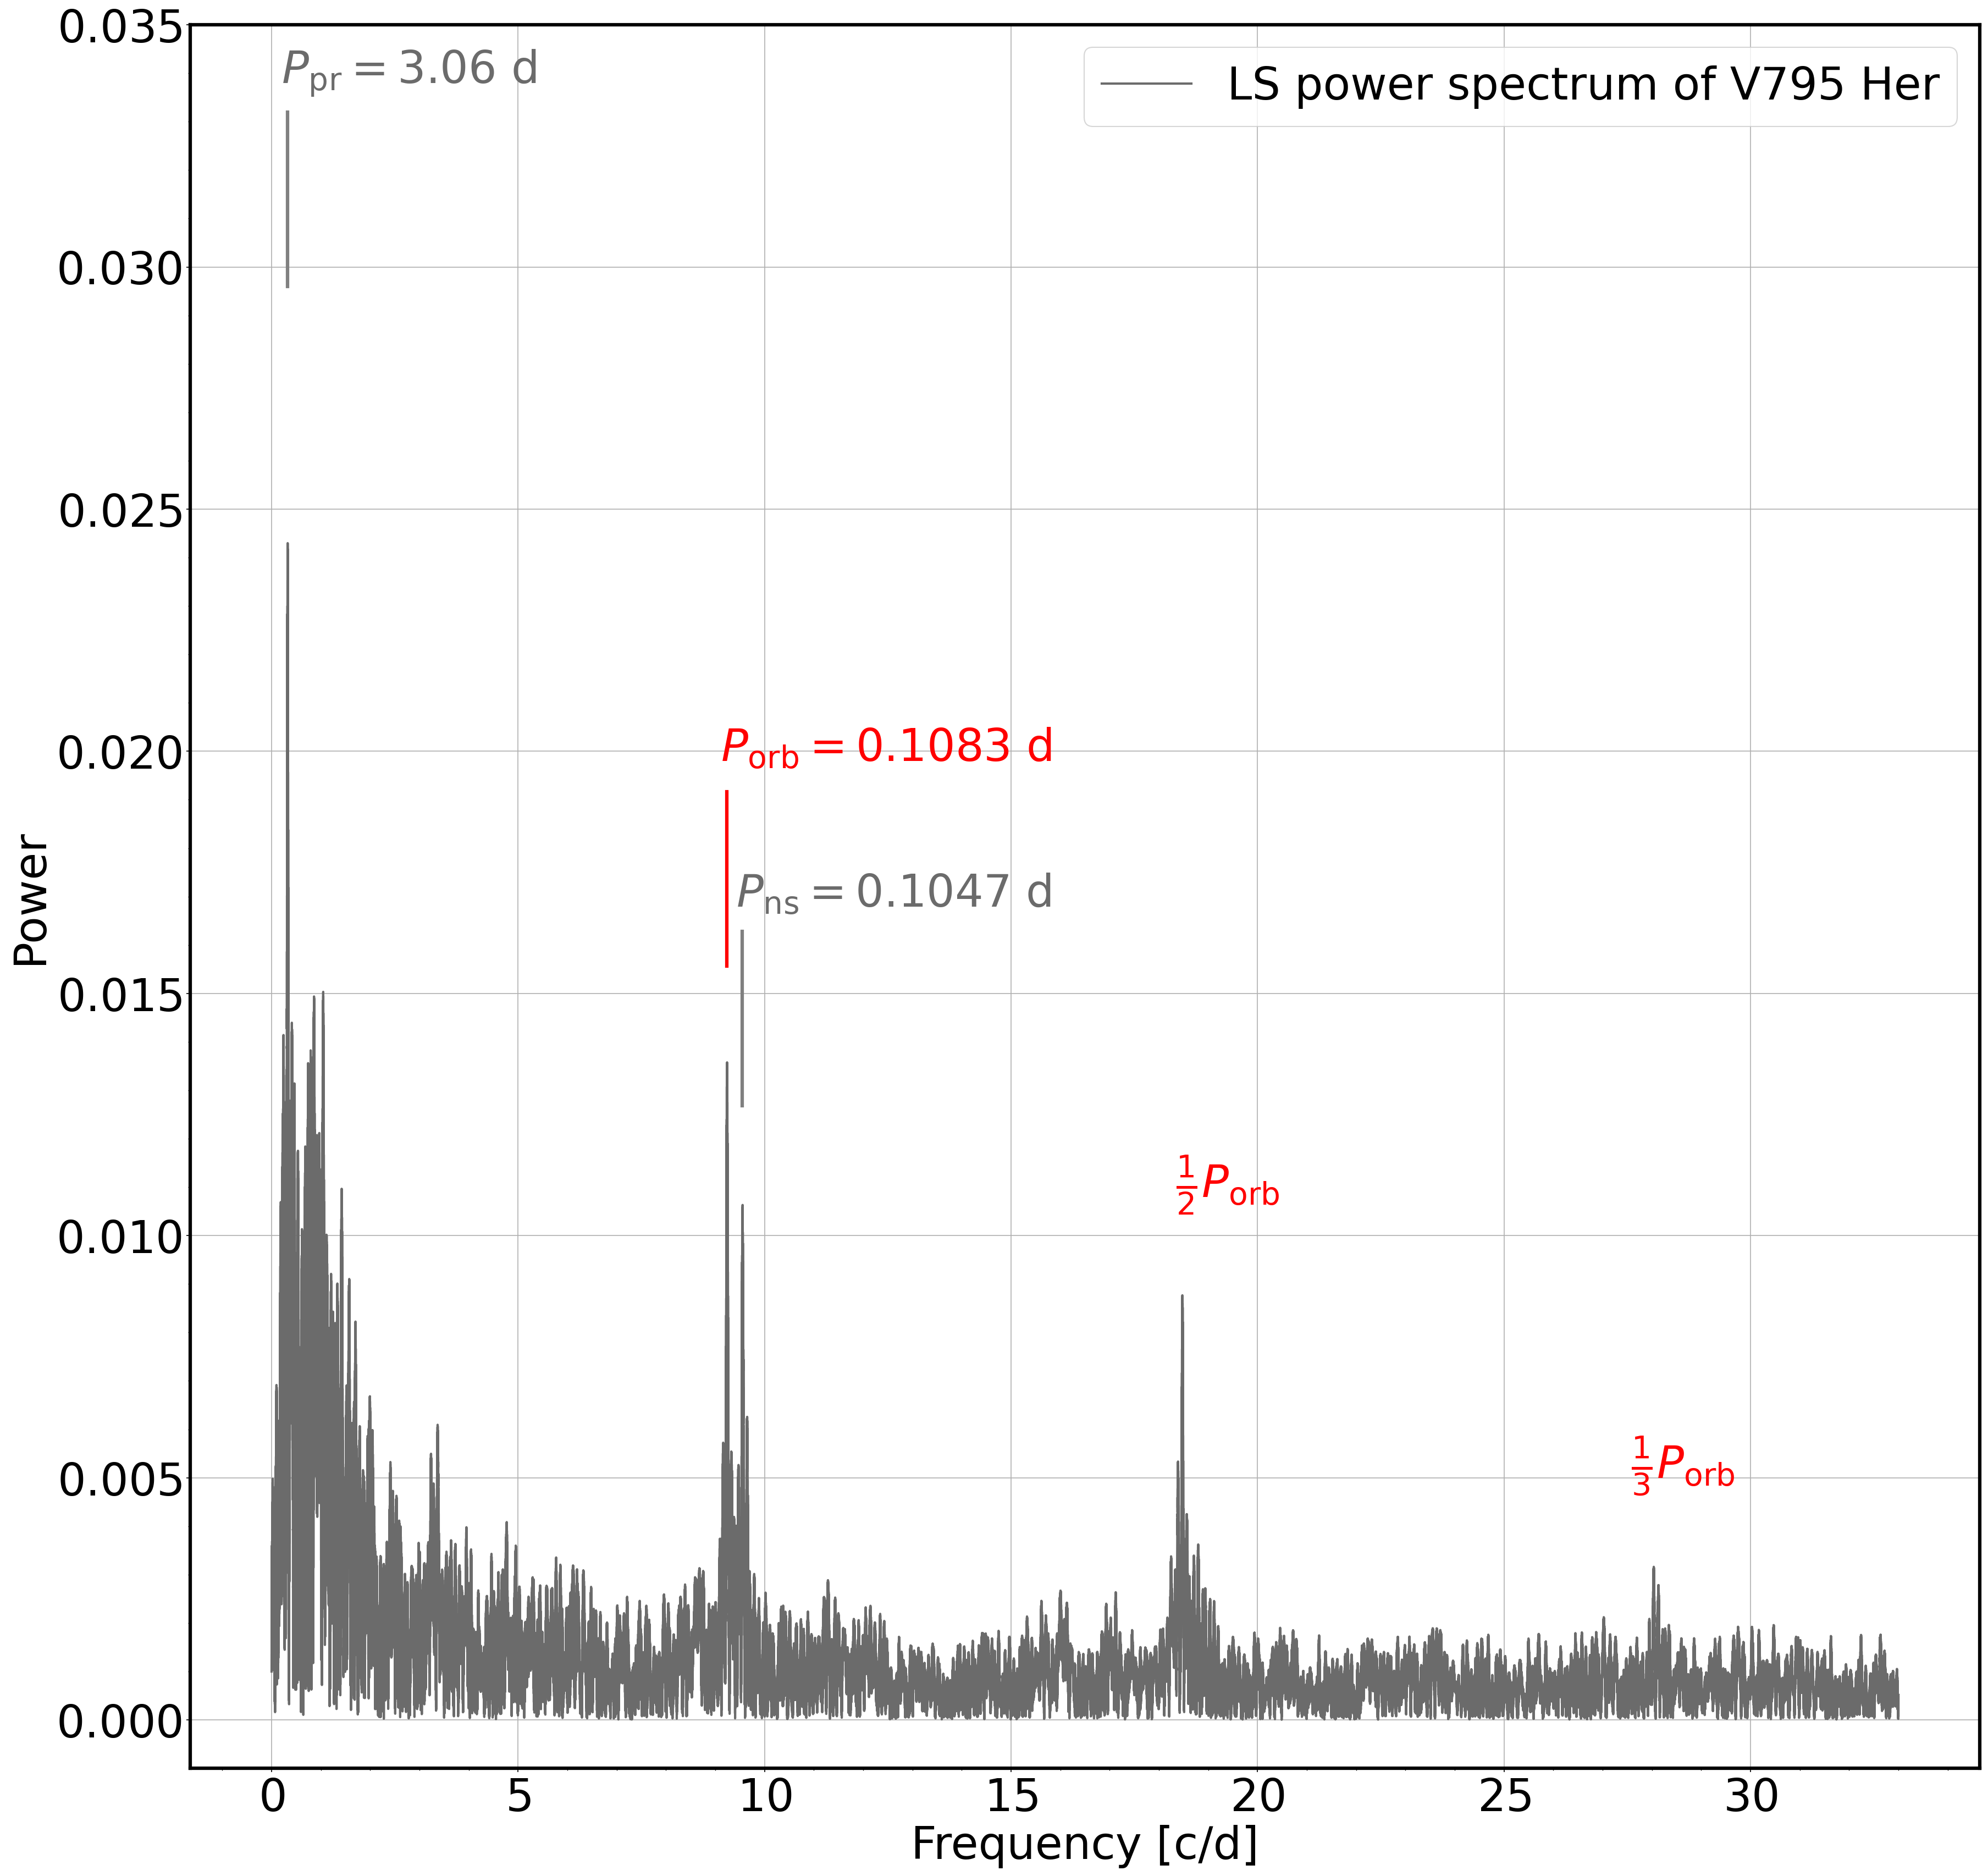
As pointed out by TH20, J2043+3413 is likely a SW Sex type NL CV, similar to V795 Her, which has an orbital period of 2.597 h. It is interesting to note that both J2043+3413 and V795 Her are located in the period gap. The previously reported of V795 Her is about 14, with a super orbital period of 1.53 d (Shafter et al., 1990). We examined the TESS data of V795 Her (TIC 9464138) and found a prominent peak on 3.06 d (Fig. 8), which is twice the previous value.
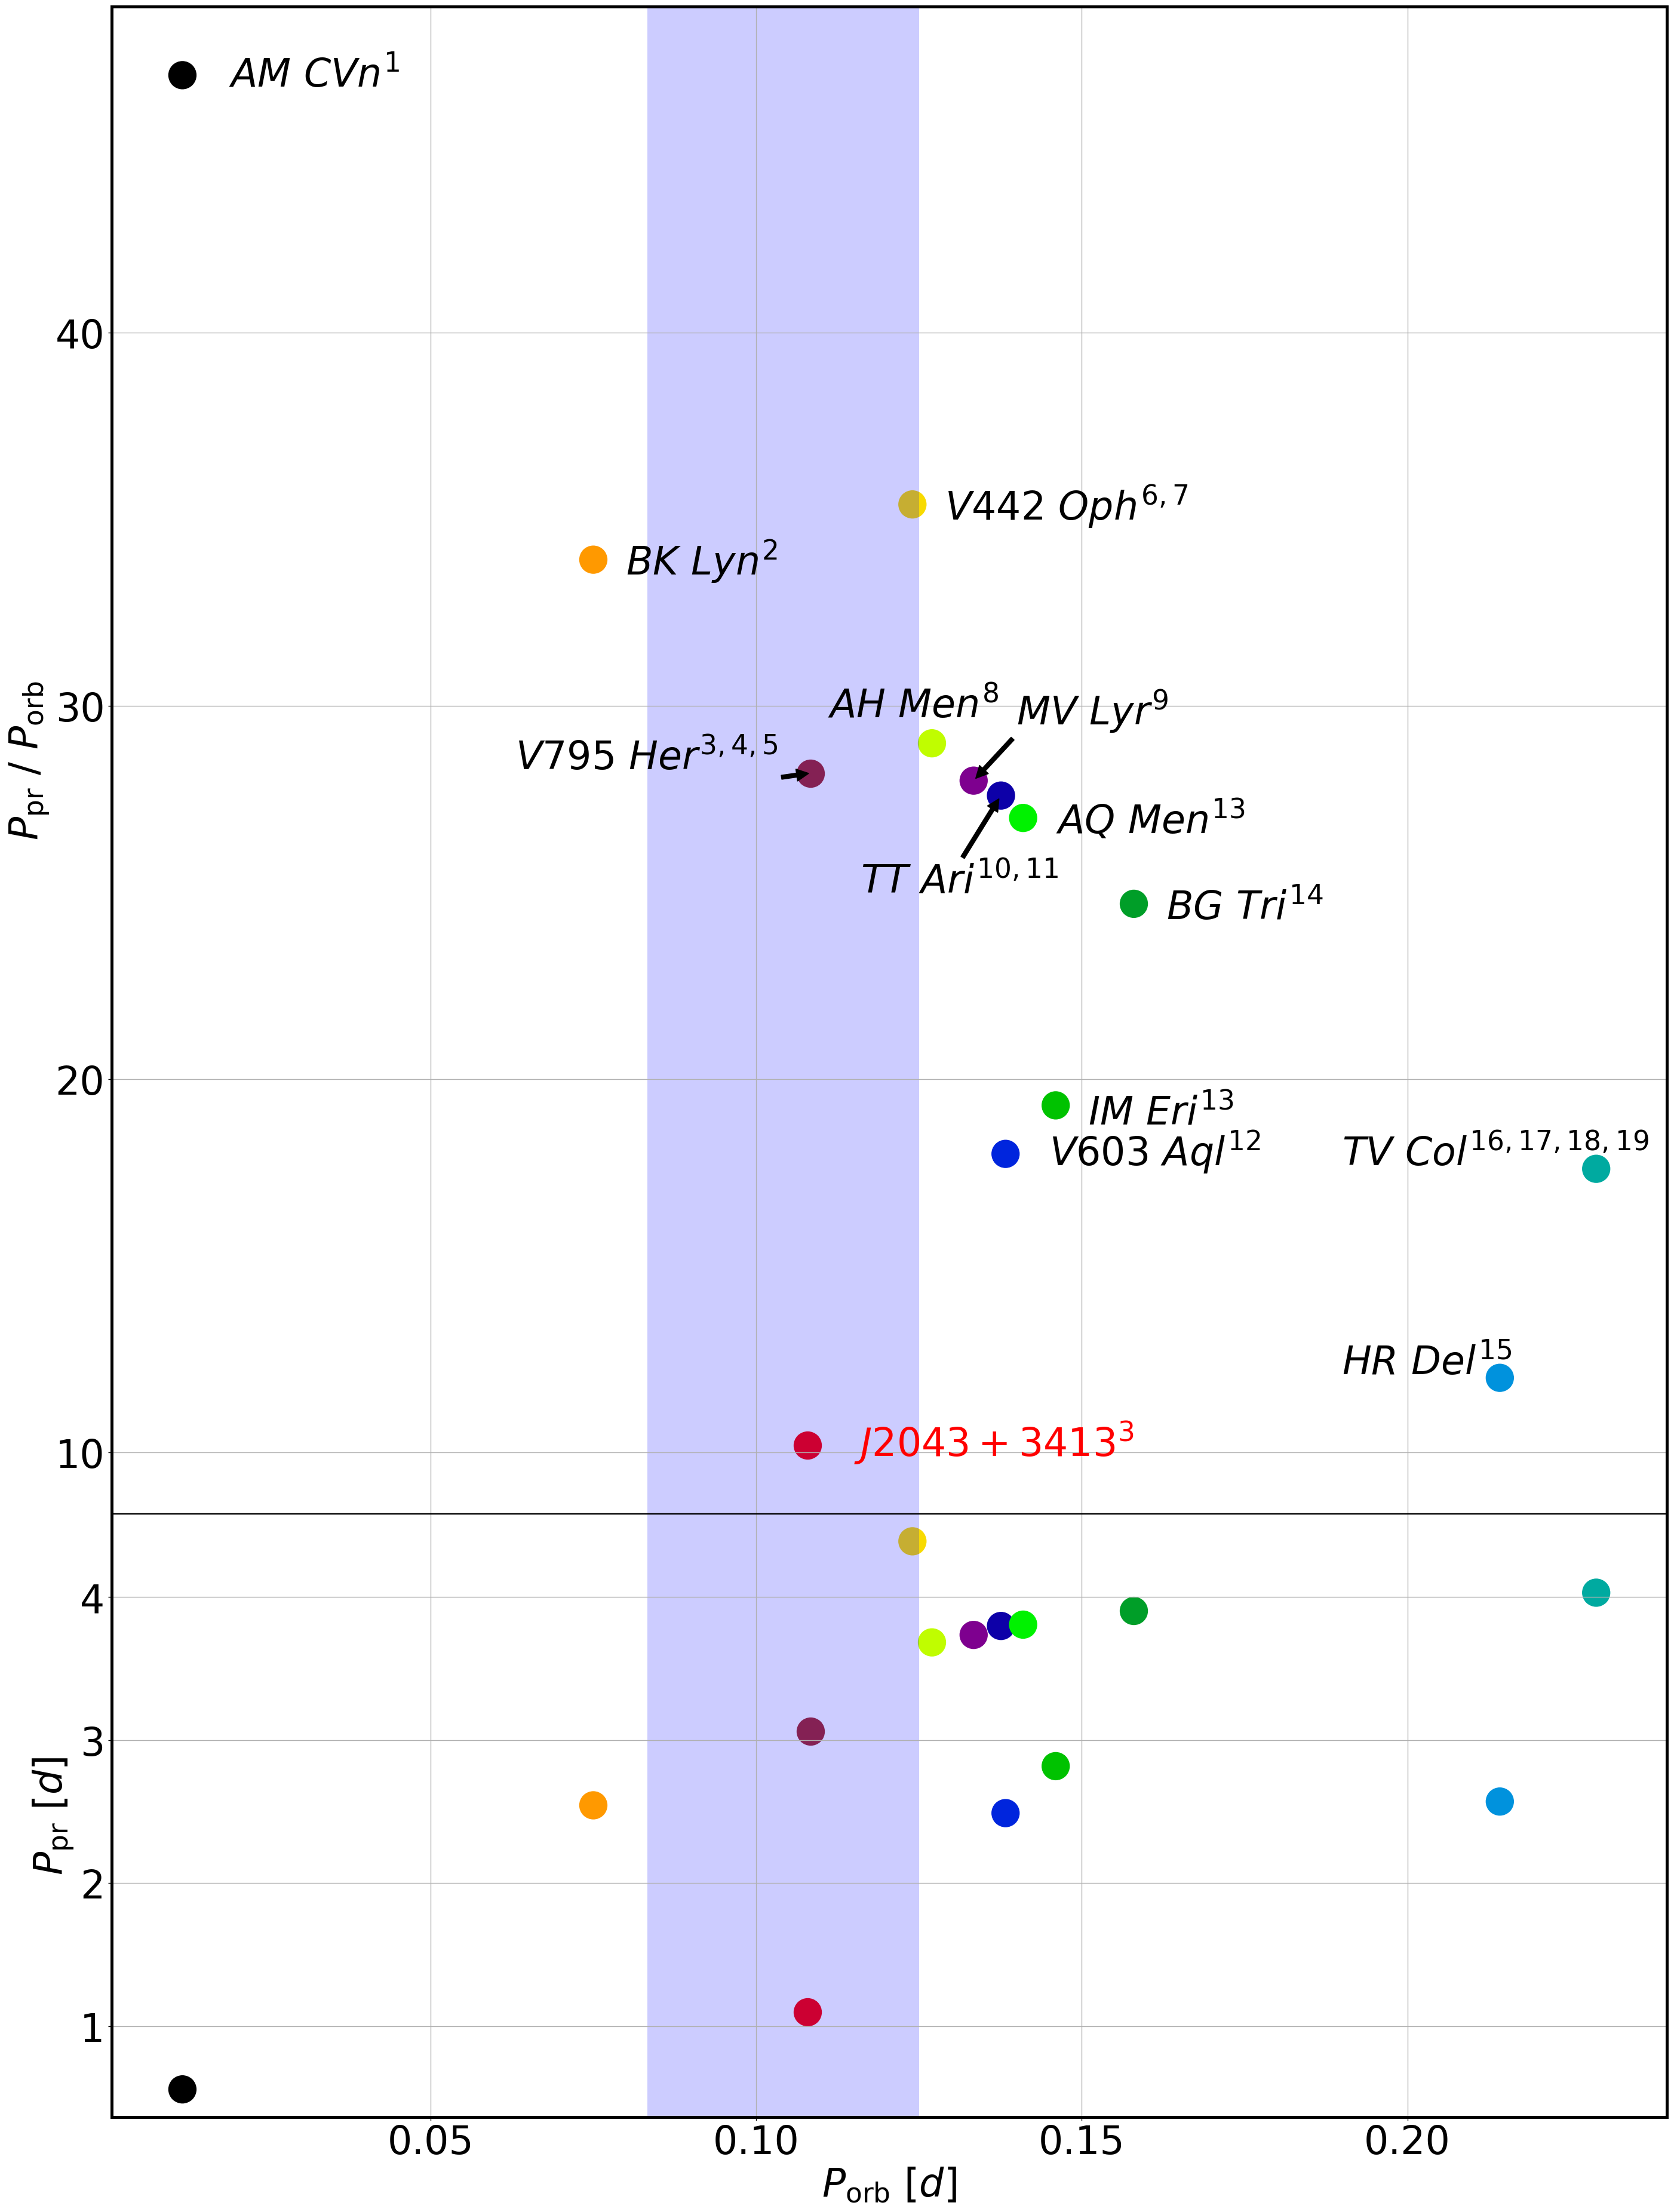
In Fig. 9 we compare the of J2043+3413 with some well-studied CVs. Besides V795 Her, TT Ari, AH Men and V442 Oph also belong to SW Sex stars. IM Eri, AQ Men and MV Lyr are classified as other NL subclasses. AM CVn is a hydrogen-deficient CV with a short orbital period. V603 Aql and HR Del belong to the CN subclass. BK Lyn is a confirmed DN system. TV Col is a long-period IP. The of J2043+3413 is 2-3 times less than the general trend of , showing that J2043+3413 is a very special CV. The precession period of J2043+3413 is 23 times shorter than those of others.
QPOs detected in CVs are most likely from the accretion disks (Carroll et al., 1985; Lubow & Pringle, 1993). Vertical or radial oscillations of accretion disks have been proposed as the probable origin of QPOs. Some QPOs may be related to magnetically-controlled accretion in magnetic CVs (WA95). Long period (kilosecond) QPOs are even more confusing phenomena, which have been observed in some SW Sex stars (Lima et al., 2021). They may reflect the spin of primary WD, which is drowned by the noise of high accretion rate in these systems (Patterson et al., 2002; Hoard et al., 2003).
The LSP of g-band TNT data observed in 2020 shows a peak around 1426 s, which may be a transient QPO phenomenon. It is interesting to note that V795 Her was also found to show a transient QPO around 1160 s (Patterson & Skillman, 1994). The intermittent behavior of the eclipse of J2043+3413 indicates an intermediate orbital inclination. This is similar to V795 Her, whose inclination is (Casares et al., 1996).
In summary, J2043+3413 is a SW Sex candidate with an orbital period, an intermediate inclination, and a transient QPO, very similar to V795 Her. But the precession period of J2043+3413 is about 3 times shorter compared to V795 Her and other typical CVs, indicating an unusual, fast precessing disk in J2043+3413. The physical mechanism of the faster precession of J2043+3413 is unclear to us and further studies are needed to reveal their nature.
Acknowledgments
We thank our referee for very detailed and great suggestions, which help us a lot to improve this paper. We thank Fengwu Sun from University of Arizona for helpful suggestions. This work is supported by the National Natural Science Foundation of China (NSFC grants 12288102, 12033003, 11633002 and 12203006), Science Program of Beijing Academy of Science and Technology (23CB061, BS202002), and the Tencent Xplorer Prize. We acknowledge the support of the staff of the Xinglong 80cm telescope (TNT).
The TESS data presented in this paper were obtained from the Mikulski Archive for Space Telescopes (MAST) at the Space Telescope Science Institute (STScI). The specific observations analyzed can be accessed via https://doi.org/10.17909/t9-nmc8-f686 (catalog 10.17909/t9-nmc8-f686). This work has made use of data from the European Space Agency (ESA) mission Gaia (https://www.cosmos.esa.int/gaia), processed by the Gaia Data Processing and Analysis Consortium (DPAC, https:// www.cosmos.esa.int/web/gaia/dpac/consortium). Funding for the DPAC has been provided by national institutions, in particular the institutions participating in the Gaia Multilateral Agreement. Based on observations obtained with the Samuel Oschin Telescope 48 inch and the 60 inch Telescope at the Palomar Observatory as part of the ZTF project. ZTF is supported by the NSF under grant AST-1440341 and a collaboration including Caltech, IPAC, the Weizmann Institute for Science, the Oskar Klein Center at Stockholm University, the University of Maryland, the University of Washington, Deutsches Elektronen-Synchrotron and Humboldt University, Los Alamos National Laboratories, the TANGO Consortium of Taiwan, the University of Wisconsin at Milwaukee, and Lawrence Berkeley national Laboratories. Funding for LAMOST (http://www.lamost.org) has been provided by the Chinese NDRC. LAMOST is operated and managed by the NAOC.
References
- Andrae et al. (2018) Andrae, R., Fouesneau, M., Creevey, O., et al. 2018, A&A, 616, A8, doi: 10.1051/0004-6361/201732516
- Armstrong et al. (2013) Armstrong, E., Patterson, J., Michelsen, E., et al. 2013, MNRAS, 435, 707, doi: 10.1093/mnras/stt1335
- Astropy Collaboration et al. (2018) Astropy Collaboration, Price-Whelan, A. M., Sipőcz, B. M., et al. 2018, AJ, 156, 123, doi: 10.3847/1538-3881/aabc4f
- Augusteijn et al. (1994) Augusteijn, T., Heemskerk, M. H. M., Zwarthoed, G. A. A., & van Paradijs, J. 1994, A&AS, 107, 219
- Barrett et al. (1988) Barrett, P., O’Donoghue, D., & Warner, B. 1988, MNRAS, 233, 759, doi: 10.1093/mnras/233.4.759
- Bellm et al. (2019) Bellm, E. C., Kulkarni, S. R., Barlow, T., et al. 2019, PASP, 131, 068003, doi: 10.1088/1538-3873/ab0c2a
- Bonnet-Bidaud et al. (1985) Bonnet-Bidaud, J. M., Motch, C., & Mouchet, M. 1985, A&A, 143, 313
- Borisov (1992) Borisov, G. V. 1992, A&A, 261, 154
- Bruch (1982) Bruch, A. 1982, PASP, 94, 916, doi: 10.1086/131085
- Bruch (2019) —. 2019, MNRAS, 489, 2961, doi: 10.1093/mnras/stz2381
- Carroll et al. (1985) Carroll, B. W., McDermott, P. N., Savedoff, M. P., van Horn, H. M., & Cabot, W. 1985, ApJ, 296, 529, doi: 10.1086/163472
- Casares et al. (1996) Casares, J., Martinez-Pais, I. G., Marsh, T. R., Charles, P. A., & Lazaro, C. 1996, MNRAS, 278, 219, doi: 10.1093/mnras/278.1.219
- Cropper (1990) Cropper, M. 1990, Space Sci. Rev., 54, 195, doi: 10.1007/BF00177799
- Cropper et al. (2002) Cropper, M., Ramsay, G., Hellier, C., et al. 2002, Philosophical Transactions of the Royal Society of London Series A, 360, 1951, doi: 10.1098/rsta.2002.1046
- Cui et al. (2012) Cui, X.-Q., Zhao, Y.-H., Chu, Y.-Q., et al. 2012, Research in Astronomy and Astrophysics, 12, 1197, doi: 10.1088/1674-4527/12/9/003
- Dai et al. (2016) Dai, Z., Szkody, P., Garnavich, P. M., & Kennedy, M. 2016, The Astronomical Journal, 152, 5, doi: 10.3847/0004-6256/152/1/5
- Doi et al. (2010) Doi, M., Tanaka, M., Fukugita, M., et al. 2010, AJ, 139, 1628, doi: 10.1088/0004-6256/139/4/1628
- Eastman et al. (2010) Eastman, J., Siverd, R., & Gaudi, B. S. 2010, Publications of the Astronomical Society of the Pacific, 122, 935, doi: 10.1086/655938
- Gaia Collaboration et al. (2016) Gaia Collaboration, Prusti, T., de Bruijne, J. H. J., et al. 2016, A&A, 595, A1, doi: 10.1051/0004-6361/201629272
- Gaia Collaboration et al. (2018) Gaia Collaboration, Brown, A. G. A., Vallenari, A., et al. 2018, A&A, 616, A1, doi: 10.1051/0004-6361/201833051
- Gaia Collaboration et al. (2022) Gaia Collaboration, Vallenari, A., Brown, A. G. A., et al. 2022, arXiv e-prints, arXiv:2208.00211. https://arxiv.org/abs/2208.00211
- Green et al. (2019) Green, G. M., Schlafly, E., Zucker, C., Speagle, J. S., & Finkbeiner, D. 2019, The Astrophysical Journal, 887, 93, doi: 10.3847/1538-4357/ab5362
- Hellier (1993) Hellier, C. 1993, MNRAS, 264, 132, doi: 10.1093/mnras/264.1.132
- Hoard et al. (2003) Hoard, D. W., Szkody, P., Froning, C. S., Long, K. S., & Knigge, C. 2003, AJ, 126, 2473, doi: 10.1086/378605
- Hoard et al. (2000) Hoard, D. W., Thorstensen, J. R., & Szkody, P. 2000, ApJ, 537, 936, doi: 10.1086/309074
- Hou et al. (2020) Hou, W., Luo, A. l., Li, Y.-B., & Qin, L. 2020, AJ, 159, 43, doi: 10.3847/1538-3881/ab5962
- Huang et al. (2020) Huang, C. X., Vanderburg, A., Pál, A., et al. 2020, Research Notes of the American Astronomical Society, 4, 204, doi: 10.3847/2515-5172/abca2e
- Huang et al. (2012) Huang, F., Li, J.-Z., Wang, X.-F., et al. 2012, Research in Astronomy and Astrophysics, 12, 1585, doi: 10.1088/1674-4527/12/11/012
- Iłkiewicz et al. (2021) Iłkiewicz, K., Scaringi, S., Court, J. M. C., et al. 2021, MNRAS, 503, 4050, doi: 10.1093/mnras/stab664
- King (1988) King, A. R. 1988, QJRAS, 29, 1
- Kochanek et al. (2017) Kochanek, C. S., Shappee, B. J., Stanek, K. Z., et al. 2017, PASP, 129, 104502, doi: 10.1088/1538-3873/aa80d9
- Kolb et al. (1998) Kolb, U., King, A. R., & Ritter, H. 1998, MNRAS, 298, L29, doi: 10.1046/j.1365-8711.1998.01854.x
- Lima et al. (2021) Lima, I. J., Rodrigues, C. V., Lopes, C. E. F., et al. 2021, The Astronomical Journal, 161, 225, doi: 10.3847/1538-3881/abeb16
- Lomb (1976) Lomb, N. R. 1976, Ap&SS, 39, 447, doi: 10.1007/BF00648343
- Lubow & Pringle (1993) Lubow, S. H., & Pringle, J. E. 1993, ApJ, 409, 360, doi: 10.1086/172669
- Margoni & Stagni (1984) Margoni, R., & Stagni, R. 1984, A&AS, 56, 87
- Osaki (1989) Osaki, Y. 1989, PASJ, 41, 1005
- Patterson (1979) Patterson, J. 1979, AJ, 84, 804, doi: 10.1086/112483
- Patterson (1995) —. 1995, PASP, 107, 657, doi: 10.1086/133605
- Patterson et al. (1993) Patterson, J., Halpern, J., & Shambrook, A. 1993, ApJ, 419, 803, doi: 10.1086/173532
- Patterson & Skillman (1994) Patterson, J., & Skillman, D. R. 1994, PASP, 106, 1141, doi: 10.1086/133491
- Patterson et al. (2002) Patterson, J., Fenton, W. H., Thorstensen, J. R., et al. 2002, PASP, 114, 1364, doi: 10.1086/344587
- Patterson et al. (2013) Patterson, J., Uthas, H., Kemp, J., et al. 2013, MNRAS, 434, 1902, doi: 10.1093/mnras/stt1085
- Ricker et al. (2014) Ricker, G. R., Winn, J. N., Vanderspek, R., et al. 2014, Journal of Astronomical Telescopes, Instruments, and Systems, 1, 1 , doi: 10.1117/1.JATIS.1.1.014003
- Scargle (1982) Scargle, J. D. 1982, ApJ, 263, 835, doi: 10.1086/160554
- Shafter et al. (1990) Shafter, A. W., Robinson, E. L., Crampton, D., Warner, B., & Prestage, R. M. 1990, ApJ, 354, 708, doi: 10.1086/168727
- Stefanov et al. (2022) Stefanov, S. Y., Latev, G., Boeva, S., & Moyseev, M. 2022, MNRAS, doi: 10.1093/mnras/stac2317
- Szkody et al. (2020) Szkody, P., Dicenzo, B., Ho, A. Y. Q., et al. 2020, AJ, 159, 198, doi: 10.3847/1538-3881/ab7cce
- Szkody et al. (2021) Szkody, P., Olde Loohuis, C., Koplitz, B., et al. 2021, AJ, 162, 94, doi: 10.3847/1538-3881/ac0efb
- Thorstensen (2020) Thorstensen, J. R. 2020, AJ, 160, 151, doi: 10.3847/1538-3881/aba7c7
- Udalski & Schwarzenberg-Czerny (1989) Udalski, A., & Schwarzenberg-Czerny, A. 1989, Acta Astron., 39, 125
- VanderPlas (2018) VanderPlas, J. T. 2018, ApJS, 236, 16, doi: 10.3847/1538-4365/aab766
- Wang et al. (1996) Wang, S.-G., Su, D.-Q., Chu, Y.-Q., Cui, X., & Wang, Y.-N. 1996, Appl. Opt., 35, 5155, doi: 10.1364/AO.35.005155
- Wang et al. (2008) Wang, X., Li, W., Filippenko, A. V., et al. 2008, The Astrophysical Journal, 675, 626, doi: 10.1086/526413
- Warner (1995) Warner, B. 1995, Cataclysmic Variable Stars, Cambridge Astrophysics (Cambridge University Press), doi: 10.1017/CBO9780511586491
- Wood et al. (2009) Wood, M. A., Thomas, D. M., & Simpson, J. C. 2009, MNRAS, 398, 2110, doi: 10.1111/j.1365-2966.2009.15252.x
- Woudt & Warner (2002) Woudt, P. A., & Warner, B. 2002, MNRAS, 333, 411, doi: 10.1046/j.1365-8711.2002.05415.x
- Wu et al. (2002) Wu, X., Li, Z., Ding, Y., Zhang, Z., & Li, Z. 2002, ApJ, 569, 418, doi: 10.1086/339278