Critical behavior in a chiral molecular model
Abstract
Understanding the condensed-phase behavior of chiral molecules is important in biology, as well as in a range of technological applications, such as the manufacture of pharmaceuticals. Here, we use molecular dynamics simulations to study a chiral four-site molecular model that exhibits a second-order symmetry-breaking phase transition from a supercritical racemic liquid, into subcritical D-rich and L-rich liquids. We determine the infinite-size critical temperature using the fourth-order Binder cumulant, and we show that the finite-size scaling behavior of the order parameter is compatible with the 3D Ising universality class. We also study the spontaneous D-rich to L-rich transition at a slightly subcritical temperature and our findings indicate that the free energy barrier for this transformation increases with system size as where is the number of molecules, consistent with a surface-dominated phenomenon. The critical behavior observed herein suggests a mechanism for chirality selection in which a liquid of chiral molecules spontaneously forms a phase enriched in one of the two enantiomers as the temperature is lowered below the critical point. Furthermore, the increasing free energy barrier with system size indicates that fluctuations between the L-rich and D-rich phases are suppressed as the size of the system increases, trapping it in one of the two enantiomerically-enriched phases. Such a process could provide the basis for an alternative explanation for the origin of biological homochirality. We also conjecture the possibility of observing nucleation at subcritical temperatures under the action of a suitable chiral external field.
I Introduction
Fundamental building blocks involved in the complex machinery of biological cells exist as a single enantiomer, one of the two possible isomers of a chiral molecule. For instance, naturally-occurring amino acids are left-handed while sugars are right-handedBlackmond (2010); Ball (2007). The emergence of this phenomenon, known as biological homochirality, remains incompletely understoodBlackmond (2010). Several theories have attempted to shed light on the origin of biological homochirality, including the explanation that an enantiomer may act as catalyst for its own formationFrank (1953); Blackmond (2004). Another theory proposes that chiral symmetry breaking can emerge from the equilibrium solid-liquid phase behavior of amino acids in solutionKlussmann et al. (2006a, b). It has also been suggested that parity violation could account for very small energy differences between enantiomers and thus give rise to a preferred chiralityQuack (2002). Biological homochirality is also of importance in the food, cosmetic, and pharmaceutical industries, as enantiomers can interact in dramatically different ways with receptors in the human bodySánchez et al. (2004).
Simulations can provide atomistic-level insight into the behavior of molecular systems, including chiral molecules in particular. Latinwo et al. Latinwo, Stillinger, and Debenedetti (2016) introduced a molecular model for a chiral tetramer suitable for molecular dynamics (MD) simulations. The model is able to switch between two chiral conformers and describe intermolecular interactions in the condensed phase. A key feature of this model is a chiral renormalization factor, which can be tailored to enhance homochiral or heterochiral short-range interactions. The thermodynamics of this model were recently investigated by Wang et al. Wang, Stillinger, and Debenedetti (2022), who showed that this model exhibits spontaneous symmetry breaking below a critical temperature when homochiral interactions are favored. At these conditions, two symmetry-equivalent phases can form: a D-rich liquid and an L-rich liquid. Spontaneous symmetry breaking in a liquid of chiral molecules has also been observed experimentally by Dressel et al.Dressel et al. (2014)
Here, we revisit the chiral tetramer model, and investigate its critical behavior and liquid-liquid transition. Our findings confirm the existence of a critical point in this model, and provide insight into the universality class it belongs to. We also study the kinetics of the liquid-liquid transition and suggest a scaling law for the free energy barrier with system size. Finally, we analyze the cluster size distribution during the liquid-liquid transformation in order to better understand the mechanism of this transition.
II Methods
II.1 Molecular Chiral Model
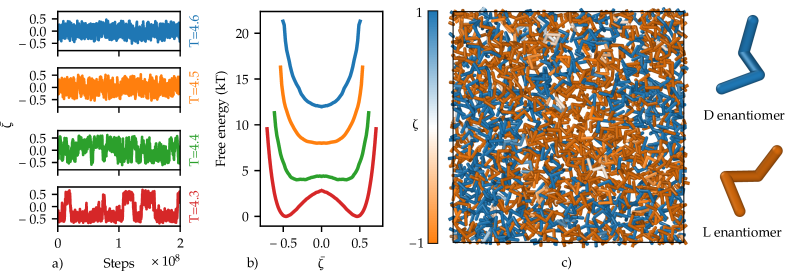
The model introduced by Latinwo et al. Latinwo, Stillinger, and Debenedetti (2016) considers four-bead tetramers able to switch between two chiral conformations (see FIG. 1c). The potential energy within this model is:
| (1) |
where and are intra- and inter-molecular interactions, respectively, and are the atomic coordinates. The intramolecular interactions in a system of molecules are given by:
| (2) |
where is the position of bead () of the -th molecule, with are the two bond angles in the -th molecule, and is the dihedral angle of the -th molecule. The strength of the intramolecular interactions is controlled by the force constants , , and for the bond length, angle, and dihedral. The equilibrium molecular geometry is given by the bond length , the angles , and the dihedral . The two chiral molecular conformers are characterized by dihedral angles and .
The intermolecular interactions in this model are given by:
| (3) |
where indices and refer to molecules, and and to the four beads in each molecule. is the smooth force variantToxvaerd and Dyre (2011) of the Lennard-Jones potential, i.e.:
| (4) |
where is the standard Lennard-Jones potential, is the cutoff for the potential, and is the first derivative of with respect to . A key feature in this model is the chiral renormalization factor , which controls the strength of the intermolecular interactions, and depends on the chiral state of molecules and defined through vectors and that contain the coordinates of the four sites of the -th and -th molecules, respectively. The functional form of the renormalization factor is:
| (5) |
where represents the chirality of each molecule. The behavior of the model can be tuned via the parameter which introduces a preference for homochiral intermolecular interactions if it is positive, and heterochiral interactions if it is negative. For the four-site model considered here, the chirality of each molecule can be calculated as:
| (6) |
where . With the definition in Eq. (6), for D enantiomers and for L enantiomers. We note that the mathematical definition of in Eq. (6) captures the essence of chirality, i.e., is by construction a pseudo-scalar and thus changes sign under a parity transformation (reflection with respect to a plane).
II.2 Molecular Dynamics Simulations
We performed all simulations using the MD engine LAMMPSPlimpton (1995) (version February 1, 2014) and an implementation of the potential energy of the chiral model based on ref. 14. The intermolecular term of the potential energy, , gives rise to an eight-body force involving all four sites of pairs of tetramer molecules. This force was calculated as described by Petsev et al.Petsev, Stillinger, and Debenedetti (2021b)
We carried out the simulations in the canonical ensemble with density 0.11 molecules. We controlled the temperature constant using a Nosé-Hoover thermostatNosé (1984); Hoover (1985) and we employed a time step of (reduced units are used unless otherwise specified). The parameters of the chiral molecular model were , , , , , , , and the mass of the tetramer beads was set to . Following ref. 10 we chose in order to favor homochiral interactions. We rebuilt neighbor listsFrenkel and Smit (2001) every 10 steps with cutoff and we used a neighbor-list skin of . For this thin neighbor-list skin, we observed a small drift of the total energy in NVE simulations over long simulation times. To avoid artifacts, we used a neighbor-list skin of for simulations longer than steps. We recommend a neighbor-list skin of for future simulations.
II.3 Clustering
We performed clustering using a distance-based criterion wherein two beads are considered to be adjacent if 1) their distance is below and 2) they have the same chirality (both molecules satisfy or ). Based on this adjacency criterion we subsequently find the connected components (clusters) using the analysis software Freud 2.8.0.Ramasubramani et al. (2020) Since the equilibrium distance between beads within a molecule is around , we can calculate the number of connected molecules within a cluster as the total number of connected beads divided by the number of beads in a molecule, i.e., four. This algorithm could fail to recognize that two beads in a molecule are connected if their distance were greater than 1.5. However, this event has negligible probability and was not observed in our simulations. An alternative clustering strategy could have employed the centers of mass of the tetramers.
III Results
III.1 Critical behavior
We first investigate the behavior of the model at constant density and varying temperature, for a system of 1000 tetramer molecules. In FIG. 1a we show the mean chirality, defined as , as a function of the simulation steps for temperatures equal to 4.3, 4.4, 4.5, and 4.6. The mean chirality is a natural order parameter for this model. At and , fluctuates around 0, indicating the presence of a racemic mixture at these conditions. If the temperature is lowered to , fluctuations in increase significantly and span a relatively large range . At an even lower temperature , shows clear bistable behavior and alternates between a D-rich phase and a L-rich phase.
In order to provide further insight into this behavior, we calculate the free energy as a function of which we define as where is the probability of observing a given value of and is the Boltzmann constant. is shown in FIG. 1b for the four temperatures described above. As expected, for the free energy profiles show a single minimum centered at . At the free energy profile is relatively flat and starts to develop two minima. Finally, at the symmetry breaking becomes evident and shows two symmetric, well-defined minima. Overall, the results are characteristic of a second-order, symmetry-breaking phase transition with a critical point slightly above . As a result of the symmetry breaking, below the critical point enantiomers can be classified as minority and majority enantiomers, depending on which of the two enantiomers is predominant. In FIG. 1c, we show a snapshot of a configuration at supercritical temperature that corresponds to a racemic mixture.
III.2 Infinite-size critical temperature and finite-size scaling
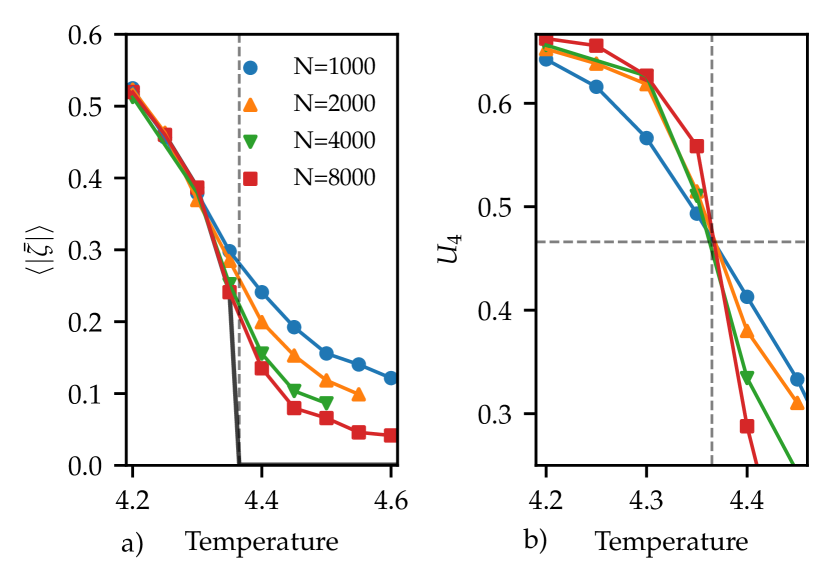
The results described above correspond to a system of 1000 molecules. Thus, they can be affected by finite-size effects. For this reason, we also studied systems of 2000, 4000, and 8000 molecules. In FIG. 2a, we show the ensemble average of (denoted by ) as a function of temperature, for different system sizes. vanishes at high temperatures and takes on a finite value at low temperatures. As expected for a second order phase transition, the crossover from the high-temperature to the low-temperature phase is smoother for smaller system sizes. The critical temperature in the thermodynamic limit can be estimated from finite system simulations using the fourth-order Binder cumulant Binder (1981):
| (7) |
which has a fixed point at the infinite-size critical temperature for any system size. In FIG. 2b we show vs temperature for different system sizes. The critical temperature can be determined by the fixed point at which these curves cross each other. From this analysis we determine that in the thermodynamic limit. Furthermore, at the fixed point () depends only on the universality class. Here, we found which is in good agreement with the value for the 3D Ising universality class Ferrenberg, Xu, and Landau (2018).
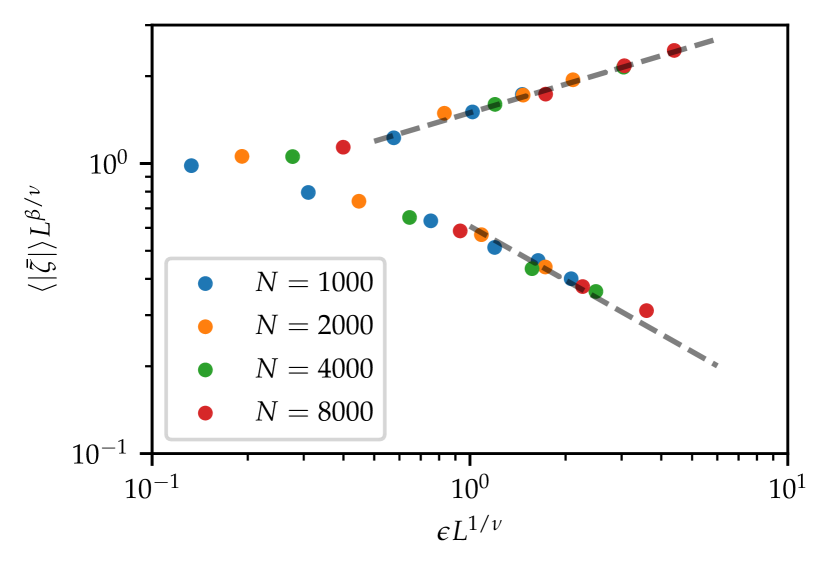
We also study the finite-size scaling of the order parameter in order to provide further evidence of this system’s universality class. The order parameter in a second order phase transition follows the following finite-size scalingLandau and Binder (2021):
| (8) |
where is the order parameter, is the simulation box side, and are critical exponents, is a universal function, and . We thus plot vs. using our simulation data at different temperatures and system sizes. We choose the exponents and of the 3D Ising universality classEl-Showk et al. (2014). Our results, depicted in FIG. 3, show that data for all system sizes follow the universal behavior predicted by the finite-size scaling hypothesis in Eq. (8). These results lend strong support to the hypothesis that the chiral tetramer system belongs to the 3D Ising universality class, since other choices of exponents and do not lead to correct finite-size scaling.
The dashed lines in FIG. 3 illustrate the power law behavior of at temperatures well above and well below the critical temperature. In the low-temperature regime, is constant with system size and with . Thus, the slope of the upper branch of the curve in FIG. 3 is . On the other hand, in the high-temperature regime and . Therefore, is the slope of the lower branch of the curve in FIG. 3. The data in FIG. 3 indeed supports the slopes derived above. We note that the slopes for the power law behavior were obtained for as a function of , while in FIG. 3 we plot vs. (instead of ). This approximation is valid if which is satisfied by our data for a sufficiently large .
III.3 Kinetics of the liquid-liquid interconversion
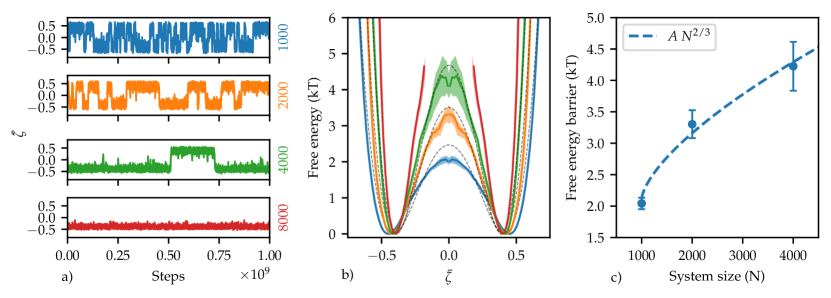
We now analyze the kinetics of the transition between the -rich and the -rich phase at subcritical temperature . In FIG. 4a we show as a function of the simulation steps for different system sizes. The results clearly indicate that the interconversion between these phases becomes more infrequent for larger systems. We also calculated the free energies as a function of the order parameter and we show them in FIG. 4b. The free energy near is not well resolved for the largest system () due to poor sampling. The free energies in FIG. 4b can be fit to a Landau modelLandau and Lifshitz (1980):
| (9) |
where and have to be determined. The Landau model fits the simulation results well (see FIG. 4b), and the parameters , , and determined for each system size are shown in Table 1.
| 1000 | 467(14) | 79(1) | 4.36(1) |
|---|---|---|---|
| 2000 | 704(26) | 135(3) | 4.36(1) |
| 4000 | 1010(10) | 209(9) | 4.36(1) |
The results in FIG. 4b clearly show that the free energy barrier for the transition becomes progressively larger as a function of system size. The free energy barriers are plotted in FIG. 4c, and appear to scale with system size as , compatible with a surface-dominated phenomenon. The same scaling () is well-known for the Ising modelChandler (1987). Note also that the barrier diverges in the thermodynamic limit, signaling ergodicity breaking, and thus liquid-liquid interconversion is a finite-size effect. The interconversion time increasing with system size can be understood by noting that when transitioning from an L-rich to a D-rich phase (or viceversa), the system must necessarily traverse the condition . This corresponds to the maximum possible number of energetically unfavorable heterochiral contacts (), and one expects this effective barrier to scale as . This is consistent with the behavior shown in FIG. 4c.
III.4 Nucleation
The dependence of the interconversion rate with system size shown in FIG. 4a is, of course, at odds with the predictions of nucleation theory. The nucleation rate is defined as where is the average time to form a critical cluster in a volume . Within classical nucleation theory, the rate is:
| (10) |
where is a microscopic barrier, independent of system size. Thus, in nucleation phenomena one expects to observe a faster transition (smaller ) as the size of the system increases, while in FIG. 4a we observe the opposite trend.
The absence of nucleation in the D-rich to L-rich phase transformation is not surprising. The driving force for nucleation is the difference in chemical potential between the mother phase and the new phase. In this case, the D-rich phase and the L-rich phase have the same chemical potential and thus there is no driving force for nucleation. The equality of the chemical potentials follows from the fact that the energy in this model is invariant under a parity transformation. Thus, it is impossible to trigger a phase transformation between the D-rich and the L-rich liquids through thermodynamic means, i.e., via changes in temperature and pressure. One may speculate that in a realistic chiral molecule, parity violation could lead to . However, the difference in chemical potential would likely be too small to promote nucleation.
The behavior described above for the chiral molecular model is similar to that of the Ising model in the absence of an external fieldLandau and Binder (2021). In analogy to the Ising model, we conjecture that one may introduce an external field that couples to the order parameter . The potential energy in the presence of an external field can be written as:
| (11) |
where is defined in Eq. (1), and is a scalar field. The added term is chiral (a pseudoscalar) and thus creates a chemical potential imbalance for . If a suitable chiral external field can be devised, it should be possible to trigger the spontaneous transformation between the D-rich and the L-rich liquids. Furthermore, we expect the transformation to proceed through nucleation and growth.
III.5 Phase diagram at constant volume and number of molecules
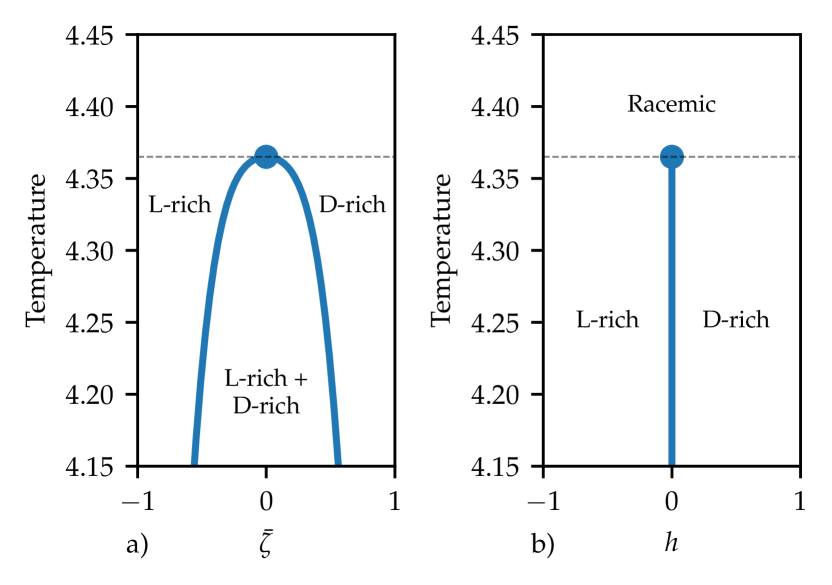
The second term in the right-hand side of Eq. (11) identifies and as thermodynamic conjugate variables. The total chirality is the extensive variable, in analogy to the volume , the number of particles , or the magnetization , and the field is the intensive variable, in analogy to the pressure , the chemical potential , or an external magnetic field . We can thus construct phase diagrams for this model while keeping either or constant. The phase diagram in the plane is shown in FIG. 5a and the phase diagram in the plane is shown in FIG. 5b. In both phase diagrams we consider that the volume and number of molecules is constant. The phase diagram in FIG. 5a contains a miscibility gap between the D-rich and the L-rich liquids. It thus strongly resembles the phase diagram of an immiscible mixture (such as oil and water) in the composition- plane, or the phase diagram of a liquid-gas transition in the plane. On the other hand, the phase diagram in FIG. 5b exhibits a line of D-rich/L-rich coexistence that ends in a critical point. The phase diagram is therefore reminiscent of the phase diagram of the liquid-gas transition in the plane, or the phase diagram of the Ising model in the plane.
The simulations reported here correspond to the condition of constant field and is allowed to change freely ( ensemble). The phase diagram for this condition is given by FIG. 5b. We note that we did not simulate the condition of constant represented in the phase diagram in FIG. 5a. It would be possible to simulate this system at constant ( ensemble) by increasing the force constant for the dihedral term in Eq. (2) in order to hinder the interconversion between the L and D enantiomers. The absence of interconversion (constant ) would lead to a phase behavior consistent with FIG. 5a.
We stress that there is a fundamental difference between the fixed-composition binary mixture and the chiral system simulated in this work. In a fixed-composition binary mixture the system phase-separates and an interface forms between coexisting phases. In the present chiral system, the composition is not fixed, since each molecule can freely change its chirality. Thus, below the critical temperature the system avoids the formation of an energetically costly interface () and stochastically forms either the L-rich or the D-rich mixture, with equal probabilities, and in equilibrium in the thermodynamic limit it does not form coexisting phases.
III.6 Transformation mechanism and structure of the subcritical phases
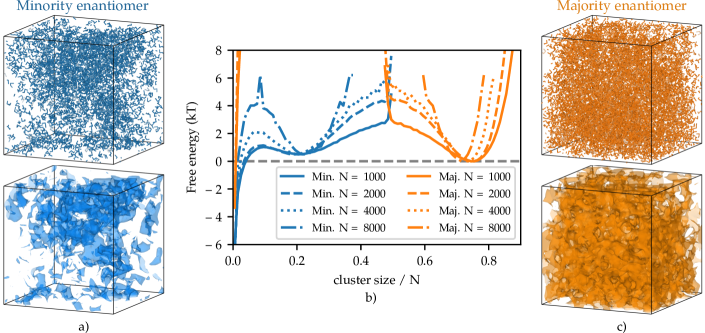
We now turn to characterize the atomistic-level structure of the broken-symmetry, subcritical phases. Considering that our model favors homochiral interactions, we expect to see clusters of molecules of the same chirality. For this reason, we calculate the cluster-size distribution of clusters of L-type molecules and of D-type molecules (see section II.3 for further details). Due to symmetry considerations, we have combined clustering results of D and L enantiomers. For visualization purposes we convert the cluster-size distribution to a free energy .
The free energy vs. cluster size is shown in FIG. 6b at and for different systems sizes. The results are separated in clusters of the majority enantiomer (molecules with when , or molecules with when ) and clusters of the minority enantiomer (molecules with when , or molecules with when ). The free energy curves have three minima that correspond to 1) a cluster of the majority enantiomer of size , 2) a cluster of the minority enantiomer of size , and 3) small clusters with mainly from the minority enantiomer. In order to visualize these three cluster populations, we show in FIG. 6a and c snapshots of an equilibrium configuration for a system of 8000 molecules in the L-rich phase at . In FIG. 6a only molecules with are shown, which correspond to clusters of the minority D enantiomer in the L-rich phase. We observe a cluster of intermediate size, and several smaller clusters, that correspond to the minima at and , respectively. On the other hand, in FIG. 6c only molecules with are shown, which correspond to clusters of the majority L enantiomer in the L-rich phase. Here, we observe a large cluster of the majority enantiomer that matches the minimum at in the free energy vs. cluster size curve. We also note that the cluster-size distribution is system size dependent, at variance with nucleation phenomena wherein the cluster-size distribution is independent of system sizeMaibaum (2008); Piaggi, Valsson, and Parrinello (2016).
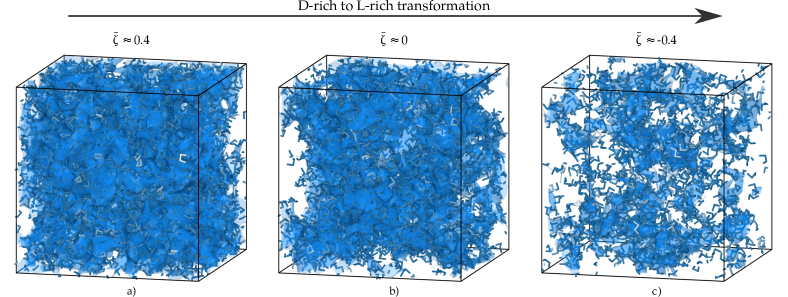
So far, we have focused on the equilibrium configuration of the system. We now turn to analyze the transition between the D-rich and L-rich phase in a system of at . In FIG. 7 we show three snapshots along the spontaneous D-rich to L-rich transformation. FIG. 7a depicts the majority enantiomer (D) in the D-rich phase with . In FIG. 7b we show the D enantiomer at the transition state . The transition state can be associated with the most infrequent cluster in the cluster size distribution in FIG. 6b. Indeed, the snapshot of the transition state in FIG. 7b shows a cluster of size . Due to symmetry considerations, we expect that the transition state is characterized by a cluster of D with and a cluster of L with . Further analysis also shows that the two clusters with coexist with small clusters of size , probably arising from thermal fluctuations. The fact that enantiomers form clusters of size at the transition state indicates that the free energy is surface dominated, and lends further credence to our previous finding that the free energy barrier scales like . Lastly, in FIG. 7c we show the minority enantiomer (D) in the L-rich phase, which is the end state of the transformation.
IV Conclusions
Our simulations confirm the existence of a second-order symmetry-breaking phase transition in the chiral tetramer model proposed by Latinwo et al.Latinwo, Stillinger, and Debenedetti (2016) and Petsev et al.Petsev, Stillinger, and Debenedetti (2021b) We also show that the critical behavior in this system is compatible with the 3D Ising universality class. Thus, a similar behavior can be expected in real chiral molecules regardless of the details of the intermolecular interactions. This symmetry-breaking transition could provide an alternative explanation for the origin of biological homochirality.
Furthermore, our findings indicate that at a slightly subcritical temperature the free energy barrier for the interconversion between the subcritical D-rich and L-rich liquids increases with system size. Our data supports a surface-dominated scaling law where is the number of molecules. Also, the increase in free energy barrier with size implies that once a liquid with strong homochiral interactions is sufficiently large, fluctuations between the L-rich and D-rich phases are suppressed. The system can thus remain in a liquid state highly-enriched in one of the two enantiomers. Our analysis also shows that in this system there is no driving force for nucleation a result of the equal chemical potentials of the subcritical phases. We conjecture that nucleation may be triggered through an appropriate chiral external field that creates a chemical potential imbalance.
Finally, we analyze the molecular structure of the subcritical liquids at temperature using the cluster-size distribution for the majority and minority enantiomers. We find that the majority enantiomer forms a relatively large cluster of size . The minority enantiomer forms a cluster of size and smaller clusters of size . In the transformation from the L-rich to the D-rich phase, the transition state is characterized by clusters of size for both enantiomers. The observation of large single clusters for each enantiomer supports the surface-dominated scaling law for .
Future work could deal with the calculation of free energy barriers with greater precision in order to provide stronger evidence of the dependence of the free energy barrier with system size. Enhanced sampling methods, such as umbrella samplingTorrie and Valleau (1977), could be useful to obtain accurate predictions for free energy barriers. Furthermore, employing more realistic models for the intermolecular interactions could improve our understanding of the relevance of symmetry breaking and liquid-liquid interconversion in real chiral molecules. Finally, it would be interesting to evaluate critical exponents near the confluence of liquid-liquid and liquid-gas critical points (see ref. 10 for a discussion about this phenomenon).
Acknowledgements.
The authors thank Nikolai Petsev and Yiming Wang for assistance in the use of the chiral model implementation and in setting up the simulations. This work was conducted within the center Chemistry in Solution and at Interfaces funded by the USA Department of Energy under Award DE-SC0019394. Simulations reported here were performed using the Princeton Research Computing resources at Princeton University which is consortium of groups including the Princeton Institute for Computational Science and Engineering and the Princeton University Office of Information Technology’s Research Computing department.Data Availability Statement
The data that support the findings of this study are openly available in Princeton University DataSpace at https://doi.org/10.34770/aby7-r955.
Author Declarations
Conflict of Interest
The authors have no conflicts to disclose.
Author Contributions
Pablo M. Piaggi: Investigation (lead); Writing – original draft (lead); Conceptualization (equal); Data curation (lead); Writing – review & editing (equal). Roberto Car: Conceptualization (supporting); Supervision (equal); Writing – review & editing (equal). Frank H. Stillinger: Conceptualization (equal); Supervision (supporting); Writing – review & editing (equal). Pablo G. Debenedetti: Conceptualization (lead); Supervision (lead); Writing – review & editing (equal).
References
References
- Blackmond (2010) D. G. Blackmond, “The origin of biological homochirality,” Cold Spring Harbor Perspectives in Biology 2, a002147 (2010).
- Ball (2007) P. Ball, “Giving life a hand,” Chemistry World 4, 30–31 (2007).
- Frank (1953) F. C. Frank, “On spontaneous asymmetric synthesis,” Biochimica et biophysica acta 11, 459–463 (1953).
- Blackmond (2004) D. G. Blackmond, “Asymmetric autocatalysis and its implications for the origin of homochirality,” Proceedings of the National Academy of Sciences 101, 5732–5736 (2004).
- Klussmann et al. (2006a) M. Klussmann, H. Iwamura, S. P. Mathew, D. H. Wells, U. Pandya, A. Armstrong, and D. G. Blackmond, “Thermodynamic control of asymmetric amplification in amino acid catalysis,” Nature 441, 621–623 (2006a).
- Klussmann et al. (2006b) M. Klussmann, A. J. White, A. Armstrong, and D. G. Blackmond, “Rationalization and prediction of solution enantiomeric excess in ternary phase systems,” Angewandte Chemie International Edition 45, 7985–7989 (2006b).
- Quack (2002) M. Quack, “How important is parity violation for molecular and biomolecular chirality?” Angewandte Chemie International Edition 41, 4618–4630 (2002).
- Sánchez et al. (2004) C. Sánchez, K. P. Bøgesø, B. Ebert, E. H. Reines, and C. Braestrup, “Escitalopram versus citalopram: the surprising role of the R-enantiomer,” Psychopharmacology 174, 163–176 (2004).
- Latinwo, Stillinger, and Debenedetti (2016) F. Latinwo, F. H. Stillinger, and P. G. Debenedetti, “Molecular model for chirality phenomena,” The Journal of Chemical Physics 145, 154503 (2016).
- Wang, Stillinger, and Debenedetti (2022) Y. Wang, F. H. Stillinger, and P. G. Debenedetti, “Fluid–fluid phase transitions in a chiral molecular model,” The Journal of Chemical Physics 157, 084501 (2022).
- Dressel et al. (2014) C. Dressel, T. Reppe, M. Prehm, M. Brautzsch, and C. Tschierske, “Chiral self-sorting and amplification in isotropic liquids of achiral molecules,” Nature chemistry 6, 971–977 (2014).
- Toxvaerd and Dyre (2011) S. Toxvaerd and J. C. Dyre, “Communication: Shifted forces in molecular dynamics,” The Journal of Chemical Physics 134, 081102 (2011).
- Plimpton (1995) S. Plimpton, “Fast parallel algorithms for short-range molecular dynamics,” Journal of computational physics 117, 1–19 (1995).
- Petsev, Stillinger, and Debenedetti (2021a) N. D. Petsev, F. H. Stillinger, and P. G. Debenedetti, “Chiral tetramer molecular model,” Princeton DataSpace Repository (2021a), URL: https://doi.org/10.34770/ybs9-5t93.
- Petsev, Stillinger, and Debenedetti (2021b) N. D. Petsev, F. H. Stillinger, and P. G. Debenedetti, “Effect of configuration-dependent multi-body forces on interconversion kinetics of a chiral tetramer model,” The Journal of Chemical Physics 155, 084105 (2021b).
- Nosé (1984) S. Nosé, “A unified formulation of the constant temperature molecular dynamics methods,” The Journal of chemical physics 81, 511–519 (1984).
- Hoover (1985) W. G. Hoover, “Canonical dynamics: Equilibrium phase-space distributions,” Physical review A 31, 1695 (1985).
- Frenkel and Smit (2001) D. Frenkel and B. Smit, Understanding molecular simulation: from algorithms to applications, Vol. 1 (Academic press, 2001).
- Ramasubramani et al. (2020) V. Ramasubramani, B. D. Dice, E. S. Harper, M. P. Spellings, J. A. Anderson, and S. C. Glotzer, “freud: A software suite for high throughput analysis of particle simulation data,” Comput. Phys. Commun. 254, 107275 (2020).
- Binder (1981) K. Binder, “Finite size scaling analysis of Ising model block distribution functions,” Zeitschrift für Physik B Condensed Matter 43, 119–140 (1981).
- Ferrenberg, Xu, and Landau (2018) A. M. Ferrenberg, J. Xu, and D. P. Landau, “Pushing the limits of Monte Carlo simulations for the three-dimensional Ising model,” Physical Review E 97, 043301 (2018).
- Landau and Binder (2021) D. Landau and K. Binder, A guide to Monte Carlo simulations in statistical physics (Cambridge university press, 2021).
- El-Showk et al. (2014) S. El-Showk, M. F. Paulos, D. Poland, S. Rychkov, D. Simmons-Duffin, and A. Vichi, “Solving the 3d Ising model with the conformal bootstrap ii. c-minimization and precise critical exponents,” Journal of Statistical Physics 157, 869–914 (2014).
- Landau and Lifshitz (1980) L. D. Landau and E. Lifshitz, Statistical physics, part I (pergamon, Oxford, 1980).
- Chandler (1987) D. Chandler, “Introduction to modern statistical,” Mechanics. Oxford University Press, Oxford, UK 5, 449 (1987).
- Stukowski (2009) A. Stukowski, “Visualization and analysis of atomistic simulation data with OVITO–the open visualization tool,” Modelling and simulation in materials science and engineering 18, 015012 (2009).
- Stukowski (2014) A. Stukowski, “Computational analysis methods in atomistic modeling of crystals,” JOM 66, 399–407 (2014).
- Maibaum (2008) L. Maibaum, “Comment on “Elucidating the mechanism of nucleation near the gas-liquid spinodal”,” Physical review letters 101, 019601 (2008).
- Piaggi, Valsson, and Parrinello (2016) P. M. Piaggi, O. Valsson, and M. Parrinello, “A variational approach to nucleation simulation,” Faraday discussions 195, 557–568 (2016).
- Torrie and Valleau (1977) G. M. Torrie and J. P. Valleau, “Nonphysical sampling distributions in Monte Carlo free-energy estimation: Umbrella sampling,” Journal of Computational Physics 23, 187–199 (1977).