Characterizing the effect of retractions on scientific careers
Abstract
Retracting academic papers is a fundamental tool of quality control when the validity of papers or the integrity of authors is questioned post-publication. While retractions do not eliminate papers from the record, they have far-reaching consequences for retracted authors and their careers, serving as a visible and permanent signal of potential transgressions. Previous studies have highlighted the adverse effects of retractions on citation counts and coauthors’ citations; however, the broader impacts beyond these have not been fully explored. We address this gap leveraging Retraction Watch, the most extensive data set on retractions and link it to Microsoft Academic Graph, a comprehensive data set of scientific publications and their citation networks, and Altmetric that monitors online attention to scientific output. Our investigation focuses on: 1) the likelihood of authors exiting scientific publishing following a retraction, and 2) the evolution of collaboration networks among authors who continue publishing after a retraction. Our empirical analysis reveals that retracted authors, particularly those with less experience, tend to leave scientific publishing in the aftermath of retraction, particularly if their retractions attract widespread attention. We also uncover that retracted authors who remain active in publishing maintain and establish more collaborations compared to their similar non-retracted counterparts. Nevertheless, retracted authors with less than a decade of publishing experience retain less senior, less productive and less impactful coauthors, and gain less senior coauthors post-retraction. Taken together, notwithstanding the indispensable role of retractions in upholding the integrity of the academic community, our findings shed light on the disproportionate impact that retractions impose on early-career authors.
Introduction
Reputation is a crucial factor in building status, particularly when quality is uncertain or unobservable [1], and when it is produced through highly technical and complex processes. This characterizes creative fields, medicine and science alike. Therefore, when a scientist’s reputation is challenged, the consequences can be severe [2, 3, 4, 5], with long-lasting effects on their career outcomes. The credibility of a scientist, a crucial currency of their reputation, is established over the course of their career based on the quality of their publications [6] among other factors. Therefore, when the quality of one’s work is called into question, the stakes are high, and the consequences can be more significant than the outcome of a single project. While positive signals, such as citations and grants, have been linked to reputation-building [7, 6], little is understood about the relationship between a scientist’s challenged reputation and their career progression in future collaborations. Further research is needed to fully comprehend the impact of such challenges on scientific collaborations and career trajectories. Retractions of scientific papers gives us a window through which to study this question.
When the integrity of a scientific paper is disputed, editors and authors may choose to remove the work from the canon either together or in isolation. While the article may still be accessible, it will be accompanied by a retraction notice that explains the reason(s) behind its removal, such as misconduct, plagiarism, mistake or other considerations. This creates a clear and visible signal associated with the authors of the paper that the quality of their work has come under scrutiny. Retractions have been used for this purpose since 1756 [8], and contemporary journals have formal procedures to execute when the authors or readers highlight problematic content.
Prior work investigates the impact of retractions on scientific careers, examining productivity [3], citations for retracted papers [4], citations for papers published prior to retraction [2], and post-retraction citations of pre-retraction collaborators [5], generally finding negative effects. However, some work also demonstrates that these effects are heterogeneous and might vary based on the reason for retraction, and/or the prominence of the retracted author [2, 9, 4]. While recent research is breaking new ground on the quantitative analysis of the impact of retractions, it often focuses on specific fields, or compares different retracted authors to one another (e.g., those who have experienced a single versus multiple retractions). Therefore, a comprehensive analysis of retractions across fields and over time has yet to be undertaken where retracted authors are compared to otherwise similar non-retracted authors. Beyond documenting the impact of retraction on careers, it is essential to examine the mechanisms that might bring these effects about. Therefore, we focus both on the continuity of post-retraction careers, as well as the development of the collaboration network of retracted authors that is needed to succeed in publishing careers [10, 11, 12].
Retractions can attract significant attention, particularly when they expose egregious misconduct. Such instances not only question the authors’ reputation, but also the public’s trust in science, scientific findings, and institutions of science, such as universities, internal review boards, journals, and the peer-review process. Some retractions, therefore, cast a long shadow that extends far beyond the scrutinized work. For instance, the retraction of a study on political persuasion and gay marriage in Science in 2015 [13], which was likely based on fabricated data, led to questions about the impartiality of reviewers111https://www.newyorker.com/science/maria-konnikova/how-a-gay-marriage-study-went-wrong, Accessed: 12/20/2022. Similarly, when a paper in Nature was retracted due to falsified images [14], criticism went beyond concerning the conduct of the first author, and extended to the male-dominated Japanese academy and its culture of fierce pressure and competition222https://www.nytimes.com/2014/07/07/world/asia/academic-scandal-shakes-japan.html, Accessed: 12/20/2022. In both cases, the first authors left scientific publishing careers after receiving extreme levels of attention (Altmetric scores above 1000). How systematic the impact of such attention, however, is yet to be fully understood. This question, of course, is tied closely to how retracted scientists might rebuild their collaboration network, as future collaborators may or may not learn about past events depending on the level of attention those received.
The value in social relationships, and the theory that resources encapsulated in them may be leveraged is longstanding [15]. The assumption, specifically that larger collaboration networks are beneficial, is rooted in prior work that documents the benefits of research collaborations, and that of larger collaboration networks. Qualitative evidence suggests that researchers collaborate for both instrumental and strategic reasons, such as access to specialized expertise, equipment and other resources, visibility for professional advancement, and enhanced research productivity, as well as emotional reasons, since many regard collaborative work as energizing and fun [16]. These self-reports are reflected in empirical evidence, such as the association between the size of collaboration networks and citations [17], in addition to future productivity [18, 19]. Importantly, Ductor and colleagues suggest that the quality of one’s coauthor network signals important information about researchers’ quality, and that these signals are crucial to assess one’s research potential especially at the beginning of the career [19]. Additionally, prior work reveals that coauthor networks show higher levels of triadic closure than expected by chance, that is, authors of scientific papers tend to work with former coauthors of their coauthors in the future [20, 21]. Such regularity is based on similarity, but also on strategic considerations, where a scientist brokers relationships among their unconnected coauthors, thereby communicating information about the qualities of those they connect that are challenging to observe [22], such as their skill or integrity in the context of scientific publishing. Extending these arguments to authors who experience a retraction, the collaboration networks they maintain, or build could be crucial to recover from a negative signal about the quality of their work, and some processes, such as triadic closure might help them in particular to do so.
Drawing on retractions as a (potentially stigmatizing) signal that challenges authors’ reputations, we offer four key empirical observations. First, we find that the extent of attention received by a retraction is positively associated with the likelihood of retracted authors leaving publishing careers. That is, the more public the retraction, the more profound its consequences appear to be for authors’ careers. This finding is especially significant since most attention received by papers extends beyond the content of the science, and involves discussions of great societal importance about the context within which scientific findings are produced. Second, perhaps counterintuitively, we demonstrate that conditional on staying in scientific publishing, retracted authors retain and gain more collaborators compared to otherwise similar authors without retractions. Third, while these larger collaboration networks may benefit retracted authors, retracted authors with less than a decade of publishing experience build qualitatively different, and weaker networks compared to their similar counterparts in terms of their collaborators seniority, productivity and impact post-retraction. Fourth, retractions prompted by misconduct have much more severe consequences for the quality of coauthor networks post-retraction when compared to a retraction resulting from a mistake.
Results
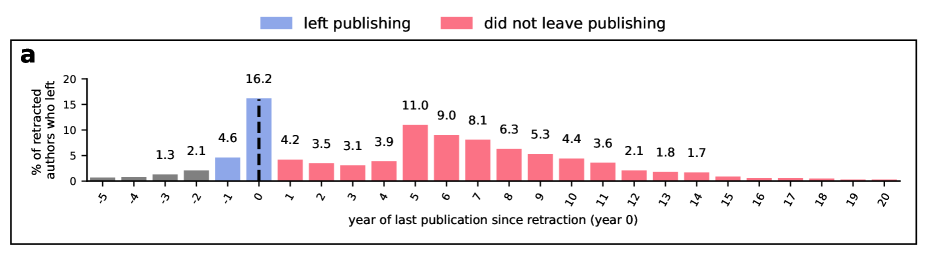
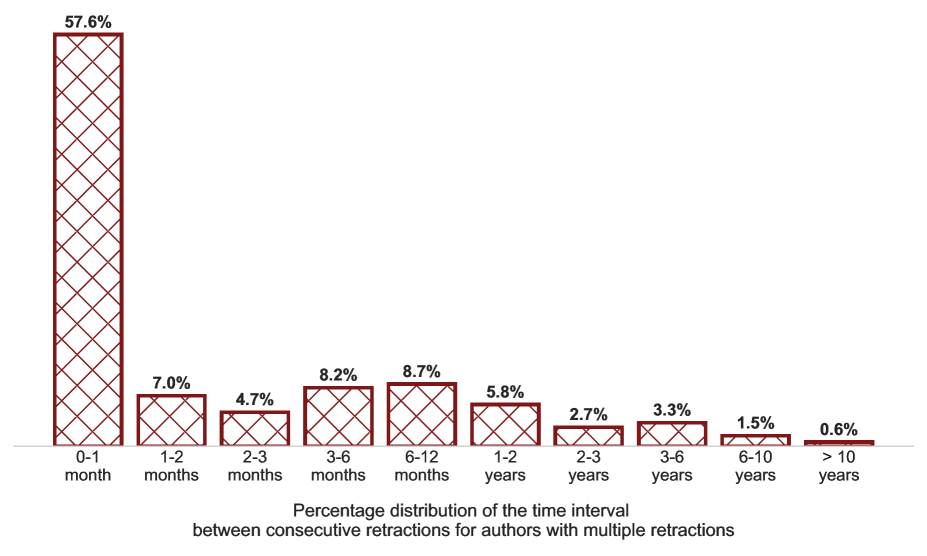
The consequences of retractions on authors’ careers can be severe, resulting in them leaving scientific publishing entirely. In this context, studying the timing of authors’ last publications after their papers have been retracted can provide valuable insights. To generate these insights, we analyze two main data sets: Retraction Watch (RW) [23], the most extensive publicly available database of retracted papers with over 26,000 publications in around 5,800 venues, and Microsoft Academic Graph (MAG) [24, 25], which provides comprehensive records and citation networks for over 263 million scientific publications and collaboration networks for over 271 million scientists. By merging MAG and RW, we identify over 23,000 retracted papers involving almost 73,000 authors (see “Merging RW and MAG” section in Materials and Methods for more information). Linking these two data sets gives us an opportunity to describe who are retracted scientists, and what do their pre-retraction careers look like. We exclude bulk retractions (e.g., when all papers are retracted from a conference proceeding as a result of questionable peer-review [26]), as well as authors with multiple retractions that usually cluster in time (see Supplementary Figure S1). Full details of our pre-processing steps and justifications can be found in Supplementary Note S1. Our final “filtered sample” consists of 4,672 retracted papers, and 15,614 authors.
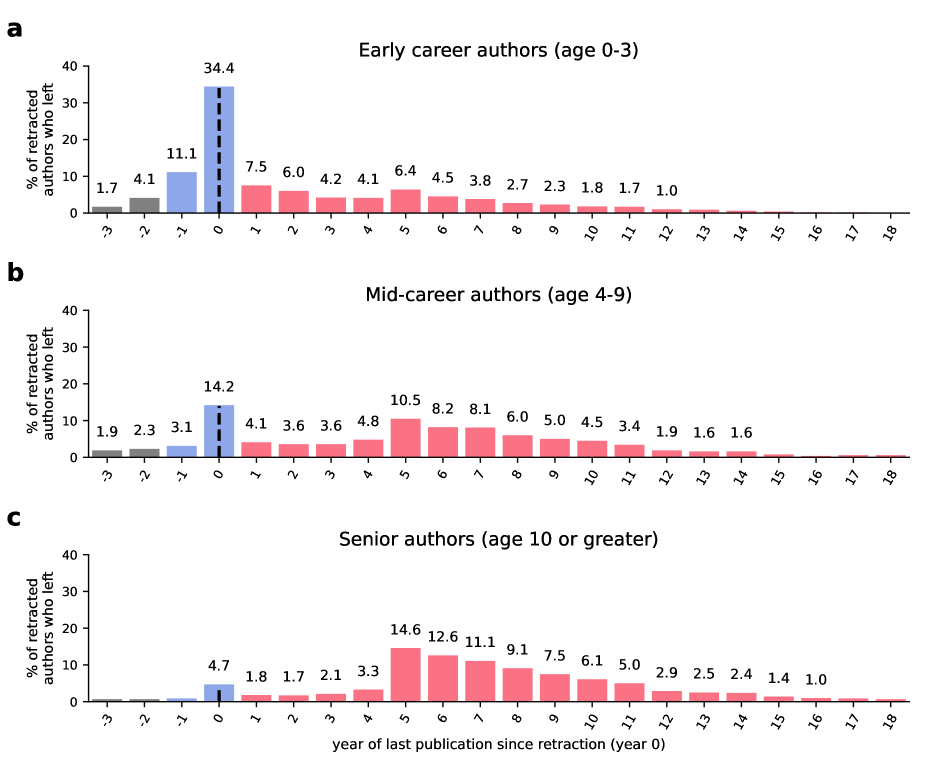
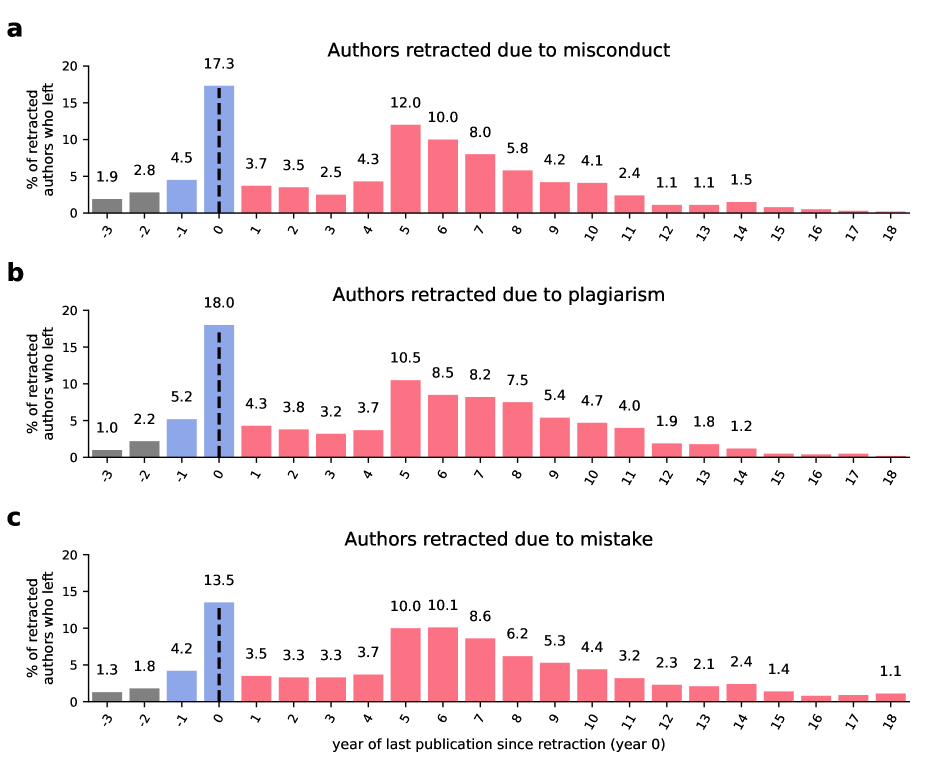
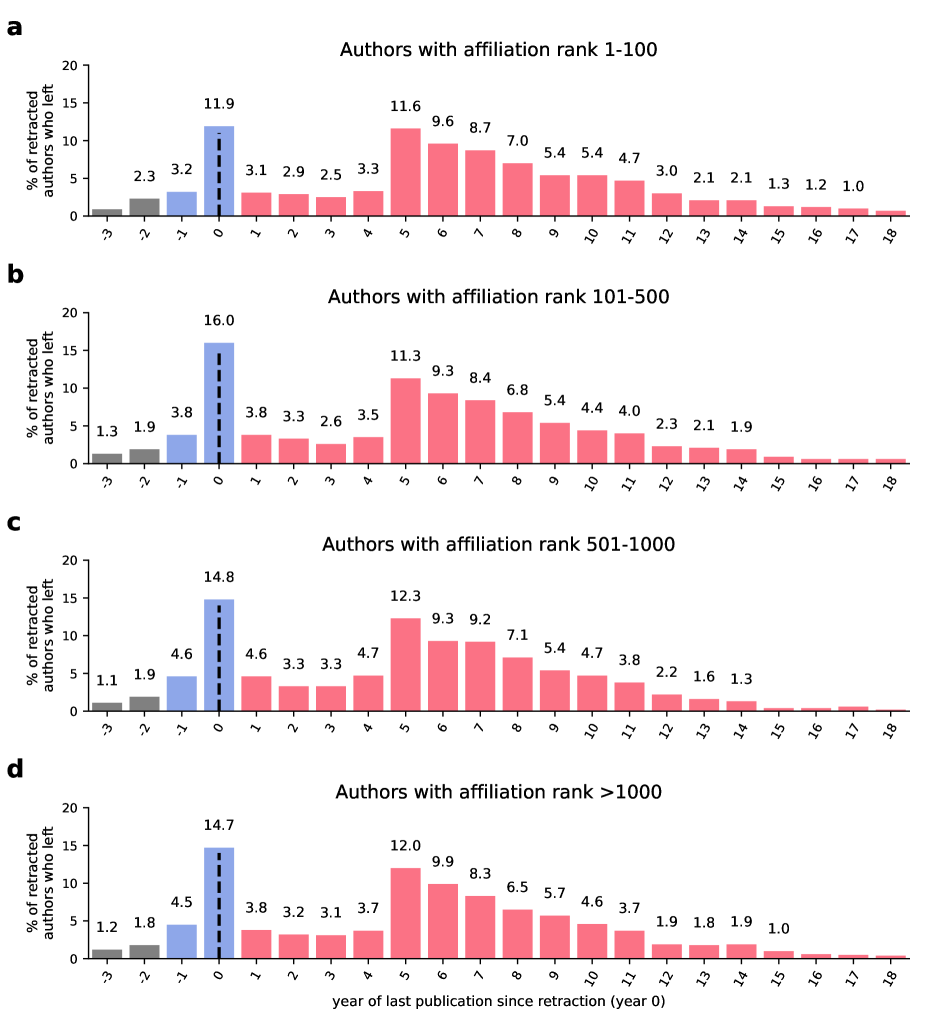
Interestingly, the distribution of the year of the author’s last paper in relation to the retraction year reveals a noteworthy trend, with approximately 25% of authors leaving their publishing careers around the time of retraction (Figure 1a). Specifically, 16.2% leave in the year of retraction (year 0), 4.6% depart shortly before (year -1), and 4.2% leave in the year following their retraction (year 1). In addition to exploring these aggregate patterns, we further investigate the probability of authors remaining in scientific publishing across different academic ages (Supplementary Figure S2), replicating Figure 1a but disaggregated by age. We find that early career authors, specifically those within 0-3 years from their first publication, are significantly more likely to leave publishing. Furthermore, we examine if author order, affiliation rank, and retraction reason is associated with authors’ continuity in publishing, as illustrated in Supplementary Figures S3 to S5. These figures provide valuable insights into the possible factors that are associated with authors persisting or not in publishing careers.
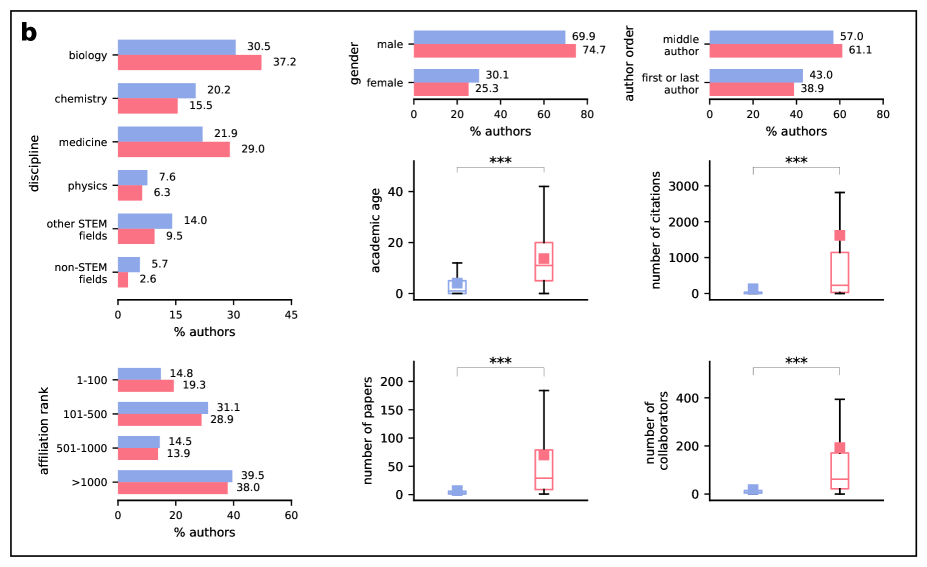
For the purposes of our further analysis, we define attrition as leaving in the year of retraction or shortly before, indicated by the absence of published papers in the five years after retraction. Consequently, we exclude all authors who had already departed from scientific publishing before year -1, accounting for 6.6% of the initial sample. This results in an “analytical sample” consisting of 14,583 retracted authors who authored 4,471 retracted papers. In this sample, descriptive statistics (Figure 1b) reveal that an overwhelming majority of authors of retracted papers belong to STEM fields such as Biology, Medicine, Chemistry, Physics, with less than 4% originating from non-STEM fields. Additionally, descriptive comparisons also show that those who leave after a retraction are slightly more likely to be women. Furthermore, our analysis indicates that authors with more experience—measured by academic age, number of citations, number of papers, and the size of collaboration networks at the time of retraction—are less likely to leave scientific publishing after a retraction.
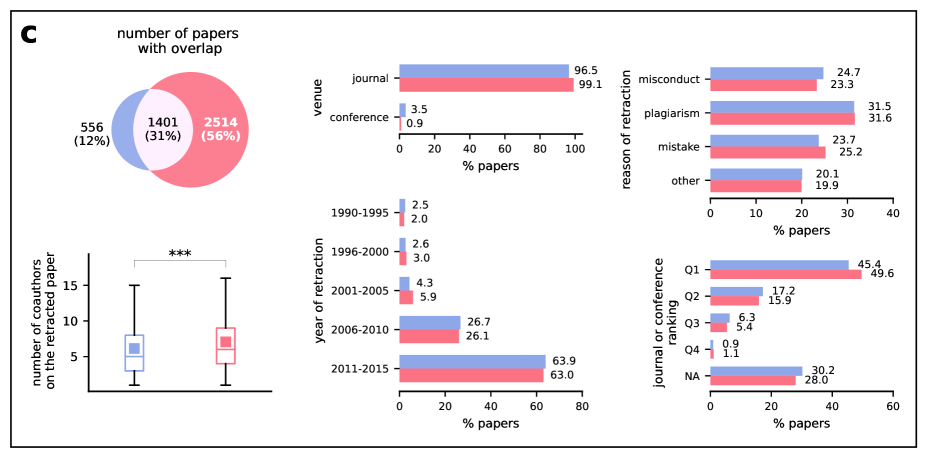
Regarding the characteristics of retracted papers themselves, the majority were published in journals rather than conferences and were published after 2010 (Figure 1c). Most of these papers fall within the top quartile in terms of journal ranking (information on journal ranking is unavailable for approximately 30% of the papers). The distribution of retracted papers can be categorized into three groups: those where all authors’ last publication is in the year of retraction (12%), those where some authors had their last paper in the year of retraction while others continued to publish (31%), and those where all authors have papers published after the year of retraction (56%). The reasons for retractions vary, with approximately 25% attributed to misconduct, 30% to plagiarism, 25% to mistakes, and an additional 20% to other reasons. For further details on establishing author and paper level features, see the Materials and Methods section “Creating author and paper level features,” and for numerical comparisons between retracted and non-retracted authors, see Supplementary Table S1.
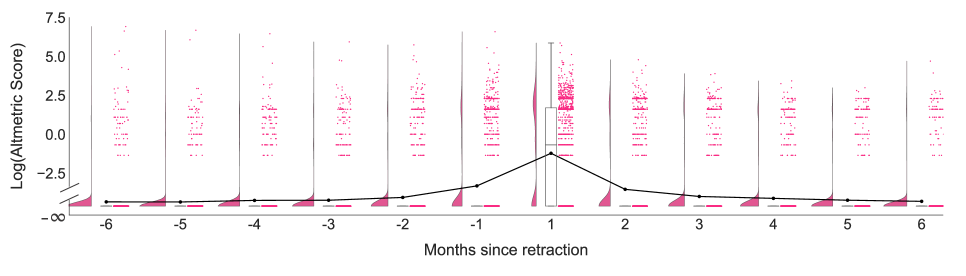
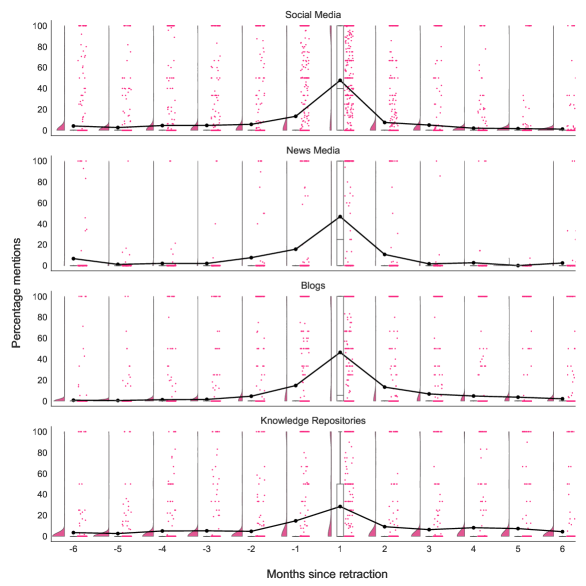
We next investigate the relationship between attrition and various key factors, such as the experience of authors at the time of retraction, the reasons for retraction, and the amount of attention received by the retraction. In particular, heightened levels of attention may bring authors into the spotlight, potentially influencing their perception within the broader scientific community, including individuals who may not have been previously familiar with their scholarly work. To investigate this, we use a third data set, Altmetric, a database of online mentions of publications, containing a record of more than 191 million mentions for over 35 million research outputs that we merge with RW. We measure attention using the Altmetric score, tracking it in the six-month period before and after the retraction event as per [27, 28] (see “Creating author and paper level features” in Materials and Methods for the calculation of the Altmetric score). In Figure 2, we present the logged distribution of the average attention received by the retracted papers during this time-window, highlighting that attention peaks during the month of retraction. For a breakdown by social media, news media, blogs, and knowledge repositories see Supplementary Figure S6. We find that while most retracted papers receive no attention, some gain world-wide publicity. More specifically, 61% of retracted papers receive no attention during their life-course, which increases to 84% when considering our time window (papers without attention are not shown in Figure 2).
Our linear probability regression models incorporate attention, where a high level of attention is defined by an Altmetric score above 20 computed within our window (see “Creating author and paper level features” in Materials and Methods for establishing this threshold), as well as author-specific characteristics at the year of retraction, such as authors’ discipline, gender, affiliation rank and different measures of experience, namely, academic age, number of papers, number of citations, and number of collaborators. We also consider paper-specific measures, such as the year of retraction, the reason for retraction, the type and ranking of venue of the retracted paper, and the number and order of authors on the paper. Regression results (Table 1 and Supplementary Table S2) reveal that retracted authors who leave scientific publishing have had shorter pre-retraction careers, fewer pre-retraction citations, fewer pre-retraction collaborators, and fewer pre-retraction papers. Moreover, those who authored a paper that was retracted due to misconduct are more likely to leave scientific publishing after retraction than those whose paper was retracted due to a mistake ().
Importantly, experiencing a retraction that garnered high levels of attention is positively associated with leaving publishing careers, across all measures of experience. Specifically, the estimated effect of high levels of attention is between 5.4 and 9.8 percentage points, depending on the regression specification. These results are robust to functional form, as logistic regression models yield similar substantive conclusions (see Supplementary Table S3). Since venue ranking information is missing for about 4000 retracted authors, we conduct these same analyses by including these authors and excluding the variable that controls for venue ranking of the retracted paper and find substantively similar results (Supplementary Table S4). We also conduct robustness analysis by including authors who left the year after retraction, recognizing that their papers, published the year after retraction, may have already been going through the publication process during the retraction, and find substantively similar results (see Supplementary Tables S5 and S6). Furthermore, as attention metrics are likely to be less accurate for retractions in earlier years, we exclude retractions prior to 2005 and we also find substantively similar results in this case (see Supplementary Table S7). Lastly, for a smaller sample of about 4000 authors whose retraction notes were manually annotated we conduct additional analysis including who initiated the retraction: the journal or the authors. We do not find a statistically significant association between this characteristic and the likelihood that a retracted author stopped publishing scientific papers (see Supplementary Table S8), while the other results remain similar.
Evidently, while retraction may not lead to leaving scientific publishing, it might still affect one’s career progression through impacting an author’s reputation. As such, we continue our analysis by exploring the effect that the retraction of a scientific publication has on an author’s career conditional on staying in scientific publishing regarding three main outcomes: (i) the number of collaborators retained post retraction, (ii) the number of new collaborators gained post retraction, and (iii) the share of open triads closed (i.e., when an author coauthors with someone who previously worked with their coauthor [20]). We perform a matching experiment where we match every retracted author with similar non-retracted authors who are not part of their collaboration network. From possible matches we explicitly exclude all and not just past collaborators to eliminate a negative spillover effect that retraction may cause impacting future collaborators of the retracted authors as studied in [29]. In the matching process, we ensure that every non-retracted author that is identified as a match for a retracted author shares the following exact characteristics with them: gender, academic age, affiliation rank at the start of their career, as well as affiliation rank and scientific discipline at the time of retraction. Furthermore, matches are similar (i.e., within 30% of the values of the retracted author) in terms of number of publications, number of citations, and number of collaborators, and closest matches are selected based on a theoretically calibrated distance function. Since we focus on the career trajectory of scientists post retraction, we ensure that both retracted authors and their matches have published at least one more paper post-retraction. This approach aligns the careers of retracted authors with their non-retracted matches, and avoids survival bias [30]. This matching experiment results in the matching of 3,094 retracted authors each matched to an average of 1.48 non-retracted authors. See the evaluation of the matched sample we analyze (“Analytical sample for the matching experiment” subsection of Materials and Methods), and Supplementary Note S3 for more details on calculations and binning decisions.
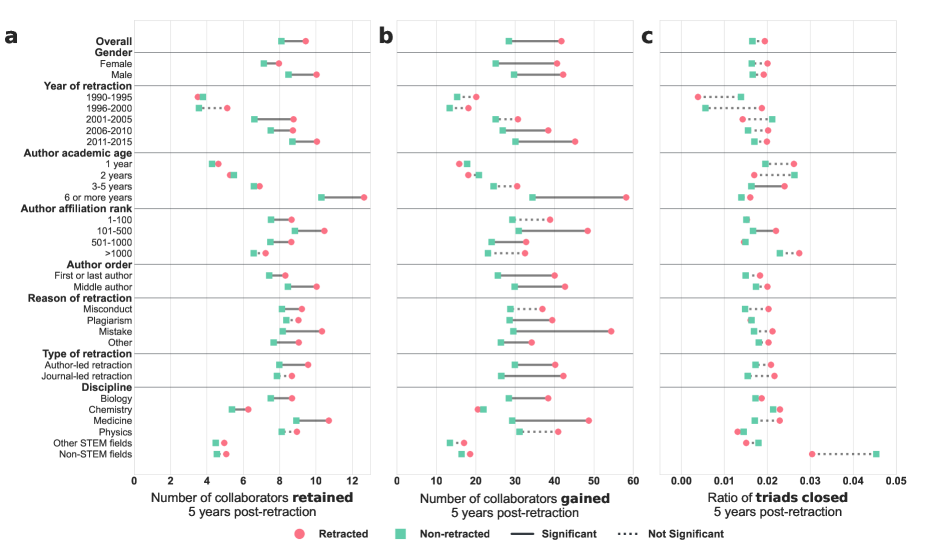
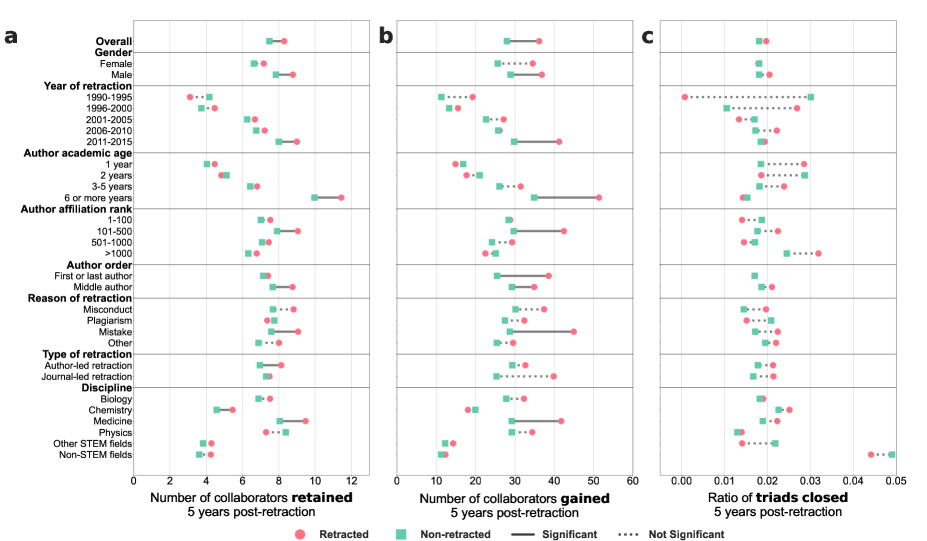
Figure 3 summarizes our findings from the matching experiment (when comparing retracted authors to non-retracted ones we create a synthetic non-retracted author averaging over all closest matches in case there are multiple). We find that authors who have experienced a retraction in their careers tend to gain significantly more new collaborators and retain significantly more of their past collaborators, see Figures 3a–b (results are based on Welch t-tests to correct for unequal variances, and are replicated using a Kolmogorow-Smirnov and a Wicoxon tests in Supplementary Tables S10-S12). We also find that these results largely and consistently hold by gender, year of retraction, academic age, author order on the retracted paper, reason for retraction (mistake, plagiarism, misconduct), type of retraction (author-led vs. journal-led), discipline, and affiliation rank. We find substantively similar differences between retracted authors and their matches when restricting matches to a 20% difference in terms of number of papers, collaborators, and citations prior to retraction (Supplementary Figure S7). We do not find credible evidence that retracted and non-retracted authors close a different proportion of open triads with authors who had previously coauthored with their past collaborators, see Figure 3c.
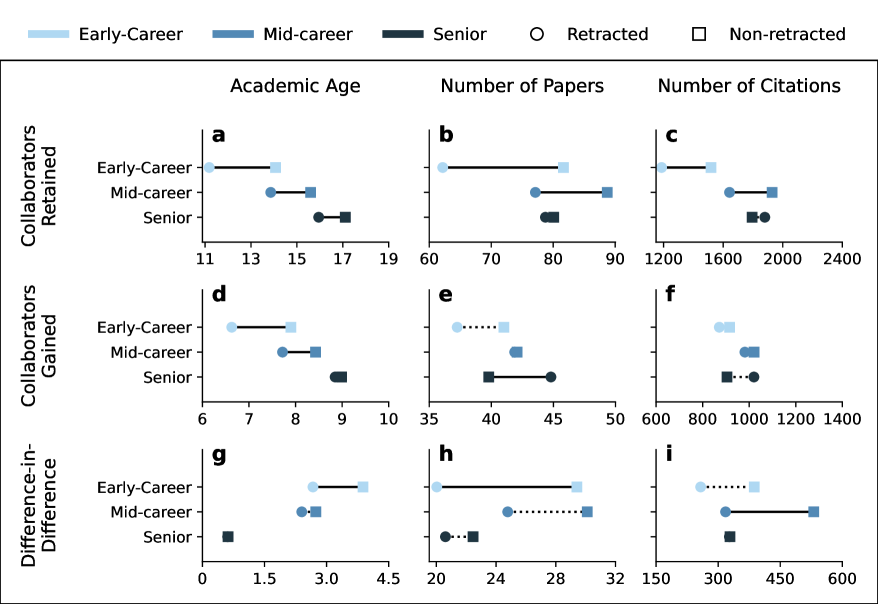
It is apparent that authors who survive a retraction, on average, maintain a greater number of previous collaborators and gain a higher number of new collaborators. However, it is essential to examine the characteristics of these retained and newly formed relationships among retracted authors in comparison to their matched counterparts. As such, we focus on three key characteristics: the academic age (seniority), number of papers (productivity), and number of citations (impact) of collaborators in both groups (and when multiple closest matches exist, we average over these to calculate a single statistic). Additionally, we analyze these characteristics across different categories of the retracted authors versus non-retracted authors. Specifically, we consider the early-career (0–3 years of experience at the time of retraction), mid-career (4-9 years of experience), and senior (10 or more years of experience) authors separately. We also consider different reasons for retraction: misconduct, plagiarism, and mistake separately.
We find that both early and mid-career retracted authors develop qualitatively different collaboration networks post-retraction compared to their matched counterparts, and suffer a significant loss. Namely, they retain less senior, less productive and less impactful collaborators compared to their matched counterparts (Figures 4a-c and Supplementary Table S13). We also find that even senior authors retain less senior collaborators post-retraction compared to their matched pairs (Figure 4a). In terms of collaborators gained, we find that senior retracted authors are not affected when it comes to the age of and number of citations produced by their collaborators, but gain significantly more productive collaborators (Figures 4d-f and Supplementary Table S14), while early and mid-career retracted authors are found to gain significantly less senior new collaborators (Figure 4d).
We also perform a difference-in-difference analysis whereby we examine the difference in characteristics of the average post-retraction coauthor and the average pre-retraction coauthor (note that for multiple closest matches this represents the average of averages). This metric captures how much more senior, productive and impactful post-retraction coauthors are who are retrained compared to those that are abandoned. We find that this difference among early-career authors is smaller compared to the difference among their matched pairs, meaning, that they retain less of their senior collaborators that they had pre-retraction. The same difference can be observed in terms of their collaborators’ productivity (Figures 4g-h and Supplementary Table S15). In addition, this difference is also smaller in terms of citation impact for mid-career retracted authors compared to their matched non-retracted counterparts (Figure 4i and Supplementary Table S15).
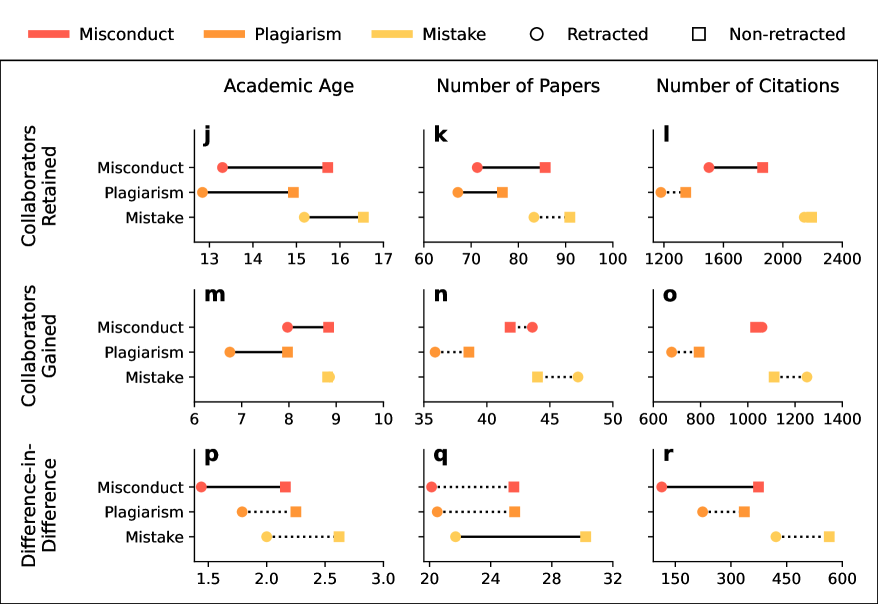
We perform a similar analysis by categorizing the sample of retracted authors based on reasons for retraction, see Figures 4j-r and Supplementary Tables S16–S18. Not surprisingly, we find that those whose papers were retracted for misconduct retain less senior, less productive and less impactful collaborators. These differences only hold for seniority among collaborators gained, but hold for the difference of differences for seniority and impact. Those who were retracted for plagiarism experience similar changes in their collaboration networks compared to those retracted for misconduct, with the exception of finding no credible evidence for a difference in retained coauthors’ impact, nor credible evidence for the difference of differences. Retracted authors for mistake do not develop qualitatively different collaboration networks compared to their matched pairs in terms of the seniority, productivity, and impact of their new collaborators. However, they retain less senior collaborators. Additionally, the difference between their coauthors whom they retained compared to those whom they lost is also larger compared to their matched pairs, i.e., they retain less productive collaborators compared to those they have lost.
In sum, the career impact of retractions may not be fully understood without considering attrition, i.e., leaving scientific careers where publishing is an integral component of success. We find that experiencing a retraction is associated with leaving publishing earlier. However, the results of the matching experiment suggest that when considering retracted authors’ who keep publishing, their collaboration networks do not suffer in size. Those who keep publishing post-retraction, on average, in fact seem to build larger collaboration networks compared to their counterparts, by retaining more collaborators and building new collaborations. This size-difference, however, goes hand-in-hand with qualitative differences, especially among junior and mid-career authors who retain and/or gain less senior, less productive, and less impactful coauthors. This may be due to more junior authors’ reduced ability to be promoted to faculty positions from being postdoctoral scholars, or shifting into lower status roles and participating in larger teams repeatedly, rather than carving out a leading role on projects post-retraction.
Discussion
Retractions can have significant consequences for authors’ careers, leading to their departure from scientific publishing. In this study, we conducted an analysis utilizing data from Retraction Watch, Microsoft Academic Graph and Altmetric, identifying and examining an analytical sample of around 4,500 retracted papers involving over 14,500 authors. Our findings reveal that: 1) around 25% of authors left their publishing careers around the time of retraction, 2) authors who left exhibited shorter pre-retraction careers, had fewer citations, collaborators, and publications compared to those who stayed, 3) high attention following retraction increased the likelihood of leaving, 4) retracted authors who stayed post-retraction formed larger collaboration networks, retaining more collaborators and gaining new ones, and 5) particularly among retracted authors with less than 10 years of experience pre-retraction who stayed, they built qualitatively weaker collaboration networks in terms of their coauthors seniority, productivity and impact.
It is important to acknowledge that our study is not without limitations. Firstly, online attention, as measured by the Altmetric score, captures the volume rather than the quality of attention and lacks a nuanced description of its specific sources beyond categories of platforms. Additionally, the score fails to reveal how relevant the coverage may be for retracted authors, which, if explored, could yield further insights into our findings. Moreover, retained and new collaborators may be qualitatively different beyond the aspects we explore. While our approach documents differences in the size of collaboration networks, and some aspects of their composition, it does not delve into e.g., changes in sub-fields, which might characterize the careers of retracted authors more so compared to their counterparts. Lastly, our matching analysis reveals that retracted authors matched to similar non-retracted counterparts were on average, more junior compared to the average retracted author. Therefore, it is possible that our estimates represent a lower bound of a difference, assuming that more senior authors possess greater resources to further develop their networks. Conversely, they may also represent an upper bound, assuming that more established authors receive less benefit of the doubt when assessing their culpability compared to their early-career counterparts. While these limitations should be taken into account when interpreting our findings, the matching strategy employed provides a high-quality estimate for the differences observed among the matched groups.
Some considerations fall outside of the scope of the paper. For instance, self-retraction might signal integrity, which could be a factor contributing to why some retracted authors develop larger collaboration networks. It is possible that these authors become more cautious in their future endeavors to avoid a second retraction, making them desirable collaborators. It is also plausible that they change how agentically they search for new collaborators and cultivate already existing relationships to compensate for the assumed (and empirically documented) negative impact of retractions. The role of the scientific community is similarly under-explored. Specifically, some retracted authors might receive support from their colleagues, presumably in cases when their papers are retracted for mistakes. Bringing these authors on as collaborators may be one way to show such support. These assertions, we hope, would form the starting point of future work.
Our study serves as an initial step in documenting how important institutions of science, such as retractions that serve a key role in policing the content of the canon, impact the careers of scientists. Future research should complement our work by exploring how authors navigate retractions and the micro-mechanisms underlying the strategies employed by retracted and non-retracted authors when seeking collaborators. It would also be valuable to investigate whether retracted and non-retracted scientists are sought after for similar opportunities, particularly when retracted authors’ work was not retracted due to misconduct. Furthermore, the role of online attention in these matters deserves further exploration, as it becomes intertwined with the names of authors whose work is discussed, extending beyond the scientific content of papers and encompassing a broader set of issues.
Materials and Methods
Data sources
The analyses presented in this paper rely on three data sets:
-
1.
Retraction Watch (RW) [23] is the largest publicly available data set of retracted articles, obtained on the 18th of May 2021. At the time it contained 26,504 retracted papers published in 5,844 journals and conferences. The earliest publication record goes back to the year 1753, whereas the latest record is in 2021. The data set consists of articles classified by a combination of 104 reasons for retraction.
-
2.
Microsoft Academic Graph (MAG) [31] is one of the largest data sets for scientific publication records. We collected this data set on the 30th of July 2021. It contained, at the time, approximately 263 million publications, authored by approximately 271.5 million scientists, with the earliest publication record in 1800.
-
3.
Altmetric [32] is a database of online mentions of publications. It contains a record of more than 191 million mentions for over 35 million research outputs. It uses unique identifiers (e.g., Digital Object Identifier or DOI, and the PubMedID) to match attention to research across several social media platforms, blogs, news sites, and knowledge repositories.
Merging RW and MAG
We merge MAG and RW using a two step approach. As both MAG and RW provide the DOI of the publication record, we start with these identifiers, as it is a persistent identifier unique to each document on the web. However, as not all records in MAG and RW have a DOI, out of 26,504 retracted papers in RW, we are able to identify 7,906 papers in MAG using DOIs. In order to increase the size of our data set, we merge the rest of the publication titles in RW using fuzzymatcher333https://github.com/RobinL/fuzzymatcher which employs probabilistic record linkage [33], to find similar titles based on Levenshtein distance. We validate the robustness of our fuzzy matching, by randomly sampling 100 retracted papers and manually checking the accuracy of the merge. Out of 100 sampled papers, 99 in RW were linked to the correct entry in MAG. As a result of this second step, we additionally merge 15,363 retractions resulting in a total of 23,269 (88%) retracted papers and 72,594 authors in RW linked to their corresponding entry in MAG.
Merging RW and Altmetric
For each paper in RW, we use the associated DOI or the PubMedID to query the Altmetric API. Out of the 26,504 retracted papers in RW, we are able to identify 11,265 (42.5%) papers with online presence based on their unique identifiers. There are 15,239 papers for which an Altmetric entry could not be located, however, these papers and their respective authors are also part of our analysis. Using Google and Twitter, we validate our approach by manually locating the online presence of a random sample of 100 papers that were not found in Altmetric. We find that 96 out of 100 papers had no online mentions, i.e., the main reason for not finding these papers in the Altmetric data set is a result of not receiving attention online.
Creating author and paper level features
We use the three data sets to create features for authors and papers. Here, we discuss the features requiring additional data collection and calculations, such as the gender, scientific discipline, type of retraction, and Altmetric score.
Gender. To identify the perceived gender of authors, we use Genderize.io to map author first names to gender. Genderize.io returns the probability indicating the certainty of the assigned gender. We exclude all authors whose gender could not be identified with probability. We validate the name-based gender identified by Genderize.io by comparing the agreement (or concordance) of its labels against another classifier, Ethnea. Ethnea is a name-based gender and ethnicity classifier specifically designed for bibliographic records. We compare the labels of 31,907 authors in RW for whom “male” or “female” labels were available using both Genderize.io and Ethnea. We find that the assignment of these labels agreed for 31,028 (i.e., 97%) retracted authors with a Cohen’s score of 0.93 showing an almost perfect level of agreement [34]. Our approach is in line with prior research which uses similar name-based gender classifiers [35, 36, 37, 38, 39, 40], however, automated classifiers, such as the ones here have significant shortcomings. They do not rely on self-identification, and therefore could misgender authors. Annotations are performed on the basis of historical name–gender associations to assign male or female to an author, recognizing that there are expansive identities beyond this limiting binary that our approach can not explore.
Scientific discipline. To assign a scientific discipline to every author, we utilize the fields in MAG that span more than 520,000 hierarchically structured fields. For every paper and field , MAG specifies a confidence score, denoted by , which indicates the level of confidence that is associated with . The aforementioned hierarchy contains 19 top-level fields444These fields are Art, Biology, Business, Chemistry, Computer Science, Economics, Engineering, Environmental Science, Geography, Geology, History , Materials Science, Mathematics, Medicine, Philosophy, Physics, Political Science, Psychology, and Sociology., which we refer to as “disciplines.” Almost every field, , has at least one ancestor that is a discipline. Let denote the set of all disciplines that are ancestors of . For any given paper, , the set of disciplines associated with is denoted by , and is computed as follows:
For any given author, , let denote the set of papers authored by . We compute the discipline(s) of as follows:
where denotes the set cardinality operator. In other words, is associated with the most frequent discipline(s) amongst all papers authored by up to and including the retraction year.
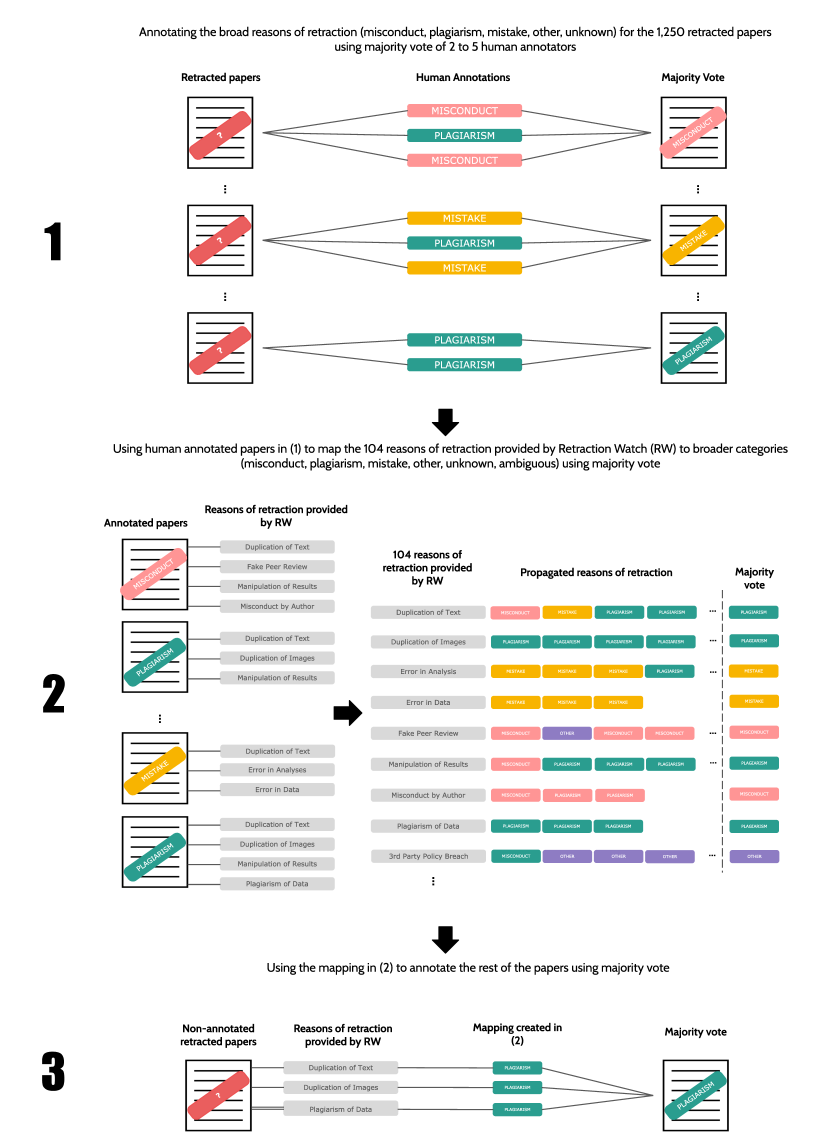
Retraction reasons. In order to identify the reason for retraction, we manually extracted the retraction notes of 1,250 retracted papers. The reasons for retraction can be classified into four broad categories: (i) misconduct; (ii) plagiarism (note that some prior research considers plagiarism as misconduct, for example [41]); (iii) mistake; and (iv) other. Every retraction note was evaluated by multiple annotators. We started with two annotators, and assigned additional annotators up to 5 until a majority reason was reached. If a majority reason was not reached, the reason was classified as “ambiguous.” Finally, if no reason was provided for the retraction, then it was classified as “unknown.” The final distribution of the reasons for retraction of the annotated papers is: 251 (20%) misconduct, 311 (25%) plagiarism, 347 (28%) mistake, 170 (14%) other, 121 (10%) unknown, and 50 (4%) ambiguous. Note that the reason plagiarism includes plagiarising others’ work, as well as prior work by the authors. Based on a random sample of 100 retraction notes, 50 referred to taking someone else’s work without proper reference, 30 referred to lacking citations or quotes from the authors own work, and 20 did not include information whose work has been plagiarised. Therefore, 30%-50% of this category is self-plagiarism.
We use the manually annotated papers to automatically code reasons of retraction for the rest of the papers in RW. We do so using a label propagation algorithm. There are 104 unique reasons for retractions provided in RW. Each retracted paper is associated with one or more of these reasons. We map the 104 reasons to a majority coarser class of plagiarism, misconduct, mistake, and other in our analysis. Then we use this mapping to annotate the rest of the papers without labels using the majority class (see Supplementary Figure S8 for a more detailed visualization of the label propagation algorithm). The final distribution of the reasons for retraction after label propagation for the filtered sample is as follows: 1153 (25%) misconduct, 1507 (32%) plagiarism, 1097 (23%) mistake, 520 (11%) unknown, 348 (7%) other, and 50 (1%) ambiguous. These numbers are comparable to those reported about a decade ago in a sample of papers indexed in PubMed [42]. In our analysis, we merge all three of other, unknown and ambiguous in the “other” category.
Type of retraction. Using the manually extracted retraction notes, we also identify whether the retraction was author-led or journal-led. The breakdown of the different types of retractions is as follows: 604 (48%) author-led, 499 (40%) journal-led, 119 (10%) unknown, and 28 (2%) ambiguous. These data are only available for the manually annotated papers.
Journal and conference ranking. To identify the ranking for the venue (journal or conference) of retracted papers, we utilize the database of SCImago journal rankings (SJR) 555https://www.scimagojr.com/journalrank.php. For a given journal or conference year, the SJR score is computed as the average number of weighted citations received by the articles published in the venue during the past three years [43]. Based on this score, for each subject area, a quartile is also assigned to each journal. SJR provides rankings from 1999 to 2020. We use the year of publication of the retracted article to identify the SJR score and quartile ranking of the venue. Out of the 4,672 papers and 15,614 authors in the filtered sample, we were able to identify the rankings for 3,183 (68.1%) papers and 10,698 (68.5%) authors. Note that papers prior to 1999 do not have this information, nor do papers whose venues were not featured in SJR.
Altmetric score. The Altmetric score is a weighted count of the attention a research output receives from different online sources (e.g., Twitter, news, etc.). The Altmetric API, however, only provides the current cumulative Altmetric score for a given record, and does not give the breakdown or a customized score for a given time window. Since we focus on the 6 month before and after retraction to isolate the attention that the retraction likely garnered, we compute this score using the methodology detailed by Altmetric on their webpage666https://help.altmetric.com/support/solutions/articles/6000233311-how-is-the-altmetric-attention-score-calculated-. While the algorithm Altmetric uses to compute its score is proprietary [44], the description allows us to closely estimate it. We compute the Spearman correlation of the available cumulative Altmetric score against our computed score for the complete time window using our methodology. For the 11,265 retracted papers for which an Altmetric record (and score) is available, the Spearman correlation is high (). We compute the Altmetric score for both the retracted paper and its respective retraction note (most retraction notes and papers have separate DOIs) and aggregate these by taking their sum. We assign papers that are not indexed in Altmetric an attention score of zero. We validate this choice by randomly sampling 100 of these papers and manually searching for mentions of them on Google and on Twitter using the title and the DOI of the paper. Out of this 100, 96 have not received any attention. The remaining papers only garnered one mention on average. For this reason, we treat the papers that do not have mentions on Altmetric as having an attention score of zero.
Threshold for high attention. We determine the threshold by conducting regression analysis allowing the threshold for high levels of attention to vary . We examine four different specifications of the regression model, where specifications differ by how we measure an author’s level of experience (academic age, number of papers, number of citations, number of past collaborators), which are highly correlated. We reveal that our data are consistent with a threshold of , where in this region we detect a positive and statistically significant effect of attention on attrition in at least three of the four specifications. Outside of this region, there are no thresholds where more than one model yields a statistically significant estimate. We set our threshold for high attention at 20 in the 12-months window around the retraction. We also consider a non-linearity in the threshold, but we do not find strong evidence for it; for further details, see Supplementary Note S2.
Analytical sample for the matching experiment
We use our filtered sample of 4,672 papers and 15,614 authors to generate the analytical sample for the matching experiment. Of the 15,614 authors, we find suitable matches for 3,094 authors (20%). These matches are established on the basis of a three-step process. First we perform exact matching on gender, academic age, affiliation rank at the start of the career, as well as affiliation rank and scientific discipline at the time of retraction. Second, we pick a threshold (30%) within which we accept matches on the remaining characteristics: number of papers, number of collaborators, and number of citations pre-retraction; i.e., these characteristics of the match ought to be within 30% of the same for the retracted author. Third, we use a calibrated distance function to achieve balance on the three latter characteristics, giving more weight to number of pre-retraction collaborators, our most important confounder. Specifically, we identify the closest match for each author using the lowest weighted euclidean distance that minimizes the standardized mean difference for the number of papers, number of citations, and the number of collaborators between the author and the match, calculated over the set of potential matches identified in the second step. We repeat these steps using a 20% threshold, and present robustness analyses with this threshold in Supplementary Figure S7.
For every author , let , and denote the standardized number of papers, number of citations, and number of collaborators of by the year of retraction. We choose the closest match for each author by minimizing the following distance function:
where , , and , denote the weights determined empirically by minimizing the standardized mean differences.
If the collaboration year of a collaborator is missing, we cannot place them on the authors’ career timeline. In other words, we cannot identify whether that collaboration happened pre- or post-retraction. As such, in the case of a missing collaboration year, we remove the author, and their corresponding matches from our analysis altogether. We carry out our analysis on retracted authors who authored at least one paper post their retraction year. All matched authors meet the same criteria. The “matched sample” of these authors who stayed in scientific publishing is different from those in the filtered sample in the following important ways: the matched sample is younger, has fewer papers, fewer citations and fewer collaborators on average, and slightly more likely to be a middle author, also more likely to be in institutions ranked 101-1000 (see Supplementary Figure S9). In sum, the matched authors are lower status, on average, compared to the non-matched filtered sample. These differences are essential to consider when evaluating our inferences. We calculate standardized mean differences (SMDs) [45] for our matched sample and find that these values are 0.029, 0.023 and 0.046, respectively for the number of papers, citations, and collaborators. These statistics give us confidence that retracted authors are matched to non-retracted authors with similar career trajectories up to the time of retraction.
Acknowledgement
We gratefully acknowledge support and resources from the High Performance Computing Center at New York University Abu Dhabi. We thank Ivan Oransky and Adam Marcus, co-founders of Retraction Watch [46], as well as The Center For Scientific Integrity, the parent organization of RW, for diligently maintaining a curated list of scientific retractions, and making it freely available to researchers. We also thank Altmetric.com and Microsoft Academic Graph for providing the data used in this study. We thank Sarhana Adhikari, Alex Chae, Aasharya Dutt, Rhiane Kall, Danish Khan, Rhythm Kukreja, Ritin Malhotra and Zaeem Shahzad for finding and annotating the retraction notices. We thank Peter Bearman, Sanjeev Goyal, Byungkyu Lee, Fengyuan (Michael) Liu, Minsu Park, and the participants of the Workshop on the Frontiers of Network Science 2023 for thoughtful comments and suggestions.
Data and Code Availability
The Microsoft Academic Graph (MAG) dataset can be downloaded from the following website. The Retraction Watch (RW) database can be accessed from their website. Access to Altmetric API can be requested from their website. Finally, all data and code used to produce the figures and tables can be downloaded here.
Conflict of Interest
The authors, B.A. and K.M. acknowledge that their study was inspired by a personal experience, experiencing a retraction of one of their papers, which galvanized the research question asked in this paper, namely, how retractions influence the careers of authors of scientific papers? While this shaped their inquiry, it had no impact on their choice of methods, or interpretation of their results. The authors declare no conflict of interest as defined by the Journal’s policy.
Figures
| Dependent variable: Attrition | ||||
| (1) | (2) | (3) | (4) | |
| High Attention ( Altmetric score) | ||||
| Academic Age | ||||
| Papers | ||||
| Log(Citations) | ||||
| Log(Collaborators) | ||||
| Reason: Misconduct | ||||
| Reason: Plagiarism | ||||
| Reason: Other | ||||
| Constant | ||||
| Observations | 10698 | 10698 | 10698 | 10698 |
| Adjusted | ||||
| F Statistic | ||||
| ∗p0.05; ∗∗p0.01; ∗∗∗p0.001 | ||||
Supplementary Materials for
Characterizing the effect of retractions on scientific careers
Shahan Ali Memon, Kinga Makovi*, Bedoor AlShebli*
* Joint corresponding authors. E-mail: km2537@nyu.edu; bedoor@nyu.edu;
Supplementary Figures

Supplementary Tables
| Category | Standardized Mean Difference | |||
| Attention | High (20 Altmetric score) | 0.04 | 0.03 | -0.07 |
| Low | 0.96 | 0.97 | 0.07 | |
| Academic Age | 13.71 | 4.08 | 1.03 | |
| # Papers | 70.0 | 7.02 | 0.75 | |
| # Citations | 1618.23 | 132.15 | 0.44 | |
| # Collaborators | 193.14 | 18.67 | 0.44 | |
| Gender | Male | 0.75 | 0.70 | -0.24 |
| Female | 0.25 | 0.30 | 0.24 | |
| Affiliation Rank | 1-100 | 0.20 | 0.15 | -0.37 |
| 101-500 | 0.30 | 0.31 | 0.09 | |
| 501-1000 | 0.14 | 0.15 | 0.07 | |
| 1000 | 0.36 | 0.39 | 0.12 | |
| Reason | Misconduct | 0.22 | 0.25 | 0.16 |
| Plagiarism | 0.28 | 0.32 | 0.20 | |
| Mistake | 0.30 | 0.24 | -0.30 | |
| Other | 0.21 | 0.19 | -0.07 | |
| Author order | First or last author | 0.39 | 0.43 | 0.17 |
| Middle author | 0.61 | 0.57 | -0.17 | |
| Year of retraction | 1990-1995 | 0.02 | 0.02 | 0.38 |
| 1996-2000 | 0.03 | 0.02 | -0.19 | |
| 2001-2005 | 0.06 | 0.04 | -0.42 | |
| 2006-2010 | 0.26 | 0.26 | -0.04 | |
| 2010-2015 | 0.64 | 0.66 | 0.11 | |
| Venue | Journal | 0.99 | 0.96 | -1.47 |
| Conference | 0.01 | 0.04 | 1.47 | |
| Journal Ranking | Q1 | 0.73 | 0.65 | -0.37 |
| Q2 | 0.20 | 0.24 | 0.24 | |
| Q3 | 0.06 | 0.10 | 0.49 | |
| Q4 | 0.01 | 0.01 | 0.23 | |
| Discipline | Biology | 0.37 | 0.31 | -0.30 |
| Chemistry | 0.15 | 0.20 | 0.32 | |
| Medicine | 0.29 | 0.22 | -0.37 | |
| Physics | 0.06 | 0.08 | 0.21 | |
| Other STEM fields | 0.09 | 0.14 | 0.44 | |
| Non-STEM fields | 0.03 | 0.06 | 0.79 | |
| Dependent variable: Attrition | ||||
| (1) | (2) | (3) | (4) | |
| High Attention ( Altmetric score) | ||||
| Academic Age | ||||
| Papers | ||||
| Log(Citations) | ||||
| Log(Collaborators) | ||||
| Female | ||||
| Author Affiliation Rank | ||||
| Reason: Misconduct | ||||
| Reason: Plagiarism | ||||
| Reason: Other | ||||
| Coauthors on Retracted Paper | ||||
| Author order: Middle Author | ||||
| Retraction Year | ||||
| Venue: Journal | ||||
| Journal/Conference Rank | ||||
| Constant | ||||
| Observations | 10698 | 10698 | 10698 | 10698 |
| Adjusted | ||||
| F Statistic | ||||
| ∗p0.05; ∗∗p0.01; ∗∗∗p0.001 | ||||
| Dependent variable: Attrition | ||||
| (1) | (2) | (3) | (4) | |
| High Attention ( Altmetric score) | ||||
| Academic Age | ||||
| Papers | ||||
| Log(Citations) | ||||
| Log(Collaborators) | ||||
| Female | ||||
| Author Affiliation Rank | ||||
| Reason: Misconduct | ||||
| Reason: Plagiarism | ||||
| Reason: Other | ||||
| Coauthors on Retracted Paper | ||||
| Author order: Middle Author | ||||
| Retraction Year | ||||
| Venue: Journal | ||||
| Journal/Conference Rank | ||||
| Constant | ||||
| Observations | 10698 | 10698 | 10698 | 10698 |
| Pseudo | ||||
| Log-Likelihood | -4374.899 | -4067.782 | -4208.473 | -3786.276 |
| ∗p0.05; ∗∗p0.01; ∗∗∗p0.001 | ||||
| Dependent variable: Attrition | ||||
| (1) | (2) | (3) | (4) | |
| High Attention ( Altmetric score) | ||||
| Academic Age | ||||
| Papers | ||||
| Log(Citations) | ||||
| Log(Collaborators) | ||||
| Female | ||||
| Author Affiliation Rank | ||||
| Reason: Misconduct | ||||
| Reason: Plagiarism | ||||
| Reason: Other | ||||
| Coauthors on Retracted Paper | ||||
| Author order: Middle Author | ||||
| Retraction Year | ||||
| Venue: Journal | ||||
| Constant | ||||
| Observations | 14583 | 14583 | 14583 | 14583 |
| Adjusted | ||||
| F Statistic | ||||
| ∗p0.05; ∗∗p0.01; ∗∗∗p0.001 | ||||
| Dependent variable: Attrition | ||||
| (1) | (2) | (3) | (4) | |
| High Attention ( Altmetric score) | ||||
| Academic Age | ||||
| Papers | ||||
| Log(Citations) | ||||
| Log(Collaborators) | ||||
| Female | ||||
| Author Affiliation Rank | ||||
| Reason: Misconduct | ||||
| Reason: Plagiarism | ||||
| Reason: Other | ||||
| Coauthors on Retracted Paper | ||||
| Author order: Middle Author | ||||
| Retraction Year | ||||
| Venue: Journal | ||||
| Journal/Conference Rank | ||||
| Constant | ||||
| Observations | 10698 | 10698 | 10698 | 10698 |
| Pseudo | ||||
| Log-Likelihood | -4374.899 | -4496.267 | -4571.522 | -4133.949 |
| ∗p0.05; ∗∗p0.01; ∗∗∗p0.001 | ||||
| Dependent variable: Attrition | ||||
| (1) | (2) | (3) | (4) | |
| High Attention ( Altmetric score) | ||||
| Academic Age | ||||
| Papers | ||||
| Log(Citations) | ||||
| Log(Collaborators) | ||||
| Female | ||||
| Author Affiliation Rank | ||||
| Reason: Misconduct | ||||
| Reason: Plagiarism | ||||
| Reason: Other | ||||
| Coauthors on Retracted Paper | ||||
| Author order: Middle Author | ||||
| Retraction Year | ||||
| Venue: Journal | ||||
| Journal/Conference Rank | ||||
| Constant | ||||
| Observations | 10222 | 10222 | 10222 | 10222 |
| Adjusted | ||||
| F Statistic | ||||
| ∗p0.05; ∗∗p0.01; ∗∗∗p0.001 | ||||
| Dependent variable: Attrition | ||||
| (1) | (2) | (3) | (4) | |
| High Attention ( Altmetric score) | ||||
| Academic Age | ||||
| Papers | ||||
| Log(Citations) | ||||
| Log(Collaborators) | ||||
| Female | ||||
| Author Affiliation Rank | ||||
| Reason: Misconduct | ||||
| Reason: Plagiarism | ||||
| Reason: Other | ||||
| Retracted by: Journal | ||||
| Retracted by: Other | ||||
| Coauthors on Retracted Paper | ||||
| Author order: Middle Author | ||||
| Retraction Year | ||||
| Journal/Conference Rank | ||||
| Constant | ||||
| Observations | 3888 | 3888 | 3888 | 3888 |
| Adjusted | ||||
| F Statistic | ||||
| ∗p0.05; ∗∗p0.01; ∗∗∗p0.001 | ||||
| Category | Standardized Mean Difference | |||
| Academic Age | 13.71 | 8.43 | 0.54 | |
| # Papers | 70.0 | 23.49 | 0.55 | |
| # Citations | 1618.23 | 287.01 | 0.4 | |
| # Collaborators | 193.14 | 53.07 | 0.35 | |
| Gender | Male | 0.75 | 0.71 | -0.18 |
| Female | 0.25 | 0.29 | 0.18 | |
| Affiliation Rank | 1-100 | 0.20 | 0.18 | -0.13 |
| 101-500 | 0.30 | 0.46 | 0.73 | |
| 501-1000 | 0.14 | 0.21 | 0.54 | |
| 1000 | 0.36 | 0.14 | -1.27 | |
| Reason | Misconduct | 0.22 | 0.23 | 0.08 |
| Plagiarism | 0.28 | 0.27 | -0.07 | |
| Mistake | 0.30 | 0.27 | -0.12 | |
| Other | 0.21 | 0.23 | 0.14 | |
| Author order | First or last author | 0.39 | 0.35 | -0.18 |
| Middle author | 0.61 | 0.65 | 0.18 | |
| Year of retraction | 1990-1995 | 0.02 | 0.01 | -0.07 |
| 1996-2000 | 0.03 | 0.02 | -0.19 | |
| 2001-2005 | 0.06 | 0.05 | -0.15 | |
| 2006-2010 | 0.26 | 0.26 | -0.02 | |
| 2010-2015 | 0.64 | 0.65 | 0.07 | |
| Discipline | Biology | 0.37 | 0.37 | -0.03 |
| Chemistry | 0.15 | 0.18 | 0.19 | |
| Medicine | 0.29 | 0.30 | 0.03 | |
| Physics | 0.06 | 0.06 | -0.11 | |
| Other STEM fields | 0.09 | 0.08 | -0.21 | |
| Non-STEM fields | 0.03 | 0.02 | -0.12 | |
| Group | ||||||||
| Overall | [0.957, 1.720] | |||||||
| Gender | ||||||||
| Male | [1.056, 2.032] | |||||||
| Female | [0.282, 1.379] | |||||||
| Year of retraction | ||||||||
| 1990-1995 | [-1.862, 1.304] | |||||||
| 1996-2000 | [-0.098, 3.216] | |||||||
| 2001-2005 | [0.419, 3.889] | |||||||
| 2006-2010 | [0.452, 1.993] | |||||||
| 2011-2015 | [0.875, 1.826] | |||||||
| Author academic age | ||||||||
| 1 year | [-0.028, 0.723] | |||||||
| 2 years | [-0.834, 0.416] | |||||||
| 3-5 years | [-0.207, 0.843] | |||||||
| 6 or more years | [1.682, 3.014] | |||||||
| Author affiliation rank | ||||||||
| 1-100 | [0.314, 1.950] | |||||||
| 101-500 | [1.028, 2.219] | |||||||
| 501-1000 | [0.494, 1.807] | |||||||
| [-0.530, 1.841] | ||||||||
| Author order | ||||||||
| First or last author | [0.315, 1.459] | |||||||
| Middle author | [1.080, 2.078] | |||||||
| Reason of retraction | ||||||||
| Misconduct | [0.311, 1.880] | |||||||
| Plagiarism | [0.006, 1.326] | |||||||
| Mistake | [1.450, 2.870] | |||||||
| Other | [0.467, 2.300] | |||||||
| Type of retraction | ||||||||
| Author-led retraction | [0.778, 2.390] | |||||||
| Journal-led retraction | [0.017, 1.620] | |||||||
| Discipline | ||||||||
| Biology | [0.651, 1.689] | |||||||
| Chemistry | [0.365, 1.429] | |||||||
| Medicine | [1.107, 2.470] | |||||||
| Physics | [-1.105, 2.778] | |||||||
| Other STEM fields | [-0.260, 1.200] | |||||||
| Non-STEM fields | [-0.551, 1.587] |
| Group | ||||||||
| Overall | [8.971, 17.742] | |||||||
| Gender | ||||||||
| Male | [7.832, 17.088] | |||||||
| Female | [5.508, 25.647] | |||||||
| Year of retraction | ||||||||
| 1990-1995 | [-7.159, 16.847] | |||||||
| 1996-2000 | [-1.670, 11.200] | |||||||
| 2001-2005 | [-1.438, 12.749] | |||||||
| 2006-2010 | [2.373, 20.764] | |||||||
| 2011-2015 | [9.551, 20.765] | |||||||
| Author academic age | ||||||||
| 1 year | [-6.785, 2.778] | |||||||
| 2 years | [-7.259, 1.877] | |||||||
| 3-5 years | [-1.006, 12.957] | |||||||
| 6 or more years | [16.245, 31.359] | |||||||
| Author affiliation rank | ||||||||
| 1-100 | [-0.706, 19.848] | |||||||
| 101-500 | [10.521, 24.496] | |||||||
| 501-1000 | [3.266, 14.272] | |||||||
| [-5.506, 24.344] | ||||||||
| Author order | ||||||||
| First or last author | [6.860, 21.993] | |||||||
| Middle author | [7.403, 18.171] | |||||||
| Reason of retraction | ||||||||
| Misconduct | [-0.541, 16.799] | |||||||
| Plagiarism | [2.992, 18.690] | |||||||
| Mistake | [13.938, 35.762] | |||||||
| Other | [1.741, 13.897] | |||||||
| Type of retraction | ||||||||
| Author-led retraction | [3.578, 16.939] | |||||||
| Journal-led retraction | [2.776, 28.764] | |||||||
| Discipline | ||||||||
| Biology | [4.255, 15.737] | |||||||
| Chemistry | [-4.347, 1.567] | |||||||
| Medicine | [10.505, 28.395] | |||||||
| Physics | [-7.344, 26.987] | |||||||
| Other STEM fields | [0.521, 6.660] | |||||||
| Non-STEM fields | [-5.693, 10.040] |
| Group | ||||||||
| Overall | [-0.000, 0.006] | |||||||
| Gender | ||||||||
| Male | [-0.001, 0.006] | |||||||
| Female | [-0.003, 0.010] | |||||||
| Year of retraction | ||||||||
| 1990-1995 | [-0.029, 0.009] | |||||||
| 1996-2000 | [-0.008, 0.035] | |||||||
| 2001-2005 | [-0.021, 0.007] | |||||||
| 2006-2010 | [-0.002, 0.011] | |||||||
| 2011-2015 | [-0.001, 0.007] | |||||||
| Author academic age | ||||||||
| 1 year | [-0.003, 0.017] | |||||||
| 2 years | [-0.021, 0.002] | |||||||
| 3-5 years | [0.001, 0.015] | |||||||
| 6 or more years | [-0.002, 0.006] | |||||||
| Author affiliation rank | ||||||||
| 1-100 | [-0.007, 0.007] | |||||||
| 101-500 | [0.001, 0.010] | |||||||
| 501-1000 | [-0.005, 0.004] | |||||||
| [-0.011, 0.020] | ||||||||
| Author order | ||||||||
| First or last author | [-0.002, 0.009] | |||||||
| Middle author | [-0.001, 0.007] | |||||||
| Reason of retraction | ||||||||
| Misconduct | [-0.002, 0.013] | |||||||
| Plagiarism | [-0.006, 0.006] | |||||||
| Mistake | [-0.002, 0.011] | |||||||
| Other | [-0.004, 0.008] | |||||||
| Type of retraction | ||||||||
| Author-led retraction | [-0.003, 0.010] | |||||||
| Journal-led retraction | [-0.003, 0.015] | |||||||
| Discipline | ||||||||
| Biology | [-0.003, 0.006] | |||||||
| Chemistry | [-0.007, 0.011] | |||||||
| Medicine | [-0.000, 0.012] | |||||||
| Physics | [-0.010, 0.007] | |||||||
| Other STEM fields | [-0.012, 0.006] | |||||||
| Non-STEM fields | [-0.069, 0.039] |
Metric Early-career Mid-career Senior Retracted Non-retracted Retracted Non-retracted Retracted Non-retracted Academic Age 11.18∗∗∗ 14.07∗∗∗ 13.86∗∗∗ 15.6∗∗∗ 15.95∗∗∗ 17.11∗∗∗ 10.0 13.5 13.2 14.83 15.65 16.24 7.49 7.5 6.53 6.83 6.36 6.65 Number of Papers 62.17∗∗∗ 81.65∗∗∗ 77.12∗ 88.72∗ 78.74 80.09 37.72 62.23 59.76 67.06 67.33 64.34 73.99 88.77 82.01 92.6 63.33 70.99 Number of Citations 1186.88∗∗ 1518.43∗∗ 1642.78∗ 1928.49∗ 1879.71 1794.38 348.67 841.75 798.56 960.5 1056.11 958.35 2569.7 2502.37 2607.7 3142.03 3457.94 2914.26
Metric Early-career Mid-career Senior Retracted Non-retracted Retracted Non-retracted Retracted Non-retracted Academic Age 6.63∗∗∗ 7.9∗∗∗ 7.72∗∗ 8.43∗∗ 8.85 8.99 5.42 7.41 7.39 8.29 8.71 8.95 6.16 5.31 5.19 4.94 4.68 4.68 Number of Papers 37.25 41.01 41.88 42.08 44.8∗ 39.79∗ 20.0 32.3 32.23 33.92 37.97 33.13 63.14 48.95 44.55 39.63 35.34 32.23 Number of Citations 871.54 916.05 981.43 1020.85 1020.25 904.78 200.84 433.39 440.59 504.49 640.83 486.07 1851.02 1598.84 1592.03 1974.71 1207.02 1832.52
Metric Early-career Mid-career Senior Retracted Non-retracted Retracted Non-retracted Retracted Non-retracted Academic Age 2.67∗∗ 3.88∗∗ 2.4 2.74 0.61 0.62 1.56 3.29 1.99 2.2 0.11 0.53 6.98 7.84 5.69 6.35 5.55 5.78 Number of Papers 20.03∗∗ 29.41∗∗ 24.78 30.11 20.61 22.46 7.44 18.19 12.68 16.61 12.18 13.84 63.01 77.82 68.16 77.46 47.21 53.44 Number of Citations 257.7 387.08 317.89∗ 530.86∗ 327.1 328.53 17.65 130.89 43.68 102.27 43.08 11.0 2013.65 2117.7 2039.6 2264.95 2037.71 1967.47
Metric Misconduct Plagiarism Mistake Retracted Non-retracted Retracted Non-retracted Retracted Non-retracted Academic Age 13.3∗∗∗ 15.72∗∗∗ 12.84∗∗∗ 14.93∗∗∗ 15.18∗∗∗ 16.54∗∗∗ 13.23 15.31 12.33 14.33 15.0 15.6 7.08 7.12 7.31 6.85 6.72 7.66 Number of Papers 71.3∗∗ 85.67∗∗ 67.19∗ 76.61∗ 83.29 90.89 56.36 71.49 48.0 59.35 68.38 69.25 85.62 85.42 69.88 78.27 67.83 90.5 Number of Citations 1502.5∗∗ 1864.13∗∗ 1179.21 1346.38 2143.94 2193.49 833.0 1065.72 443.0 726.4 1260.13 1232.38 2316.32 2447.94 3564.58 2343.2 2937.48 3617.93
Metric Misconduct Plagiarism Mistake Retracted Non-retracted Retracted Non-retracted Retracted Non-retracted Academic Age 7.97∗∗ 8.84∗∗ 6.75∗∗∗ 7.97∗∗∗ 8.86 8.82 7.5 8.69 6.22 7.5 8.67 8.65 6.08 5.09 4.95 4.99 4.96 5.0 Number of Papers 43.61 41.85 35.89 38.57 47.23 44.02 30.64 34.88 24.28 29.62 40.14 35.45 53.5 37.43 37.66 38.77 43.71 42.98 Number of Citations 1059.94 1032.89 677.38 793.87 1250.11 1111.19 535.42 543.53 257.0 382.64 730.32 609.07 1673.03 2236.5 1162.31 1749.77 1709.68 1697.68
Metric Misconduct Plagiarism Mistake Retracted Non-retracted Retracted Non-retracted Retracted Non-retracted Academic Age 1.44∗ 2.16∗ 1.79 2.25 2.0 2.62 0.72 1.71 1.3 1.7 1.53 1.91 5.9 6.51 6.46 6.63 6.17 7.63 Number of Papers 20.13 25.52 20.5 25.57 21.7∗ 30.22∗ 7.89 18.13 10.47 14.8 14.48 16.86 74.15 68.69 54.03 69.78 55.54 74.15 Number of Citations 113.46∗ 374.26∗ 223.61 335.97 421.14 564.81 10.5 92.4 14.66 40.82 78.52 116.38 2007.17 1809.94 2110.19 1829.7 2132.91 2637.19
S1 Data preprocessing filters
As part of our data cleaning process, we apply the following pre-processing filters on our 23,269 MAG-RW merged data set. We highlight each pre-processing step in detail below, and show how many records were eliminated as a result in each step:
-
•
Removing authors with multiple retractions: We remove all retracted authors that occur multiple times in the Retraction Watch (RW) database.
Out of the 23,269 papers, 20,338 papers are retained after removing authors with multiple retractions. -
•
Removing bulk retractions: Over 7000 retractions in RW come from a single publisher, i.e., the Institute of Electrical and Electronics Engineers (IEEE) [26], most of which were retracted in bulk. Bulk retractions have a different mechanism not related to the content or science in the paper, but to the publisher or the conference. As such, we remove all retracted papers that were retracted in bulk. We do so by identifying all sets of 5 or more papers that were retracted by the same publisher on the same day.
Out of the remaining 20,338 papers, 10,355 are retained after filtering bulk retractions. -
•
Removing retractions before the year 1990 and after 2015: Throughout this paper we examine several outcomes that take shape after retraction. We allow for a five year window post-retraction for all authors that we include so that we can determine if they are still pursuing careers in scientific publishing, and determine the size of their collaboration network. Naturally, this limits our ability to analyze retractions post 2015, as our data set ends mid 2021. We also exclude retractions prior to 1990 due to the scarcity of the data in prior years.
Out of the remaining 10,355 papers, 5,291 papers are retained after applying this filter. -
•
Removing papers with missing fields: Out of the 5,291 remaining retracted papers, 616 papers had missing information on at least one of the following variables: (i) affiliation at the start of the author’s career; (ii) affiliation in the year of retraction; (iii) discipline; and (iv) gender.
We retain 4,675 retracted papers and 15,672 authors after applying this filter. -
•
Removing authors with possible name disambuigation problems in MAG: We identify 58 authors (0.4%) with name disambiguation problems in MAG. We remove these authors from our analysis.
As such, our final filtered sample consists of 4,672 retracted papers and 15,614 authors.
S2 Two thresholds for attention
To assess non-linearity in the threshold for attention, we consider two thresholds: and , to classify papers into three categories having received low, high (to recognize that an overwhelming majority of papers have not received any attention) and extreme attention; and conduct a different regression with each threshold-pair. More specifically, we examine four different specifications within each regression model, where specifications differ by how we measure an author’s level of experience (academic age, number of papers, number of citations, number of past collaborators), which are highly correlated. In Supplementary Figure S9 we display the coefficients in terms of their direction and statistical significance as a function of the thresholds, and , using the intersection of the four different specifications that capture authors’ experience with different measures.
We find some, but not robust evidence that the data are consistent with two thresholds. Specifically, in Supplementary Figure S9, the plot representing the intersection of different specifications shows a small region that the two thresholds delineate, where and . A corresponding regression table for is included in Supplementary Table S19. This region, however, is not robust to the inclusion or exclusion of the venue ranking variable, while remains consistent when changing the functional form of the regression, i.e., switching to a logistic regression. Given the lack of robustness of these results, we present models in the paper with one threshold. Future research can further explore if extreme attention may be protective of retracted authors in terms of leading to a lower likelihood of attrition.
| Dependent variable: Attrition | ||||
| (1) | (2) | (3) | (4) | |
| High Attention ( Altmetric score) | ||||
| Low Attention ( Altmetric score) | ||||
| Academic Age | ||||
| Papers | ||||
| Log(Citations) | ||||
| Log(Collaborators) | ||||
| Female | ||||
| Author Affiliation Rank | ||||
| Reason: Misconduct | ||||
| Reason: Plagiarism | ||||
| Reason: Other | ||||
| Coauthors on Retracted Paper | ||||
| Author order: Middle Author | ||||
| Retraction Year | ||||
| Venue: Journal | ||||
| Journal/Conference Rank | ||||
| Constant | ||||
| Observations | 10698 | 10698 | 10698 | 10698 |
| Adjusted | ||||
| F Statistic | ||||
| ∗p0.05; ∗∗p0.01; ∗∗∗p0.001 | ||||
S3 Description of the confounders of the matching experiment
For every retracted author , with a paper that is retracted in the year , we perform a matching process such that every retracted author is matched to a set of non-retracted authors , where is a set of collaborators of the author at any point in time, before or after .
A potential match of , , is selected when the following conditions hold:
-
•
Gender: and have same gender; for details of how gender was identified, see the Materials and Methods section “Creating author and paper level features.”
-
•
Scientific discipline at the time of retraction: and have the same scientific field at the time of retraction; for details of how the scientific field was inferred, see the Materials and Methods section “Creating author and paper level features.”
-
•
Academic age: and have published their first paper in the same year.
-
•
Affiliation rank on the first paper: The affiliations of authors are ranked based on 2019 Academic Ranking of World Universities777https://www.shanghairanking.com/rankings/arwu/2019, Accessed: December 2019.. and have the same affiliation on their first published paper as found in the MAG data set. If ’s affiliation rank, , is between 1-100, they are matched to such that where is the affiliation rank for . If is between 101-1000, we look for matches in the following pre-defined bins by the Shanghai Ranking: ; ; ; ; ; ; ; ; ; . All authors with affiliations not ranked (i.e., ) by the Academic Ranking of World Universities are matched exactly on the basis of the text field describing affiliations.
-
•
Affiliation rank at the time of retraction: and have the same affiliation in the year . Matches are created based on the same process described above.
The closest matches are selected from the potential matches using a threshold of maximum distance between retracted and non-retracted authors, and calibrated distance function based on the number of papers, citations and collaborators at the time of retraction described in Materials and Methods section “Analytical sample for the matching experiment.”
References
- [1] Lynn, F. B., Podolny, J. M. & Tao, L. A sociological (de)construction of the relationship between status and quality. American Journal of Sociology 115, 755–804 (2009).
- [2] Azoulay, P., Bonatti, A. & Krieger, J. L. The career effects of scandal: Evidence from scientific retractions. Research Policy 46, 1552–1569 (2017).
- [3] Mistry, V., Grey, A. & Bolland, M. J. Publication rates after the first retraction for biomedical researchers with multiple retracted publications. Accountability Research 26, 277–287 (2019).
- [4] Jin, G. Z., Jones, B., Lu, S. F. & Uzzi, B. The reverse matthew effect: Consequences of retraction in scientific teams. The Review of Economics and Statistics 101, 492–506 (2019).
- [5] Hussinger, K. & Pellens, M. Guilt by association: How scientific misconduct harms prior collaborators. Research Policy 48, 516–530 (2019).
- [6] Petersen, A. M. et al. Reputation and impact in academic careers. Proceedings of the National Academy of Sciences 111, 15316–15321 (2014).
- [7] Aksnes, D. W. & Rip, A. Researchers’ perceptions of citations. Research Policy 38, 895–905 (2009).
- [8] Vuong, Q.-H., La, V.-P., Ho, M.-T., Vuong, T.-T. & Ho, M.-T. Characteristics of retracted articles based on retraction data from online sources through february 2019 7, 34–44 (2020).
- [9] DVM, B. Fallibility in science: Responding to errors in the work of oneself and others. Advances in Methods and Practices in Psychological Science 1, 432–438 (2018).
- [10] Lee, S. & Bozeman, B. The impact of research collaboration on scientific productivity. Social studies of science 35, 673–702 (2005).
- [11] He, Z.-L., Geng, X.-S. & Campbell-Hunt, C. Research collaboration and research output: A longitudinal study of 65 biomedical scientists in a new zealand university. Research policy 38, 306–317 (2009).
- [12] Wuchty, S., Jones, B. F. & Uzzi, B. The increasing dominance of teams in production of knowledge. Science 316, 1036–1039 (2007).
- [13] LaCour, M. J. & Green, D. P. When contact changes minds: An experiment on transmission of support for gay equality. Science 346, 1366–1369 (2014).
- [14] Obokata, H. et al. Stimulus-triggered fate conversion of somatic cells into pluripotency. Nature 505, 641–647 (2014).
- [15] Coleman, J. Social capital in the creation of human capital. American Journal of Sociology 94, S95–S120 (1988).
- [16] Beaver, D. D. Reflections on scientific collaboration (and its study): past, present, and future. Scientometrics 52, 365–377 (2001).
- [17] Bosquet, C. & Combes, P.-P. Are academics who publish more also more cited? individual determinants of publication and citation records. Scientometrics 97, 831–857 (2013).
- [18] Lee, S. & Bozeman, B. The impact of research collaboration on scientific productivity. Social Studies of Science 35, 673–702 (2005).
- [19] Ductor, L., Fafchamps, M., Goyal, S. & van der Leij, M. J. Social networks and research output. The Review of Economics and Statistics 96, 936–948 (2014).
- [20] Shi, F., Foster, J. G. & Evans, J. A. Weaving the fabric of science: Dynamic network models of science’s unfolding structure. Social Networks 43, 73–85 (2015).
- [21] Kim, J. & Diesner, J. Over-time measurement of triadic closure in coauthorship networks. Social Network Analysis and Mining 7, 9 (2017).
- [22] Zhelyazkov, P. I. Interactions and interests: Collaboration outcomes, competitive concerns, and the limits to triadic closure. Administrative Science Quarterly 63, 210–247 (2018).
- [23] The retraction watch database (internet). New York: The Center for Scientific Integrity. 2018. ISSN: 2692-465X. [Cited June 18, 2023]. Available from: http://retractiondatabase.org/.
- [24] Sinha, A. et al. An overview of microsoft academic service (mas) and applications. In Proceedings of the 24th international conference on world wide web, 243–246 (2015).
- [25] Wang, K. et al. A review of microsoft academic services for science of science studies. Frontiers in Big Data 2, 45 (2019).
- [26] McCook, A. One publisher, more than 7000 retractions. Science 362, 393–393 (2018).
- [27] Peng, H., Romero, D. M. & Horvát, E.-Á. Dynamics of cross-platform attention to retracted papers. Proceedings of the National Academy of Sciences 119, e2119086119 (2022).
- [28] Abhari, R., Vincent, N., Dambanemuya, H. K., Bodon, H. & Horvát, E.-Á. Twitter engagement with retracted articles: Who, when, and how? arXiv preprint arXiv:2203.04228 (2022).
- [29] Jin, G. Z., Jones, B., Lu, S. F. & Uzzi, B. The reverse matthew effect: Consequences of retraction in scientific teams. Review of Economics and Statistics 101, 492–506 (2019).
- [30] Brown, S. J., Goetzmann, W., Ibbotson, R. G. & Ross, S. A. Survivorship Bias in Performance Studies. The Review of Financial Studies 5, 553–580 (2015).
- [31] Wang, K. et al. Microsoft Academic Graph: When experts are not enough. Quantitative Science Studies 1, 396–413 (2020).
- [32] Adie, E. & Roe, W. Altmetric: enriching scholarly content with article-level discussion and metrics. Learned Publishing 26, 11–17 (2013).
- [33] Sayers, A., Ben-Shlomo, Y., Blom, A. W. & Steele, F. Probabilistic record linkage. International journal of epidemiology 45, 954–964 (2016).
- [34] McHugh, M. L. Interrater reliability: the kappa statistic. Biochemia medica 22, 276–282 (2012).
- [35] AlShebli, B. K., Rahwan, T. & Woon, W. L. The preeminence of ethnic diversity in scientific collaboration. Nature communications 9, 1–10 (2018).
- [36] Lee, E. et al. Homophily and minority-group size explain perception biases in social networks. Nature human behaviour 3, 1078–1087 (2019).
- [37] Squazzoni, F. et al. Peer review and gender bias: A study on 145 scholarly journals. Science advances 7, eabd0299 (2021).
- [38] Morgan, A. C. et al. The unequal impact of parenthood in academia. Science Advances 7, eabd1996 (2021).
- [39] Liu, F., Holme, P., Chiesa, M., AlShebli, B. & Rahwan, T. Gender inequality and self-publication patterns among scientific editors. arXiv preprint arXiv:2207.01518 (2022).
- [40] Peng, H., Teplitskiy, M. & Jurgens, D. Author mentions in science news reveal wide-spread ethnic bias. arXiv preprint arXiv:2009.01896 (2020).
- [41] Gaudino, M. et al. Trends and characteristics of retracted articles in the biomedical literature, 1971 to 2020. JAMA internal medicine 181, 1118–1121 (2021).
- [42] Fang, F. C., Steen, R. G. & Casadevall, A. Misconduct accounts for the majority of retracted scientific publications. Nature 109, 17028–17033 (2012).
- [43] Guerrero-Bote, V. P. & Moya-Anegón, F. A further step forward in measuring journals’ scientific prestige: The sjr2 indicator. Journal of informetrics 6, 674–688 (2012).
- [44] Trueger, N. S. et al. The altmetric score: a new measure for article-level dissemination and impact. Annals of emergency medicine 66, 549–553 (2015).
- [45] Flury, B. K. & Riedwyl, H. Standard distance in univariate and multivariate analysis. The American Statistician 40, 249–251 (1986).
- [46] Oransky, I. & Marcus, A. Retraction watch. Tracking retractions as a window into the scientific process. Late resveratrol researcher Dipak Das up to 20 (2012).
- [47] Allen, M., Poggiali, D., Whitaker, K., Marshall, T. R. & Kievit, R. A. Raincloud plots: a multi-platform tool for robust data visualization. Wellcome open research 4 (2019).