CAWL: A Cache-aware Write Performance Model of Linux Systems
Abstract.
The performance of data intensive applications is often dominated by their input/output (I/O) operations but the I/O stack of systems is complex and severely depends on system specific settings and hardware components. This situation makes generic performance optimisation challenging and costly for developers as they would have to run their application on a large variety of systems to evaluate their improvements. Here, simulation frameworks can help reducing the experimental overhead but they typically handle the topic of I/O rather coarse-grained, which leads to significant inaccuracies in performance predictions. Here, we propose a more accurate model of the write performance of Linux-based systems that takes different I/O methods and levels (via system calls, library calls, direct or indirect, etc.), the page cache, background writing, and the I/O throttling capabilities of the Linux kernel into account. With our model, we reduce, for example, the relative prediction error compared to a standard I/O model included in SimGrid for a random I/O scenario from 67 % down to 10 % relative error against real measurements of the simulated workload. In other scenarios the differences are even more pronounced.
1. Introduction
Simulation and modeling of processes and workflows is a common technique to study and predict the performance characteristics of applications without the need to actually execute them with all studied parameter settings. Two exemplary popular frameworks for estimating the costs of running HPC applications and workflows are SimGrid (simgrid, ) and WRENCH (wrench, ). They focus on modeling computation time and process interdependencies caused by network traffic and message exchange. Another important aspect for the application’s performance is the input/output (abbreviated as I/O or even IO in the following) they perform, which SimGrid and WRENCH address on a coarse grain level. But for a realistic model of the IO behaviour, additional aspects of the IO subsystems, such as different buffers and IO bandwidth steering over time, play a vital role as they influence the observed IO costs. We provide accurate models to estimate the IO costs considering the cache involvement of the OS and C standard library. Such models allow improving the accuracy of HPC and workflow simulation frameworks for IO intensive applications.
Following an overview of the main available IO methods of Linux and the C standard library (Sect. 2) and a summary of the inner working of the Linux page cache mechanism (Sect. 3), we present our main original contributions:
-
•
We define models for the accurate prediction of the IO costs (write performance) for scenarios with and without the page cache and the buffer of the C standard library (Sect. 4). We distinguish:
-
•
We discuss related work and studies on IO modeling and storage devices in Sect. 5.
-
•
We evaluate the IO cost prediction accuracy for various scenarios on different hosts and IO devices compared to measured system performance (Sect. 6):
-
–
Here, we compare CAWL estimations (our contribution) with SimGrid IO estimates and show the importance and relevance that considering caching effects may have. Indeed, we observe the SimGrid IO model overestimating IO costs by up to and underestimating them by up to in different scenarios.
-
–
In contrast, we show that CAWL estimates the actual IO costs mostly with more than accuracy in different cases.
-
–
2. Background: File Input/Output Operations
Programmatically, there are various options to read/write data from/to a file in C/C++. From the primitive file operations (i.e., system calls or short syscalls) at the low level (e.g., open, write, etc.) (love2013, , Ch. 2) to the higher-level standard library functions such as fopen, fwrite, etc. of libc (libc, ),(love2013, , Ch. 3), and the fstream family of classes in the C++ standard library (stdlib, ). To improve the IO performance of applications, the Linux kernel (linux, ), as well as the C/C++ standard libraries, provide different caching mechanisms to buffer the IO in the main memory before they end up in the slower storage device.
The Linux kernel defines a dynamic part of the main memory in the kernel space (kernelspace, ) as the page cache (love2013, , Ch. 2),(love2010linux_devel, , Sect. 16). When a process issues a write operation, the Operating System (OS) copies the data to the page cache instead of directly writing it to the storage device (sync). Later, the OS will sync the data in the page cache with the backing storage device transparent to the application. On top of the page cache, the C/C++ standard libraries provide a separate buffer in the user space for file IO.
Caching the data instead of directly transferring them to the storage devices allows a quick return of the write operation, and consecutive reads do not need to engage the backing device for recently written data still in the cache. Additionally, the cache can help aggregate fine-granular random data accesses in small chunks to large data chunks that need fewer operations on the storage device. Moreover, highly-frequent modifications of the same data only affect the fast page cache in the main memory at first. The eventual state is written to the storage device delayed and more seldom.
2.1. Primitive File Operations
Linux offers, among others, the following primitive system calls for IO (see the respective manual page (man2, ) for details):
-
•
open opens a file and assigns a non-negative integer file descriptor for reference in other system calls.
-
•
lseek repositions the offset of an open file for read/write operations.
-
•
write receives the data to be written as input and copies the data into the page cache (in the normal case of non-direct IO).
-
•
fsync receives a file descriptor as input and syncs its modified data and metadata from the page cache to the underlying storage device. Similarly, giving the O_SYNC (man2, , open) flag to the open system call causes the written data to be synced before a write returns. Calling fsync is not necessary in most cases since the OS will eventually write the page cache’s data to the storage device, transparent to the application (see Sect. 3).
-
•
read reads data from a file. The OS first queries the page cache for the data. If not found, the data is fetched from the storage device.
-
•
close closes a file descriptor.
2.2. Standard Library Functions
On top of the primitive file operations, which allow precise control over the IO operations, high-level standard functions are built, aiming for better portability instead. They are part of the C standard library (see the respective manual page (man3, ) for details):
-
•
fopen opens a file as a stream and returns a FILE structure pointer.
-
•
fseek is similar to lseek but works with FILE pointers instead of integer file descriptors.
-
•
fwrite receives the data to be written as input and copies it into a buffer of several kilobytes (if it fits, see Sect. 4.5). If the data is larger than the buffer, fwrite invokes the write system call to transfer the data to the page cache (details in Sect. 4.5). The buffer lies in the user space portion of the main memory, as opposed to the page cache that lies in the kernel space. This way, frequent expensive system calls for every small data chunk are reduced to only one system call that writes data of relatively large size (several kilobytes). The fwrite function returns as soon as it copied the data into its buffer. Only after the buffer is full (or when fseek or fflush are called), fwrite invokes the write system call (Sect. 2.1). As a result, the OS moves the data from the buffer to the page cache in the kernel space. Hence, the data goes through two layers of buffers (user space and kernel space). We discuss this behavior further in Sect. 4.5.
-
•
fflush invokes a write system call to move the data from the library buffer into the page cache of the OS (into the kernel space). The data will still reside in main memory and is not necessarily synced to the disk. The OS manages the rest, as discussed in Sects. 2.1 and 3.
-
•
fread looks for the data first in the library buffer (user space). If found, it returns the data without issuing a system call. Otherwise, it invokes a read system call (Sect. 2.1).
-
•
fclose closes a file represented by a FILE structure pointer.
3. Linux Page Cache Management
After issuing a write system call, the OS copies the data to the page cache. Later, the OS will sync the data in the page cache with the backing storage device in the background. Modified data still not synced from the page cache to the disk is denoted as dirty data (dirty pages). Linux defines the dirtyable memory as all the memory pages that processes can make dirty. Since Linux 3.14, dirtyable memory consists of free memory, the already dirty pages, and the reclaimable pages, excluding the reserved pages of the main memory (dirtyable, ; dirtylimits, ). The OS tracks the dirty rate, which is the dirty size divided by the size of the dirtyable memory (dirtylimits, ). The Linux kernel manages the page cache by maintaining the dirty rate between two limits: and (dirtylimits, ). These limits can be adjusted using the Linux command sysctl (sysctl, ). When the dirty rate reaches the , the kernel starts syncing the dirty pages in the background. The is treated as a hard limit for the dirty rate, which should not be exceeded. Throughout this paper, we denote a process that produces dirty pages (by issuing write operations) as a ‘dirtier process’ (one who makes pages dirty).
Linux maintains the page cache by marking the cached pages as active or inactive. A page that is accessed only once is an inactive page. Otherwise, the OS marks it as active. Linux cleans dirty pages by synchronizing least recently used inactive pages (activecache, ). If the number of active pages grows too high, Linux marks some of the least recently used active pages as inactive.
3.1. Idle Instead of Direct Reclaim
Linux kernel versions older than version 3.10 applied the direct reclaim (directreclaim, ) approach to prevent the dirty rate from exceeding the . Whereby, as the dirty rate reaches the , the dirtier process is in charge of syncing the data to the storage device (foreground writeback). This approach keeps the dirty rate below the . Though, in the case of IO to multiple inodes (open files), after reaching the , many IOs to different places in the storage device (different inodes) will happen, requiring frequent seeking and resulting in significant performance degradation (fengguang, ).
Kernels starting from version 3.10 overcome this issue by throttling the dirtier process and letting it idle rather than making the process responsible for performing writebacks to the disk (fengguang, ; throttle, ). Instead, the flusher threads of the OS perform the writeback of the dirty data. Hence, the IO does jump more seldom to different inodes, and the OS manages the sync order of the dirty pages.
3.2. Throttling Regulation
Another advantage of kernels starting from version 3.10 is the smooth IO slow down (throttling) of dirtier processes to maintain the dirty rate reasonably below the . The kernel starts to throttle the dirtier processes when the dirty rate hits (setpoint, ). As a result, the process observes a reduced rate of writing data (task rate or bandwidth). In other words, the kernel limits the task rate of a dirtier process by imposing a delay on it when it calls the write system call. The kernel adjusts the task rate of the process periodically as follows (posratio, ; throttle, ):
| (1) | new task rate |
Section 3.2 tells how the kernel responds to a growing dirty rate and how it limits the task rate of a dirtier process. The kernel keeps track of the average task rate for a dirtier process during a specific period and multiplies it by the computed at that time to get the new task rate of the process. In the case of , we have (start throttling), and in the case of dirty rate hitting its maximum permitted value , we get (no more writes). According to the new task rate, the kernel determines the amount of delay it should impose on the process before the write system call returns, to meet the new computed task rate (rate_to_delay, ). Notice that before the dirty rate reaches , no throttling occurs. Hence, is not engaged to limit the task rate. Figure 1 represents an overview of the discussed throttling mechanism.

3.3. Storage Devices and Control Groups
When IO regards different storage devices, dirty pages destined to fast devices are synced more quickly than those destined to slow devices. As a result, the page cache will eventually be mostly filled with the dirty pages of slow devices syncing slowly while faster devices have a small share of dirty pages. To account for this, starting from the kernel version 2.6.24, each storage device gets a fair share of the according to its write-out rate (bandwidth) (dirtylimit_devices, ; dirtylimit_devices2, ). Clearly, in the case of having most of the IO destined to a single storage device, that storage device gets nearly the entire share of the .
The kernels starting from version 4.10 also consider different control groups and penalize a control group for the dirty share of the inodes (files) owned by that control group (controlgroups, ). A further improvement since kernel version 4.2 penalizes the control group that is most responsible for the IO issued to an inode (not necessarily its owner): the ownership of such inode is changed to that control group (controlgroups2, ) (hence, penalizing the responsible control group). Again, in the simple case of having one control group or one process dirtying significantly more pages than the other control groups/processes, the throttling will be carried out mostly by that control group/process, and the other control groups can safely be ignored.
4. Model
In this work, we provide a model to predict the expected write throughput of a process. We assume a single IO-intensive process issues write requests to a single storage device. Since there are no other IO-intensive processes, nearly all IO requests come from the control group that owns the IO-intensive process. As a result, the global determines the task rate of the process. Later, we will discuss possibilities to expand our model for more complicated scenarios. As discussed, Linux performs background syncs when the dirty rate reaches the , and when it exceeds the , Linux throttles the dirtier process, as discussed in Sect. 3.2. The process could engage library calls or system calls to issue the writes. The IO could follow a random or a sequential pattern. We will also model the effects of opening a file with the O_DIRECT and O_SYNC flags (man2, , open). Our model estimates the IO costs of a dirtier process that opens a file and performs write operations in the file with different offsets and sizes. Additionally, the process requires different computation times before performing each write operation. Figure 2 illustrates such a process. Throughout this work, we use the term cost of an operation to refer to the duration of performing that operation. We denote the total data size that the process writes as .
4.1. Basic System Parameters
On the system side, the main memory has a bandwidth of , the Ramdisk accepts data with a rate of , and the storage device has a sync bandwidth of and a read bandwidth of . The filesystem’s logical block size on the underlying storage device is . The C standard library has a buffer size of in the user space to buffer the data passed to fwrite. The operating system starts background flushes when the dirty rate reaches , starts throttling when reaching , and has a hard limit of , as discussed in Sect. 3.2. Moreover, the OS cleans dirty pages older than seconds in the background. Notice that we differentiate and , even though they both write to the same device (main memory). The reason is that to write data on the Ramdisk, the OS comes in between and performs many other operations and updates the file metadata for each written page (love2010linux_devel, , Sect. 12–13),(stackex, ). For instance, the kernel allocates memory for written data (memory allocation can be costly). It also updates the inode data structures to update the file size and keep track of each inode’s allocation. Hence, a Ramdisk has a lower bandwidth than plain memory access (). We denote the latency of invoking a write system call as , and that of a sync write system call (when synced data access is specified, e.g., by O_SYNC) as (the extra fixed cost of the non-sync and sync write system calls). The average cost of seeking the storage device (moving the disk head around) is represented by . To perform our evaluations, we implemented a micro-benchmark in C++ that automatically measures the values of these basic system parameters on a given platform. In Sect. 6 we explain the approach of our benchmarking tool.
4.2. Modeling Synchronized and Direct IO with System Calls
If a file open uses the O_DIRECT flag, the IO for that file bypasses the OS page cache and goes directly to the storage device without being cached in user or kernel space, as illustrated in case 1 of Fig. 3. The O_DIRECT flag guarantees that the OS does not copy the data into the kernel space. Although, it does not promise that write operations return strictly after transferring all the data to the storage device. Such a guarantee is made by the O_SYNC and O_DSYNC flags, while those do not promise to bypass the OS cache (man2, , open). Combining O_DIRECT with either of these flags guarantees a synchronized and direct write to the storage device. Another way to achieve synchronized and direct IO is to open the file with the O_DIRECT flag and calling the fsync system call after each write system call to make sure that the data is synchronized to the storage device. Since O_DIRECT bypasses the OS and sends the data directly to the storage device, a limitation is that the data size must be a multiple of the logical block size of the filesystem (man2, , open).
Estimating the IO cost (IO duration) for synchronized and direct IO is simpler than with caching levels involved, as we will see later. As the data goes directly to the storage device, the only overhead is the system-call handler of the OS. As a result, the cost of writing a single data chunk comes from two sources: first, the cost of making the sync write system call , and second, the cost of writing the data to the storage device. Additionally, if the data access follows a random pattern (, otherwise, ), we have extra seeking cost , as well. Hence, the IO cost of writing data of size in chunks (chunks may have different sizes) is defined as follows:
| (2) |
Equation 2 estimates the total IO cost when writing data of size in chunks using the direct and synchronized flags. As grows (data is written in smaller pieces), the observed cost grows because of the growing cost of system calls and seeks (when doing random access). Later, in Sect. 6, we compare this model with practical evaluation experiments.
4.3. Modeling Synchronized and Non-direct IO with System Calls
In the absence of the O_DIRECT flag, the OS copies the data into the page cache before writing it to the storage device. But still, when O_SYNC or O_DSYNC is passed to the open system call, the write call guarantees to return only when the data is synced to the storage device (after passing through the page cache). Alternatively, the process can open the file without these flags but enforce synchronization by calling the fsync system call after each write. The second case of Fig. 3 shows the path of data in this scenario.
The extra copying of data from the user space (application) into the kernel space (page cache) imposes a minor additional cost on the IO, compared to the direct and synchronized IO. As the IO is non-direct and passes through the OS, data sizes do not have to be multiples of the block size. The write system call now accepts any data size , where . The OS manages the data access and adjusts the data size, as follows: If is a multiple of the logical block size of the filesystem (), the OS transfers the data to the storage device. Otherwise (), first, the OS transfers the data in chunks of size as much as possible. For the remaining data (smaller than block size), the OS reads the corresponding block from the storage device (with the cost of ), applies the remaining data on the read block (), and writes the updated block back to the storage device () (blocksize_penalty, ). Notice the extra cost penalty for the non-fitting data sizes. The rest remains as in the case of synchronized and direct IO:
| (3) |
Equation 3 represents the observed cost when performing a synchronized non-direct IO of size , where is the data part that is transferred to the storage device in chunks, and is the remaining non-fitting part of the data for which we have a cost penalty. If the data size is divisible to the blocksize , then , and the equation is still valid. Here, we also see the extra cost of copying the data into the page cache before transferring it to the storage device. Following Eq. 3, the IO cost of writing the whole data consisting of chunks with the sizes is defined as:
| (4) | ||||
Later, in Sect. 6, we will evaluate these equations with our IO experiments and demonstrate the extra cost of non-fitting data sizes.
4.4. Modeling Non-synchronized IO with System Calls
If none of the O_DIRECT, O_SYNC, or O_DSYNC flags is specified, the OS copies the data to the page cache (see the second case of Fig. 3) as dirty pages instead of immediately transferring them to the storage device. Then, it is the responsibility of the OS to sync the data to the storage device in the background and keep the dirty rate between the and by adequately throttling the dirtier process, as discussed in Sect. 3.2. Before throttling begins, the process effectively observes , as the OS merely writes the data on the page cache and updates the data structures representing the target file.
Performing background synchronization is an expensive task, as the OS has to go through the pages and find appropriate candidate pages to be cleaned. The kernel is busier than usual, consumes CPU power, and accesses the main memory in the background. As a result, the process generating dirty pages in the page cache (writer) observes a reduced IO throughput to a certain extent when the kernel performs background synchronization (e.g., when the dirty rate exceeds the ). This is just a side-effect, as the kernel did not explicitly decide to throttle the process (e.g., when ). We consider this effect and denote the reduced bandwidth of ramdisk under the OS background synchronization as . Section 6 will show this effect on different hosts and for different scenarios. Also, we implemented a tool to measure of a platform.
In contrast to the previous cases, delays before IOs become relevant for non-synchronized IO. Here, the OS cleans dirty pages in the background during those delays and determines the task rate (IO throughput) according to the number of dirty pages on the page cache (see Sect. 3.2). The OS determines the values of and by multiplying the number of dirtyable pages by the and , as discussed in Sect. 3.2. Though, and can also directly be fetched from the file /proc/vmstat (vmstat, ) under Linux without computing the number of dirtyable pages and multiplying it with the and . The OS cleans the dirty pages older than the . The value of is fetched either using the sysctl command (under the name dirty_expire_centisecs) or by reading the file /proc/sys/vm/dirty_expire_centisecs under Linux (dirtylimits, ). If the number of pages is below , and there are no expired pages in the page cache, the OS does not perform background synchronization. We denote this state as . Otherwise, if the number of pages exceeds but is still below , or if there are expired pages, then the OS performs background flushes. We call this state . Lastly, if the number of pages exceeds , not only does the OS perform background flushes, but it also throttles the dirtier process by reducing its task rate (IO throughput). As a result, the process observes a higher IO cost. This state is denoted as .
In the following, we estimate the cost of non-synchronized IO with system calls. The behavior of IO throttling is too complex to fit in a single equation as in the previous cases. Therefore, we provide an algorithm to calculate the cost of non-synchronized IO in the procedure.
Procedure Syscall_IO_Cost (see Alg. 1)
The procedure gets the , , and the of the data chunk, as well as the before writing it, as inputs and estimates the observed cost of writing the data chunk. To approximate the IO cost of the th data chunk, should be called first for all the data chunks that happened before it, i.e., the data chunks . The reason is that, by each invocation, updates the global variables, such as the number of dirty pages and the average bandwidth. These global variables regulate the upcoming estimations. If the , s, and are known in advance, looping through them and calling predicts the costs for all chunks. Otherwise, can be called as soon as the and of the next data chunk of a and its are known.
The procedure updates the considering the and performs a background flush during the if the state is not (in , returns immediately). In 4 of Alg. 1, indicates the existence of expired pages. In the case of (no OS throttling), if the dirty rate exceeds the or some pages are expired (5: ), the process observes , as the OS is performing background sync (but does not explicitly throttle the process). Otherwise, if (7: ), the OS throttles the IO throughput and determines the task rate of the process by multiplying the average bandwidth (average task rate) by , as discussed in Sect. 3.2 (see 8). If the state is neither of the nor , we are in , and the task rate stays . Because, during , the write system call returns as soon as the data chunk is copied into the page cache, the process effectively observes the Ramdisk bandwidth .
Data: & : storage device and Ramdisk bandwidth
& : dirty background & dirty thresholds
: dirty page expire time
: ramdisk bandwidth under OS background sync
Struct:
Global: , , empty list
, ,
Inputs: : the metadata of the data chunk
: the delay before writing the data chunk
(continued )
Next, 11 inserts the metadata of the data chunk into the page cache model (explained in the next section). 12 maintains the average bandwidth according to (avgbw, ), and 13 updates and (time of performing IO without the delays). Lastly, is called again to take account of the pages that were cleaned during in the background and to update the number of dirty pages accordingly. If the state is , does nothing and returns immediately.
4.4.1.
We model the granularity of data in the page cache as s, i.e., data structures of . , , and describe the location of data, indicates the finish time of the IO, and specifies if the data is in the active or inactive cache. Our cache model keeps the metadata as s rather than keeping track of every page. This is similar to the approach of Hoang-Dung (do2021modeling, ) that extends the WRENCH workflow simulator (wrench, ) to take the Linux cache into account. To insert the metadata of the new () in the cache, the procedure finds the blocks in the cache that overlap with the , considering the , , and (17). The loop at 19 to 28 loops through (overlapping blocks), and for each pair of and , splits the data into the overlapping and non-overlapping (disjunct) parts. Different parts of the data are again inserted in the active or inactive cache as follows: The non-overlapping parts of with unchanged , the non-overlapping parts of with (inactive cache), as they are accessed only once (first access), and the overlapping part with (active cache), as they are accessed more than once.
The parameter indicates the duration we have for background flushing. The loop at 31 to 40 repeats as long as pages exceed or there are expired pages (as long as sync is to be performed). The procedure balances the number of active and inactive pages by marking some old active pages as inactive (activecache, ). 33 chooses an inactive with the lowest (the oldest inactive data) as the next in the cache to be evicted (). If during the can be synced completely (34), it is removed from the cache, otherwise, is reduced (synced) as much as the allows (38). Notice that the seeking cost and the block size penalty are absent when estimating the cost of non-synchronized IO. The page cache accumulates the IO operations smaller than the block size with other accesses to the same block and transfers them to the storage device in the granularity of pages. Also, even when the OS has to perform seeks or faces block size penalties, it all happens in the background and is transparent to the process.
4.5. Modeling Standard-Library IO
The C standard library provides a set of IO functions on top of the system calls, as discussed in Sect. 2.2. The library IO functions work with a buffer of size in the user space. fwrite writes the data into the user space buffer instead of immediately invoking a system call to perform the IO. This way, it spares the cost of making frequent system calls. When the buffer is full, fwrite invokes a system call (e.g., write) to transfer the buffer’s aggregated data into the page cache and empty the buffer. The third case of Fig. 3 illustrates the data path to the storage device in this scenario. Same as the model of non-synchronized IO with system calls, estimating the IO cost for library IO is too complex to fit in a single equation. Hence, we provide the procedure to calculate the IO cost for library IO.
The procedure (see Alg. 2) gets the , , and the of the data chunk, as well as the before writing it, as inputs and estimates the observed cost of writing the data chunk. Similar to , the data chunks should be passed to in order.
First, at 42, the procedure checks whether the IO is sequential (i.e., fseek is not called and the points to the subsequent location of the last IO, ). If the is changed (random access), the buffer must be flushed to the OS page cache before filling it with the new data. Accordingly, the model accounts for the cost of invoking the system call at 44. Here, points to the offset of buffered data, indicates the data size in the buffer, and keeps track of the accumulated delay until the next system call invocation (). Next, if the data fits in the buffer (46), the process merely observes the cost of writing the data in the user space buffer (). Accordingly, updates the data size in the buffer (the global variable ) and accumulates the time (delay) until the next system call (the global variable ).
Data: : memory bandwidth
: size of the standard library IO buffer
Global: , ,
Inputs: , , : the metadata of the data chunk
: the delay before writing the data chunk
Otherwise, if the data does not fit in the buffer, fwrite fills the buffer with the data as far as possible (modeled at 50) and invokes a system call to write the buffer in the page cache, as modeled at 52. Next, if the leftover data () is still larger than the buffer (54), fwrite invokes a second system call to write the remaining data (adjusted according to ) at once to the page cache without buffering (modeled at 55). Notice that fwrite invokes the second system call after the first one, at 52, without delay ( passed to ). Finally, if the size was not a multiple of , fwrite buffers the leftover (modeled at 56). Notice that throughout all these steps, our algorithm accumulates accordingly. If fwrite is called to write large chunks, the observed cost converges to the cost of the write system call because in that case fwrite writes most of the data without buffering them in the user space (see 55). The minor extra cost of copying several kilobytes of the leftovers in the user space buffer with the plain memory bandwidth is negligible compared to the cost of a system call that writes large data. By calling fflush, a system call is invoked to move the buffer data to the page cache and empty the buffer.
Notice that the IO operations of other libraries or languages (e.g., fstream of C++) buffer the data up to several kilobytes, as well, and follow almost similar concepts as . Hence, our algorithm is not limited to the IO operations of the C standard library but can also be adjusted to estimate the IO cost in other cases with fixed buffer sizes.
5. Related Work
SimGrid (simgrid, ) is a simulation framework that models the performance of distributed and undistributed applications. It can model the CPU, network, IO, etc. and estimate the cost of running applicatrions on a specific host. To model the performance of IO operations, SimGrid disregards the OS caches and divides the data size to the bandwidth of the storage device (naïve approach). In Sect. 6, we compare our model CAWL with SimGrid regarding the IO modeling and show the extent of inaccuracy of the SimGrid model and the importance of considering cache effects.
Hoang-Dung et al. (do2021modeling, ) propose an IO simulation model and consider some properties of the Linux page cache mechanism. They aim to improve the accuracy of the WRENCH workflow simulation framework (wrench, ) by taking the Linux page cache into account. They simulate the behavior of the active and inactive cache of Linux to keep track of data blocks, whether they are read from the page cache or the storage device. This way, they improve the WRENCH performance model for reading data. Though, they do not present any results on the write performance, nor do they cover the OS throttling behavior and the relevant Linux parameters to regulate the dirty pages in the page cache, such as , , , etc.
The Linux kernel documentation (linuxdoc, ) contains more details on the discussed parameters and also some hardware-specific parameters of storage devices (queue length, buffer size, physical block size, etc.) that define the raw performance behavior of a particular storage device (though discussing the hardware-specific parameters is beyond the scope of our paper).
In the domain of storage device performance modeling, Huang (ssdmodel, ) models the performance of SSD devices based on their hardware architecture and machine learning techniques. As opposed to our model, Huang et al. (ssdmodel, ) do not consider the OS and library caching mechanisms. Instead, the model describes specifically SSDs at a lower level. Yagdar et al. (ssdcat, ) analyzed the IO workloads of SSDs and the amplifying page size effects on the read and write operations. Though similar to Huang’s approach, Yagdar’s study is very specific to SSDs and dives into the SSD hardware architecture. Desnoyers (Desnoyers14, ) explores the write amplification of SSDs under random IO considering their internal page management and models the performance of SSDs at a lower level (SSD-internal) for hot and cold data. Another effort to model SSD performance is done by Kim (KimCLK21, ) which similar to our methodology, predicts the latency of the next access to the SSD considering key performance-critical features. IOSIG (iosig, ) is a GCC plugin that enables the C/C++ software developers to pack their knowledge on the application’s IO into the source code using C/C++ pragma notions and in the form of a set of parameters. Then, IOSIG uses a cost model to predict the IO throughput of the application considering the defined parameters, and chooses the best-fitting storage device for the application. This is analog to our work in the sense of describing the IO cost using a model. Though, also IOSIG does neither take the cache management of the OS nor the C standard library buffer into account. Another approach to characterize workloads of different patterns if done in (GuzLSB18, ), where the block-level IO traces of billions of IO requests from two large Cloud systems are analyzed for load balancing, cache-efficiency, and storage cluster management. In this regard, our findings and measurements could be used to analyze Cloud workloads to increase cache-efficiency and improve load balancing.
Lebre et al. (lebre2015adding, ) provide an extension for SimGrid to simulate storage capabilities on distributed computing systems. They take the network infrastructure of the storage system, device characteristics, interconnections between processes, resource sharing, etc. into account and model the storage performance of the distributed application as a whole. CART models (cart, ) provide a black-box machine learning algorithm that are trained with the gained performances of a storage device for different workloads and learn the device’s behavior without having any knowledge about the device.
6. Evaluation
We evaluate our model CAWL with regard to the actual IO costs in different experiments and compare the accuracy of it with the IO model of the SimGrid (simgrid, ) simulation framework. SimGrid estimates the IO costs naively by dividing the data size to the bandwidth of the storage device. Hence, it disregards the involved caches of the OS and the C standard library. We perform experiments in different scenarios, on different hosts and storage devices. Although, due to space limitations, we have to confine to a subset of representative experiments on two hosts represented in Table 1. For each plot we present the average relative errors of the models ( and ) compared to the actual IO costs. Moreover, Improvement is defined for each plot to demonstrate the estimation improvement achieved by CAWL compared to SimGrid. The durations of performing IO simulations (without the actual experiments) of CAWL and SimGrid on host 1 were for both of them in most of the cases.
| Host 1: RAID 5 Host | Host 2: SSD Host | |
|---|---|---|
| CPU | 4Intel Xeon Platinum 8353H | 2 Intel Xeon E5-2630v3 |
| CooperLake @ 2.50 GHz | ||
| RAM | 384 GB (DDR4-3200 RDIMM) | 64 GB |
| Storage | 4 5.8 TB NVMe (Raid5) | 500 GB V-NAND SSD |
| Device | Model: Intel SS PHLN12320 | Model: Samsung 850 EVO |
| Filesystem: ext4 | Filesystem: ext4 | |
| Logical sector size: 512 B | Logical sector size: 512 B | |
| OS | CentOS Stream release 8 | Debian 5.10.120-1 |
| Kernel: | Kernel: | |
| 4.18.0-394.el8.x86_64 | 5.10.0-15-amd64 | |
| sysctl | dirty_background_ratio: 10% | dirty_background_ratio: 10% |
| dirty_ratio: 40 % | dirty_ratio: 20 % | |
| dirty_expire_centisecs: 3000 | dirty_expire_centisecs: 3000 |
6.1. Benchmarking Tool
To estimate the IO cost, our model requires different system parameters, as discussed in Sect. 4. Hence, we developed a benchmarking tool in C++ that detects, fetches, or measures all the required parameters in a system and stores them in a config file (cawlgit, ).
Memory bandwidth () is defined by measuring the costs of copying large data chunks in the memory. To measure , the benchmarking tool periodically issues large IO requests—one after each other—until the rate of the dirty pages reaches the . At this point the OS starts to sync in the background. Hence, the is defined by continuing to issue IO requests and measuring the increased IO costs. To measure the device bandwidth and system call costs, IO requests of two different size ranges are issued to the device (using the O_DIRECT flag). IO chunks with a range of small sizes (e.g., a few kilobytes) are performed repeatedly (to get a reasonable average cost for each size), and the resulting costs are analyzed using linear regression to fetch the system call cost (). Theoretically, we could also get the device bandwidth by the linear regression analysis. Though, to get a more consistent average device bandwidth (), we perform more IO requests with a range of large sizes and again analyze the IO costs using linear regression to get the device bandwidth.
The logical block size is fetched from /sys/block/sdX/queue/logical_block_size, and the dirty page expire time from /proc/sys/vm/dirty_expire_centisecs. The and are read from /proc/vmstat (under the names nr_dirty_threshold and nr_dirty_background_threshold). The buffer size of the C library is determined using the builtin function __fbufsize (fbufsize, ). After running our benchmarking tool (cawlgit, ) on the two hosts, all required parameters are determined automatically and stored to a config file. Our model (also implemented in C++ (cawlgit, )) uses the config file to estimate the IO cost in different scenarios.
6.2. Evaluating Synchronized and Direct IO with System Calls
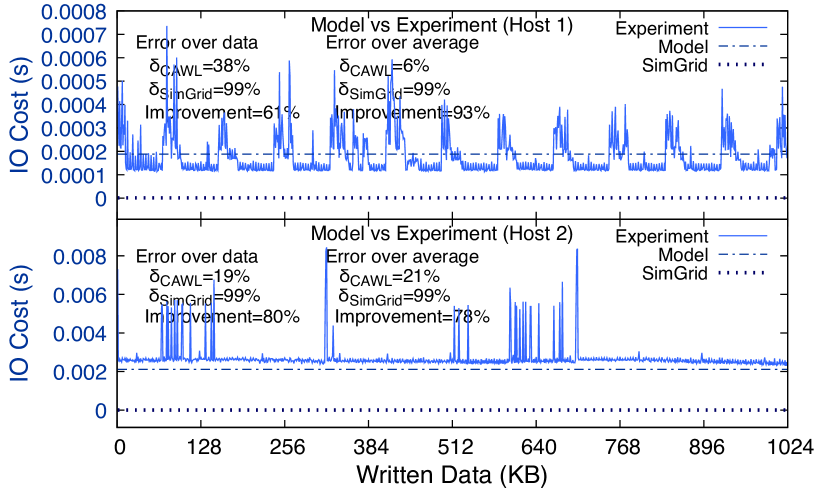
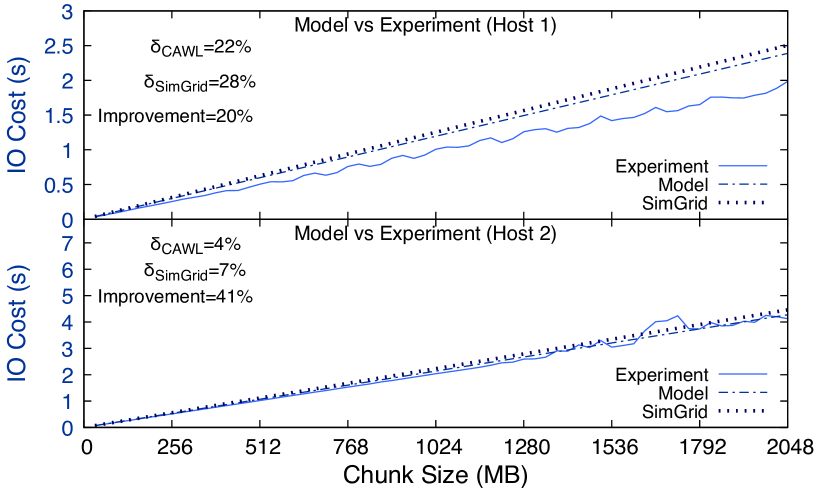
In the case of direct IO, the OS does not come in between (see the case 1 of Fig. 3), and the data goes directly to the storage device. Figure 4(a) compares the model predictions (CAWL and SimGrid) with the IO costs of writing data chunks, each of size (i.e., data in total), on the two hosts with different storage devices. The IO costs on host 1 follow a repeating pattern of peaks and troughs. The shape of this pattern is determined by the specifications of the storage device’s queue, such as the maximum number of requests (devqueue, , nr_requests), maximum segments and segment size (devqueue, , max_segments, max_segment_size), and other hardware/middleware specifications. Since discussing the storage-device-specific parameters are beyond the scope of our work we make generic assumptions in our model. Because of this pattern, we also added the relative error (i.e., the absolute error divided by the actual value) of the estimations compared to the average IO costs on the plot. As you see, CAWL provides reasonably well generic approximations of the overall performance of the storage devices with an average relative errors of on hosts 1 & 2, while SimGrid underestimates the IO costs with relative error on both hosts because it disregards the system call costs, which are non-negligible in this case. Additionally, Fig. 4(b) compares the measured direct IO costs with the model for a range of IO chunks between – on the two hosts.
6.3. Evaluating Synchronized, Non-direct IO with System Calls
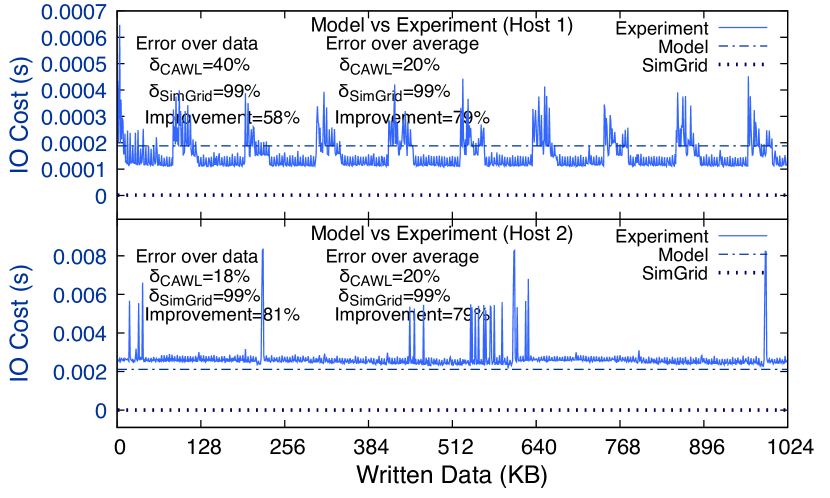
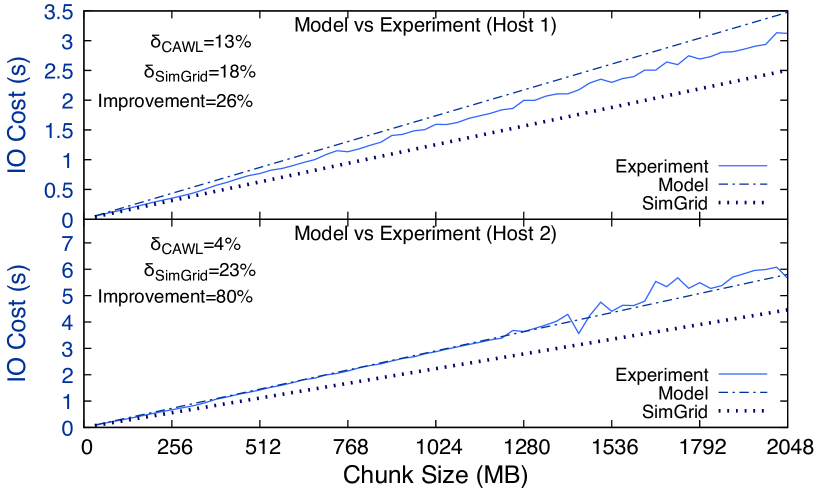
Figure 5(a) compares the predictions of the models with the actual IO costs of writing data chunks of size , with synchronized non-direct IO on the two hosts. Here, we have the fixed extra cost of copying into the OS cache. Hence, the pattern of IO costs is similar to the direct IO (Fig. 4(a)) with a minor extra overhead. The copying overhead is negligible compared to the system call cost and hence is hardly visible on Fig. 5(a). But it is observable in Fig. 5(b), which compares the models with the costs of writing data chunks of different sizes between – on the two hosts. As you see, the SimGrid model fails to follow along the actual IO costs (relative error ) since it does not account for the copying overhead. On the other hand, CAWL takes this effect into account and predicts the IO costs with a relative error (an overall estimation improvements of respectively).
6.4. Evaluating Non-Synchronized IO with System Calls
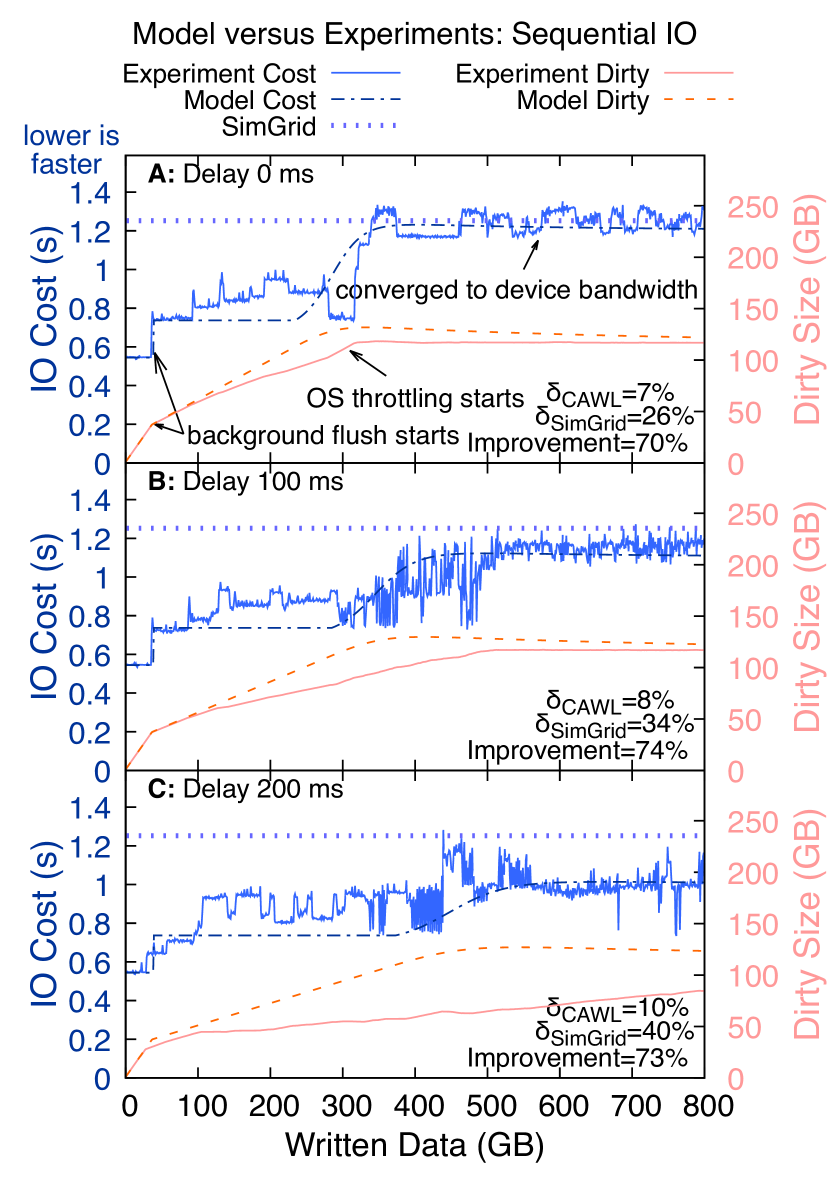
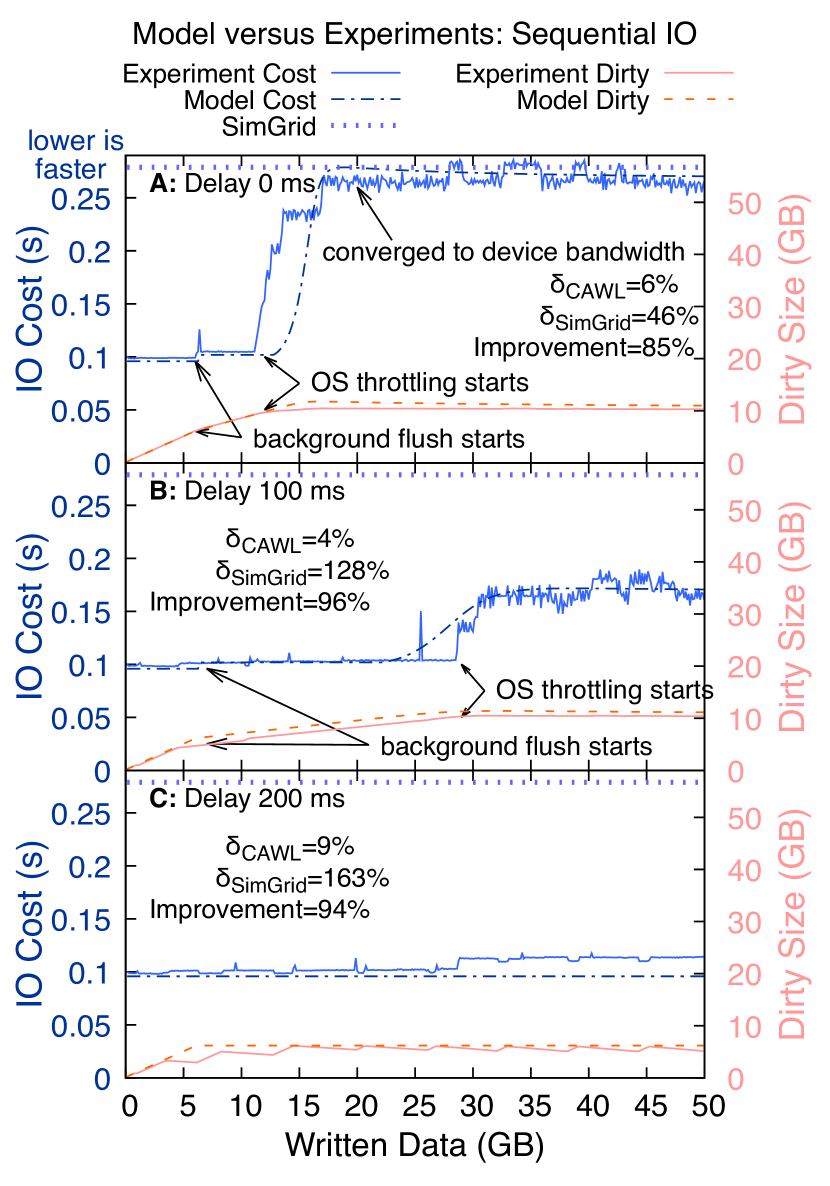
For non-synchronized IO with system calls, the OS caches the data before writing it to the storage device. Section 4.4 discussed the effects of and . Here, we evaluate the model in two cases of (host 1) and (host 2). Figure 6-A compares the measured non-sync IO costs with the model values of CAWL and SimGrid for writing and data in and chunks sequentially on hosts 1 (left) and 2 (right), respectively. As expected, SimGrid cannot appropriately predict the IO cost with the OS cache involved, constantly estimating the performance of the storage device. In this case, SimGrid overestimates the IO costs, as opposed to the previous cases where it underestimated the IO costs. CAWL on the other hand, reasonably models the IO costs and smoothly follows the actual costs. Moreover, CAWL correctly predicts the points where the background flushing and throttling of the OS starts (annotated on the plots). CAWL also considers the computations between IO operations. The right-hand y-axis of plots represents the actual amount of dirty pages in the system, as well as the approximation of the dirty amount by CAWL. Figure 6-B and Fig. 6-C show the comparison between the experiments and the model values for writing and data in and chunks sequentially (on hosts 1 (left) and 2 (right), respectively) and computing for and (hashing random data) before writing each chunk. In this case, CAWL takes the ongoing background flush during the computation into account and still estimates the IO costs reasonably well.
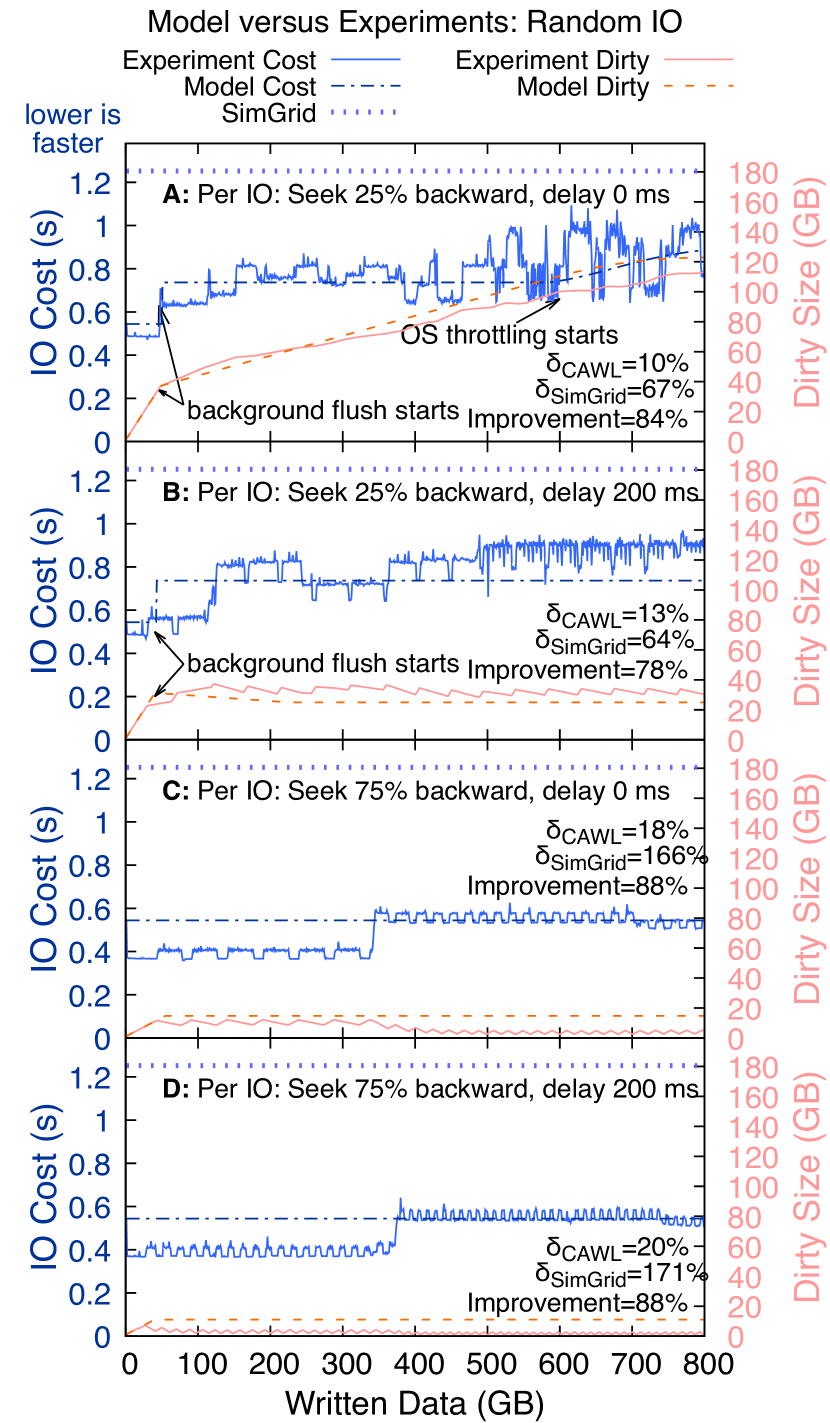
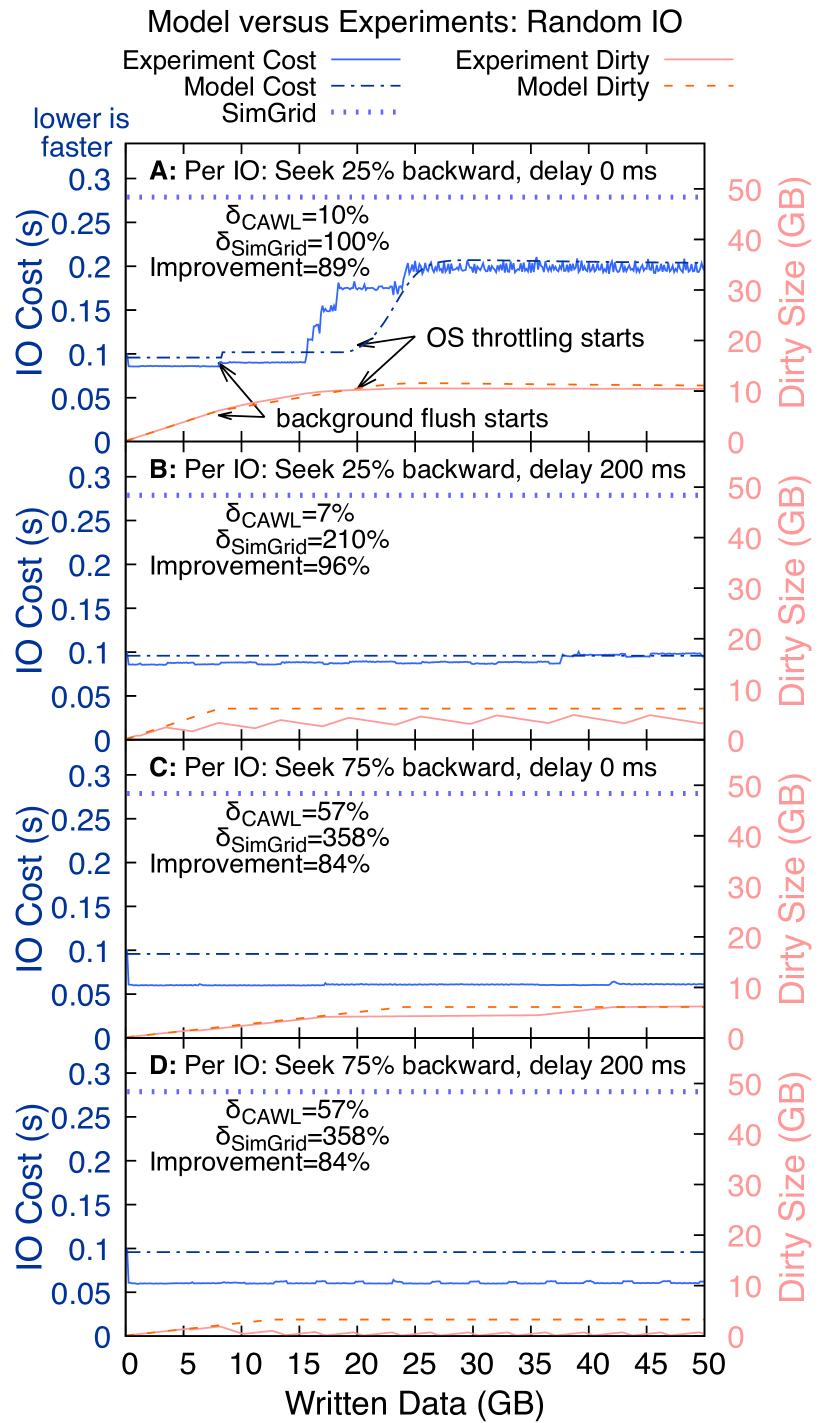
CAWL does not only take the computations before IO into account, but also considers the randomness of IO. Figure 7 compares the values of CAWL, SimGrid, and the experimental results in the case of random IO when having the following situations before writing each subsequent data chunk:
-
(A)
no computation (delay = ), seek backward to rewrite the last of the written data (rewrite of chunk size). Hence, of each data chunk is new data.
-
(B)
compute for , seek backward to rewrite the last of the written data.
-
(C)
no computation, seek backward to rewrite the last of the written data (rewrite of chunk size).
-
(D)
compute for , seek backward to rewrite the last of the written data.
Considering the relative errors of both models compared to the actual IO costs, overall, the results suggest that CAWL usually estimates the IO cost with a relative error less than , which is to more accurate than SimGrid.
6.5. Modeling Library IO
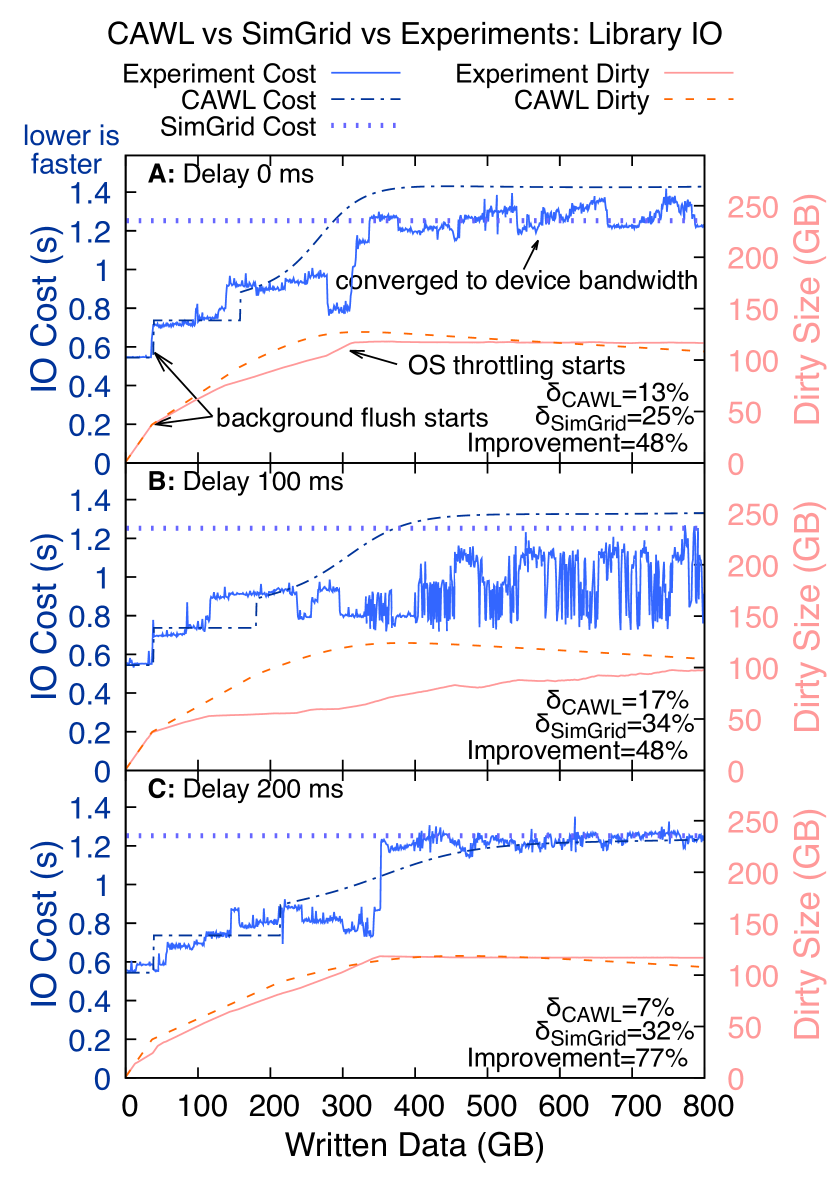
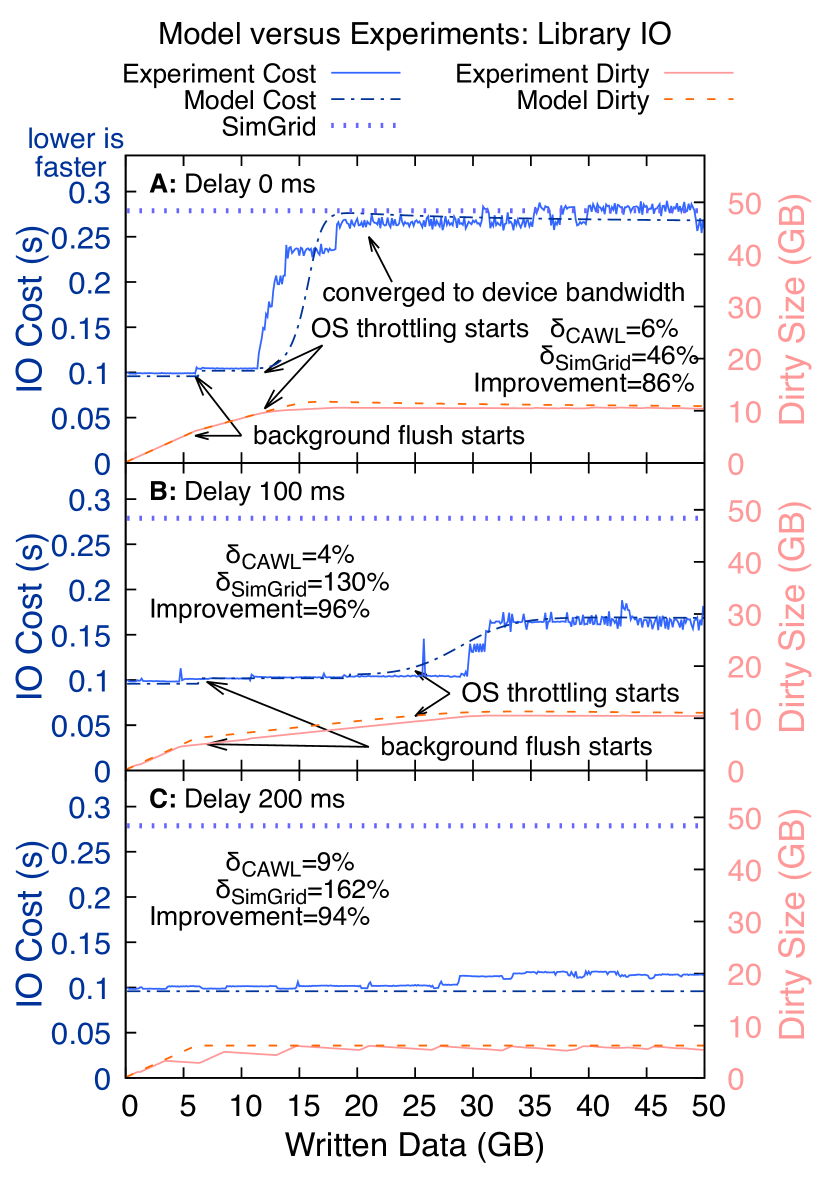
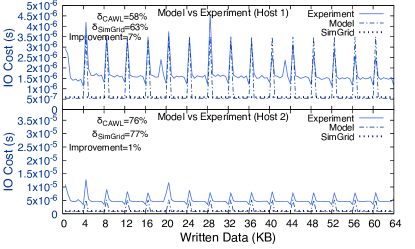
Lastly, Fig. 8 compares the measured IO costs with the estimations of CAWL and SimGrid when using C standard library IO to write and (on the hosts 1 (left) and 2 (right), respectively) in and chunks and delays of (no delays), , and . In addition, we discussed the buffer of the C standard library and considered its effect in CAWL. Figure 9 illustrates this effect in the case of writing of data in chunks.
7. Conclusion
We presented CAWL, a model designed to assess the IO costs by taking into account the Linux kernel page cache and the C standard library IO buffer. Our model effectively captures the IO costs of various types of operations, including sequential and random IO, with and without computational tasks interspersed, across multiple classes of IO operations. By comparing our model with the SimGrid IO model, we demonstrated that the latter can suffer from significant underestimation or overestimation of IO costs, particularly in IO-intensive applications due to its simple IO model that does not consider caches and buffers. As a plug-in, CAWL could complement SimGrid’s capability in this area.
Furthermore, our model achieved a high level of accuracy, accurately predicting IO costs at around 80–90 %, while considering different scenarios and the presence of caches. These findings, along with our measurements of Linux page cache management, have practical implications in both Cloud environments, where they can enhance cache efficiency and load balancing, and in high-performance computing (HPC) environments, where they can be utilized to simulate the lifespan of workflows.
The model parameters of CAWL and their influence could also provide valuable insights for hardware design. By considering various scenarios and caches, CAWL’s accurate estimations of IO costs can guide cache design, optimize storage systems, and facilitate system-level performance analysis. Hardware designers could leverage CAWL’s model parameters to make informed decisions with a better understanding of practical IO costs, leading to efficient resource allocation, reduced latency, and enhanced performance of their storage architectures.
You can find the implementation of our model, as well as our benchmarking tool that detects different system parameters required by the model on Github (cawlgit, ).
Acknowledgment
This work received funding from the German Ministry for Education and Research as BIFOLD–Berlin Institute for the Foundations of Learning and Data (ref. 01IS18025C) and the German Research Foundation (DFG) as part of CRC 1404 FONDA. We thank ZIB’s core facility and NHR@ZIB units for providing compute resources.
References
- (1) H. Casanova, A. Giersch, A. Legrand, M. Quinson, and F. Suter, “Versatile, scalable, and accurate simulation of distributed applications and platforms,” J. Parallel Distributed Comput., vol. 74, no. 10, pp. 2899–2917, 2014. [Online]. Available: https://doi.org/10.1016/j.jpdc.2014.06.008
- (2) H. Casanova, R. F. da Silva, R. Tanaka, S. Pandey, G. Jethwani, W. Koch, S. Albrecht, J. Oeth, and F. Suter, “Developing accurate and scalable simulators of production workflow management systems with WRENCH,” Future Gener. Comput. Syst., vol. 112, pp. 162–175, 2020. [Online]. Available: https://doi.org/10.1016/j.future.2020.05.030
- (3) R. Love, Linux system programming — talking directly to the kernel and C library. O’Reilly Media, Inc., 2013.
- (4) ISO, ISO/IEC 9899:2018 Information technology — Programming languages — C. International Organization for Standardization, Jun. 2018. [Online]. Available: https://www.iso.org/standard/74528.html
- (5) N. M. Josuttis, The C++ standard library: a tutorial and reference. Addison-Wesley, 2012.
- (6) “The Linux kernel,” Aug. 2022, accessed: 9. Aug. 2022. [Online]. Available: https://www.kernel.org/
- (7) “Kernel mode definition,” 2006. [Online]. Available: http://www.linfo.org/kernel_mode.html
- (8) R. Love, Linux Kernel Development, Third Edition. Pearson Education, 2010.
- (9) Linux manual pages: section 2. [Online]. Available: https://man7.org/linux/man-pages/dir_section_2.html
- (10) Linux manual pages: section 3. [Online]. Available: https://man7.org/linux/man-pages/dir_section_3.html
- (11) “global_dirtyable_memory,” Feb. 2022, accessed: 1. Feb. 2022. [Online]. Available: https://github.com/torvalds/linux/blob/v5.16/mm/page-writeback.c#L356
- (12) “Documentation for /proc/sys/vm/,” 2008. [Online]. Available: https://www.kernel.org/doc/html/latest/admin-guide/sysctl/vm.html
- (13) sysctl(8) — Linux manual page, Feb. 2020. [Online]. Available: https://www.man7.org/linux/man-pages/man8/sysctl.8.html
- (14) “Double CLOCK lists,” Aug. 2022, accessed: 9. Aug. 2022. [Online]. Available: https://github.com/torvalds/linux/blob/6614a3c3164a5df2b54abb0b3559f51041cf705b/mm/workingset.c
- (15) J. Corbet, “Fixing writeback from direct reclaim,” Jul. 2010. [Online]. Available: https://lwn.net/Articles/396561/
- (16) W. Fengguang, “writeback: IO-less balance_dirty_pages(),” Aug. 2010. [Online]. Available: https://lore.kernel.org/lkml/20101213064837.282917939@intel.com/#t
- (17) J. Corbet, “No-I/O dirty throttling,” Aug. 2011. [Online]. Available: https://lwn.net/Articles/456904/
- (18) “Dirty position control,” Feb. 2022, accessed: 1. Feb. 2022. [Online]. Available: https://github.com/torvalds/linux/blob/v5.16/mm/page-writeback.c#L817
- (19) W. Fengguang, “writeback: dirty position control,” Oct. 2011. [Online]. Available: https://lore.kernel.org/lkml/20110826114618.880707958@intel.com/
- (20) ——, “writeback: dirty ratelimit - think time compensation,” Dec. 2011. [Online]. Available: https://lore.kernel.org/lkml/20110826114619.531760091@intel.com/
- (21) P. Zijlstra, “mm: per device dirty threshold,” Oct. 2007. [Online]. Available: https://lkml.iu.edu/hypermail/linux/kernel/0704.2/0409.html
- (22) J. Corbet, “Smarter write throttling,” Aug. 2007. [Online]. Available: https://lwn.net/Articles/245600/
- (23) ——, “Writeback and control groups,” Jun. 2015. [Online]. Available: https://lwn.net/Articles/648292/
- (24) T. Heo, “writeback: implement foreign cgroup inode bdi_writeback switching,” May 2015. [Online]. Available: https://lwn.net/Articles/645706/
- (25) S. Kitt, “Linux page cache performance versus memcpy,” Jan. 2022. [Online]. Available: https://unix.stackexchange.com/a/686564/495283
- (26) F. Giesen, “Reading and writing are less symmetric than you (probably) think,” Oct. 2015. [Online]. Available: https://fgiesen.wordpress.com/2015/10/25/reading-and-writing-are-less-symmetric-than-you-probably-think/
- (27) vmstat(8) — Linux manual page, Jun. 2020. [Online]. Available: https://www.man7.org/linux/man-pages/man8/vmstat.8.html
- (28) W. Fengguang, “writeback: bdi write bandwidth estimation,” Jul. 2011. [Online]. Available: https://lore.kernel.org/lkml/20110629145553.906668553@intel.com/
- (29) H. Do, V. Hayot-Sasson, R. F. da Silva, C. Steele, H. Casanova, and T. Glatard, “Modeling the Linux page cache for accurate simulation of data-intensive applications,” in IEEE International Conference on Cluster Computing, CLUSTER 2021, Portland, OR, USA, September 7-10, 2021. IEEE, 2021, pp. 398–408. [Online]. Available: https://doi.org/10.1109/Cluster48925.2021.00058
- (30) “The Linux kernel documentation,” 2008, accessed: 5. Jul. 2022. [Online]. Available: https://www.kernel.org/doc/html/latest/index.html
- (31) H. H. Huang, S. Li, A. S. Szalay, and A. Terzis, “Performance modeling and analysis of flash-based storage devices,” in IEEE 27th Symposium on Mass Storage Systems and Technologies, MSST 2011, Denver, Colorado, USA, May 23-27, 2011, A. Brinkmann and D. Pease, Eds. IEEE Computer Society, 2011, pp. 1–11. [Online]. Available: https://doi.org/10.1109/MSST.2011.5937213
- (32) G. Yadgar, M. Gabel, S. Jaffer, and B. Schroeder, “SSD-based workload characteristics and their performance implications,” ACM Trans. Storage, vol. 17, no. 1, pp. 8:1–8:26, 2021. [Online]. Available: https://doi.org/10.1145/3423137
- (33) P. Desnoyers, “Analytic models of SSD write performance,” ACM Trans. Storage, vol. 10, no. 2, pp. 8:1–8:25, 2014. [Online]. Available: https://doi.org/10.1145/2577384
- (34) J. Kim, K. Choi, W. Lee, and J. Kim, “Performance modeling and practical use cases for black-box SSDs,” ACM Trans. Storage, vol. 17, no. 2, pp. 14:1–14:38, 2021. [Online]. Available: https://doi.org/10.1145/3440022
- (35) M. Gholami and F. Schintke, “IOSIG: declarative I/O-stream properties using pragmas,” Datenbank-Spektrum, vol. 22, no. 2, pp. 109–119, 2022. [Online]. Available: https://doi.org/10.1007/s13222-022-00419-w
- (36) Z. Guz, H. H. Li, A. Shayesteh, and V. Balakrishnan, “Performance characterization of NVMe-over-Fabrics storage disaggregation,” ACM Trans. Storage, vol. 14, no. 4, pp. 31:1–31:18, 2018. [Online]. Available: https://doi.org/10.1145/3239563
- (37) A. Lebre, A. Legrand, F. Suter, and P. Veyre, “Adding storage simulation capacities to the SimGrid toolkit: Concepts, models, and API,” in 15th IEEE/ACM International Symposium on Cluster, Cloud and Grid Computing, CCGrid 2015, Shenzhen, China, May 4-7, 2015. IEEE Computer Society, 2015, pp. 251–260. [Online]. Available: https://doi.org/10.1109/CCGrid.2015.134
- (38) M. Wang, K. Au, A. Ailamaki, A. Brockwell, C. Faloutsos, and G. R. Ganger, “Storage device performance prediction with CART models,” in 12th International Workshop on Modeling, Analysis, and Simulation of Computer and Telecommunication Systems (MASCOTS 2004), 4-8 October 2004, Vollendam, The Netherlands, D. DeGroot, P. G. Harrison, H. A. G. Wijshoff, and Z. Segall, Eds. IEEE Computer Society, 2004, pp. 588–595. [Online]. Available: https://doi.org/10.1109/MASCOT.2004.1348316
- (39) M. Gholami and F. Schintke, “The implementation of CAWL model and the benchmarking tool,” https://github.com/gongotar/iomodel.
- (40) __fbufsize(3) - Linux man page. [Online]. Available: https://linux.die.net/man/3/__fbufsize
- (41) J. Axboe, “Linux kernel documentation, queue sysfs files.” [Online]. Available: https://www.kernel.org/doc/html/v5.4/block/queue-sysfs.html