GMS-3DQA: Projection-based Grid Mini-patch Sampling for 3D Model Quality Assessment
Abstract.
Nowadays, most 3D model quality assessment (3DQA) methods have been aimed at improving accuracy. However, little attention has been paid to the computational cost and inference time required for practical applications. Model-based 3DQA methods extract features directly from the 3D models, which are characterized by their high degree of complexity. As a result, many researchers are inclined towards utilizing projection-based 3DQA methods. Nevertheless, previous projection-based 3DQA methods directly extract features from multi-projections to ensure quality prediction accuracy, which calls for more resource consumption and inevitably leads to inefficiency. Thus in this paper, we address this challenge by proposing a no-reference (NR) projection-based Grid Mini-patch Sampling 3D Model Quality Assessment (GMS-3DQA) method. The projection images are rendered from six perpendicular viewpoints of the 3D model to cover sufficient quality information. To reduce redundancy and inference resources, we propose a multi-projection grid mini-patch sampling strategy (MP-GMS), which samples grid mini-patches from the multi-projections and forms the sampled grid mini-patches into one quality mini-patch map (QMM). The Swin-Transformer tiny backbone is then used to extract quality-aware features from the QMMs. The experimental results show that the proposed GMS-3DQA outperforms existing state-of-the-art NR-3DQA methods on the point cloud quality assessment databases for both accuracy and efficiency. The efficiency analysis reveals that the proposed GMS-3DQA requires far less computational resources and inference time than other 3DQA competitors. The code is available at https://github.com/zzc-1998/GMS-3DQA.
1. Introduction
Three-dimensional (3D) models, such as point clouds and meshes, have garnered extensive attention and are widely utilized in communication systems, virtual/augmented reality (V/AR), auto-driving, and other applications (Graf et al., 2006). Due to the distinctive data structure and novel processing methodologies, the complexity of distortion for 3D models surpasses 2D images and 2D videos, where large amounts of quality assessment methods have been proposed (Gu et al., 2015; Li et al., 2015; Yang et al., 2019; Zhai et al., 2021; Liu et al., 2020a; Zhang et al., 2023a, 2021b, f, d, 2024). Generally speaking, 3D models are frequently affected by geometry/color noise as well as compression distortion incurred during the generation and broadcasting process (Li et al., 2020; Mekuria et al., 2016a; Liu et al., 2020b, 2021b). Therefore, a reliable and efficient quality assessment metric is eagerly needed for quantifying, monitoring, and optimizing the quality of 3D-based applications.
To address these issues, numerous approaches have been proposed to evaluate the visual quality of degraded 3D models, known as 3D model quality assessment (3DQA) methods. 3DQA methods can be broadly divided into two categories: model-based and projection-based methods. Model-based 3DQA methods involve the direct extraction of features from 3D models, which are known for their intricacy. Therefore, researchers lean towards the utilization of projection-based 3DQA methods. Unlike model-based 3DQA methods that extract features directly from the 3D models, projection-based methods evaluate the quality of 3D models through rendered 2D projections. This kind of approach capitalizes on mature 2D vision technology to achieve cost-effective performance. However, projections are highly dependent on the viewpoint and a single projection may not cover sufficient quality information. To tackle this challenge, many projection-based 3DQA methods (Yang et al., 2020a; Liu et al., 2021c; Fan et al., 2022; Zhang et al., 2023b; Zhou et al., 2023; Zhang et al., 2023g, e) employ multi-projections to help improve performance as well as robustness and it has been firmly proven that using multi-projections is superior to using single projection. Unfortunately, the multi-projection strategy often entails additional rendering time and high computational demands.
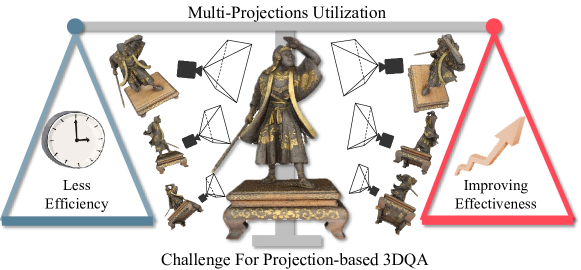
To guarantee efficiency and effectiveness, the core contradiction (shown in Fig. 1) that needs to be resolved is how to use the multi-projection information while reducing the inference time as much as possible. Therefore, in this paper, we propose a projection-based Grid Mini-patch Sampling 3D Model Quality Assessment (GMS-3DQA) method to deal with this problem. Specifically, six perpendicular viewpoints are fixed for rendering projections, which have been adopted as the common rendering setup in many 3DQA-related works (Yang et al., 2020a; Graziosi et al., 2020). The computational cost of rendering these projections is within acceptable limits, and the predefined viewpoints eliminate the need for additional time spent on viewpoint selection, thereby enhancing efficiency. Inspired by the success of grid mini-patch sampling proposed in (Wu et al., 2022a, b, c), we split the projections into grid mini-patch maps, which serve to depict the quality patterns of the 3D models. Afterward, we randomly sample mini-patches from each viewpoint and splice the mini-patches into one quality mini-patch map (QMM) for evaluation. The use of a single QMM to assess the quality of the 3D models instead of extracting features from each projection results in improved efficiency (as detailed in Section 4.6). The QMM has the added benefit of aggregating quality information across different viewpoints and mitigating the negative effects of information redundancy among the projections, thereby improving both performance and robustness (as discussed in Sections 4.5 and 4.10). The Swin Transformer (Liu et al., 2021a) has a hierarchical structure and processes inputs with patch-wise operations, therefore it is naturally suitable for processing grid mini-patch maps (Wu et al., 2022a). Then the Swin Transformer tiny is used as the backbone and the fully-connected layers are used to regress the features into quality scores.
The proposed GMS-3DQA is validated on both point cloud quality assessment (PCQA) and mesh quality assessment (MQA) tasks, of which the validated databases include the SJTU-PCQA (Yang et al., 2020a), WPC (Liu et al., 2022a), CMDM (Nehmé et al., 2021) and TMQ (Nehmé et al., 2022). The experimental results show that GMS-3DQA outperforms all the comparing NR-3DQA methods on the SJTU-PCQA, WPC, and TMQ databases, surpassing the second-ranked method by margins of 7%, 4.2%, and 45.6% respectively. The efficiency analysis demonstrates that GMS-3DQA is 3.28 times faster than the fastest comparing 3DQA methods on CPU with fewer parameters and FLOPs. The cross-database validation demonstrates the generalized capabilities and stability of GMS-3DQA, showing that it is able to handle unseen 3D content with different captured methods. Furthermore, the cross-domain evaluation highlights its potential to address QA tasks in a target 3D domain that lacks sufficient annotations, by leveraging the knowledge acquired from other related 3D domains (represented in different digital formats) with adequate labeling. Our contributions are listed as follows:
-
•
We propose a novel multi-projection grid mini-patch sampling (MP-GMS) strategy for the 3DQA methods, which samples mini-patches from multi-projections and forms the mini-patches into one quality map for evaluation.
-
•
The MP-GMS strategy enables the proposed method to effectively and efficiently evaluate the perceptual quality of 3D models, leading to at least 4.2% performance margin and notable efficiency (at least 3.28 times faster) than the existing 3DQA methods.
-
•
Extensive experimental results (efficiency analysis, ablation study, cross-database & cross-domain validation, and statistical test) have validated the rationality and robustness of the proposed method framework. In-depth analyses are further given to support the findings.
2. Related Works
In this section, we briefly summarize the development of 3DQA methods from the aspects of PCQA and MQA.
2.1. PCQA development
The early FR-PCQA metrics primarily focused on evaluating the geometry aspect at the point level, such as p2point (Mekuria et al., 2016b), p2plane (Tian et al., 2017). The p2point metric calculates the level of distortion by determining the distance vector between corresponding points, while the p2plane metric extends this by projecting the distance vector onto the normal orientation for quality assessment. Due to the difficulty in reflecting complex structural distortions through point-level differences, subsequent studies considered other structural characteristics of PCQA. For instance, the angular difference of point normals was adopted by Alexiou . (Alexiou and Ebrahimi, 2018) to estimate degradation, while Javaheri . (Javaheri et al., 2020) utilized the generalized Hausdorff distance to reflect the impact of compression operations. In some cases, the color information cannot be disregarded, which poses a challenge for PCQA metrics that only consider geometry information. To address this, PSNR-yuv (Torlig et al., 2018) measures the quality levels by comparing the point-wise color attributes. GraphSIM (Yang et al., 2020b) predicts the quality of point clouds through the use of graph similarity and color gradient analysis. Meynet . (Meynet et al., 2020) proposed a metric that incorporates color information by using a weighted linear combination of curvature and color information to evaluate the visual quality of distorted point clouds. Similarly, PointSSIM (Alexiou and Ebrahimi, 2020) computes the similarity of four types of features, including geometry, normal vectors, curvature, and color information. In addition, some studies have attempted to assess the visual quality of point clouds through 2D projections. For example, the works presented in (Yang et al., 2020a) and (Torlig et al., 2018) utilize mature image quality assessment (IQA) methods to evaluate the point cloud quality by projecting the 3D data onto 2D images.
Recently, more efforts have been put into pushing forward the development of NR-PCQA methods. ResCNN (Liu et al., 2022b) proposes an end-to-end sparse convolutional neural network architecture for the assessment of point cloud quality through the extraction of quality-sensitive features. PQA-net (Liu et al., 2021c) utilizes multi-view projections to classify and evaluate point cloud distortions. 3D-NSS (Zhang et al., 2022) employs a combination of geometry and color attributes and implements classical statistical distribution models to analyze the point cloud. Tu (Tu et al., 2022) designed a dual-stream convolutional network to extract the texture and geometry features of the distorted point clouds. Zhou (Zhou et al., 2022) extracts quality-related features with structure-guided resampling. Moreover, some works (Fan et al., 2022; Zhang et al., 2023b) transform the point clouds into videos and assess the perceptual quality with the video quality assessment (VQA) technique.
Based on the above review, PCQA methods can be divided into two main categories: model-based methods (Mekuria et al., 2016b; Tian et al., 2017; Alexiou and Ebrahimi, 2018; Javaheri et al., 2020; Yang et al., 2020b; Meynet et al., 2020; Alexiou and Ebrahimi, 2020; Torlig et al., 2018; Liu et al., 2022b; Zhou et al., 2022), which extract features directly from the point cloud, and projection-based methods (Yang et al., 2020a; Liu et al., 2021c; Fan et al., 2022; Zhang et al., 2023b; Xie et al., 2023; Zhang et al., 2023c), which extract features from rendered projections. The model-based methods avoid information loss during rendering but require significant computational resources due to the complexity of high-quality point clouds. Conversely, projection-based methods leverage mature 2D IQA tools but depend heavily on the choice of viewpoint. To reduce the randomness in viewpoint selection, it has been demonstrated in various studies (Liu et al., 2021c; Fan et al., 2022; Zhang et al., 2023b) that using multiple projections can greatly enhance accuracy compared to a single projection. However, this approach increases computational resource usage and inference time. Thus, improving computational efficiency while relying on multi-projection for enhanced performance is an urgent issue that needs addressing.
2.2. MQA development
Similar to the early FR-PCQA methods, some FR-MQA methods generally compute local features at the vertex level and then aggregate these features into a quality value. For instance, MSDM2 (Lavoué, 2011) predicts the quality level by computing the differences in structure, as captured through curvature statistics, in local neighborhoods. DAME (Váša and Rus, 2012) evaluates the quality loss by measuring differences in dihedral angles between the reference and distorted meshes. FMPD (Wang et al., 2012) assesses the quality of distorted meshes by estimating the local roughness difference derived from Gaussian curvature. However, it is worth noting that these metrics only take geometry information into account. To account for the impact of color information, some color-involved FR-MQA metrics have been developed. Tian (Tian and AlRegib, 2008) quantified the effect of color information through a global distance over the texture image, calculated using Mean Squared Error (MSE). Guo (Guo et al., 2016) calculated the texture image quality distance as a representation of color information features. Nehmé (Nehmé et al., 2021) introduced a metric that incorporates perceptually relevant curvature-based and color-based features to evaluate the visual quality of colored meshes. Then Nehmé (Nehmé et al., 2022) further proposed a learning-based quality metric for textured meshes based on LPIPS (Zhang et al., 2018).
More recently, the efficacy of machine learning technologies has enabled the development of learning-based NR-MQA metrics. Abouelaziz (Abouelaziz et al., 2016) extracted features using dihedral angle models and train a support vector machine for feature regression. Later, Abouelaziz (Abouelaziz et al., 2017) convert the curvature and dihedral angle into 2D patches and employ a Convolutional Neural Network (CNN) for training. They further introduce a CNN framework with saliency views rendered from 3D meshes (Abouelaziz et al., 2020). To further deal with colored meshes, Zhang (Zhang et al., 2021a) employed curvature and color features for quality prediction.
3. Proposed Method
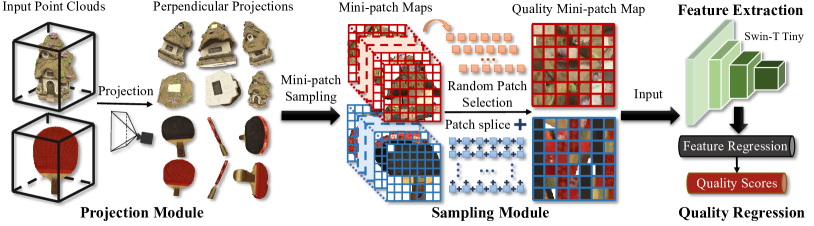
The framework of the proposed method is illustrated in Fig. 2, which includes the projection module, sampling module, feature extraction module, and quality regression module. The first stage involves capturing perpendicular projections from the six surfaces of a cube, using these projections from the input point clouds. These projections are then transformed into mini-patch maps. From these maps, patches are randomly chosen and assembled into Quality Mini-Patch Maps (QMMs) for assessment. The final stage of the process involves extracting quality-aware features using a Swin-Transformer tiny model, which are then used to regress into perceptual scores for evaluation.
3.1. Projection Process
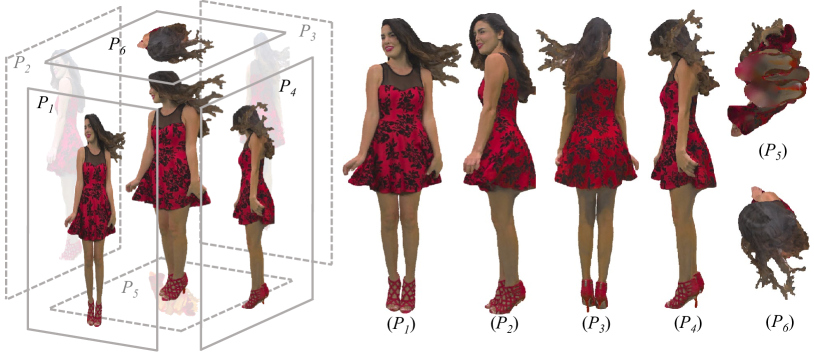
The projection-based 3DQA methods can be adapted to all kinds of 3D models, i.e., point cloud, mesh, voxel, etc., since they infer the visual quality via the rendered projections. However, the quality information contained in the projections is highly dependent on the viewpoints. To cover sufficient quality information across different viewpoints, we employ the mainstream cube-like viewpoints setting, which has been employed in the popular point cloud compression standard MPEG VPCC (Graziosi et al., 2020). As shown in Fig. 3, six perpendicular viewpoints are employed to capture the rendered projections, corresponding to the six surfaces of a cube. Given a 3D model , the projection process can be described as:
| (1) | ||||
where represents the set of the 6 rendered projections and stands for the rendering process.
3.2. Multi-Projection Grid Mini-patch Sampling
It has been proven that utilizing multi-projections can help projection-based 3DQA methods learn better quality representations and boost performance (Yang et al., 2020a; Liu et al., 2021c; Fan et al., 2022; Zhang et al., 2023b). However, such methods simply extract features from the multi-projections with deep neural networks (DNN) for quality evaluation, and using more projections means more computational resources as well as inference time. Moreover, there usually exists quality information redundancy among the multi-projections. To leverage the advantages of multi-projections and reduce the computation consumption at the same time, we propose a multi-projection grid mini-patch sampling (MP-GMS) strategy, which splits the multi-projections into grid mini-patches and forms the sampled grid mini-patches into one quality mini-patch map (QMM). Specifically, the grids from the multi-projections can be derived as:
| (2) | ||||
where represent the uniform grids generated from the -th projection , denotes the grid in the -th row and -th column of , and and denote the height and width of . Then the raw resolution mini-patches can be obtained as:
| (3) |
where is the mini-patch sampled from grid and represents the patch sampling operation. Afterward, we randomly select mini-patches from each projection and splice the selected mini-patches into one QMM:
| (4) |
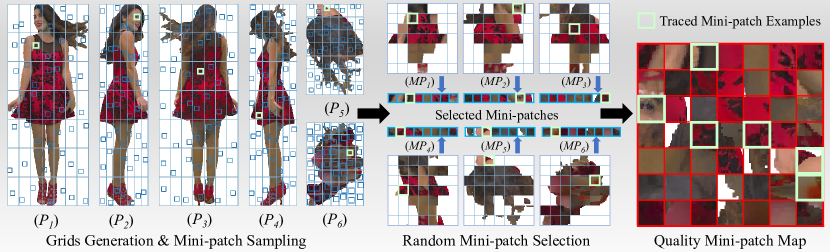
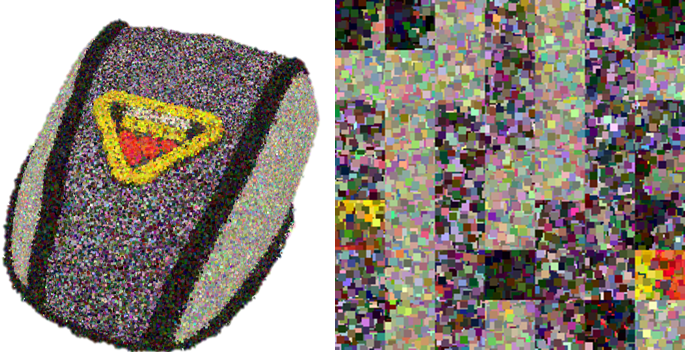
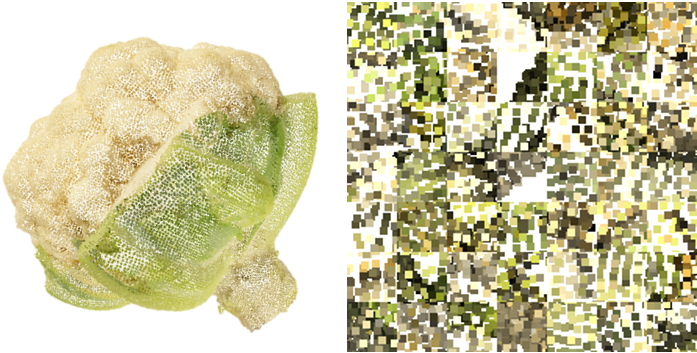
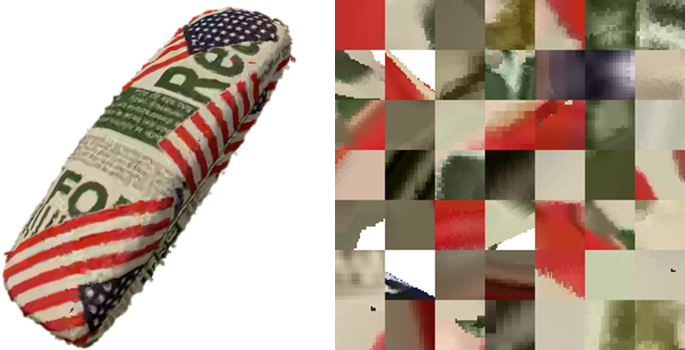
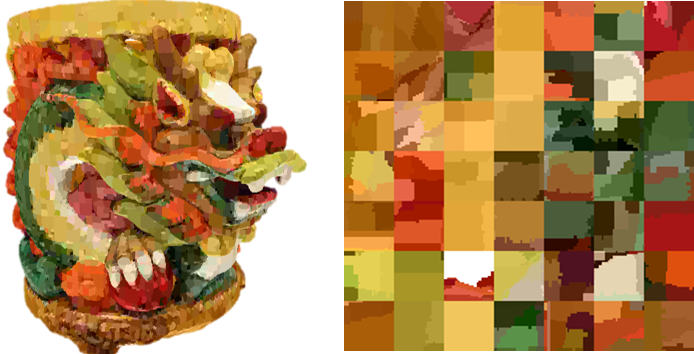
where represents the QMM, indicates the mini-patch splicing operation, and stands for the randomly selected mini-patch sampled from the grid in the -th row and -th column of the -th projection where the blank mini-patches are ignored. Additionally, is set as , which indicates that mini-patches are randomly selected from each projection. The left mini-patches of the quality map are filled up by the last projection. The detailed process is exhibited in Fig. 4, from which we can clearly observe the generation process of QMMs. Several distorted point clouds and their corresponding QMMs are exhibited in Fig 5, from which we can find that the multi-projections’ quality-aware local patterns are well preserved in the QMM.
3.3. Efficient Feature Extraction & Quality Regression
To ensure efficiency and suit the mini-patch structure, we choose the lightweight and well-performing Swin-Transformer tiny (ST-t) (Liu et al., 2021a) as the feature extraction backbone. Given the input quality mini-patch map , the quality representation can be derived as:
| (5) |
where stands for the feature extraction operation with the ST-t backbone and denotes the extracted quality representation. Then we simply use two-stage fully-connected (FC) layers with 768 and 64 neurons to regress the quality representation into predicted perceptual quality scores:
| (6) |
where represents the predicted quality scores and indicates the quality regression operation with the FC layers.
3.4. Loss Function
In common situations, we not only pay attention to the accuracy of predicted quality scores but also focus on the quality rankings for the quality assessment tasks (Fang et al., 2022; Gu et al., 2019). To ensure the accuracy of quality prediction and quality rankings, the loss function employed in this paper is made up of two parts: Mean Squared Error (MSE) and Rank Error (RE). The MSE is used to force the predicted quality scores close to the quality labels, which can be described as:
| (7) |
where represents the predicted quality scores, indicates the quality labels, and is the size of a batch. Furthermore, the RE can assist the model to gain a better understanding of the quality rankings and distinguish the quality difference of point clouds with close quality labels. Specifically, we use the differentiable rank function described in (Wen and Wang, 2021; Sun et al., 2022) to approximate the RE loss:
| (8) | ||||
where and are the corresponding indexes for two point clouds in a mini-batch and the RE loss is obtained as:
| (9) |
Then the overall loss is formulated as a weighted linear combination of MSE loss and RE loss:
| (10) |
where and are used to control the proportion of the MSE loss and the RE loss.
4. Experiment
In this section, we first briefly introduce the benchmark databases and the implementation details. The experimental results are presented with in-depth discussions.
4.1. Databases
-
•
PCQA Databases: Two popular point cloud quality assessment databases are utilized to validate the performance of the proposed method, which include the subjective point cloud assessment database (SJTU-PCQA) (Yang et al., 2020a), the Waterloo point cloud assessment database (WPC) (Liu et al., 2022a). The SJTU-PCQA database includes 9 reference point clouds, each of which is corrupted with 7 types of distortions (compression, color noise, geometry noise, downsampling, and their three combinations) under 6 different strengths, resulting in a total of 378 distorted point clouds. The WPC database contains 20 reference point clouds. Each of the reference point clouds is augmented with 4 types of distortions (downsampling, Gaussian noise, MPEG-GPCC compression, and MPEG-VPCC compression), generating 740 distorted point clouds.
-
•
MQA Databases: The diffuse color mesh quality assessment (CMDM) and the textured mesh quality (TMQ) database (Nehmé et al., 2022) are used to validate the performance on the mesh quality assessment task. The CMDM database includes 5 source color meshes and degrades the color meshes with 4 types of distortions (geometric quantization, color quantization, ”Color-ignorant” simplification, and ”Color-aware” simplification) under 4 strengths, which generates 80 distorted stimuli in total. The TMQ database provides 55 source textured meshes and corrupts the source textured meshes with 5 common distortions (simplification, position quantization, UV map quantization, texture downsampling, and texture compression), in which 3,000 distorted textured meshes are selected and perceptually rated.
4.2. Implementation Details
The Adam optimizer (Kingma and Ba, 2015) is employed with the initial learning rate and the learning rate decays with a ratio of 0.9 for every 5 epochs. The default batch size is set as 32 and the default training epochs are set as 50. The Swin-Transformer tiny (Liu et al., 2021a) is initialized with the weights pretrained on the ImageNet-22K database (Deng et al., 2009). The projections are acquired with the assistance of Open3d (Zhou et al., 2018). The parameter introduced in Section 3.2 is set as 7, which indicates grids are generated from each projection and the final QMM is formed with selected mini-patches. The and parameters described in Section 3.3 are both set as 1 respectively.
4.3. Quality Competitors & Criteria
-
•
PCQA Competitors: The compared FR quality assessment methods include MSE-p2point (MSE-p2po) (Mekuria et al., 2016b), Hausdorff-p2point (HD-p2po) (Mekuria et al., 2016b), MSE-p2plane (MSE-p2pl) (Tian et al., 2017), Hausdorff-p2plane (HD-p2pl) (Tian et al., 2017), PSNR-yuv (Torlig et al., 2018), PCQM (Meynet et al., 2020), GraphSIM (Yang et al., 2020b), PointSSIM (Alexiou and Ebrahimi, 2020), PSNR, and SSIM (Wang et al., 2004). The compared NR methods include 3D-NSS (Zhang et al., 2022), ResSCNN (Liu et al., 2022b), GPA-net (Shan et al., 2023), PQA-net (Liu et al., 2021c), IT-PCQA (Yang et al., 2022), and VQA-PC (Zhang et al., 2023b).
-
•
MQA Competitors: The compared FR quality assessment methods include PSNR, SSIM (Wang et al., 2004), and G-LPIPS (specially designed for textured meshes) (Nehmé et al., 2022). The compared NR methods include 3D-NSS (Zhang et al., 2022), BRISQUE (Mittal et al., 2012a), and NIQE (Mittal et al., 2012b).
It’s worth noting that PSNR, SSIM, BRISQUE, and NIQE are operated on all 6 projections and the average scores are recorded. Afterward, a five-parameter logistic function is applied to map the predicted scores to subjective ratings, as suggested by (Antkowiak et al., 2000):
| (11) |
where are parameters to be fitted, and are the predicted scores and mapped scores respectively.
The evaluation of the performance of 3DQA quality models is done using four mainstream criteria, which include Spearman Rank Correlation Coefficient (SRCC), Pearson Linear Correlation Coefficient (PLCC), Kendall’s Rank Order Correlation Coefficient (KRCC), and Root Mean Squared Error (RMSE). SRCC gauges the correlation of ranks, PLCC represents linear correlation, KRCC reflects the likeness of the orderings, while RMSE measures the quality prediction accuracy. A top-performing model should have SRCC, PLCC, and KRCC values that approach 1 and RMSE values close to 0.
4.4. Experimental Setup
To fully evaluate the performance of the quality models, we use the -fold cross validation strategy. Specifically, we divide the database into equally sized folds. The model is then trained on -1 of these folds and tested on the remaining one. This process is repeated k times, each time using a different fold as the test set until each fold has been used as the test set once. The average performance of -fold cross validation is reported as the final performance to avoid randomness.
Considering that the SJTU-PCQA, WPC, CMDM and TMQ databases contain 9, 20, 5, and 55 independent groups of 3D models, we conduct the -fold, -fold, -fold, and -fold cross validation on the four databases respectively, which indicates each fold contains 1, 4, 1, and 11 groups of 3D models for the four databases. It’s worth mentioning that there is no content overlap between the training and testing sets. Furthermore, the quality models that require no training are evaluated on the same testing folds and the average performance is reported to make the comparison fair.
| Ref | Type | Index | Methods | SJTU-PCQA | WPC | ||||||
|---|---|---|---|---|---|---|---|---|---|---|---|
| SRCC | PLCC | KRCC | RMSE | SRCC | PLCC | KRCC | RMSE | ||||
| FR | Model-based | A | MSE-p2po | 0.7294 | 0.8123 | 0.5617 | 1.3613 | 0.4558 | 0.4852 | 0.3182 | 19.8943 |
| B | HD-p2po | 0.7157 | 0.7753 | 0.5447 | 1.4475 | 0.2786 | 0.3972 | 0.1943 | 20.8990 | ||
| C | MSE-p2pl | 0.6277 | 0.5940 | 0.4825 | 2.2815 | 0.3281 | 0.2695 | 0.2249 | 22.8226 | ||
| D | HD-p2pl | 0.6441 | 0.6874 | 0.4565 | 2.1255 | 0.2827 | 0.2753 | 0.1696 | 21.9893 | ||
| E | PSNR-yuv | 0.7950 | 0.8170 | 0.6196 | 1.3151 | 0.4493 | 0.5304 | 0.3198 | 19.3119 | ||
| F | PCQM | 0.8644 | 0.8853 | 0.7086 | 1.0862 | 0.7434 | 0.7499 | 0.5601 | 15.1639 | ||
| G | GraphSIM | 0.8783 | 0.8449 | 0.6947 | 1.0321 | 0.5831 | 0.6163 | 0.4194 | 17.1939 | ||
| H | PointSSIM | 0.6867 | 0.7136 | 0.4964 | 1.7001 | 0.4542 | 0.4667 | 0.3278 | 20.2733 | ||
| \cdashline2-12 | Projection-based | I | PSNR | 0.2952 | 0.3222 | 0.2048 | 2.2972 | 0.1261 | 0.1801 | 0.0897 | 22.5482 |
| J | SSIM | 0.3850 | 0.4131 | 0.2630 | 2.2099 | 0.2393 | 0.2881 | 0.1738 | 21.9508 | ||
| \hdashlineNR | Model-based | K | 3D-NSS | 0.7144 | 0.7382 | 0.5174 | 1.7686 | 0.6479 | 0.6514 | 0.4417 | 16.5716 |
| L | ResSCNN | 0.8600 | 0.8100 | - | - | - | - | - | - | ||
| M | GPA-Net | 0.8750 | 0.8860 | - | - | 0.7580 | 0.7690 | - | - | ||
| \cdashline2-12 | Projection-based | N | PQA-net | 0.8500 | 0.8200 | - | - | 0.7000 | 0.6900 | 0.5100 | 15.1800 |
| O | IT-PCQA | 0.5800 | 0.6300 | - | - | 0.5500 | 0.5400 | - | - | ||
| P | VQA-PC | 0.8509 | 0.8635 | 0.6585 | 1.1334 | 0.7968 | 0.7976 | 0.6115 | 13.6219 | ||
| \cdashline3-12 | Q | GMS-3DQA | 0.9108 | 0.9177 | 0.7735 | 0.7872 | 0.8308 | 0.8338 | 0.6457 | 12.2292 | |
| Ref | Type | Index | Methods | CMDM | TMQ | ||||||
|---|---|---|---|---|---|---|---|---|---|---|---|
| SRCC | PLCC | KRCC | RMSE | SRCC | PLCC | KRCC | RMSE | ||||
| FR | Projection-based | A | PSNR | 0.6129 | 0.6557 | 0.4902 | 0.8665 | 0.5295 | 0.6535 | 0.3938 | 0.7877 |
| B | SSIM | 0.7933 | 0.8087 | 0.6689 | 0.5987 | 0.4020 | 0.5982 | 0.2821 | 0.8339 | ||
| C | G-LPIPS* | 0.8900 | 0.8800 | - | - | 0.8600 | 0.8500 | - | - | ||
| \hdashlineNR | Model-based | D | 3D-NSS | 0.8626 | 0.8754 | 0.7222 | 0.6062 | 0.4263 | 0.4429 | 0.2934 | 1.0542 |
| \cdashline2-12 | Projection-based | E | BRISQUE | 0.5295 | 0.5906 | 0.3688 | 1.058 | 0.5364 | 0.4849 | 0.3788 | 0.9014 |
| F | NIQE | 0.6694 | 0.7505 | 0.5342 | 0.7491 | 0.3731 | 0.3866 | 0.2528 | 0.8782 | ||
| \cdashline3-12 | G | GMS-3DQA | 0.8394 | 0.8759 | 0.6822 | 0.5328 | 0.7810 | 0.7895 | 0.5783 | 0.5978 | |
4.5. Performance Discussion
The experimental results are documented in Table 1 and Table 2, from which we can draw several conclusions: (a) As shown in Table 1, the proposed GMS-3DQA method outperforms all the comparison methods on the SJTU-PCQA and WPC databases, demonstrating the effectiveness of the proposed method on PCQA tasks. For example, GMS-3DQA is 3.7% ahead of the second-place method GraphSIM (0.9108 vs. 0.8783) and is 4.2% superior to the second-ranking NR method VQA-PC (0.8308 vs. 0.7968) on the SJTU-PCQA and WPC databases in terms of SRCC values respectively. (b) Additionally, a significant decline in performance was observed for all 3DQA methods when transitioning from the SJTU-PCQA database to the WPC database. This can be attributed to the more complex distortions and finer-grained degradation levels introduced by the WPC database. (c) In Table 2, the proposed GMS-3DQA method is found to be inferior to the NR-MQA method 3D-NSS on the CMDM database and outperforms all the NR-MQA methods on the TMQ database. This might be because the CMDM database contains only 80 distorted meshes, which can result in overfitting due to insufficient training data. As a consequence, the performance of GMS-3DQA is inferior to that of 3D-NSS on the CMDM database. However, when applied to the TMQ database, which contains a larger and more complex set of distorted meshes, 3D-NSS experiences a significant performance decline, while the proposed method maintains a satisfactory level of performance. This observation suggests that the proposed model exhibits superior capability in adapting to and characterizing intricate distortions in 3D models. Moreover, it should be noted that G-LPIPS operates on projections from perceptually selected viewpoints, which limits its practical value compared to the proposed method.
In conclusion, GMS-3DQA significantly boosts the performance of the NR-PCQA and NR-MQA methods. Given that GMS-3DQA relies on perpendicular projections, it’s adaptable to other 3D digital formats. This adaptability facilitates cross-domain quality assessment across various 3D digital formats, potentially leading to a unified approach in 3D quality assessment.
| Method | Para. (M) | Gflops | Time (S) CPU/GPU |
|---|---|---|---|
| PCQM | - | - | 12.237.83×/- |
| GraphSIM | - | - | 270.14173.16×/- |
| PointSSIM | - | - | 9.275.94×/- |
| 3D-NSS | - | - | 5.123.28×/- |
| VQA-PC | 58.37 | 50.08 | 19.2112.31×/16.4412.84× |
| \hdashlineGMS-3DQA | 27.54 | 4.38 | 1.561×/1.281× |
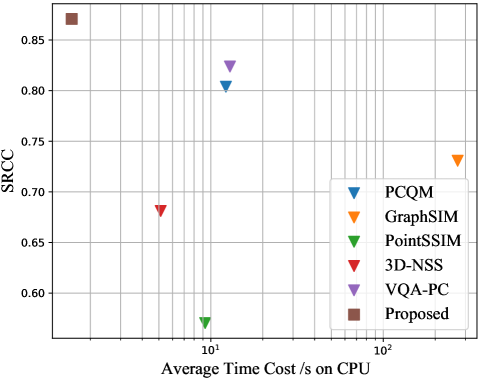
4.6. Efficiency Analysis
In the previous session, the effectiveness of GMS-3DQA is discussed while this section mainly focuses on the model efficiency. The high efficiency of the proposed method mostly lies in turning the multi-projections into one QMM and inferring the perceptual quality from the single QMM input rather than multi-projections, which greatly reduces the inference time and computational complexity. A comparison for the computational complexity of 3DQA models is conducted with three FR-PCQA methods (PCQM, GraphSIM, and PointSSIM) and two NR-PCQA methods (3D-NSS and VQA-PC). It is noteworthy that both GMS-3DQA and VQA-PC are deep learning-based methods, while the remaining methods are handcrafted-based. The reason for excluding PQA-net is that PQA-net is trained on the non-public Waterloo Point Cloud Sub-Dataset (WPCSD) (Liu et al., 2021c), which includes 7.920 distorted point clouds. The operation time is evaluated on a computer with Intel 12500H @ 3.11 GHz CPU, 16G RAM, and NVIDIA Geforce RTX 3070Ti GPU, running on the Windows operating system. The efficiency comparison results are presented in Table 3 and Fig. 6. It can be observed that the proposed GMS-3DQA requires only 1/3.28 the inference time compared to the fastest competitor 3D-NSS while achieving the best performance on the CPU. Additionally, the proposed GMS-3DQA consumes half parameters and much fewer flops than the deep learning-based method VQA-PC. These comparisons further affirm the superior efficiency of the proposed GMS-3DQA method.
| Index | GMS | QMM | Para. (M) | Gflops | Time (S) | SJTU | WPC | CMDM | TMQ | ||||
|---|---|---|---|---|---|---|---|---|---|---|---|---|---|
| CPU/GPU | SRCC | PLCC | SRCC | PLCC | SRCC | PLCC | SRCC | PLCC | |||||
| I | 27.54 | 26.28 | 2.51/1.67 | 0.8843 | 0.8861 | 0.8132 | 0.8222 | 0.8022 | 0.8127 | 0.7558 | 0.7563 | ||
| II | 27.54 | 26.28 | 2.44/1.66 | 0.9001 | 0.9002 | 0.8241 | 0.8244 | 0.8111 | 0.8441 | 0.7619 | 0.7633 | ||
| III | 27.54 | 4.38 | 1.56/1.28 | 0.9108 | 0.9177 | 0.8308 | 0.8338 | 0.8394 | 0.8759 | 0.7810 | 0.7895 | ||
4.7. Ablation Study
To fully investigate the contribution of the multi-projection grid mini-patch sampling (GMS-3DQA) strategy, we conduct the ablation studies from two aspects: (a) We evaluate the performance of the bare model without GMS and QMM. More specifically, the six perpendicular projections are resized and cropped into 224224 resolutions and then put into the same ST-t backbone feature extraction. Then extracted features are fused with average pooling and the default quality regression module is employed to predict the quality levels. (b) We evaluate the model’s performance (using GMS but excluding QMM) in this part. In this scenario, we use 6 grid mini-patch maps sampled from the 6 projections as input. This is followed by the processes of feature extraction, feature fusion, and quality regression, all conducted as previously detailed.
The experimental results are exhibited in Table 4. With closer inspections, we can draw several useful conclusions: (a) The model equipped with GMS and QMM achieves the best performance, which indicates both GMS and QMM makes contributions to the final results. (b) The GMS strategy helps the model gain better performance than the bare model with resize and crop strategy, which indicates the GMS can better preserve the quality-aware patterns from the rendered projections. (c) The QMM further improves performance. It is because the existing quality information redundancy within the 6 grid mini-patch maps may confuse the model and leads to a performance drop. The QMM actively integrates the quality information from the viewpoints and reduces the information redundancy within each grid mini-patch map, which assists the model to gain a better perceptual understanding of the 3D model. (d) Furthermore, the utilization of QMM only needs extracting features from a single quality map while models without QMM need to extract features from all the projections, which requires more computational resources as well as inference time.
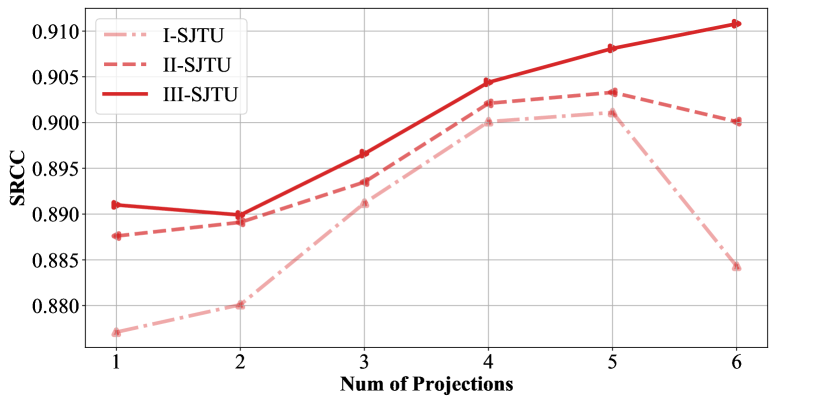
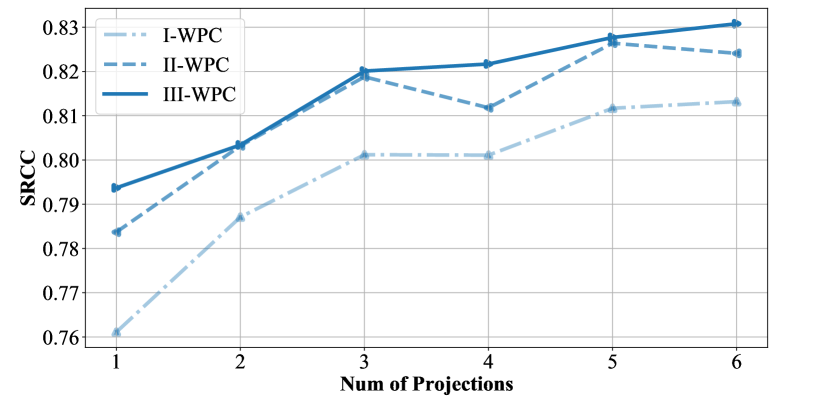
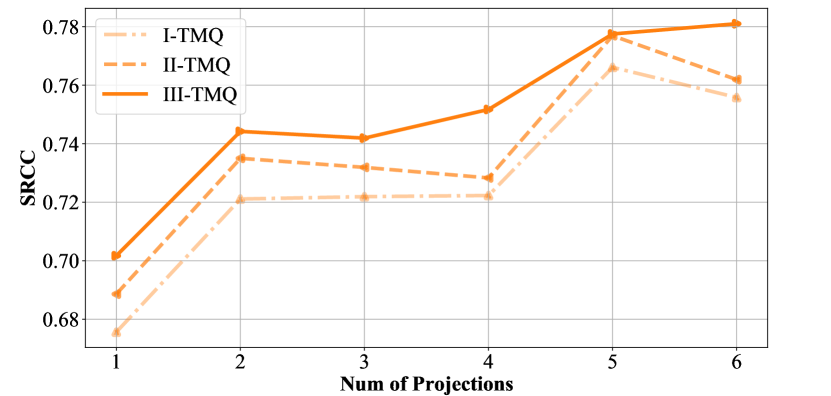
4.8. Effect of the Number of Projections
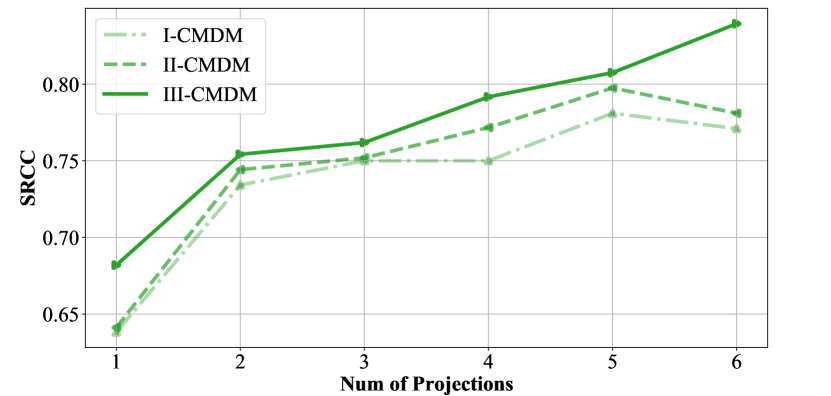
In this section, we investigate the impact of the number of projections on the performance of the proposed method. Our results, depicted in Figure 7, show that all six viewpoints contribute significantly to the performance improvement of the proposed method. Interestingly, our analysis also reveals that increasing the number of projections from 5 to 6 leads to a noticeable decrease in the performance of Model I and Model II on all but one of the four tested databases, namely ‘I-WPC’. However, Model III demonstrates a positive trend in performance with increasing numbers of projections, and when the number of projections increases from 5 to 6, the performance of the proposed method is further improved. These findings suggest that the proposed method effectively leverages and integrates quality-aware information from multi-projections while minimizing the negative impact of redundancy.
| Backbone | Para. (M) | Gflops | Time (S) | SJTU | WPC | CMDM | TMQ | ||||
|---|---|---|---|---|---|---|---|---|---|---|---|
| CPU/GPU | SRCC | PLCC | SRCC | PLCC | SRCC | PLCC | SRCC | PLCC | |||
| ResNet50 | 25.60 | 4.11 | 1.60/1.30 | 0.9030 | 0.9016 | 0.8114 | 0.8111 | 0.8174 | 0.8172 | 0.7705 | 0.7637 |
| ConvNeXtV2-Tiny | 27.84 | 4.45 | 1.59/1.28 | 0.9101 | 0.9100 | 0.7682 | 0.7610 | 0.8294 | 0.8319 | 0.7766 | 0.7788 |
| Swin-Trans. tiny | 27.54 | 4.38 | 1.56/1.28 | 0.9108 | 0.9177 | 0.8308 | 0.8338 | 0.8394 | 0.8759 | 0.7810 | 0.7895 |
4.9. Backbone Comparison
To explore the impact of different backbones on GMS-3DQA, we conduct a comparative experiment using two backbone networks, ResNet50 (He et al., 2016) and ConvNeXtV2-Tiny (Woo et al., 2023), which have similar parameter counts and FLOPs as ST-t. Both ResNet50 and ConvNeXtV2-Tiny are initialized with the weights pretrained on the ImageNet-22K database (Deng et al., 2009). The experimental results are exhibited in Table 4. Substituting different backbones does not severely affect the performance of GMS-3DQA, thus demonstrating its robustness. Further investigations reaveal that the ST-t backbone achieves the best performance, indicating that ST-t is the optimal choice for this task.
| Model | WPCSJTU | SJTUWPC | TMQCMDM | CMDMTMQ | ||||
|---|---|---|---|---|---|---|---|---|
| SRCC | PLCC | SRCC | PLCC | SRCC | PLCC | SRCC | PLCC | |
| PQA-net | 0.5411 | 0.6102 | - | - | - | - | - | - |
| 3D-NSS | 0.1817 | 0.2344 | 0.1512 | 0.1422 | - | - | - | - |
| VQA-PC | 0.7172 | 0.7233 | 0.2212 | 0.2317 | - | - | - | - |
| \hdashlineBRISQUE | 0.5148 | 0.4907 | 0.2158 | 0.2198 | 0.4138 | 0.4511 | 0.0140 | 0.0157 |
| \hdashlineGMS-3DQA | 0.7421 | 0.7611 | 0.3196 | 0.3321 | 0.7921 | 0.8123 | 0.2597 | 0.2992 |
4.10. Cross-Database & Cross-Domain Validation
In this section, we aim to assess the generalization capability of the proposed method by conducting a cross-database experiment. Specifically, we investigate the potential for cross-domain generalization, which refers to the ability of the learned quality representation from point clouds to be adapted to mesh and vice versa. It’s worth mentioning that the default -fold testing sets as well as the implementation setup are used so that the generalization performance can be directly compared with other methods’ performance in Table 1 and Table 2. The cross-database performance is reported in Table 6. The proposed GMS-3DQA presents the best generalization performance among the NR-3DQA competitors. The unsatisfied SJTUWPC (Scale: 378740) and CMDMTMQ (Scale: 803000) performance is due to the over-fitting resulting from the limited scale and distortion types of the SJTU-PCQA ND CMDM databases.
Then we try to conduct the cross-domain validation. More specifically, we test the PCQA performance with the model trained on the MQA database and vice versa. Since nearly all the competitors are targeted at only one domain (point cloud or mesh), we list the intra-database performance of some NR competitors for exhibition. The cross-domain results can be found in Table 7, from which we can make several observations: (a) GMS-3DQA’s performance is significantly enhanced when trained on databases with larger scales and more complex distortions. For instance, GMS-3DQA trained on the WPC database achieves better performance on the CMDM (SRCC: 0.49 vs. 0.60) and WPC (SRCC: 0.28 vs. 0.53) databases than SJTU, while GMS-3DQA trained on the TMQ database achieves better results on the SJTU (SRCC: 0.62 vs. 0.75) and WPC (SRCC: 0.40 vs. 0.60) databases than CMDM. (b) It’s interesting to find that GMS-3DQA trained on TMQ achieves an acceptable gap with the best intra-database-trained competitor VQA-PC on the SJTU (SRCC: 0.75 vs. 0.85) and WPC (SRCC: 0.60 vs. 0.70) databases, which indicates GMS-3DQA is capable of modeling the shared perceptual representations regardless of the digital formats and gains competitive domain generalization ability.
In conclusion, the proposed method gains the potential to deal with the QA tasks on a target 3D domain containing insufficient annotated data by using the knowledge learned from the other related 3D domain with adequate labeled data.
| Type | Model | PCQAMQA (SJTU:378, WPC:740) | MQAPCQA (CMDM:80, WPC:3,000) | ||||||||||||||
|---|---|---|---|---|---|---|---|---|---|---|---|---|---|---|---|---|---|
| SJTUCMDM | WPCCMDM | SJTUTMQ | WPCTMQ | CMDMSJTU | TMQSJTU | CMDMWPC | TMQWPC | ||||||||||
| SRCC | PLCC | SRCC | PLCC | SRCC | PLCC | SRCC | PLCC | SRCC | PLCC | SRCC | PLCC | SRCC | PLCC | SRCC | PLCC | ||
| Intra* | PQA-net* | - | - | - | - | - | - | - | - | 0.85 | 0.82 | 0.85 | 0.82 | 0.70 | 0.69 | 0.70 | 0.69 |
| VQA-PC* | - | - | - | - | - | - | - | - | 0.85 | 0.86 | 0.85 | 0.86 | 0.79 | 0.79 | 0.79 | 0.79 | |
| 3D-NSS* | 0.86 | 0.87 | 0.86 | 0.87 | 0.42 | 0.42 | 0.42 | 0.42 | 0.71 | 0.73 | 0.71 | 0.73 | 0.64 | 0.65 | 0.64 | 0.65 | |
| \hdashlineCross | GMS-3DQA | 0.49 | 0.52 | 0.60 | 0.63 | 0.28 | 0.34 | 0.53 | 0.57 | 0.62 | 0.62 | 0.75 | 0.77 | 0.40 | 0.46 | 0.60 | 0.62 |

4.11. Statistical Test
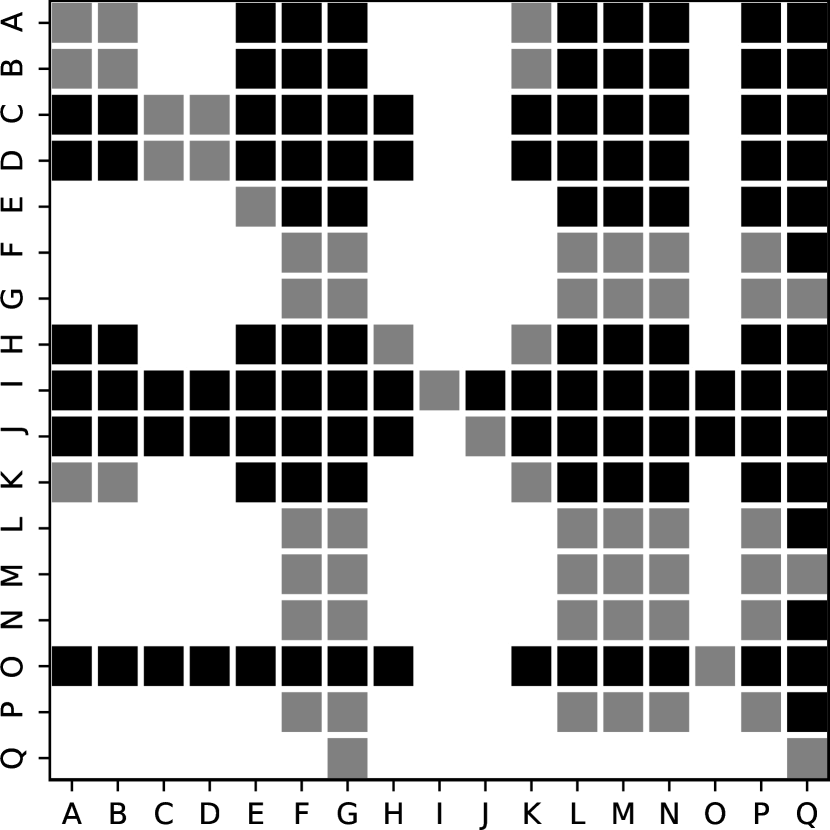
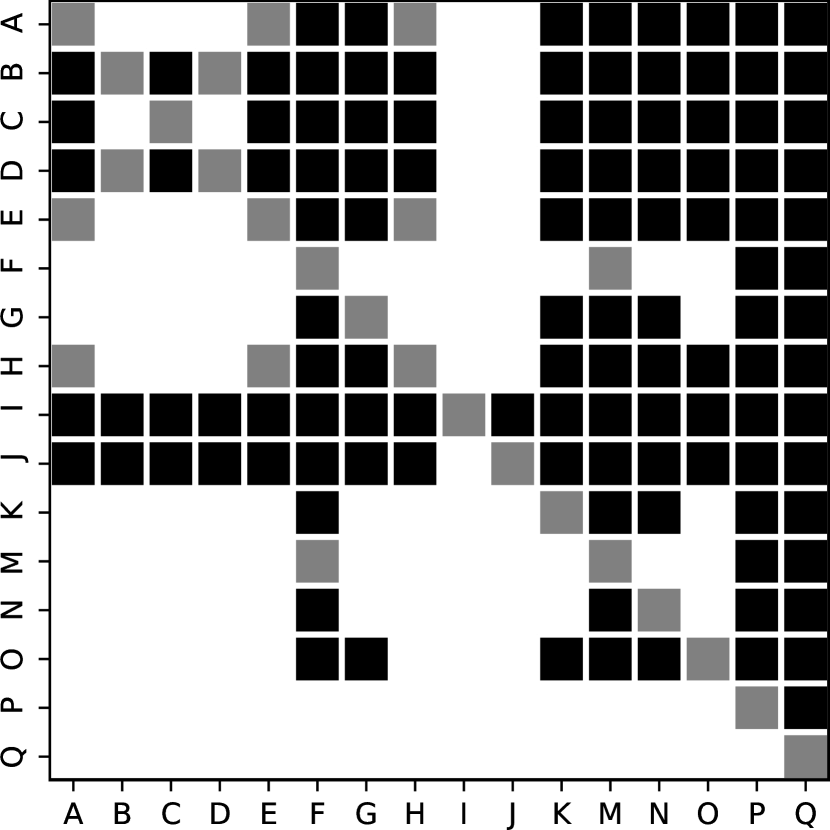
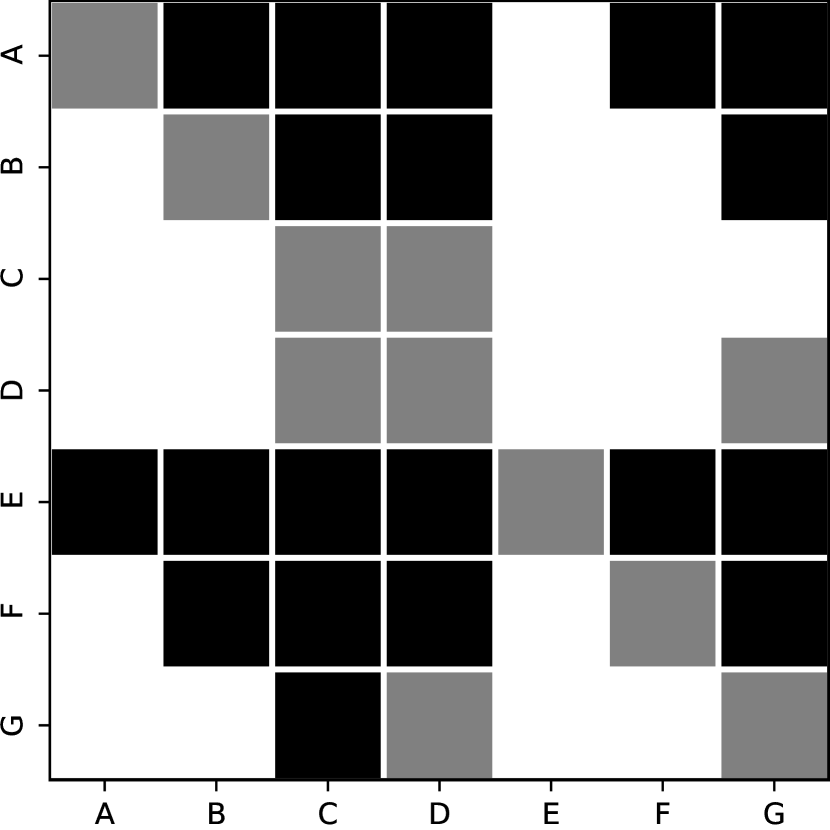
To gain further insight into the performance of the proposed method, we conduct a statistical test in this section. Our experiment setup follows the same procedure outlined in (Sheikh et al., 2006) and evaluates the difference between the predicted quality scores and the subjective ratings. All possible pairs of models are tested and the results are displayed in Fig. 8. The results reveal that our method is significantly better than 14 and 15 PCQA metrics on the SJTU-PCQA and WPC databases respectively. Moreover, the proposed method significantly outperforms 4 and 5 compared MQA metrics on the CMDM and TMQ databases respectively. Notably, the proposed NR method is even not statistically distinguishable from the FR methods on the PCQA databases, which further confirms the proposed method’s effectiveness.
5. Conclusion
This paper presents a projection-based Grid Mini-patch Sampling 3D Model Quality Assessment (GMS-3DQA) method that aims to reconcile the core contradiction of utilizing multi-projection information while reducing the operation time. The method adopts a common rendering setup of six perpendicular viewpoints for rendering projections, which reduces the time spent on viewpoint selection and covers sufficient quality information. The projections are split into grid mini-patch maps and a single quality mini-patch map (QMM) is generated by randomly sampling mini-patches from each viewpoint. The use of QMM improves efficiency and aggregates quality information across different viewpoints, thus enhancing performance and robustness. The proposed GMS-3DQA method is validated on both PCQA and MQA databases, and outperforms all the compared NR-3DQA methods except on the CMDM database while being competitive with FR-3DQA methods. The results show that GMS-3DQA is 3.28 times faster than the fastest comparing 3DQA method on CPU and has fewer parameters and FLOPs.
References
- (1)
- Abouelaziz et al. (2020) Ilyass Abouelaziz, Aladine Chetouani, Mohammed El Hassouni, Longin Jan Latecki, and Hocine Cherifi. 2020. No-reference mesh visual quality assessment via ensemble of convolutional neural networks and compact multi-linear pooling. Pattern Recognition 100 (2020), 107174.
- Abouelaziz et al. (2016) Ilyass Abouelaziz, Mohammed El Hassouni, and Hocine Cherifi. 2016. No-Reference 3D Mesh Quality Assessment Based on Dihedral Angles Model and Support Vector Regression. In Image and Signal Processing. 369–377.
- Abouelaziz et al. (2017) I. Abouelaziz, M. E. Hassouni, and H. Cherifi. 2017. A convolutional neural network framework for blind mesh visual quality assessment. In IEEE International Conference on Image Processing. 755–759.
- Alexiou and Ebrahimi (2018) Evangelos Alexiou and Touradj Ebrahimi. 2018. Point Cloud Quality Assessment Metric Based on Angular Similarity. In IEEE International Conference on Multimedia and Expo. 1–6.
- Alexiou and Ebrahimi (2020) Evangelos Alexiou and Touradj Ebrahimi. 2020. Towards a point cloud structural similarity metric. In IEEE International Conference on Multimedia & Expo Workshops. 1–6.
- Antkowiak et al. (2000) Jochen Antkowiak, TDF Jamal Baina, France Vittorio Baroncini, Noel Chateau, France FranceTelecom, Antonio Claudio França Pessoa, FUB Stephanie Colonnese, Italy Laura Contin, Jorge Caviedes, and France Philips. 2000. Final report from the video quality experts group on the validation of objective models of video quality assessment march 2000. (2000).
- Deng et al. (2009) Jia Deng, Wei Dong, Richard Socher, Li-Jia Li, Kai Li, and Li Fei-Fei. 2009. Imagenet: A large-scale hierarchical image database. In Proceedings of the IEEE conference on Computer Vision and Pattern Recognition. 248–255.
- Fan et al. (2022) Yu Fan, Zicheng Zhang, Wei Sun, Xiongkuo Min, Ning Liu, Quan Zhou, Jun He, Qiyuan Wang, and Guangtao Zhai. 2022. A no-reference quality assessment metric for point cloud based on captured video sequences. In IEEE International Workshop on Multimedia Signal Processing. IEEE, 1–5.
- Fang et al. (2022) Yuming Fang, Liping Huang, Jiebin Yan, Xuelin Liu, and Yang Liu. 2022. Perceptual quality assessment of omnidirectional images. In Proceedings of the AAAI Conference on Artificial Intelligence, Vol. 36. 580–588.
- Graf et al. (2006) H. Graf, S. P. Serna, and A. Stork. 2006. Adaptive Quality Meshing for ”on-the-fly” Volumetric Mesh Manipulations within Virtual Environments. In IEEE International Symposium on Virtual Environments, Human-Computer Interfaces and Measurement Systems. 178–183.
- Graziosi et al. (2020) D Graziosi, O Nakagami, S Kuma, A Zaghetto, T Suzuki, and A Tabatabai. 2020. An overview of ongoing point cloud compression standardization activities: Video-based (V-PCC) and geometry-based (G-PCC). APSIPA Transactions on Signal and Information Processing 9 (2020).
- Gu et al. (2019) Jie Gu, Gaofeng Meng, Cheng Da, Shiming Xiang, and Chunhong Pan. 2019. No-reference image quality assessment with reinforcement recursive list-wise ranking. In Proceedings of the AAAI Conference on Artificial Intelligence, Vol. 33. 8336–8343.
- Gu et al. (2015) Ke Gu, Min Liu, Guangtao Zhai, Xiaokang Yang, and Wenjun Zhang. 2015. Quality assessment considering viewing distance and image resolution. IEEE Transactions on Broadcasting 61, 3 (2015), 520–531.
- Guo et al. (2016) Jinjiang Guo, Vincent Vidal, Irene Cheng, Anup Basu, Atilla Baskurt, and Guillaume Lavoue. 2016. Subjective and Objective Visual Quality Assessment of Textured 3D Meshes. ACM Transactions on Applied Perception 14, 2 (2016), 20 pages.
- He et al. (2016) Kaiming He, Xiangyu Zhang, Shaoqing Ren, and Jian Sun. 2016. Deep residual learning for image recognition. In Proceedings of the IEEE conference on Computer Vision and Pattern Recognition. 770–778.
- Javaheri et al. (2020) Alireza Javaheri, Catarina Brites, Fernando Pereira, and João Ascenso. 2020. A Generalized Hausdorff Distance Based Quality Metric for Point Cloud Geometry. In International Conference on Quality of Multimedia Experience. 1–6.
- Kingma and Ba (2015) Diederik P Kingma and Jimmy Ba. 2015. Adam: A Method for Stochastic Optimization. In ICLR.
- Lavoué (2011) Guillaume Lavoué. 2011. A Multiscale Metric for 3D Mesh Visual Quality Assessment. Computer Graphics Forum 30, 5 (2011), 1427–1437.
- Li et al. (2020) Li Li, Zhu Li, Shan Liu, and Houqiang Li. 2020. Occupancy-map-based rate distortion optimization and partition for video-based point cloud compression. IEEE Transactions on Circuits and Systems for Video Technology 31, 1 (2020), 326–338.
- Li et al. (2015) Leida Li, Weisi Lin, Xuesong Wang, Gaobo Yang, Khosro Bahrami, and Alex C Kot. 2015. No-reference image blur assessment based on discrete orthogonal moments. IEEE Transactions on Cybernetics 46, 1 (2015), 39–50.
- Liu et al. (2022a) Qi Liu, Honglei Su, Zhengfang Duanmu, Wentao Liu, and Zhou Wang. 2022a. Perceptual Quality Assessment of Colored 3D Point Clouds. IEEE Transactions on Visualization and Computer Graphics (2022).
- Liu et al. (2021b) Qi Liu, Hui Yuan, Raouf Hamzaoui, Honglei Su, Junhui Hou, and Huan Yang. 2021b. Reduced reference perceptual quality model with application to rate control for video-based point cloud compression. IEEE Transactions on Image Processing 30 (2021), 6623–6636.
- Liu et al. (2020b) Qi Liu, Hui Yuan, Junhui Hou, Raouf Hamzaoui, and Honglei Su. 2020b. Model-based joint bit allocation between geometry and color for video-based 3D point cloud compression. IEEE Transactions on Multimedia 23 (2020), 3278–3291.
- Liu et al. (2021c) Qi Liu, Hui Yuan, Honglei Su, Hao Liu, Yu Wang, Huan Yang, and Junhui Hou. 2021c. PQA-Net: Deep No Reference Point Cloud Quality Assessment via Multi-View Projection. IEEE Transactions on Circuits and Systems for Video Technology 31, 12 (2021), 4645–4660.
- Liu et al. (2020a) Yutao Liu, Ke Gu, Xiu Li, and Yongbing Zhang. 2020a. Blind image quality assessment by natural scene statistics and perceptual characteristics. ACM Transactions on Multimedia Computing, Communications, and Applications (TOMM) 16, 3 (2020), 1–91.
- Liu et al. (2022b) Yipeng Liu, Qi Yang, Yiling Xu, and Le Yang. 2022b. Point Cloud Quality Assessment: Dataset Construction and Learning-based No-Reference Metric. ACM Transactions on Multimedia Computing, Communications, and Applications (2022).
- Liu et al. (2021a) Ze Liu, Yutong Lin, Yue Cao, Han Hu, Yixuan Wei, Zheng Zhang, Stephen Lin, and Baining Guo. 2021a. Swin transformer: Hierarchical vision transformer using shifted windows. In Proceedings of the IEEE/CVF conference on computer vision and pattern recognition. 10012–10022.
- Mekuria et al. (2016a) Rufael Mekuria, Kees Blom, and Pablo Cesar. 2016a. Design, implementation, and evaluation of a point cloud codec for tele-immersive video. IEEE Transactions on Circuits and Systems for Video Technology 27, 4 (2016), 828–842.
- Mekuria et al. (2016b) R Mekuria, Z Li, C Tulvan, and P Chou. 2016b. Evaluation criteria for point cloud compression. ISO/IEC MPEG 16332 (2016).
- Meynet et al. (2020) Gabriel Meynet, Yana Nehmé, Julie Digne, and Guillaume Lavoué. 2020. PCQM: A full-reference quality metric for colored 3D point clouds. In International Conference on Quality of Multimedia Experience. 1–6.
- Mittal et al. (2012a) Anish Mittal, Anush Krishna Moorthy, and Alan Conrad Bovik. 2012a. No-reference image quality assessment in the spatial domain. IEEE Transactions on Image Processing 21, 12 (2012), 4695–4708.
- Mittal et al. (2012b) Anish Mittal, Rajiv Soundararajan, and Alan C Bovik. 2012b. Making a “completely blind” image quality analyzer. IEEE Signal Processing Letters 20, 3 (2012), 209–212.
- Nehmé et al. (2022) Yana Nehmé, Florent Dupont, Jean-Philippe Farrugia, Patrick Le Callet, and Guillaume Lavoué. 2022. Textured Mesh Quality Assessment: Large-Scale Dataset and Deep Learning-based Quality metric. arXiv preprint arXiv:2202.02397 (2022).
- Nehmé et al. (2021) Y. Nehmé, F. Dupont, J. P. Farrugia, P. Le Callet, and G. Lavoué. 2021. Visual Quality of 3D Meshes With Diffuse Colors in Virtual Reality: Subjective and Objective Evaluation. IEEE Transactions on Visualization and Computer Graphics 27, 3 (2021), 2202–2219.
- Schwarz et al. (2018) Sebastian Schwarz, Marius Preda, Vittorio Baroncini, Madhukar Budagavi, Pablo Cesar, Philip A Chou, Robert A Cohen, Maja Krivokuća, Sébastien Lasserre, Zhu Li, et al. 2018. Emerging MPEG standards for point cloud compression. IEEE Journal on Emerging and Selected Topics in Circuits and Systems 9, 1 (2018), 133–148.
- Shan et al. (2023) Ziyu Shan, Qi Yang, Rui Ye, Yujie Zhang, Yiling Xu, Xiaozhong Xu, and Shan Liu. 2023. GPA-Net: No-Reference Point Cloud Quality Assessment with Multi-task Graph Convolutional Network. IEEE Transactions on Visualization and Computer Graphics (2023).
- Sheikh et al. (2006) H.R. Sheikh, M.F. Sabir, and A.C. Bovik. 2006. A Statistical Evaluation of Recent Full Reference Image Quality Assessment Algorithms. IEEE Transactions on Image Processing 15, 11 (2006), 3440–3451. https://doi.org/10.1109/TIP.2006.881959
- Sun et al. (2022) Wei Sun, Xiongkuo Min, Wei Lu, and Guangtao Zhai. 2022. A deep learning based no-reference quality assessment model for ugc videos. In ACM International Conference on Multimedia. 856–865.
- Tian and AlRegib (2008) Dihong Tian and Ghassan AlRegib. 2008. BaTex3: Bit Allocation for Progressive Transmission of Textured 3-D Models. IEEE Transactions on Circuits and Systems for Video Technology 18, 1 (2008), 23–35.
- Tian et al. (2017) Dong Tian, Hideaki Ochimizu, Chen Feng, Robert Cohen, and Anthony Vetro. 2017. Geometric distortion metrics for point cloud compression. In IEEE International Conference on Image Processing. 3460–3464.
- Torlig et al. (2018) Eric M Torlig, Evangelos Alexiou, Tiago A Fonseca, Ricardo L de Queiroz, and Touradj Ebrahimi. 2018. A novel methodology for quality assessment of voxelized point clouds. In Applications of Digital Image Processing XLI, Vol. 10752. 174–190.
- Tu et al. (2022) Renwei Tu, Gangyi Jiang, Mei Yu, Ting Luo, Zongju Peng, and Fen Chen. 2022. V-PCC Projection Based Blind Point Cloud Quality Assessment for Compression Distortion. IEEE Transactions on Emerging Topics in Computational Intelligence (2022).
- Váša and Rus (2012) Libor Váša and Jan Rus. 2012. Dihedral Angle Mesh Error: a fast perception correlated distortion measure for fixed connectivity triangle meshes. Computer Graphics Forum 31, 5 (2012), 1715–1724.
- Wang et al. (2012) Kai Wang, Fakhri Torkhani, and Annick Montanvert. 2012. A fast roughness-based approach to the assessment of 3D mesh visual quality. Computers and Graphics 36, 7 (2012), 808–818.
- Wang et al. (2004) Zhou Wang, A.C. Bovik, H.R. Sheikh, and E.P. Simoncelli. 2004. Image quality assessment: from error visibility to structural similarity. IEEE TIP 13, 4 (2004), 600–612.
- Wen and Wang (2021) Shaoguo Wen and Junle Wang. 2021. A strong baseline for image and video quality assessment. arXiv preprint arXiv:2111.07104 (2021).
- Woo et al. (2023) Sanghyun Woo, Shoubhik Debnath, Ronghang Hu, Xinlei Chen, Zhuang Liu, In So Kweon, and Saining Xie. 2023. ConvNeXt V2: Co-designing and Scaling ConvNets with Masked Autoencoders. arXiv preprint arXiv:2301.00808 (2023).
- Wu et al. (2022a) Haoning Wu, Chaofeng Chen, Jingwen Hou, Liang Liao, Annan Wang, Wenxiu Sun, Qiong Yan, and Weisi Lin. 2022a. Fast-vqa: Efficient end-to-end video quality assessment with fragment sampling. In European Conference on Computer Vision. 538–554.
- Wu et al. (2022b) Haoning Wu, Chaofeng Chen, Liang Liao, Jingwen Hou, Wenxiu Sun, Qiong Yan, Jinwei Gu, and Weisi Lin. 2022b. Neighbourhood Representative Sampling for Efficient End-to-end Video Quality Assessment. arXiv preprint arXiv:2210.05357 (2022).
- Wu et al. (2022c) Haoning Wu, Liang Liao, Chaofeng Chen, Jingwen Hou, Annan Wang, Wenxiu Sun, Qiong Yan, and Weisi Lin. 2022c. Disentangling Aesthetic and Technical Effects for Video Quality Assessment of User Generated Content. arXiv preprint arXiv:2211.04894 (2022).
- Xie et al. (2023) Wuyuan Xie, Kaimin Wang, Yakun Ju, and Miaohui Wang. 2023. pmBQA: Projection-based Blind Point Cloud Quality Assessment via Multimodal Learning. In Proceedings of the 31st ACM International Conference on Multimedia. 3250–3258.
- Yang et al. (2020a) Qi Yang, Hao Chen, Zhan Ma, Yiling Xu, Rongjun Tang, and Jun Sun. 2020a. Predicting the perceptual quality of point cloud: A 3d-to-2d projection-based exploration. IEEE Transactions on Multimedia (2020).
- Yang et al. (2022) Qi Yang, Yipeng Liu, Siheng Chen, Yiling Xu, and Jun Sun. 2022. No-reference point cloud quality assessment via domain adaptation. In Proceedings of the IEEE/CVF Conference on Computer Vision and Pattern Recognition. 21179–21188.
- Yang et al. (2020b) Qi Yang, Zhan Ma, Yiling Xu, Zhu Li, and Jun Sun. 2020b. Inferring point cloud quality via graph similarity. IEEE Transactions on Pattern Analysis and Machine Intelligence (2020).
- Yang et al. (2019) Qi Yang, Zhan Ma, Yiling Xu, Le Yang, Wenjun Zhang, and Jun Sun. 2019. Modeling the screen content image quality via multiscale edge attention similarity. IEEE Transactions on Broadcasting 66, 2 (2019), 310–321.
- Zhai et al. (2021) Guangtao Zhai, Wei Sun, Xiongkuo Min, and Jiantao Zhou. 2021. Perceptual quality assessment of low-light image enhancement. ACM Transactions on Multimedia Computing, Communications, and Applications (TOMM) 17, 4 (2021), 1–24.
- Zhang et al. (2018) Richard Zhang, Phillip Isola, Alexei A Efros, Eli Shechtman, and Oliver Wang. 2018. The unreasonable effectiveness of deep features as a perceptual metric. In Proceedings of the IEEE conference on Computer Vision and Pattern Recognition. 586–595.
- Zhang et al. (2023a) Xiaoyu Zhang, Wei Gao, Ge Li, Qiuping Jiang, and Runmin Cong. 2023a. Image Quality Assessment–driven Reinforcement Learning for Mixed Distorted Image Restoration. ACM Transactions on Multimedia Computing, Communications and Applications 19, 1s (2023), 1–23.
- Zhang et al. (2022) Zicheng Zhang, Wei Sun, Xiongkuo Min, Tao Wang, Wei Lu, and Guangtao Zhai. 2022. No-reference quality assessment for 3d colored point cloud and mesh models. IEEE Transactions on Circuits and Systems for Video Technology (2022).
- Zhang et al. (2021a) Zicheng Zhang, Wei Sun, Xiongkuo Min, Tao Wang, Wei Lu, Wenhan Zhu, and Guangtao Zhai. 2021a. A no-reference visual quality metric for 3d color meshes. In 2021 IEEE International Conference on Multimedia & Expo Workshops (ICMEW). IEEE, 1–6.
- Zhang et al. (2023b) Zicheng Zhang, Wei Sun, Xiongkuo Min, Wei Wu, Ying Chen, and Guangtao Zhai. 2023b. Evaluating Point Cloud from Moving Camera Videos: A No-Reference Metric. IEEE Transactions on Multimedia (2023).
- Zhang et al. (2023c) Zicheng Zhang, Wei Sun, Xiongkuo Min, Quan Zhou, Jun He, Qiyuan Wang, and Guangtao Zhai. 2023c. MM-PCQA: Multi-modal learning for no-reference point cloud quality assessment. IJCAI (2023).
- Zhang et al. (2021b) Zicheng Zhang, Wei Sun, Xiongkuo Min, Wenhan Zhu, Tao Wang, Wei Lu, and Guangtao Zhai. 2021b. A no-reference evaluation metric for low-light image enhancement. In 2021 IEEE International Conference on Multimedia and Expo (ICME). IEEE, 1–6.
- Zhang et al. (2023d) Zicheng Zhang, Wei Sun, Yingjie Zhou, Jun Jia, Zhichao Zhang, Jing Liu, Xiongkuo Min, and Guangtao Zhai. 2023d. Subjective and objective quality assessment for in-the-wild computer graphics images. ACM Transactions on Multimedia Computing, Communications and Applications 20, 4 (2023), 1–22.
- Zhang et al. (2023e) Zicheng Zhang, Wei Sun, Yingjie Zhou, Haoning Wu, Chunyi Li, Xiongkuo Min, Xiaohong Liu, Guangtao Zhai, and Weisi Lin. 2023e. Advancing Zero-Shot Digital Human Quality Assessment through Text-Prompted Evaluation. arXiv preprint arXiv:2307.02808 (2023).
- Zhang et al. (2023f) Zicheng Zhang, Wei Wu, Wei Sun, Danyang Tu, Wei Lu, Xiongkuo Min, Ying Chen, and Guangtao Zhai. 2023f. MD-VQA: Multi-dimensional quality assessment for UGC live videos. In Proceedings of the IEEE/CVF Conference on Computer Vision and Pattern Recognition. 1746–1755.
- Zhang et al. (2023g) Zicheng Zhang, Yingjie Zhou, Wei Sun, Xiongkuo Min, Yuzhe Wu, and Guangtao Zhai. 2023g. Perceptual Quality Assessment for Digital Human Heads. In ICASSP 2023-2023 IEEE International Conference on Acoustics, Speech and Signal Processing (ICASSP). IEEE, 1–5.
- Zhang et al. (2024) Zicheng Zhang, Yingjie Zhou, Long Teng, Wei Sun, Chunyi Li, Xiongkuo Min, Xiao-Ping Zhang, and Guangtao Zhai. 2024. Quality-of-Experience Evaluation for Digital Twins in 6G Network Environments. IEEE Transactions on Broadcasting (2024).
- Zhou et al. (2018) Qian-Yi Zhou, Jaesik Park, and Vladlen Koltun. 2018. Open3D: A modern library for 3D data processing. arXiv preprint arXiv:1801.09847 (2018).
- Zhou et al. (2022) Wei Zhou, Qi Yang, Qiuping Jiang, Guangtao Zhai, and Weisi Lin. 2022. Blind Quality Assessment of 3D Dense Point Clouds with Structure Guided Resampling. arXiv preprint arXiv:2208.14603 (2022).
- Zhou et al. (2023) Wei Zhou, Guanghui Yue, Ruizeng Zhang, Yipeng Qin, and Hantao Liu. 2023. Reduced-Reference Quality Assessment of Point Clouds via Content-Oriented Saliency Projection. IEEE Signal Processing Letters 30 (2023), 354–358. https://doi.org/10.1109/LSP.2023.3264105