20XX Vol. X No. XX, 000–000
22institutetext: University of Chinese Academy of Sciences, Beijing 100049, China;
33institutetext: Science Center for China Space Station Telescope, National Astronomical Observatories, Chinese Academy of Sciences, 20A Datun Road, Beijing 100101, China;
44institutetext: Department of Physics, College of Sciences, Northeastern University, Shenyang 110819, China
55institutetext: Center for High Energy Physics, Peking University, Beijing 100871, China
\vs\noReceived 20XX Month Day; accepted 20XX Month Day
Implication of the Stellar Mass Density of High- Massive Galaxies from JWST on Warm Dark Matter
Abstract
A significant excess of the stellar mass density at high redshift has been discovered from the early data release of James Webb Space Telescope (), and it may require a high star formation efficiency. However, this will lead to large number density of ionizing photons in the epoch of reionization (EoR), so that the reionization history will be changed, which can arise tension with the current EoR observations. Warm dark matter (WDM), via the free streaming effect, can suppress the formation of small-scale structure as well as low-mass galaxies. This provides an effective way to decrease the ionizing photons when considering a large star formation efficiency in high- massive galaxies without altering the cosmic reionization history. On the other hand, the constraints on the properties of warm dark matter can be derived from the observations. In this work, we study WDM as a possible solution to reconcile the stellar mass density of high- massive galaxies and reionization history. We find that, the high- comoving cumulative stellar mass density alone has no significant preference for either CDM or WDM model. But using the observational data of other stellar mass density measurements and reionization history, we obtain that the WDM particle mass with keV and star formation efficiency parameter in 2 confidence level can match both the high- comoving cumulative stellar mass density and the reionization history.
keywords:
cosmology:theory-dark matter-large scale structure of universe1 Introduction
High redshift (high-) galaxies play an important role in the Epoch of Reionization (EoR), which is considered to be the last phase transition of the Intergalactic Medium (IGM) in the cosmic history. Studying the high- galaxies allows us to have a deeper understanding on the formation and evolution of early galaxies and the cosmic reionization history. The launch of the James Webb Space Telescope () opens a new era to study the high redshift object in the Universe (Finkelstein et al. 2022, 2023). The early observational data release provides valuable information about the properties of high- galaxies, which may challenge the current galaxy formation theory under the CDM model (Boylan-Kolchin 2023; Mason et al. 2023; Menci et al. 2022; Mirocha & Furlanetto 2023; Naidu et al. 2022a, b).
In particular, Labbé et al. (2023) may find a serious tension with the standard galaxy formation theory. Using the Cosmic Evolution Early Release Science (CEERS) sample (detected by the JWST/NIRCam instrument), they identified six galaxies with stellar masses at . The corresponding comoving cumulative stellar mass density is about 20 times higher at and about three orders of magnitude higher at than the prediction from the star formation theory in standard CDM cosmology, which is based on previous observations (Stark et al. 2013; Song et al. 2016; Bhatawdekar et al. 2019; Kikuchihara et al. 2020; Stefanon et al. 2021). This huge abundance excess may due to issues of galaxy selection, measurements of galaxy stellar mass and redshift, dust extinction, and sample variance (Endsley et al. 2022; Ferrara et al. 2022; Ziparo et al. 2023; Adams et al. 2023). But if this result is confirmed by future spectroscopic observation, for example the follow-up observation by the JWST/NIRSpec, it will be an huge challenge to the CDM model. There are many efforts trying to solve this tension, for example, the primordial non-Gaussianity in the initial conditions of cosmological perturbations (Biagetti et al. 2023); the rapidly accelerating primordial black holes (Liu & Bromm 2022; Yuan et al. 2023); the Fuzzy Dark Matter (FDM) (Gong et al. 2023); axion miniclusters or primordial black holes (Hütsi et al. 2023); the cosmic string (Jiao et al. 2023); a gradual transition in the stellar Initial Mass Function (IMF) (Trinca et al. 2023); modified CDM power spectrum (Parashari & Laha 2023; Padmanabhan & Loeb 2023).
A direct way to explain the observation of Labbé et al. (2023) in theory is enhancing the star formation efficiency . Some previous observations prefer a low star formation efficiency (). But since depends on complicated astrophysical processes which remain unclear, it is theoretically possible to have a larger at high redshifts. On the other hand, although assuming large at high redshifts may help to solve or reduce the tension between the current model and the observation, it may raise new problems. If we have higher star forming efficiency at high-, the total number of ionizing photons in the EoR will significantly increase, and then the EoR may end much earlier which could be in tension with the EoR history observations (Hinshaw et al. 2013; Planck Collaboration et al. 2020). A possible way to resolve this problem is to enhance the formation rate of massive galaxies, but suppress the formation of low mass galaxies at the same time. A mass-dependent star formation efficiency can suppress the star formation in small halos, but may still not enough to reduce the huge tension.
In Gong et al. (2023), they propose to use fuzzy dark matter (FDM) to solve this problem. The FDM is expected to have extremely low mass of eV, and it can suppress the abundance of low-mass haloes via the effective quantum pressure arises from its galaxy-size de Broglie wavelength, which can successfully explain both and EoR observations. In this work, we study warm dark matter (WDM) as an alternative solution, and explore the implications on the WDM properties with the data. In the WDM scenario, WDM particles with mass of a few keV are much lighter than the standard CDM particles, allowing them to remain relativistic for longer in the early universe and to retain a non-negligible thermal velocity dispersion. This thermal velocity dispersion will cause a so-called free streaming effect, making WDM particles escape out of the high density region and resulting in a suppression of the structure growth on small scales (Blumenthal et al. 1982; Bode et al. 2001; de Vega & Sanchez 2012). Then the abundance of low-mass haloes as well as galaxies will be significantly suppressed, and this insight us to consider WDM as a solution to explain the observation (Labbé et al. 2023). In this work, we assume a flat universe with , , , , (Planck Collaboration et al. 2020) .
2 Model
2.1 WDM Halo Mass Function
In order to analysis the impact on the halo abundance by WDM, we need to calculate the halo mass function. A conventional choice for the halo mass function is obtained from the ellipsoidal collapse model (Press & Schechter 1974; Sheth & Tormen 1999; Sheth et al. 2001; Cooray & Sheth 2002), which can be expressed as
| (1) |
where is the halo mass, is the mean comoving matter density, and
| (2) |
Here , , are the parameters derived from simulations, and .
In the CDM case, we assume the critical overdensity is independent to the mass scale, and is the critical overdensity barrier for collapse, which can be derived analytically and given by for the spherical collapse of CDM. On the other hand, in the WDM case, we expect that the free streaming effect will allow the WDM particle escape out of the collapsing region, and as the result, the collapse of WDM will become more difficult on small scales. Barkana et al. (2001) studied the collapse thresholds for WDM by performing spherical collapse simulations. They find that, when the halo mass is below a characteristic mass scale, the threshold for collapse will increase rapidly with decreasing mass. Benson et al. (2013) provided a fitting function to describe the mass dependence of as
| (3) |
where
| (4) |
Here , and is the effective Jeans mass of the WDM as defined by Barkana et al. (2001):
| (5) |
where is the redshift of matter-radiation equality, is the effective number of degrees of freedom for the spin fermion, and is an auxiliary fitting function. can be calculated as the variance of the linear matter overdensity field when smoothed on a comoving scale :
| (6) |
where is the Fourier transform of a spherical top-hat filter window function. We can rewrite in terms of mass by relate the comoving scale with the the mass enclosed within this scale as . is the linear matter power spectrum, and it can represent the CDM and WDM linear power spectrum in this study.
Since WDM can suppress the matter clustering on small scales via the free streaming effect, the WDM linear matter power can be calculated by (Bode et al. 2001):
| (7) |
The CDM linear power spectrum is obtained by CAMB (Lewis et al. 2000), and the transfer function is assumed to be redshift independent, and it is given by
| (8) |
Where the fitting parameters are , Mpc.
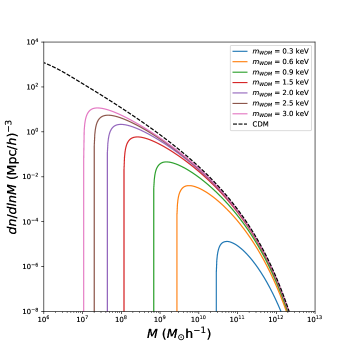
In Fig.1 we show the halo mass functions for both WDM and CDM cases at redshift , and we can find that the abundance of the low-mass halos are strongly suppressed by the free streaming of WDM. So the contribution of ionizing photons from low-mass galaxies will also be suppressed, and we are allowed to have a larger number density for massive galaxies without altering the reionization history.
2.2 Stellar Mass Density and Reionization History
After obtaining the halo mass function, the comoving cumulative halo mass density with halo mass greater than can be estimated by :
| (9) |
By considering the relation , the cumulative stellar mass density with stellar mass larger than can be written as :
| (10) |
The star formation efficiency can be considered as a mass-dependent quantity. In this work, we assume a double power-law form of , and following Mirocha et al. (2017) we have
| (11) |
where is the star formation efficiency at its peak mass , and and describe the power-law index at low and high masses. In our work, we adopt , and . The parameter will be adjusted to match the data in this work.
The star formation efficiency is tightly related to the emission of ionizing photons, and thus can change the cosmic reionization history. Usually, we can explore the reionization history by investigating the redshift evolution of the hydrogen volume filling factor by solving the differential equation as below (Madau et al. 1999; Wyithe & Loeb 2003):
| (12) |
Here we set the escape fraction (Sun et al. 2021), is the mean number density of hydrogen (both neutral and ionized) atoms today, is the clumping factor of the ionized gas (Kaurov & Gnedin 2015) which is assumed to be redshift-independent here, is the Case B recombination coefficient, and is the kinetic temperature. We set K as a constant (Robertson et al. 2015), and then the recombination coefficient cm3s-1. The total ionization fraction then can be estimated as below, by assuming the helium has the same first stage ionization fraction as hydrogen, and we have
| (13) |
where is the Helium element abundance. The ionizing photons emission rate per unit comoving volume can be estimated by
| (14) |
where is the total ionizing photons number that a stellar baryon can product throughout its lifetime for typical Pop II galaxies (Leitherer et al. 1999; Vázquez & Leitherer 2005; Leitherer et al. 2010, 2014). is the star formation time scale, which equals to of the Hubble time at redshift (Wyithe & Loeb 2006; Lidz et al. 2011). stands for the minimum halo mass corresponding to a virial temperature , and halos above this mass can sustain effective cooling via the Ly transition (Barkana & Loeb 2001):
| (15) |
where is the mean molecular weight, is energy density fraction of matter component at redshift , and with . We taken K to obtain the corresponding at each redshift.
In Eq. (14), we can find that the shape of mainly determine the contribution of ionizing photons from galaxies with different masses. In the CDM model, the low-mass galaxies will make a great contribution, but in WDM case, since the formation of low-mass galaxies is suppressed by WDM free streaming effect, the ionizing photons will be dominated by massive galaxies.
In addition, the optical depth of the cosmic microwave background (CMB) scattering is also a good probe for characterizing the reionization history, and it can be estimated by
| (16) |
where cm2 is the Thompson scattering cross-section.
3 Result
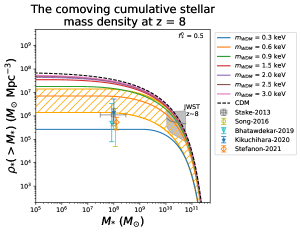
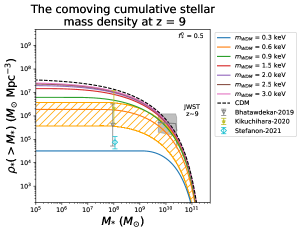
In Fig.2, we present the comoving cumulative stellar mass density at redshift and for different WDM masses and CDM case. We find that both WDM and CDM could consistent with data when the star formation efficiency paramter . But if we compare the result with the previous measurements (e.g. Hubble Ultra-Deep Field, Spitzer/Infrared Array Camera, Keck Observatory, and so on) at low stellar mass region (Stark et al. 2013; Song et al. 2016; Bhatawdekar et al. 2019; Kikuchihara et al. 2020; Stefanon et al. 2021), we can see that the CDM model will significantly over predict the stellar mass density at this region, since too many low-mass galaxies will form under such high star formation efficiency. On the other hand, the advantage of WDM model is that it will strongly suppress the formation of low-mass galaxies, and is able to match the measurements of both low-mass and high-mass regions. As a reference, we also show the result by varing the star formation efficiency parameter with keV shown as a hatched orange region.
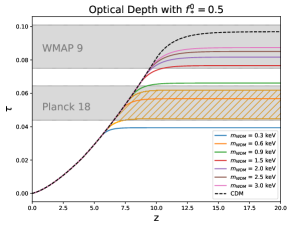
As we discuss in Sec.2.2, we can also check our result by investigating the impact of our model to the cosmic reionization history. We calculate the optical depth as a function of redshift for the WDM and CDM models, as shown in the left panel of Fig.3, and compare it with the 9-year (Hinshaw et al. 2013) and 2018 (Planck Collaboration et al. 2020) results. We can see that the model with keV is in good agreement with 2018 measurement.
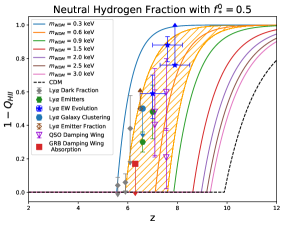
In the right panel of Fig.3, we present our calculation result of the neutral hydrogen fraction characterized by as a function of redshift. The data of observational constraints on the neutral hydrogen fraction from different methods are also shown for comparison, such as Ly forest dark fraction (McGreer et al. 2015), Ly emitters (Ota et al. 2008), Ly equivalent width (EW) distribution (Mason et al. 2018, 2019; Hoag et al. 2019), Ly galaxy clustering (Sobacchi & Mesinger 2015), Ly emitter fraction (Stark et al. 2011; Dijkstra et al. 2011), QSO damping wing Davies et al. (2018); Greig et al. (2019), and GRB damping wing absorption (Totani et al. 2006). We can see that, the WDM model with keV and (shown by the orange hatched region) is in good agreement with those observational data. So our result indicate that the model with keV can match both the high redshift comoving cumulative stellar mass density and the reionization history.
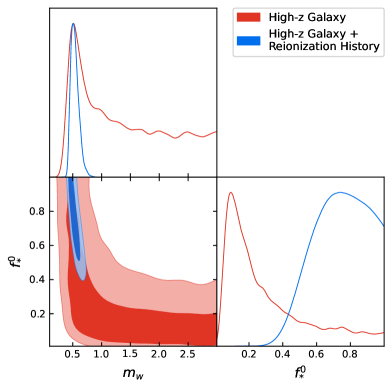
We also sample the posterior distribution of the model parameters using the Markov Chain Monte Carlo method (MCMC) with the Cobaya package (Torrado & Lewis 2019, 2021). The flat priors are used for the two model parameters with and . Since there is no effective constraint with JWST data only, we constrain the parameters using the cumulative stellar mass density data from both JWST and previous measurements at and 9, and also consider the reionization history data, including the optical depth measured by Planck and the neutral hydrogen fraction measured by various observations (see the data in Figure 2 and Figure 3).
We present the constraint result in Fig.4. As shown by the red contours, when only considering the cumulative stellar mass density data from JWST and previous measurements, it favors a large and a small which is similar as the CDM case, or a small and a large . The 1D probablity distribution functions (PDF) of the two parameters are shown in red curves, and we have () and () keV and () and (). When including the data from reionization history, we find that the constraint on is significantly improved with () and () keV, and only large () and () is favored in this case.
We notice that, this result may have some tension compared to previous studies. For example, using the UV luminosity functions of high redshift galaxies, a lower limit of keV can be obtained (Schultz et al. 2014; Menci et al. 2016; Corasaniti et al. 2017; Rudakovskyi et al. 2021). And a similar result can be derived using the global 21cm signal detected by EDGES (Experiment to Detect the Global Epoch of Reionization Signature) observation (Bowman et al. 2018), that the WDM models with keV can be ruled out (Chatterjee et al. 2019). We find that, in these works, a low star formation efficiency (e.g. ) is always assumed, which is derived from the observations of Hubble Space Telescope (HST) and other telescopes, and this may be different from the result implied by the data given by Labbé et al. (2023), which may favor a higher star formation efficiency with . In Fig. 1, Fig. 2, and Fig. 3, we plot the results of the WDM model with keV for comparison. We can see that the WDM model with keV has a suppression mass scale , and obviously cannot fit the data of reionization history with a large star formation efficiency (). A small star formation efficiency with is needed in this case to match the reionization data, but then the data shown in Fig. 2 cannot be matched, just like the CDM case. Besides, Enzi et al. (2021) derived a lower limit of keV by combining the strong gravitational lensing, the Ly forest and the abundence of the Milky Way satellites, which depends on the low-mass dark halo mass function and is obviously a challenge to our model. In our low WDM mass case, the formation of the dark halos below are strongly suppressed, and it may be challenging to explain the existence of low-mass galaxies in the Milky Way (McConnachie 2012; Newton et al. 2018). Hence, it seems that the inconsistency of the WDM particle mass between our result and the previous studies probably comes from the inconsistency between the data of and other previous observations.
We should note that there are indeed some argument on the data given by Labbé et al. (2023). For instance, Prada et al. (2023) found that their galaxy formation model can explains the UV luminosity function measured by (Naidu et al. 2022b; Donnan et al. 2023; Harikane et al. 2023) and HST (Oesch et al. 2018; Bouwens et al. 2021; Kauffmann et al. 2022), and their prediction on star formation rate and stellar mass at has good match with the observation of the spectroscopically-confirmed galaxies (Heintz et al. 2023; Fujimoto et al. 2023; Williams et al. 2023; Bouwens et al. 2022). So they claim that, the stellar mass-to-light ratio during early epochs could not have reached such high values reported by Labbé et al. (2023). Chen et al. (2023) discussed three sources of uncertainties in counting massive galaxies at high-, including cosmic variance, error in stellar mass estimate, and contribution by backsplash. They found that each of them can significantly affect the estimation of stellar mass density at high-. Besides, photometric redshift estimation (Adams et al. 2023) and dust extinction (Ferrara et al. 2022; Ziparo et al. 2023) are also important factors that need to be carefully calibrated in the data analysis. So follow-up measurements by spectroscopic observations (especially by the JWST/NIRSpec) are probably necessary for further confirmation of these data in the future.
4 Conclusion
Unexpected high stellar mass densities of massive galaxies at and have been found by the early observations, which may indicate a high star formation efficiency and can have tension with the current measurements of the cosmic reionization history. We propose that the WDM model can be a solution and explore the implications on the properties of WDM particle. Since WDM can suppress the formation of low-mass halos by free streaming effect, the number of small galaxies and hence the ionizing photons will be effectively decreased. Therefore, in this scenario, the reionization history would not be changed with a high star formation efficiency for high- massive galaxies.
After comparing the predictions of our WDM model to the (at high stellar masses) and other high-z galaxy observational data (at low stellar masses), the CMB optical depth measurement from , and the neutral hydrogen fraction of IGM measurement from a bunch of different methods, we employ the MCMC method to fit those observational data, and find that the WDM model with keV with is in good agreement with all these observational data in 95.5% C.L.
We should note that this result still has large uncertainties and may change with the adopted models and observational data. On one hand, there still may be large uncertainties in our current theoretical models and parameters about the WDM, optical depth, and reionization history, which can significantly change the derived WDM particle mass. On the other hand, the early release data of need to be further confirmed by follow up spectroscopic observations, especially with JWST/NIRCam. If we can obtain higher quality data from future observations of , we are supposed to put a more reliable and tighter constraint on WDM particle mass, and have a better understanding on the nature of dark matter and the galaxy formation process.
Acknowledgements.
We acknowledge the support of National Key R&D Program of China No.2022YFF0503404, 2020SKA0110402, MOST-2018YFE0120800, NSFC-11822305, NSFC-11773031, NSFC-11633004, NSFC-11473044, NSFC-11973047, the CAS Project for Young Scientists in Basic Research (No. YSBR-092), and the Chinese Academy of Science grants QYZDJ-SSW-SLH017, XDB 23040100, and XDA15020200. This work is also supported by the science research grants from the China Manned Space Project with NO.CMS-CSST-2021-B01 and CMS- CSST-2021-A01.References
- Adams et al. (2023) Adams, N. J., Conselice, C. J., Ferreira, L., et al. 2023, MNRAS, 518, 4755
- Barkana et al. (2001) Barkana, R., Haiman, Z., & Ostriker, J. P. 2001, ApJ, 558, 482
- Barkana & Loeb (2001) Barkana, R., & Loeb, A. 2001, Phys. Rep., 349, 125
- Benson et al. (2013) Benson, A. J., Farahi, A., Cole, S., et al. 2013, MNRAS, 428, 1774
- Bhatawdekar et al. (2019) Bhatawdekar, R., Conselice, C. J., Margalef-Bentabol, B., & Duncan, K. 2019, MNRAS, 486, 3805
- Biagetti et al. (2023) Biagetti, M., Franciolini, G., & Riotto, A. 2023, ApJ, 944, 113
- Blumenthal et al. (1982) Blumenthal, G. R., Pagels, H., & Primack, J. R. 1982, Nature, 299, 37
- Bode et al. (2001) Bode, P., Ostriker, J. P., & Turok, N. 2001, ApJ, 556, 93
- Bouwens et al. (2021) Bouwens, R. J., Oesch, P. A., Stefanon, M., et al. 2021, AJ, 162, 47
- Bouwens et al. (2022) Bouwens, R. J., Smit, R., Schouws, S., et al. 2022, ApJ, 931, 160
- Bowman et al. (2018) Bowman, J. D., Rogers, A. E. E., Monsalve, R. A., Mozdzen, T. J., & Mahesh, N. 2018, Nature, 555, 67
- Boylan-Kolchin (2023) Boylan-Kolchin, M. 2023, arXiv:2208.01611
- Bullock & Johnston (2005) Bullock, J. S., & Johnston, K. V. 2005, ApJ, 635, 931
- Chatterjee et al. (2019) Chatterjee, A., Dayal, P., Choudhury, T. R., & Hutter, A. 2019, MNRAS, 487, 3560
- Chen et al. (2023) Chen, Y., Mo, H. J., & Wang, K. 2023, arXiv e-prints, arXiv:2304.13890
- Cooray & Sheth (2002) Cooray, A., & Sheth, R. 2002, Phys. Rep., 372, 1
- Corasaniti et al. (2017) Corasaniti, P. S., Agarwal, S., Marsh, D. J. E., & Das, S. 2017, Phys. Rev. D, 95, 083512
- Davies et al. (2018) Davies, F. B., Hennawi, J. F., Bañados, E., et al. 2018, ApJ, 864, 142
- de Vega & Sanchez (2012) de Vega, H. J., & Sanchez, N. G. 2012, Phys. Rev. D, 85, 043517
- Dijkstra et al. (2011) Dijkstra, M., Mesinger, A., & Wyithe, J. S. B. 2011, MNRAS, 414, 2139
- Donnan et al. (2023) Donnan, C. T., McLeod, D. J., Dunlop, J. S., et al. 2023, MNRAS, 518, 6011
- Endsley et al. (2022) Endsley, R., Stark, D. P., Whitler, L., et al. 2022, arXiv e-prints, arXiv:2208.14999
- Enzi et al. (2021) Enzi, W., Murgia, R., Newton, O., et al. 2021, MNRAS, 506, 5848
- Ferrara et al. (2022) Ferrara, A., Pallottini, A., & Dayal, P. 2022, arXiv e-prints, arXiv:2208.00720
- Finkelstein et al. (2022) Finkelstein, S. L., Bagley, M. B., Haro, P. A., et al. 2022, ApJ, 940, L55
- Finkelstein et al. (2023) Finkelstein, S. L., Bagley, M. B., Ferguson, H. C., et al. 2023, ApJ, 946, L13
- Fujimoto et al. (2023) Fujimoto, S., Arrabal Haro, P., Dickinson, M., et al. 2023, arXiv e-prints, arXiv:2301.09482
- Gong et al. (2023) Gong, Y., Yue, B., Cao, Y., & Chen, X. 2023, ApJ, 947, 28
- Greig et al. (2019) Greig, B., Mesinger, A., & Bañados, E. 2019, MNRAS, 484, 5094
- Harikane et al. (2023) Harikane, Y., Ouchi, M., Oguri, M., et al. 2023, ApJS, 265, 5
- Heintz et al. (2023) Heintz, K. E., Giménez-Arteaga, C., Fujimoto, S., et al. 2023, ApJ, 944, L30
- Hinshaw et al. (2013) Hinshaw, G., Larson, D., Komatsu, E., et al. 2013, ApJS, 208, 19
- Hoag et al. (2019) Hoag, A., Bradač, M., Huang, K., et al. 2019, ApJ, 878, 12
- Hütsi et al. (2023) Hütsi, G., Raidal, M., Urrutia, J., Vaskonen, V., & Veermäe, H. 2023, Phys. Rev. D, 107, 043502
- Jiao et al. (2023) Jiao, H., Brandenberger, R., & Refregier, A. 2023, arXiv e-prints, arXiv:2304.06429
- Kauffmann et al. (2022) Kauffmann, O. B., Ilbert, O., Weaver, J. R., et al. 2022, A&A, 667, A65
- Kaurov & Gnedin (2015) Kaurov, A. A., & Gnedin, N. Y. 2015, ApJ, 810, 154
- Kazantzidis et al. (2004) Kazantzidis, S., Mayer, L., Mastropietro, C., et al. 2004, ApJ, 608, 663
- Kikuchihara et al. (2020) Kikuchihara, S., Ouchi, M., Ono, Y., et al. 2020, ApJ, 893, 60
- Labbé et al. (2023) Labbé, I., van Dokkum, P., Nelson, E., et al. 2023, Nature, 616, 266
- Leitherer et al. (2014) Leitherer, C., Ekström, S., Meynet, G., et al. 2014, ApJS, 212, 14
- Leitherer et al. (2010) Leitherer, C., Ortiz Otálvaro, P. A., Bresolin, F., et al. 2010, ApJS, 189, 309
- Leitherer et al. (1999) Leitherer, C., Schaerer, D., Goldader, J. D., et al. 1999, ApJS, 123, 3
- Lewis et al. (2000) Lewis, A., Challinor, A., & Lasenby, A. 2000, ApJ, 538, 473
- Lidz et al. (2011) Lidz, A., Furlanetto, S. R., Oh, S. P., et al. 2011, ApJ, 741, 70
- Liu & Bromm (2022) Liu, B., & Bromm, V. 2022, ApJ, 937, L30
- Madau et al. (1999) Madau, P., Haardt, F., & Rees, M. J. 1999, ApJ, 514, 648
- Mason et al. (2023) Mason, C. A., Trenti, M., & Treu, T. 2023, MNRAS, 521, 497
- Mason et al. (2018) Mason, C. A., Treu, T., Dijkstra, M., et al. 2018, ApJ, 856, 2
- Mason et al. (2019) Mason, C. A., Fontana, A., Treu, T., et al. 2019, MNRAS, 485, 3947
- McConnachie (2012) McConnachie, A. W. 2012, AJ, 144, 4
- McGreer et al. (2015) McGreer, I. D., Mesinger, A., & D’Odorico, V. 2015, MNRAS, 447, 499
- Menci et al. (2022) Menci, N., Castellano, M., Santini, P., et al. 2022, ApJ, 938, L5
- Menci et al. (2016) Menci, N., Grazian, A., Castellano, M., & Sanchez, N. G. 2016, ApJ, 825, L1
- Mirocha & Furlanetto (2023) Mirocha, J., & Furlanetto, S. R. 2023, MNRAS, 519, 843
- Mirocha et al. (2017) Mirocha, J., Furlanetto, S. R., & Sun, G. 2017, MNRAS, 464, 1365
- Naidu et al. (2022a) Naidu, R. P., Oesch, P. A., Setton, D. J., et al. 2022a, arXiv e-prints, arXiv:2208.02794
- Naidu et al. (2022b) Naidu, R. P., Oesch, P. A., van Dokkum, P., et al. 2022b, ApJ, 940, L14
- Newton et al. (2018) Newton, O., Cautun, M., Jenkins, A., Frenk, C. S., & Helly, J. C. 2018, MNRAS, 479, 2853
- Oesch et al. (2018) Oesch, P. A., Bouwens, R. J., Illingworth, G. D., Labbé, I., & Stefanon, M. 2018, ApJ, 855, 105
- Ota et al. (2008) Ota, K., Iye, M., Kashikawa, N., et al. 2008, ApJ, 677, 12
- Padmanabhan & Loeb (2023) Padmanabhan, H., & Loeb, A. 2023, ApJ, 953, L4
- Parashari & Laha (2023) Parashari, P., & Laha, R. 2023, arXiv:2305.00999
- Peñarrubia et al. (2008) Peñarrubia, J., Navarro, J. F., & McConnachie, A. W. 2008, ApJ, 673, 226
- Planck Collaboration et al. (2020) Planck Collaboration, Aghanim, N., Akrami, Y., et al. 2020, A&A, 641, A6
- Prada et al. (2023) Prada, F., Behroozi, P., Ishiyama, T., Klypin, A., & Pérez, E. 2023, arXiv e-prints, arXiv:2304.11911
- Press & Schechter (1974) Press, W. H., & Schechter, P. 1974, ApJ, 187, 425
- Robertson et al. (2015) Robertson, B. E., Ellis, R. S., Furlanetto, S. R., & Dunlop, J. S. 2015, ApJ, 802, L19
- Rudakovskyi et al. (2021) Rudakovskyi, A., Mesinger, A., Savchenko, D., & Gillet, N. 2021, MNRAS, 507, 3046
- Schultz et al. (2014) Schultz, C., Oñorbe, J., Abazajian, K. N., & Bullock, J. S. 2014, MNRAS, 442, 1597
- Sheth et al. (2001) Sheth, R. K., Mo, H. J., & Tormen, G. 2001, MNRAS, 323, 1
- Sheth & Tormen (1999) Sheth, R. K., & Tormen, G. 1999, MNRAS, 308, 119
- Sobacchi & Mesinger (2015) Sobacchi, E., & Mesinger, A. 2015, MNRAS, 453, 1843
- Song et al. (2016) Song, M., Finkelstein, S. L., Ashby, M. L. N., et al. 2016, ApJ, 825, 5
- Stark et al. (2011) Stark, D. P., Ellis, R. S., & Ouchi, M. 2011, ApJ, 728, L2
- Stark et al. (2013) Stark, D. P., Schenker, M. A., Ellis, R., et al. 2013, ApJ, 763, 129
- Stefanon et al. (2021) Stefanon, M., Bouwens, R. J., Labbé, I., et al. 2021, ApJ, 922, 29
- Sun et al. (2021) Sun, G., Mirocha, J., Mebane, R. H., & Furlanetto, S. R. 2021, MNRAS, 508, 1954
- Torrado & Lewis (2019) Torrado, J., & Lewis, A. 2019, Cobaya: Bayesian analysis in cosmology, Astrophysics Source Code Library, record ascl:1910.019
- Torrado & Lewis (2021) Torrado, J., & Lewis, A. 2021, J. Cosmology Astropart. Phys, 2021, 057
- Totani et al. (2006) Totani, T., Kawai, N., Kosugi, G., et al. 2006, PASJ, 58, 485
- Trinca et al. (2023) Trinca, A., Schneider, R., Valiante, R., et al. 2023, arXiv e-prints, arXiv:2305.04944
- Vázquez & Leitherer (2005) Vázquez, G. A., & Leitherer, C. 2005, ApJ, 621, 695
- Williams et al. (2023) Williams, H., Kelly, P. L., Chen, W., et al. 2023, Science, 380, 416
- Wyithe & Loeb (2003) Wyithe, J. S. B., & Loeb, A. 2003, ApJ, 588, L69
- Wyithe & Loeb (2006) Wyithe, J. S. B., & Loeb, A. 2006, Nature, 441, 322
- Yuan et al. (2023) Yuan, G.-W., Lei, L., Wang, Y.-Z., et al. 2023, arXiv e-prints, arXiv:2303.09391
- Ziparo et al. (2023) Ziparo, F., Ferrara, A., Sommovigo, L., & Kohandel, M. 2023, MNRAS, 520, 2445