Large-scale adaptive multiple testing for sequential data controlling false discovery and nondiscovery rates
Abstract
In modern scientific experiments, we frequently encounter data that have large dimensions, and in some experiments, such high dimensional data arrive sequentially or in stages rather than full data being available all at a time. We develop multiple testing procedures with simultaneous control of false discovery and nondiscovery rates when -variate data vectors are observed sequentially or in groups and each coordinate of these vectors leads to a hypothesis testing. Existing multiple testing methods for sequential data uses fixed stopping boundaries that do not depend on sample size, and hence, are quite conservative when the number of hypotheses is large. We propose sequential tests based on adaptive stopping boundaries that ensure shrinkage of the continue sampling region as the sample size increases. Under minimal assumptions on the data sequence, we first develop a test, i.e., a stopping and a decision rule, based on an oracle test statistic such that both false discovery rate (FDR) and false nondiscovery rate (FNR) are nearly equal to some prefixed levels with strong control at these levels. Under a two-group mixture model assumption, we propose a data-driven stopping and decision rule based on local false discovery rate statistic that mimics the oracle rule and guarantees simultaneous control of FDR and FNR asymptotically as tends to infinity. Both the oracle and the data-driven stopping times are shown to be finite (i.e., proper) with probability 1 for all finite and converge to a finite constant as grows to infinity. Further, we compare the data-driven test with the existing “gap” rule proposed in He and Bartroff, (2021) and show that the ratio of the expected sample sizes of our method and the “gap” rule tends to zero as goes to infinity. Extensive analysis of simulated datasets as well as some real datasets illustrate the superiority of the proposed tests over some existing methods.
Key words and phrases: Average sample number, Compound decision rule, False discovery and nondiscovery proportions, Local false discovery rate, Multiple comparison, Sequential sampling, Stopping rule.
1 Introduction
Technological advancements in the past few decades have challenged statisticians with the task of drawing inferences for high-dimensional or ultrahigh-dimensional data which led to the development of a myriad of innovative statistical methodologies suited for those settings. Among many high-dimensional statistical problems, large-scale multiple testing got much attention due to its vast applications in many areas including genetics, medical imaging, and astrophysics, to name a few. For instance,“high throughput” devices such as microarrays produce gene expression levels and a statistician needs to compare sick and healthy subjects for thousands or even millions of genes simultaneously (Dudoit et al., (2008)). Multiple testing of a large number of hypotheses also arises in many spatial settings such as disease mapping (Green and Richardson, (2002)), astronomical surveys (Miller et al., (2001)), and public health surveillance (Caldas de Castro and Singer, (2006)), among others. A widely popular error metric for large-scale multiple testing is the false discovery rate (FDR), proposed in the seminar paper by Benjamini and Hochberg, (1995), which is the expected value of false discovery proportion (FDP) defined as the ratio of the number of false rejections divided by the total number of rejections. Substantially large number of statistical methods have been developed to control FDR or some variations of it such as marginal FDR (mFDR, Genovese and Wasserman, (2002)), positive FDR (pFDR, Storey, (2002)) and false discovery exceedance (FDX, Perone Pacifico et al., (2004)) and some of these methodologies are developed in the context of large-scale multiple testing when grows to infinity. To review the literature on large-scale multiple testing and FDR controlling methodologies, we refer to Cai and Sun, (2011), Cao et al., (2022), Sun and Cai, (2007), Sun et al., (2015) and the references therein.
The above multiple testing procedures are applicable when full data is available at the time of testing and these are known as fixed-sample-size tests. However, there are a number of applications when, instead of full data being available at the time of analysis, data arrive sequentially one at a time or in groups or stages. A statistician may need to draw inferences each time new data arrives based on the data available till that time point. For such sequentially observed data, sometimes referred to as streaming data, one may need to test multiple hypotheses simultaneously. A very natural application of sequential multiple testing is in clinical trials with multiple endpoints where patients are collected sequentially or in groups. At each interim stage of such trials, a decision is made whether to accept or reject or to collect more samples.
Sequential multiple testing has evolved into its current form in the last decade. Three approaches of sequential testing have been adopted by statisticians. In the first approach, decisions for all the hypotheses are made simultaneously. This approach is favorable when the data arrive as units or vectors of size and therefore the cost of observing individual coordinates corresponding to different data-streams for each unit is insignificant in respect to that of engaging a new unit. The authors who followed this approach include De and Baron, 2012a ; De and Baron, 2012b ; De and Baron, (2015); Song and Fellouris, (2017, 2019); He and Bartroff, (2021).
In the second approach, each data-stream is considered to be sequential results of conducting a different experiment. Therefore it is permissible for data-streams to be stopped at different time points. This approach is helpful when the cost of conducting different experiments is higher than involving a new unit. Related works include Bartroff and Song, (2014, 2020); Bartroff, (2018).
The third approach is known as online multiple testing. Here, instead of the sequential arrival of new observations, new hypotheses are taken into consideration and the objective is to control some measure of false positives like (Foster and Stine, (2008); Aharoni and Rosset, (2014); Javanmard and Montanari, (2018); Ramdas et al., (2017, 2018); Gang et al., (2023)) and (Tian and Ramdas, (2021)).
In this article, we are following the first approach. i.e., the number of hypotheses() is fixed and new observations appear as vectors of size . In the literature, among the first and second approaches, the following pairs of error matrices were considered to be controlled: - and - (De and Baron, 2012a ; De and Baron, 2012b ; Bartroff and Song, (2014); Song and Fellouris, (2017)); and (Bartroff and Song, (2020); He and Bartroff, (2021)); and generalized pair (De and Baron, (2015); Song and Fellouris, (2019)). These existing methods perform well when the number of hypotheses is small. But in a large-scale setting, the controls become conservative. i.e., as grows larger, the attained error matrices become much smaller than the supposed control which implies a large stopping sample size. In the non-sequential version of multiple testing, the articles Sun and Cai, (2007, 2009); Cai and Sun, (2009); Sun et al., (2015) provide a line of optimal methods that work well in large-scale scenarios. In this article, we have followed their methods for obtaining a sequential multiple testing method appropriate for a large number of hypotheses. The main contributions of this paper are the following. I. We provide an oracle rule for a general setup with adaptive boundaries that is proper and achieves and control under minimal conditions. II. Under the two-group mixture model, we develop an adaptive data-driven rule that achieves asymptotic control of and as the number of hypotheses grows to infinity. III. The stopping time for the oracle and the data-driven rule under the two-group mixture model converges weakly to a finite natural number as tends to infinity. IV. Finally, we show that the Asymptotic relative efficiency of the ‘GAP’ rule compared to our oracle rule under the two-group mixture model tends to zero. The article is organized in the following way: in section 2 we have described the basic setup and required assumptions. In section 3 the oracle rule for general setup has been proposed and the Theorem 1 is expressed. Section 4 considers a more specialized two-group mixture model set up and the updated oracle rule for this setup is formulated. Also in section 4 a data-driven rule has been proposed and Theorems 2 and 3 have been stated. Section 5 establishes the asymptotic dominance of stopping times of the asymptotically optimal rule of He and Bartroff, (2021) on our oracle rule. Section 6 verifies the results stated in this article numerically with simulation studies. In section 7 we have applied our method on two real data sets. Proofs of the theorems and the lemmas are included in the appendices A-D.
2 Model Description
Suppose, with respect to some measurable space , we are required to test pairs of hypotheses simultaneously. A vector of binary () random variables determines the true states of the hypotheses such that, if is (), then the -th null (alternative) hypotheses is true. A sequence of random -vectors are defined on a sequence of monotone increasing sigma fields such that . is called the -th test statistic at ‘time’ and is used to test for the -th pair of hypotheses.
A sequential test for testing the hypotheses is defined as the pair ; Where is a -stopping time (i.e., if is observed up to time point , then is defined on the -field ). is a decision vector defined on -field . We say we reject -th null hypothesis (or simply reject) if and accept otherwise. The dependency of on is suppressed for simplicity of notation. Any sequential test defined in such a way makes false rejections among rejections and false acceptance among acceptance when the true states of the hypotheses are given by . We follow a Bayesian path by considering to be random with some distributional assumption on it. In light of the above discussion, and for the sequential multiple test are defined as follows:
| (1) | ||||
| (2) |
For simplicity, we have omitted the dependence of the test in the definition of and . Fix . Our objective is to find a test which controls and at levels and respectively. Keeping this objective in mind we define a class of tests:
A desirable criterion for any sequential simultaneous test is to belong in the class . In literature, among the existing sequential multiple testing methods, He and Bartroff, (2021) and Bartroff and Song, (2020) provide sequential multiple testing rules . The premise in Bartroff and Song, (2020) is different from us as different coordinates are allowed to have different stopping times. The asymptotically optimal decision rule in He and Bartroff, (2021) is more suitable for type and control and therefore results in a conservative control for and . For large-scale multiple testing problems, such rules are not ideal. Along the lines of studies by Sun et al. for multiple testing problems using local fdrs
Sun and Cai, (2009) defined Local Index of Significance(LIS) for as:
| (3) |
Suppose, given , the joint distribution of be . So,
| (4) |
Although, statistics are generally defined for continuous random variables, this definition can also be used for discrete test statistics. In that case, is discrete.
Jointly will be used to test the hypotheses
A large number of tests can be generalized in this form. For example, suppose, we want to compare the means of some variable of two homogeneous groups where the observations from new units of each group are obtained sequentially. A sequential two-sample t-test is appropriate in such a situation. Crockett and Gebski, (1984) provides a brief review on this topic. Here, if the size of the observations from the -th group is , , we can consider the sequential statistics with total sample size to be and thus our setup applies here.
In the multiple testing literature, authors have mostly used the p values as the test statistics. For the sequential cases too, we can compute and upgrade the p values at each sample size(). Similarly, we can compute the statistic given the null distribution and alternative distributions are known. If the observations are continuous, we can also compute a simple transformation , where, is the p value corresponding to the -th coordinate with sample size and is the standard normal CDF. Such transformations are very useful for testing purposes. For continuous random variables, Efron, 2004a proposed the use of z-score. Sun and Cai, (2007) showed that, when the both-sided alternatives are asymmetric, the z- score approach has some advantages over the p value based methods. In our analysis, we will take shelter of the z score based method whenever possible.
3 Oracle rule using LIS statistics
In this section we propose the oracle adaptive rule for general set up. This rule is based on the perspective of a wise oracle who knows the exact joint distribution of the data streams at each time point. Fix , . The rule is described in Algorithm 1.
Discussion 1:
If , we have only one choice of given by . i.e., we have a unique decision. But otherwise can take any one of the values in . For a proper choice of we can define to be
Where is the greatest integer function. Now if the probability of a hypothesis to be null is , the expected number of null hypotheses is . So if the probability of a null hypothesis to be rejected is and the probability of an alternative hypothesis to be falsely accepted is , then the expected total number of rejections is and expected total number of acceptance is . We equate the mFDR i.e. the proportion of expected false rejections and expected rejection with and mFNR i.e. the proportion of expected false acceptance and expected acceptance with to get estimates of and as
The idea is that those undecided hypotheses potentially have the highest values among those rejected (if they are rejected) or potentially have the lowest values among those accepted. Hence they are most likely to be false positives or false negative decisions. Therefore we want to divide the undecided region into two parts proportional to expected false rejection and expected false acceptance. i.e., we choose , where the values of and are given as above.
Discussion 2:
From algorithm 1, we can define for stage the adaptive lower cutoff, denoted by as,
| (5) |
Any hypothesis with value () less than is considered to be a potential alternative. Similarly we can define the adaptive upper cutoff for stage denoted by as,
| (6) |
Any hypothesis with value () greater than is considered to be a potential null.
Lemma 1.
Suppose all the components of are continuous. For some , if and only if almost surely. Further, if there are some discrete variables present in the mix then, implies .
Proof of lemma 1 is in appendix D. From lemma 1, we see that, the time taken for arriving at the criteria is equal to almost surely if all the components in are continuous, whereas, for the presence of discrete random variables, the corresponding time is almost surely greater than or equal to . Due to the analytic advantage of this new criteria, we redefine our stopping rule as:
| (7) |
To ensure the termination of the procedure at a finite time, we make the following assumption:
Assumption 1.
Under , and under , .
This assumption makes sure that as we observe more data, evidence towards the truth increases weakly.
For some , denotes the set
The following theorem proves that the oracle rule for general setup is proper and controls both and .
Theorem 1.
Fix . Suppose Assumption 1 holds and . Let () be the oracle rule characterized by algorithm 1. then
| (8) |
And further,
| (9) |
In practice, it is hard to compute the values under a general setup. Assumption 2 refers to a two-grouped mixture model, where, for each coordinate depends on observation in that coordinate only. Under such premise, are proved to be equal to local FDR () almost surely. Efron, 2004b explored the idea of and its application in multiple testing using a two-component mixture model. In the next section, we assume a similar model and develop an oracle (data-driven) rule using as the test statistic.
4 Oracle and data-driven rules under two group mixture model
4.1 Oracle Rule
In this section, we consider the following assumptions on the statistics :
Assumption 2.
| (10) | |||
| (11) |
where, . The for at time is defined as
| (12) |
Efron, 2004b showed that Assumption 2 implies . Now we introduce the following lemma :
Lemma 2.
If Assumption 2 is true, then
This equality occurs as a result of Assumption 2. The proof is in appendix D. So, using the statistics an adaptive oracle rule similar to that of the oracle rule for the general setup may be formulated. Fix . The rule is obtained by replacing with in algorithm 1.
Discussion:
Like before we can define for stage the adaptive lower cutoff, denoted by as,
| (13) |
Any hypothesis with () less than is considered to be a potential alternative. Similarly we can define the adaptive upper cutoff for stage denoted by as,
| (14) |
Any hypothesis with ( greater than is considered to be a potential null. We can define the stopping time to be
| (15) |
This new stopping time, like before, is almost surely equal to that of the original stopping time for the continuous case, but is greater than equal to the original stopping time for the discrete case.
The following theorem shows that the oracle rule under the independent mixture model is proper and controls and at desired levels.
Theorem 2.
4.2 Data-driven Rule:
From our earlier discussion, it is established that, , but in practice , and are not known. Therefore, we cannot use the oracle rule directly. In the case of being a vector of independent continuous random variables, estimates of all of these quantities are readily available in the literature. For example, when the sample size is , if the null distribution of each of the statistics is , we can construct the z scores as
Then the null distribution for these z scores is standard normal. We can obtain the estimate of the null proportion following Cai and Jin, (2010). The denominator can be obtained using a kernel density estimator. Once all the unknown quantities are estimated, we get the estimated local fdr values as and we can replace with in algorithm 1 to get the data-driven rule for independent mixture model set up for fixed .
Discussion:
Like earlier, we can define for stage the adaptive lower cutoff, denoted by as,
| (18) |
Any hypothesis with estimated () less than is considered to be a potential alternative. Similarly we can define the adaptive upper cutoff for stage denoted by as,
| (19) |
Any hypothesis with estimated () greater than is considered to be a potential null.
Lemma 3.
Suppose each co-ordinates of are continuous random variables. For some , if and only if almost surely.
Proof of Lemma 3 is similar to that of Lemma 1 and therefore omitted. Due to Lemma 3, occurs for the first time at . So we can restate the data-driven rule by changing the stopping criteria as:
“Stop sampling as soon as ”
For the data-driven rule to work properly, we require the estimated local fdrs to be in close proximity to the actual local fdr values . We can ensure an asymptotic accuracy of the method i.e. the error rates are asymptotically contained at a prefixed value (Theorem 3) if the following consistency property for the estimates of the local fdrs holds for each coordinate.
Assumption 3.
As , for all ,
| (20) |
The following theorem proves that the above procedure controls both and asymptotically.
Theorem 3.
The proof is included in appendix C.
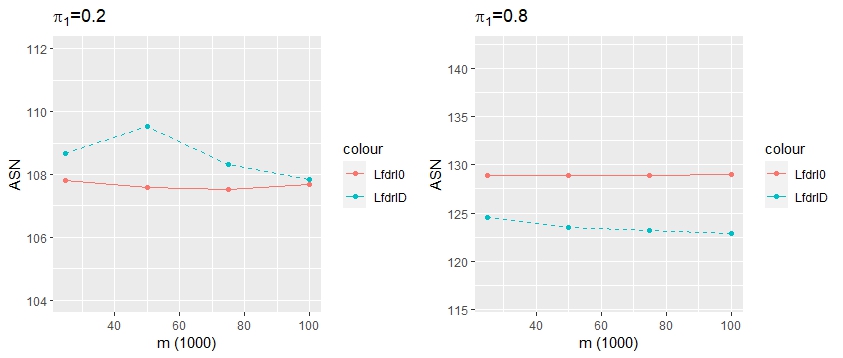
As an intermediate step of proving theorem 3, we stated and proved lemma 12. This and corollary 3 are important results of this paper. Lemma 12 says that if the statistics are continuous and assumptions 1,2 and 3 are satisfied, then, the stopping time for the data-driven rule converges weakly to a finite non-stochastic positive integer as the number of hypotheses grows to infinity. corollary 3 yields the same result for the oracle stopping time too. This is very important because, in the existing literature, there are no such sequential multiple testing methods that stop in a finite time even when the number of hypotheses gets large indefinitely. As we shall see in the next section, the stopping time of the only competitor of our method, He and Bartroff, (2021), converges to infinity. This result helps our method carry out large-scale multiple testing problems at a very low cost. This phenomenon is illustrated in figure 1.
5 Comparison with existing competitor
He and Bartroff, (2021) proved that if the number of alternatives is known () then among all tests that reject exactly hypotheses, the Gap Rule defined in Song and Fellouris, (2017) is asymptotically optimal for simultaneously controlling and as and tends to , given for each coordinate, a simple null is tested against a simple alternative and observations against each coordinate are iid. They also study the asymptotics of as functions of and provide some restrictions so that the optimality holds. However, the asymptotic behavior of the expected stopping time as has not been studied. In this section we shall show that, for the independence setup described in Assumption 2 stopping time for Gap rule goes to in a weak sense.
Lemma 4.
corollary 1.
6 Simulation Study:
| (%) | (%) | (%) | (%) | (s%) | (%) | (%) | (s%) | |||||
|---|---|---|---|---|---|---|---|---|---|---|---|---|
| E1 | 100 | 0.2 | 109.5 | 4.07 | 10.16 | 107.3 | 5.74 | 10.76 | 227.9 (53) | 4.80 | 1.18 | 563.7 (81) |
| 0.8 | 132.9 | 4.67 | 10.2 | 146.1 | 5.95 | 8.55 | 169.7 (14) | 2.35 | 9.60 | 554.8 (74) | ||
| 500 | 0.2 | 109.7 | 5.12 | 10.19 | 122.7 | 5.37 | 8.88 | 254.0 (52) | 4.43 | 1.11 | 823.1 (85) | |
| 0.8 | 130.6 | 4.89 | 9.83 | 141.5 | 5.42 | 7.96 | 183.8 (23) | 2.15 | 8.64 | 841.4 (83) | ||
| 1000 | 0.2 | 110.2 | 4.82 | 10.03 | 118.6 | 4.65 | 9.09 | 252.4 (53) | 4.57 | 1.13 | 957.4 (88) | |
| 0.8 | 130.4 | 4.76 | 10.00 | 138.4 | 5.14 | 8.19 | 176.9 (22) | 2.30 | 9.24 | 972.2 (86) | ||
| E2 | 100 | 0.2 | 185.04 | 5.03 | 10.14 | 187.55 | 5.89 | 10.77 | 412.2 (55) | 5.06 | 1.23 | 1067.5 (82) |
| 0.8 | 246.9 | 4.39 | 10.06 | 258.24 | 5.39 | 10.94 | 309.6 (17) | 2.49 | 10.83 | 1070.6 (76) | ||
| 500 | 0.2 | 192.28 | 4.92 | 9.89 | 210.04 | 5.11 | 9.11 | 454.9 (54) | 4.84 | 1.19 | 1584.2 (87) | |
| 0.8 | 246.22 | 4.97 | 10.22 | 246.97 | 5.14 | 11.19 | 317.7 (22) | 2.56 | 10.34 | 1594.6 (85) | ||
| 1000 | 0.2 | 193.13 | 4.86 | 9.93 | 199.3 | 5.03 | 9.73 | 452.9 (56) | 4.89 | 1.23 | 1808.8 (89) | |
| 0.8 | 248.5 | 4.98 | 10.19 | 242.6 | 4.88 | 11.9 | 333.4 (27) | 2.36 | 9.44 | 1821.9 (87) | ||
| E3 | 100 | 0.2 | 90.3 | 4.25 | 10.21 | 101.6 | 5.63 | 9.62 | 192.9 (47) | 4.28 | 1.03 | 296.2 (66) |
| 0.8 | 124.6 | 4.61 | 11.0 | 122.8 | 4.86 | 14.25 | 155.1 (21) | 2.39 | 9.66 | 297.8 (59) | ||
| 500 | 0.2 | 91.5 | 5.22 | 9.88 | 93.1 | 5.61 | 9.87 | 229.9 (60) | 4.97 | 1.26 | 504.5 (82) | |
| 0.8 | 128.1 | 4.93 | 9.87 | 120.5 | 4.63 | 13.99 | 165.4 (27) | 2.37 | 9.85 | 507.9 (76) | ||
| 1000 | 0.2 | 91.3 | 5.21 | 9.89 | 93.1 | 5.14 | 9.94 | 231.16 (60) | 4.89 | 1.20 | 590.7 (84) | |
| 0.8 | 128.0 | 4.95 | 9.90 | 118.9 | 4.63 | 13.96 | 168.4 (30) | 2.31 | 9.54 | 612.2 (81) | ||
| E4 | 100 | 0.2 | 41.7 | 4.30 | 9.63 | 36.7 | 6.05 | 11.02 | 75.88 (52) | 4.09 | 0.96 | 170.7 (79) |
| 0.8 | 53.3 | 4.79 | 8.92 | 53.4 | 4.75 | 9.50 | 65.13 (18) | 1.77 | 7.07 | 170.1 (69) | ||
| 500 | 0.2 | 41.5 | 4.91 | 9.82 | 41.4 | 5.55 | 9.00 | 104.9 (61) | 3.15 | 0.8 | 275.2 (85) | |
| 0.8 | 53.1 | 5.01 | 8.68 | 53.1 | 5.22 | 8.31 | 103.68 (49) | 0.84 | 3.44 | 278.7 (63) | ||
| 1000 | 0.2 | 41.6 | 4.96 | 9.32 | 43.0 | 5.82 | 8.36 | 134.21 (68) | 1.64 | 0.4 | 320.7 (87) | |
| 0.8 | 53.2 | 5.04 | 9.07 | 53.3 | 5.21 | 8.42 | 133.75 (60) | 0.4 | 1.63 | 324.8 (84) | ||
| LfdrID | BH | |||||||
|---|---|---|---|---|---|---|---|---|
| (%) | (%) | (s(%)) | (%) | (%) | ||||
| Ex 5 | 2500 | 0.2 | 267.76 | 4.97 | 12.7 | 332.0 (19) | 4.46 | 12.2 |
| 0.8 | 476.92 | 5.23 | 9.82 | 962.0 (50) | 0.98 | 9.8 | ||
| 7500 | 0.2 | 328.92 | 4.51 | 10.70 | 414.0 (21) | 4.07 | 10.51 | |
| 0.8 | 469.52 | 5.16 | 10.49 | 954.0 (51) | 0.98 | 10.51 | ||
| 10000 | 0.2 | 357.48 | 5.05 | 9.70 | 428.0 (17) | 3.93 | 9.79 | |
| 0.8 | 467.36 | 5.06 | 10.6 | 944.0 (51) | 0.98 | 10.51 | ||
| Ex 6 | 2500 | 0.2 | 121.72 | 5.03 | 8.8 | 151 (20) | 4.28 | 8.81 |
| 0.8 | 133.12 | 5.12 | 9.19 | 261 (49) | 0.99 | 9.37 | ||
| 7500 | 0.2 | 115.28 | 4.81 | 9.48 | 143 (19) | 4.07 | 9.51 | |
| 0.8 | 130.12 | 5.02 | 9.84 | 258 (50) | 1.00 | 9.88 | ||
| 10000 | 0.2 | 113.7 | 4.94 | 9.65 | 142 (20) | 3.98 | 9.66 | |
| 0.8 | 129.32 | 5.00 | 10.04 | 257 (50) | 1.04 | 9.96 | ||
| Ex 7 | 2500 | 0.2 | 209.78 | 5.78 | 9.99 | 234 (10) | 3.91 | 9.86 |
| 0.8 | 261.22 | 4.96 | 10.33 | 443 (41) | 0.91 | 10.26 | ||
| 7500 | 0.2 | 206.64 | 5.66 | 10.12 | 231 (11) | 3.65 | 10.29 | |
| 0.8 | 260.08 | 4.91 | 10.81 | 435 (40) | 0.90 | 10.97 | ||
| 10000 | 0.2 | 207.56 | 5.73 | 9.92 | 234 (11) | 3.82 | 9.91 | |
| 0.8 | 275.06 | 5.14 | 8.38 | 460 (40) | 1.00 | 8.35 | ||
In this section, our goal is to numerically validate the theoretical claims made earlier. The foremost of them was that the performance of the data-driven rule is asymptotically equivalent to that of the oracle rule. We also ensured theoretically that the expected stopping time of the Gap rule as proposed by He and Bartroff, (2021) is much higher than that of the oracle rule. Numerical validation for the same is provided here. Also, the adaptive Gap rule, where the cutoff boundary for making decisions is obtained using monte carlo simulations, can not be compared theoretically and therefore the comparison is made using numerical examples. Finally, we measured the performance of our sequential multiple testing rule with the Benjamini-Hochberg rule. Each numerical example is considered for two cases, one sparse case, where is 0.2 and one dense case with equal to 0.8.
We assume that, is a realised value on the unobservable random binary indices according to (10). Given , the data is generated from the mixture model
| (24) |
For the oracle rule the computation of local fdr is straightforward since the parameters and the distributions are assumed to be known. For the data-driven rule, null proportion is estimated using the method described in Cai and Jin, (2010) for the continuous case. Here, we have computed the z scores since the method requires the null distribution to be Gaussian. For the continuous case, the mixture density is estimated using the kernel density estimation method. The null distribution is assumed to be standard normal. The estimation method by Cai and Jin, (2010) requires a particular choice of the tuning parameter which was fixed at 0.1. The only case when a discrete distribution was assumed was to test whether the observation follow Bernoulli(7,0.1) () or a Bernoulli(7,0.3)() distribution. In that case, the null proportion was estimated using the method described by Storey et al., (2004). With that established, the other parts in the expression of local fdr are known since the pairs of hypotheses in question are both simple. Once we got the local fdr values, at each sample size, we follow the steps described in Algorithm 1. The corresponding code is very easy to implement and will be uploaded soon. Here, throughout this section, we have fixed at 5% and at 10%.
Numerical study 1:
In this example, we compare the performance of the oracle rule () with the data-driven rule (). As a data generating process, we consider the example 1 with and . The average sample numbers () were computed based on 50 Monte Carlo runs. Figure 1 shows an versus plot. The plots for both sparse and dense cases support our theoretical claim.
Numerical study 2:
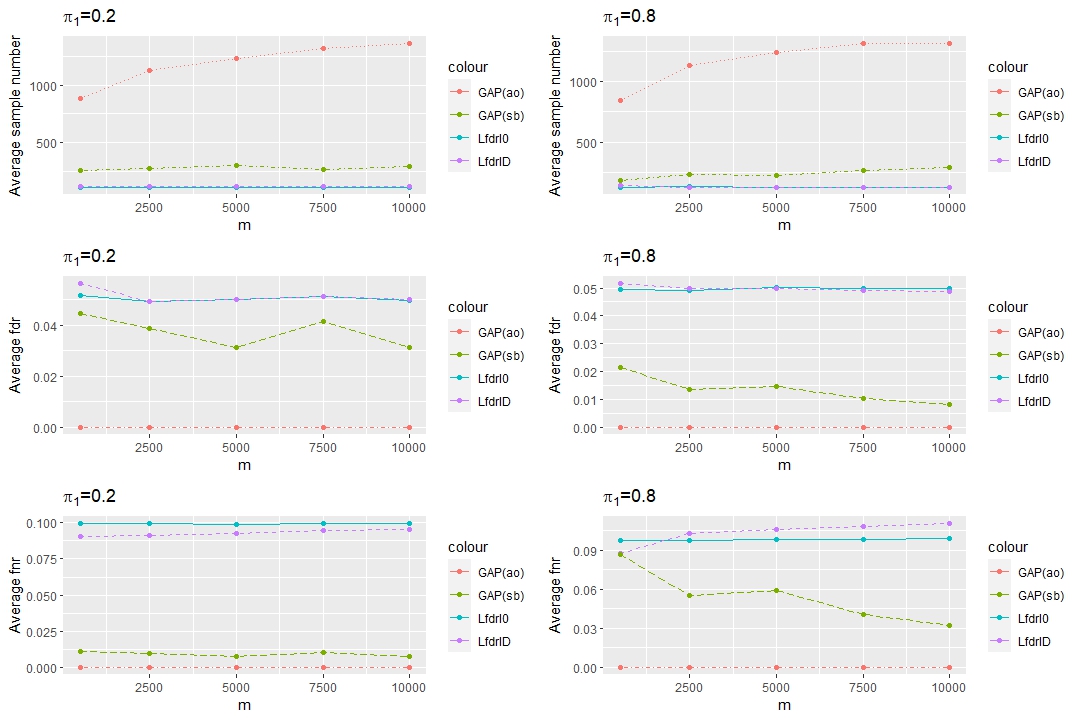
The performance of and are measured against that of the GAP rules as described in He and Bartroff, (2021). To implement the GAP rule, we need to be informed about the number of rejections. To make it comparable with our method, we generate the data using (24), we note the number of rejections for each case and use it for implementing the GAP rule. We also note that the implementation of GAP rule really works if the hypotheses to be tested are simple. We carefully choose such cases. The authors in He and Bartroff, (2021) provide one asymptotically optimal rule (), where a theoretical value of the cutoff is provided. For practical purposes, another adaptive rule is also mentioned, where the boundary is obtained by simulations. Here, whenever this rule () has been implemented, we have used 50 Monte Carlo runs and computed the average false discovery proportions () and the average false nondiscovery proportions (). We have repeated this process for different values of the cutoff starting from 0.1 with a gap of 0.1 until we get a cutoff for which and . Then for , we again compute the , and with 200 Monte Carlo runs.
We consider example 1 with and . Then for , , and , we generate plots of , and (each computed for 200 Monte Carlo runs) against in figure 2.
In table 1, we list the , and of , , and in different testing problems as will be discussed latter. In each case, we used 200 Monte Carlo runs to compute different components. We write down the savings in for using as compared to and . For the rule, the and has been omitted owing to the fact that, in each case, both of them have an average value of 0.
The exaples considered in table 1 are listed below.
Example 1: Here, . For table 1, we consider and .
Example 2: Here, . For table 1, we consider and .
Example 3: Here, . For table 1, we consider and .
Example 4: Here, . For table 1, we consider and .
For each of these examples, we observe that, the performance of and are equivalent. The most interesting observation here is that, on both of the cases, and are almost equal to desired levels and respectively. This proximity is more prominant and stable in case of in comparison with which supports the etsablished theory that, and control is exact in case of the oracle rule and is assymptotic in case of the data-driven rule. We can therefore hope to prove our method to be optimal in some sense in a future work. In each of the cases, results in 0 and with 0 standard error and therefore omitted in the table. Savings with respect to is reported for and . This savings is much higher in case of due to its conservative property. It is somewhat less but still significant in case of . Therefore table 1 shows absolute dominance of over the rule. Here the difference in savings for the sparse case and the dense case results from the asymmetry in the values of and chosen here. Similar resrults are obtained in case of large values of with respect to the example 1 as shown in figures 1 and 2.
Numerical study 3:
This study is so designed that, we can compare the performance of the sequential multiple testing method with some existing fixed sample rules- among which, that (BH) devised by Benjamini and Hochberg, (1995) is the most popular. Also, being an controlling rule, this is a matching competetor for us. For comparison purpose, we consider different hypotheses testing problems. In each cases, first, we run for 200 Monte Carlo runs with and fixed at level mentioned earlier and note the , and . Then, we continue run BH with same but different sample size and note untill we get a that yields a which is very close to that obtained from . We report , and . We also report savings in the of as compared with of BH. We use the BH function in the library ”Mutoss” in the Bioconductor repository for this purpose. The results are reported in table 2. Here the following examples have been considered.
Example 5: At each stage , for each coordinate , 2 observation are made. is invariably coming from the null distribution (control) and is coming from a mixture density (case). i.e., this is a sequential case-control or 2 sample study. For single hypotheses framework, such problem has a wide literature. One can refer to Crockett and Gebski, (1984) for some insights. Define to be the number of new observations of the control (case) variable to be made at each stage. Here we assumed . The alternative density () of the mixture distribution is considered to be bimodal. i.e.,
with . Here, we considered , , , and . We performed a 2 sample Welch test for each of the coordidnates. This Welch statistics becomes our intended statistics and we preform based on these test statistics. We use the p values from these tests to perform BH.
Example 6: We assume
Here, we considered , , . We performed the Student’s t test for this example. the and BH was performed as before based on the test statistics.
Example 7: We assume
Here, we considered , . As the test statistics, we calculated the log likelihood ratio. The standard distribution of the statistic is not known. Therefore, at each stage, we simulated 100000 null values of the statistics and we estimated the null CDF values using these simulated values and we obtained the z score and we proceeded as before. For computing the p values, we used the same simulated null log-likelihood ratios and the fact that a high likelihood ratio provides evidence against the null hypotheses. i.e., one-sided test was appropriate.
For each of these examples, we observe that the savings for using with respect to are large. The discrepancy in savings in sparse and the dense case is due to the difference in the proportion of null (), since it plays a major role in control of for method.
7 Data Application
In this section, we apply our method in real datasets and compared them against the Benjamini Hochberg method and the local fdr based method proposed by Sun and Cai, (2007). We have used 2 datasets for this purpose. The first of them is the Prostate Data (Singh et al., (2002)) obtained from https://efron.ckirby.su.domains/LSI/datasets-and-programs/. The dataset contains gene expression data on 6033 genes from 102 prostate cells. Among them, 52 were from tumor cells and the rest were from nontumor cells. Therefore, this constitutes a case-control study and the goal is to identify genes whose expressions are associated with prostate tumors.
Suppose, represents the th gene expression associated with the th prostate cell with tumor and represents the th gene expression associated with the th prostate cell without tumor. Here , , and . We have performed 2 sample t test against each of the genes. For the -th gene we have computed the statistic
Where, is the number of observations from the prostate tumor cells, is the number of samples from the prostate cells without tumor, and . , and are respectively the mean of the the gene expression for tumor cells, that of the non-tumor cells and the pulled standard deviation (with denominator ) fot the full data with and samples for the th gene. This is the two-sample t statistic corresponding to the sample of sizes and . Under the assumption that
and
for all , follows t distributions with degrees of freedom independently.
After standardizing and quantile normalizing the dataset, we compute for the full data, i.e., for and , the statistic corresponding to the -th gene, . Our objective is to test
Therefore, a both-side test is appropriate here. We compute the p values accordingly. i.e.,
Here, corresponds to the cdf of a t distribution with degrees of freedom.
Similarly, we calculate the z scores as
The following picture shows the histogram of the p values and z scores for the full data.
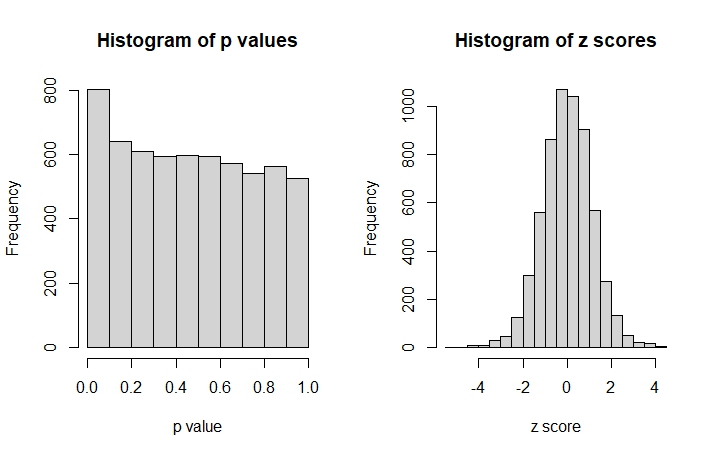
The histograms show that the z scores follow a normal distribution and the p values follow a uniform distribution (except perhaps for a larger frequency near 0), which justifies our assumption of normality for the data. The graphs indicate that the proportion of alternatives is relatively very small (i.e., this data is sparse).
First, we apply the Benjamini Hochberg rule (Benjamini and Hochberg, (1995)) for the full data. For this, we set . The number of positive genes we thus obtained is 21. We follow this by the AdaptZ method described by Sun and Cai, (2007) with the same value of . Here we obtained a total of 29 genes responsible for prostate cancer.
Finally, we apply our sequential multiple testing method to the dataset. We start with a pilot sample of 50 cells, among which, 25 were from the tumor cells (case) and 25 were from the normal cells (control). We then computed the z scores corresponding to the two-sample t-test statistics (under null which follow independent t distributions with parameter 48) against each gene expression value from the 50 cases and 50 controls. These z scores are used to compute the local fdr estimates for each of the 6033 genes. We then follow the second step of the algorithm of to obtain the number of potential nulls () and potential alternatives () at levels and . We note that, here and . i.e., which is less than 6033. So we proceed to the next stage. For each consecutive step, we obtain a new sample from either the case or the control with an equal probability. With this updated sample of size 51, we repeat the same process. We continue this until we have for some , . This is called the stopping time.
For , the stopping time is 69 and we can discover 12 genes to be positive. Here, the savings of the sample size is high (almost 32.4 %) But the number of discoveries is much less than both Benjamini Hochberg and AdaptZ methods. If we consider however, The stopping time is 87 (with a sample size savings of about 15 %), but our method discovers 23 positive genes. Which is higher than the number of discoveries made by the BH method.
The second dataset we have considered, is the dataset collected and used by Golub et al., (1999). The dataset consists of gene expression levels on 7129 genes from the bone marrow tissues of 72 acute leukemia patients. Among them, 47 were suffering from acute lymphoblastic leukemia, (ALL) and the rest of the 25 were acute myeloid leukemia (AML) patients. Our goal is to discover genes that discriminate between these two types of leukemia.
For this, we consider a mixture of gaussian distribution as before for each gene expression value for each patient. Therefore, a two-sample t-test is applicable here as well. The following picture shows the histograms of the z scores and p values for the full dataset.
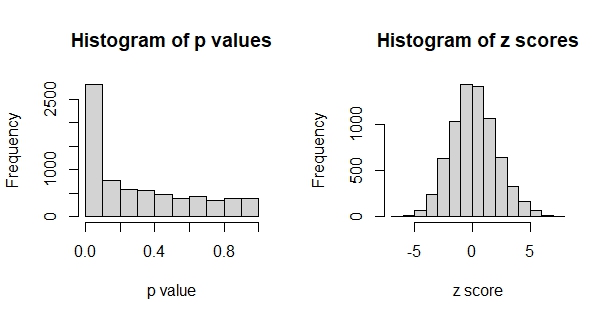
The histogram of p value has a peak near 0, otherwise, it seems to be uniformly distributed. The Histogram of the z scores resembles a normal distribution with slightly heavy frequencies at the tail. This tells us that the distribution is medium sparse.
The BH method for 0.05 discovers 1280 positive genes. AdaptZ method for the same level of can identify 1300 genes that can identify the difference between these two types of leukemia.
The method for and does not stop for the given dataset and it also identifies 1300 positive genes.
So, from the above data applications, we can conclude that, the data-driven method can either save sample size or performs as well as the optimal AdaptZ rule for the nonsequential case.
Appendix A Proof of Theorem 1
Proof.
Let be the set of signals. Note that, if at stage , and , then we must have, . i.e.,
The second line is due to Boole’s inequality. Here, and . The proof is complete if we take limit to both side of the inequality and use assumption 1.
To prove the second part, first note that for timepoint , both and are increasing in almost surely. Now we introduce the following 2 lemmas:
Lemma 5.
If almost surely, the test with , given by
controls at level for all .
and
Lemma 6.
If almost surely, the test with , given by
controls at level for all .
Appendix B Proof of Theorem 2
Proof.
First we state the following lemma:
Lemma 7.
Provided assumption 2 is true, for any random finite stopping time , defined on ,
| (25) |
Appendix C Proof of Theorem 3
Proof.
As discussed earlier, the hypothesis corresponding to data-stream with are considered potential alternatives and the hypothesis corresponding to data-stream with are considered potential nulls. If there are some data-streams with , we observe a new sampling unit. It is evident that if for some , , each data-stream is either a potential null or a potential alternative (or both!). So we can stop our sampling procedure. Lemma 4 says that for continuous test statistics, the opposite is also true; i.e., at stopping time , we must have with probability 1.
From the discussion above, we get an alternative definition of the stopping time ; namely, we stop at the earliest time when the adaptive rejection boundary is greater than the adaptive acceptance boundary . i.e., . This definition widens the scope to study the asymptotic behavior of the stopping time as the number of data-streams diverges to . But first, we need to establish the asymptotic properties of and . Define,
| (26) |
The following lemma describes some properties of the function :
Lemma 8.
-
1.
is constant in the interval for and in the intervals and
-
2.
is right-continuous in .
-
3.
is non-decreasing in .
The following lemma ensures a weak non-stochastic limit to .
Lemma 9.
Define for .Let, . Then,
| (28) |
The function has the following properties:
Lemma 10.
-
1.
is constant in the interval , for and in the intervals and
-
2.
is left-continuous in .
-
3.
is non-increasing in .
The proof is similar to the proof of Lemma 8 and so is omitted. It is easy to see that.
| (30) |
Finally, we find the limiting value of from the following lemma.
Lemma 11.
Define for .Let, . Then,
| (31) |
corollary 2.
Define, and . Then,
| (32) |
The next lemma ensures a finite stopping time for the data-driven rule even for an indefinitely large number of hypotheses.
Therefore, as the number of hypotheses increases, the oracle stopping time converges weakly towards a finite natural number . Proof of corollary 3 is a consequence of the proof of Lemma 12.
The proof of Theorem 3 is completed by the following lemma.
∎
Appendix D Proof of Lemmas
Proof of Lemma 1 :.
First, note that, for continuous test statistics , .
part: We assume that, . For the trivial cases, i.e., when for example, by definition, . Therefore, almost surely. The same follows when .
So, if the non-trivial case is true, i.e., , by definitions of and , and . And finally, almost surely. The second part of the lemma is therefore proved.
part: Let . For , we know, almost surely, which in turn proves that almost surely. Similarly if , the same result follows.
For the non trivial case, i.e., when and , we have and . Finally we have i.e., , i.e., almost surely. ∎
Proof of Lemma 2.
∎
Proof of Lemma 4..
Assumption 2 states that
with
for each .
Then total number of alternative is . i.e. .
Let be the stopping time for GAP rule for number of coordinates . i.e.,
| (35) |
Where, is the log-likelihood ratio corresponding to the -th coordinate , and is correspondingly the ordered representation of the log-likelihood ratios. For any finite positive integer ,
| (36) |
Where
.
Now let are iid with cdf ,
Due to Lemma 6. of Bahadur, (1966), such that .
Therefore, it is evident that, for all as
For , let
Due to Bernstein’s inequality, it can be shown that, for fixed , as . So we have, for fixed ,
| (37) |
Which converges to 1 as .
Now, for any , & i.e. . But, for some sufficiently small .
Therefore,
Where the first term converges to 0 due to the discussion in the previous paragraph and the second term converges to 0 because of 37.
Finally, we observe that as for any , which proves the lemma. ∎
Proof of Lemma 5:.
By (2.1), due to the sequential test is:
The first inequality occurs since and the sequence of cumulative average of ordered(increasing) values is increasing in number of terms involved. The second inequality comes from (3.5). ∎
Proof of Lemma 6:.
By (2.2), due to the sequential test is:
As in the previous proof, since , and due to the fact that the sequence of cumulative average of ordered (increasing) values is increasing in number of terms involved, the first inequality occurs. The second inequality comes from (3.6). ∎
Proof of Lemma 7.:.
Define, for fixed , . Due to Lemma 2,
Define, . Let . Then . Therefore, . i.e., . Finally,
| (38) |
This completes the proof. ∎
Proof of Lemma 8..
-
1.
Note that, . Now, by definition of , and .
So, . Now, for , there is no local FDR value. Hence for such , and . So, for any .
Similarly, for .
By definition, for .
Hence, Lemma 8. 1 is proved.
-
2.
Lemma 8. 1 implies that value of is constant in the intervals ; for and . And therefore is continuous in those intervals. Our goal is to show that, is right continuous at the points: { for }. Now, from the discussion in the previous part, we can conclude that, for , for .
Therefore, and hence, is right continuous in the points { for }.
The same idea applies for for for and thus is right continuous at the point .
Hence, Lemma 8. 2 is proved.
-
3.
From Lemma 8. 1 we can deduce that, is constant in except for jumps at the points { for }. To prove that is non decreasing, we are done if we can prove that jumps at the points mentioned above are positive.
Now, jump at point for is:
Hence, Lemma 8. 3 is proved.
∎
Proof of Lemma 12.:.
Due to Assumption 1., as , and . Therefore, , and as . And . So, by definition, and . Now, if for some , , we must have almost surely. i.e.,
Last inequality holds due to corollary 1.. As , we get,
Exchange of limits is allowed by BCT since probability values are bounded in . The last euality holds since . Hence first part is proved.
To prove the second part, note that, by definition of , and . Since, , we must have, . Now by corollary 1., for fixed , as . So, for , for every , for some , such that, . Fix . For such , for ,
and
Now, for , such that ,
i.e., , which proves the lemma. ∎
Proof of Lemma 13.
For the test ,
| (39) |
In the final line we add as the suffix of to emphasis the fact that depends on the stopping time (which was omitted to maintain simplicity.) Now, implies
From Lemma 12. we get,
as . Since the quantity is bounded in , we get
| (40) |
So,
Now, with, . And due to Assumption 2, .
| (41) |
Now,
For fixed let,
The last convergence follows from the dominated convergence theorem since . As a result
and therefore due to weak law of large number,
Since,
Now, if , almost surely due to 4.30.
| (42) |
First we consider the convergence of the covariance term. Say,
Assumption 3 implies and Lemma 11 implies as . So,
jointly. Therefore it is easy to see that,
as Due to Assumption 2,
and
So, the covariance term in 42 converges to 0 for all . i.e.,
And we see that the variance,
So,
Therefore, due to weak law of large numbers,
Now, if ,
So, for any
i.e., due to 41, for such ,
And since,
We conclude,
| (43) |
Finally, and . Therefore, for any , and for such ,
| (44) |
Last inequality follows since, for , The limits tend to 0 due to 40 and 43. We therefore observe that, for such a test , defined in Lemma 13.,
We follow similar steps for proving asymptotic control of . First note that,
| (45) |
Due to Lemma 12., assumption 2. and due to the fact that
we get
| (46) |
Following our previous proof we can show that for ,
and
by weak law of large numbers. Therefore,
and since
we conclude
| (47) |
Finally,
| (48) |
Last inequality follows since, for ,
The limits tend to 0 due to 46 and 47. We therefore observe that, for such a test , defined in Lemma 13.,
So . i.e., Lemma 13. is proved.
∎
References
- Aharoni and Rosset, (2014) Aharoni, E. and Rosset, S. (2014). Generalized -investing: definitions, optimality results and application to public databases. Journal of the Royal Statistical Society: Series B: Statistical Methodology, pages 771–794.
- Bahadur, (1966) Bahadur, R. R. (1966). A note on quantiles in large samples. The Annals of Mathematical Statistics, 37(3):577–580.
- Bartroff, (2018) Bartroff, J. (2018). Multiple hypothesis tests controlling generalized error rates for sequential data. Statistica Sinica, 28:363–98.
- Bartroff and Song, (2014) Bartroff, J. and Song, J. (2014). Sequential tests of multiple hypotheses controlling type i and ii familywise error rates. Journal of Statistical Planning and Inference, 153:100–114.
- Bartroff and Song, (2020) Bartroff, J. and Song, J. (2020). Sequential tests of multiple hypotheses controlling false discovery and nondiscovery rates. Sequential Analysis, 39(1):65–91.
- Benjamini and Hochberg, (1995) Benjamini, Y. and Hochberg, Y. (1995). Controlling the false discovery rate: A practical and powerful approach to multiple testing. Journal of the Royal Statistical Society. Series B (Methodological), 57(1):289–300.
- Cai and Jin, (2010) Cai, T. T. and Jin, J. (2010). Optimal rates of convergence for estimating the null density and proportion of nonnull effects in large-scale multiple testing. The Annals of Statistics, 38(1):100 – 145.
- Cai and Sun, (2009) Cai, T. T. and Sun, W. (2009). Simultaneous testing of grouped hypotheses: Finding needles in multiple haystacks. Journal of the American Statistical Association, 104(488):1467–1481.
- Cai and Sun, (2011) Cai, T. T. and Sun, W. (2011). A compound decision-theoretic approach to large-scale multiple testing. In High-dimensional Data Analysis, pages 75–116. World Scientific.
- Caldas de Castro and Singer, (2006) Caldas de Castro, M. and Singer, B. H. (2006). Controlling the false discovery rate: a new application to account for multiple and dependent tests in local statistics of spatial association. Geographical Analysis, 38(2):180–208.
- Cao et al., (2022) Cao, H., Chen, J., and Zhang, X. (2022). Optimal false discovery rate control for large scale multiple testing with auxiliary information. The Annals of Statistics, 50(2):807–857.
- Crockett and Gebski, (1984) Crockett, N. and Gebski, V. (1984). A simplified two sample sequential t-test. Journal of Statistical Computation and Simulation, 20(3):217–234.
- (13) De, S. K. and Baron, M. (2012a). Sequential bonferroni methods for multiple hypothesis testing with strong control of family-wise error rates i and ii. Sequential Analysis, 31(2):238–262.
- (14) De, S. K. and Baron, M. (2012b). Step-up and step-down methods for testing multiple hypotheses in sequential experiments. Journal of Statistical Planning and Inference, 142(7):2059–2070.
- De and Baron, (2015) De, S. K. and Baron, M. (2015). Sequential tests controlling generalized familywise error rates. Statistical Methodology, 23:88–102.
- Dudoit et al., (2008) Dudoit, S., Van Der Laan, M. J., and van der Laan, M. J. (2008). Multiple testing procedures with applications to genomics. Springer.
- (17) Efron, B. (2004a). Large-scale simultaneous hypothesis testing. Journal of the American Statistical Association, 99(465):96–104.
- (18) Efron, B. (2004b). Large-scale simultaneous hypothesis testing. Journal of the American Statistical Association, 99(465):96–104.
- Foster and Stine, (2008) Foster, D. P. and Stine, R. A. (2008). -investing: a procedure for sequential control of expected false discoveries. Journal of the Royal Statistical Society: Series B (Statistical Methodology), 70(2):429–444.
- Gang et al., (2023) Gang, B., Sun, W., and Wang, W. (2023). Structure–adaptive sequential testing for online false discovery rate control. Journal of the American Statistical Association, 118(541):732–745.
- Genovese and Wasserman, (2002) Genovese, C. and Wasserman, L. (2002). Operating Characteristics and Extensions of the False Discovery Rate Procedure. Journal of the Royal Statistical Society. Series B (Statistical Methodology), 64(3):499 – 517.
- Golub et al., (1999) Golub, T. R., Slonim, D. K., Tamayo, P., Huard, C., Gaasenbeek, M., Mesirov, J. P., Coller, H., Loh, M. L., Downing, J. R., Caligiuri, M. A., et al. (1999). Molecular classification of cancer: class discovery and class prediction by gene expression monitoring. science, 286(5439):531–537.
- Green and Richardson, (2002) Green, P. J. and Richardson, S. (2002). Hidden markov models and disease mapping. Journal of the American statistical association, 97(460):1055–1070.
- He and Bartroff, (2021) He, X. and Bartroff, J. (2021). Asymptotically optimal sequential fdr and pfdr control with (or without) prior information on the number of signals. Journal of Statistical Planning and Inference, 210:87–99.
- Javanmard and Montanari, (2018) Javanmard, A. and Montanari, A. (2018). Online rules for control of false discovery rate and false discovery exceedance. The Annals of statistics, 46(2):526–554.
- Miller et al., (2001) Miller, C. J., Genovese, C., Nichol, R. C., Wasserman, L., Connolly, A., Reichart, D., Hopkins, A., Schneider, J., and Moore, A. (2001). Controlling the false-discovery rate in astrophysical data analysis. The Astronomical Journal, 122(6):3492.
- Perone Pacifico et al., (2004) Perone Pacifico, M., Genovese, C., Verdinelli, I., and Wasserman, L. (2004). False discovery control for random fields. Journal of the American Statistical Association, 99(468):1002–1014.
- Ramdas et al., (2017) Ramdas, A., Yang, F., Wainwright, M., and Jordan, M. (2017). Online control of the false discovery rate with decaying memory.
- Ramdas et al., (2018) Ramdas, A., Zrnic, T., Wainwright, M., and Jordan, M. (2018). Saffron: an adaptive algorithm for online control of the false discovery rate. In International conference on machine learning, pages 4286–4294. PMLR.
- Singh et al., (2002) Singh, D., Febbo, P. G., Ross, K., Jackson, D. G., Manola, J., Ladd, C., Tamayo, P., Renshaw, A. A., D’Amico, A. V., Richie, J. P., et al. (2002). Gene expression correlates of clinical prostate cancer behavior. Cancer cell, 1(2):203–209.
- Song and Fellouris, (2017) Song, Y. and Fellouris, G. (2017). Asymptotically optimal, sequential, multiple testing procedures with prior information on the number of signals. Electronic Journal of Statistics, 11(1):338 – 363.
- Song and Fellouris, (2019) Song, Y. and Fellouris, G. (2019). Sequential multiple testing with generalized error control: An asymptotic optimality theory. The Annals of Statistics, 47(3):1776 – 1803.
- Storey, (2002) Storey, J. D. (2002). A direct approach to false discovery rates. Journal of the Royal Statistical Society: Series B (Statistical Methodology), 64(3):479–498.
- Storey et al., (2004) Storey, J. D., Taylor, J. E., and Siegmund, D. (2004). Strong control, conservative point estimation and simultaneous conservative consistency of false discovery rates: a unified approach. Journal of the Royal Statistical Society: Series B (Statistical Methodology), 66(1):187–205.
- Sun and Cai, (2007) Sun, W. and Cai, T. T. (2007). Oracle and adaptive compound decision rules for false discovery rate control. Journal of the American Statistical Association, 102(479):901–912.
- Sun and Cai, (2009) Sun, W. and Cai, T. T. (2009). Large‐scale multiple testing under dependence. Journal of the Royal Statistical Society Series B, 71(2):393–424.
- Sun et al., (2015) Sun, W., Reich, B. J., Tony Cai, T., Guindani, M., and Schwartzman, A. (2015). False discovery control in large-scale spatial multiple testing. Journal of the Royal Statistical Society: Series B (Statistical Methodology), 77(1):59–83.
- Tian and Ramdas, (2021) Tian, J. and Ramdas, A. (2021). Online control of the familywise error rate. Statistical Methods in Medical Research, 30(4):976–993.