Lopsidedness as a tracer of early galactic assembly history
Abstract
Large-scale asymmetries (i.e. lopsidedness) are a common feature in the stellar density distribution of nearby disk galaxies both in low- and high-density environments. In this work, we characterize the present-day lopsidedness in a sample of disk-like galaxies selected from the TNG50 simulation. We find that the percentage of lopsided galaxies (-) is in good agreement with observations if we use similar radial ranges to the observations. However, the percentage () significantly increases if we extend our measurement to larger radii. We find a mild or lack of correlation between lopsidedness amplitude and environment at and a strong correlation between lopsidedness and galaxy morphology regardless of the environment. Present-day galaxies with more extended disks, flatter inner galactic regions and lower central stellar mass density (i.e. late-type disk galaxies) are typically more lopsided than galaxies with smaller disks, rounder inner galactic regions and higher central stellar mass density (i.e. early-type disk galaxies). Interestingly, we find that lopsided galaxies have, on average, a very distinct star formation history within the last , with respect to their symmetric counterparts. Symmetric galaxies have typically assembled at early times (- ago) with relatively short and intense bursts of central star formation, while lopsided galaxies have assembled on longer timescales and with milder initial bursts of star formation, continuing building up their mass until . Overall, these results indicate that lopsidedness in present-day disk galaxies is connected to the specific evolutionary histories of the galaxies that shaped their distinct internal properties.
keywords:
galaxies: formation – galaxies: evolution – galaxies: structure – galaxies: star formation – galaxies: interactions1 Introduction
The existence of asymmetries in the present-day distribution of light and mass of disk galaxies has been known for a long time. In an early work, Baldwin et al. (1980) studied the distribution of the neutral HI gas in a sample of disk galaxies and found that half of them displayed asymmetries where the gas on one side of the galaxy was more extended than on the opposite side. Specifically, in four of these galaxies, such asymmetries were very significant, with the ratio between the projected HI density of the two sides of the galaxy being greater than 2:1. These strongly asymmetric galaxies were referred to as lopsided galaxies by Baldwin et al. (1980). To explain the high frequency of these asymmetries, the authors suggested a lopsided pattern of elliptical orbits.
Follow-up studies that included larger samples of galaxies have further detected the lopsided feature not only in the spatial distribution (e.g. Richter & Sancisi 1994; Haynes et al. 1998) and large-scale kinematics (e.g. Swaters et al. 1999) of the HI gas, but also in the old stellar component of disk galaxies observed in the near infrared (e.g. Block et al. 1994; Rix & Zaritsky 1995; Zaritsky & Rix 1997). The lopsidedness in the stellar component was typically quantified by performing an azimuthal decomposition of the galaxy stellar surface density distribution and measuring the mass-weighted mean amplitude of the first Fourier mode, , over the radial range between - disk scale lengths. The mean value of obtained from a sample of spiral galaxies by Bournaud et al. (2004) was . As such, this value is now widely adopted as a threshold to identify lopsided stellar disks. The behaviour of the lopsidedness was found to be similar in both the HI gas and stellar component with the amplitude of the asymmetry increasing at larger galactocentric radii (Bournaud et al., 2005).
Overall, the large fraction of late-type disk galaxies with significant HI (i.e. of the galaxies; Richter & Sancisi 1994; Haynes et al. 1998) and stellar (i.e. of the galaxies; Rix & Zaritsky 1995; Zaritsky & Rix 1997; Bournaud et al. 2005) asymmetries suggests that lopsidedness is a rather common phenomenon in present-day disk galaxies. The observed high occurrence rate of the lopsidedness in disk galaxies has, thus, raised the question of whether lopsidedness is a long-lived phenomenon or the result of an external, recent, perturbation (Varela-Lavin et al., 2022; Ghosh et al., 2022).
Several mechanisms that have been proposed to explain the origin of lopsidedness typically involve an external perturbation, such as a tidal interaction (e.g. Beale & Davies 1969) or minor merger (e.g. Walker et al. 1996; Zaritsky & Rix 1997, 1999), which is expected to excite a short-lived (i.e. -) but strong lopsided feature (Bournaud et al., 2005). Therefore, this scenario can potentially explain the origin of the lopsidedness in group environments where tidal perturbations and mergers are more frequent. In fact, the observations that early-type disk galaxies tend to be more lopsided than late-type ones in galaxy groups (Angiras et al., 2006, 2007) seem consistent with a tidal origin of the lopsidedness as repetitive tidal encounters can significantly heat up the stellar disk and trigger multiple starbursts, thus producing a gas-poor lenticular galaxy with a thick disk and no prominent spiral arm structure (Bekki & Couch, 2011). However, strong lopsided features are also observed in field galaxies where tidal interaction and mergers are less frequent. In fact, late-type disk galaxies are typically found to be more lopsided than early-type ones in the field (Conselice et al., 2000; Bournaud et al., 2004; Bournaud et al., 2005). Additionally, the fact that the lopsidedness amplitude is expected to drop quickly after the external perturbation (Bournaud et al., 2005), combined with the observed lack of correlation between lopsidedness and the presence of close companions (Bournaud et al., 2005; Wilcots, 2010), also disfavours the external perturbation scenario for the origin of lopsidedness. Similar conclusions were reached by Varela-Lavin et al. (2022) (hereafter, VL22), using fully cosmological models of late-type galaxy formation from the IllustrisTNG simulations (Nelson et al., 2019a).
For this reason, other mechanisms have been proposed that suggest the lopsided feature is a long-lived perturbation. Some of these mechanisms include the response of the disk to a tidally perturbed dark matter halo as a result of past interactions (e.g. Jog 1997, 2002), an off-centred disk with respect to the dark matter halo (e.g. Noordermeer et al. 2001), internal dynamical processes within the disk (e.g. Saha et al. 2007) and the accretion of misaligned gas into the disk (e.g. Bournaud et al. 2005). Specifically, the misaligned gas accretion scenario has received much attention in previous works due to the finding that lopsided galaxies are typically characterized by higher star formation rates, bluer colours, lower metallicity and larger gas fractions than symmetric galaxies. This suggests that lopsidedness may originate as a result of asymmetric star formation following the accretion of misaligned low metallicity gas (Łokas, 2022). However, the fact that lopsidedness is not only observed in the young but also in the old stellar component of disk galaxies, where the lopsided mode is expected to be damped due to differential rotation, indicates that this cannot be the only mechanism that produces lopsidedness. Furthermore, Rudnick & Rix (1998) studied the lopsidedness in a sample of early-type disk galaxies and found that showed significant asymmetries, similarly to the results obtained by Rix & Zaritsky (1995) and Zaritsky & Rix (1997) for late-type disk galaxies. Therefore, the authors suggested that lopsidedness is more likely associated to mass asymmetries rather than to asymmetric star formation.
Other studies have found that lopsidedness correlates more strongly with morphology (Conselice et al., 2000), as well as with other galaxy structural properties (Reichard et al. 2008;VL22). Specifically, Conselice et al. (2000) found that early-type disk galaxies typically show smaller asymmetries than late-type ones, which generally agrees with the results of Reichard et al. (2008), who showed that lopsided galaxies are, on average, characterized by lower concentration and stellar surface mass density than symmetric ones. Indeed, VL22 showed that late-type lopsided galaxies in numerical simulations are typically characterized by lower central surface densities and are, thus, less gravitationally cohesive than symmetric galaxies. As a result, lopsided galaxies are more easily perturbed by external interactions and prone to develop stronger lopsided features than symmetric ones. Additionally, VL22 also found that the lower central surface density of the late-type lopsided galaxies is likely the result of the more significant growth of their stellar half-mass radius, , towards . These results suggest a stronger correlation between lopsidedness and the internal galaxy properties rather than a main external perturbation.
In this work, we aim to study the correlation between lopsidedness, galaxy morphology, environment and galaxy internal properties to establish the connection between present-day asymmetric perturbations on galactic disks and the evolution of galaxies in relation with the environment using the IllustrisTNG simulations. Firstly, we aim to investigate the dependence of lopsidedness on the environment by selecting a sample of central and satellite disk-like galaxies embedded in a range of different total halo masses. This allows us to better characterize the correlation between lopsidedness and environment by extending the previous work by VL22, who mainly focused on central late-type disk galaxies embedded in a restricted range of total halo masses (i.e. ). In addition, we extend the results of VL22 by investigating whether the correlation between lopsidedness and internal galaxy properties holds in different environments. Finally, we aim to investigate what mechanisms are mainly responsible for shaping the distinct internal galaxy properties that are strongly linked to lopsidedness (i.e. whether it is the environment or the internal evolution of the galaxy).
The paper is structured as follows. In Sec. 2, we describe the galaxy sample selected from the IllustrisTNG simulations. In Sec. 3, we describe the method used to estimate and quantify the lopsidedness in our galaxies. In Sec. 4 and Appendix A, we study the dependence of lopsidedness on the environment, as well as the correlation between lopsidedness and galaxy morphology as a function of the environment. In Sec. 5, we study the star formation histories of the lopsided and symmetric galaxies to identify differences in how these galaxies assembled their stars and built-up their mass, which may possibly correlate with the lopsidedness. Finally, in Sec. 6, we provide a summary of our results and conclusions.
2 The data
2.1 IllustrisTNG simulations
IllustrisTNG111https://www.tng-project.org/, successor of the original Illustris222https://www.illustris-project.org/ project, is a suite of cosmological, gravo-magnetohydrodynamical simulations (Vogelsberger et al., 2014; Genel et al., 2014; Sijacki et al., 2015; Nelson et al., 2015), which includes a comprehensive physical model of galaxy formation designed to realistically trace the formation and evolution of the galaxies across cosmic time (Weinberger et al., 2017; Pillepich et al., 2018a). A detailed analysis of the updated physical model used in the IllustrisTNG simulations can be found in Pillepich et al. (2018a).
IllustrisTNG comprises three simulations with different cosmological volumes, i.e. , and , referred to as TNG50, TNG100 and TNG300, respectively. The largest TNG300 simulation enables the study of the massive structures in the Universe (e.g. galaxy clusters) and provides a large statistical galaxy sample, while the smallest TNG50 simulation enables the study of the internal and structural properties of the galaxies thanks to its higher mass resolution (Springel et al., 2018; Pillepich et al., 2018b; Naiman et al., 2018; Nelson et al., 2018; Marinacci et al., 2018; Nelson et al., 2019b; Pillepich et al., 2019). On the other hand, the intermediate TNG100 simulation facilitates the comparison between the old Illustris and the updated IllustrisTNG model since it uses the same initial physical conditions, and it offers a good compromise between volume, statistics and resolution, thus making it suitable for several galaxy evolution studies (Nelson et al., 2019a).
All the IllustrisTNG simulations are run with the moving-mesh code Arepo (Springel, 2010) and were released in Nelson et al. (2019a). A more detailed description of the three IllustrisTNG simulations can be found in the release paper by Nelson et al. (2019a) together with a summary of the main changes and improvements between the old Illustris and the updated IllustrisTNG model (see e.g. table 2 of Nelson et al. 2019a).
In this work, we mainly use the TNG50 simulation (Weinberger et al., 2017; Pillepich et al., 2018a). Specifically, we use the highest resolution version (i.e. TNG50-1; hereafter, TNG50) of the four available runs which is characterized by an initial gas cell mass of . This mass resolution enables TNG50 to resolve galaxies down to stellar masses with more than stellar particles, thus making it the most suitable of the three IllustrisTNG simulations to study differences in the stellar mass density distribution of central and satellite disk-like galaxies as a function of the environment and their internal and structural properties. TNG50 also includes one massive galaxy cluster with total halo mass of at redshift (i.e. similar to Coma cluster-like environments), where represents the total mass of the group enclosed in a sphere whose mean density is times the critical density of the Universe at the time the halo is considered.
On the contrary, the TNG100-1 (hereafter, TNG100) simulation is characterized by an initial gas cell mass of , which is roughly a hundred times lower mass resolution than TNG50. Due to their larger volume, we use the TNG100 simulation in Appendix A to complement the study of asymmetries in the stellar mass density distribution of disk-like galaxies as a function of the environment carried out using TNG50.
Throughout this paper, we assume a flat CDM cosmological model with parameters from the Planck Collaboration et al. (2016), i.e. Hubble constant , total matter density , dark energy density , baryonic matter density , rms of mass fluctuations at a scale of , , and primordial spectral index , which is the same adopted in all the IllustrisTNG simulations.
2.2 Sample selection criteria
From the TNG50 simulation, we select our sample of disk-like galaxies at based on the following criteria:
-
(i)
total number of bound stellar particles . This selection criteria is to ensure that each galaxy is well resolved with a large number of stellar particles to more reliably identify and quantify differences in the stellar mass density distribution;
-
(ii)
total stellar mass , where represents the sum of the stellar masses of all the stellar particles gravitationally bound to the galaxy at ;
-
(iii)
disk morphology, quantified kinematically by the circularity fraction, . The latter is defined as the fractional mass of the stellar particles with circularity, . The circularity parameter is defined as , where is the component of the specific angular momentum of the stellar particle parallel to the angular momentum of the galaxy and is the maximum angular momentum each stellar particle could attain for their given binding energy (Marinacci et al., 2013; Joshi et al., 2020). In this work, we use the catalog of stellar circularity, angular momenta and axis ratios (Genel et al., 2015) provided by the IllustrisTNG project database333https://www.tng-project.org/data/docs/specifications/, which contains kinematic measurements of morphology for all galaxies with and at least stellar particles, where is measured within twice the stellar half-mass radius (i.e. ). We include in our sample all galaxies with circularity fraction , which is considered as a proxy of the disk-to-total mass ratio (, hereafter). The circularity values are calculated including all stars within ten times . This value of is chosen so that we have both a variation of morphology within disk galaxies, including S0s.444We note that we have also tried selecting only galaxies with and our results do not significantly change.
We note that the above three selection criteria are similar to those adopted in VL22. However, in this work, we do not apply any cut on the total halo mass of the environment where our galaxies reside, and we include both central and satellite galaxies that satisfy the selection criteria described above. As a result, we obtain an extended galaxy sample of disk-like galaxies, with centrals and satellites, as compared to the central late-type disk galaxies of VL22. This allow us to study asymmetries in the stellar mass density distribution as a function of environment and galaxy morphology.
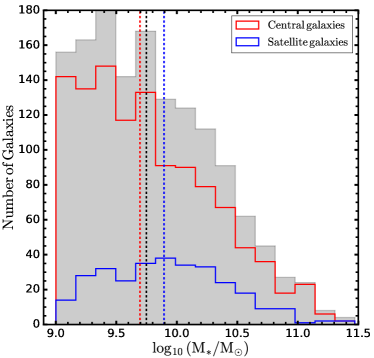
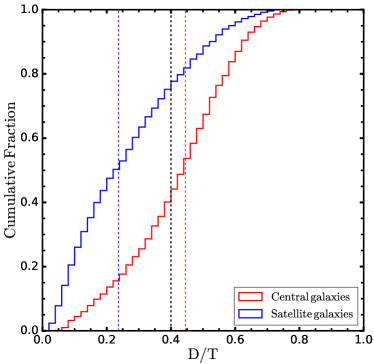
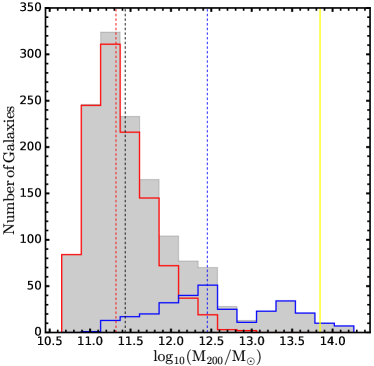
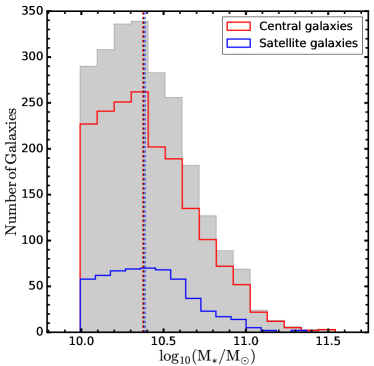
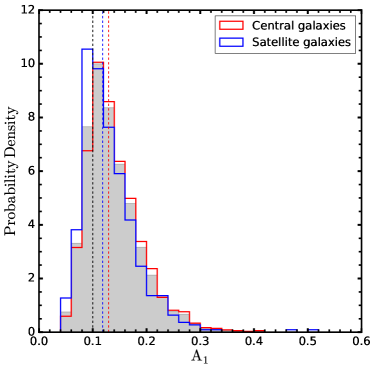
The top panel of Fig. 1 shows the stellar mass distribution of all our galaxies as well as of the central and satellite galaxies, separately. We see that the central and satellite galaxies have an overall similar stellar mass distribution, but the satellite galaxies are slightly shifted towards higher masses and represent a minority () compared to the central galaxies () in our sample. The low number of satellite galaxies in our sample is the result of the selection criterion. This is shown from the cumulative distribution of the of all the central and satellite galaxies in the TNG50 simulation with and (i.e. before applying the iii) criterion from Sec. 2.2) in the bottom panel of Fig. 1. The black vertical line represents the cut adopted to select the disk-like galaxies in this work (i.e. iii) criterion). We see that only of the satellite galaxies have as opposed to of the central galaxies, suggesting that the majority of the satellite galaxies have an early-type morphology in the TNG50 simulation.
2.3 Environment
The total halo mass, , can be used as a proxy of the galaxy host environment, with low and high values of typically corresponding to low and high density environments, respectively.
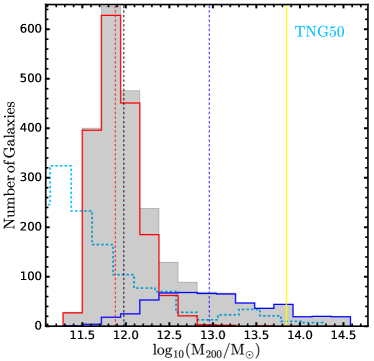
Fig. 2 shows the total halo mass distribution, , of the environment where our selected galaxies reside. Overall, we see that our galaxy sample reaches up to Fornax cluster-like environments, which have (Drinkwater et al., 2001). In Fig. 2, we represent this with a vertical yellow line. We see that there are only a few satellite galaxies belonging to a dense environment with .
Recent observational works have typically adopted a division to separate between low- and high-density environments, with field and low-mass galaxy groups with classified as low-density environments, and high-mass galaxy groups and clusters with classified as intermediate- and high-density environments (Deeley et al., 2020; Foster et al., 2021). Therefore, based on this classification, we are mainly exploring low-density environments with TNG50.
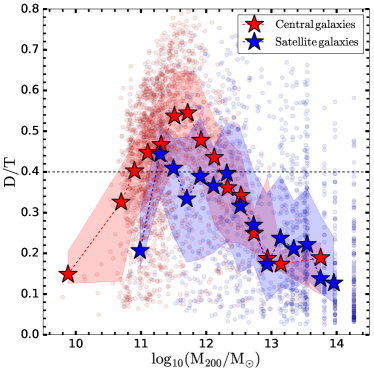
As mentioned in Sec. 2.1, the TNG50 simulation contains one massive cluster with at (Nelson et al., 2019a), but only few satellite galaxies in our selected galaxy sample belong to galaxy groups with (see Fig. 2). The reason for the low number of disk galaxies in high-density environments can be likely attributed to the effect of the environment on the galaxy morphology. In fact, the fraction of early-type galaxies is typically found to increase with increasing galaxy density at the expenses of late-type disk galaxies, as it is also suggested from the morphology-density relation (Dressler, 1980; Dressler et al., 1997; Fasano et al., 2000). Therefore, in high-density environments, we expect to be more dominated by galaxies with an earlier type disk morphology. This can be seen in Fig. 3, which shows the median as a function of the total halo mass, , for all the central and satellite galaxies in the TNG50 simulation with and . The background coloured points represent the individual galaxies, and the black horizontal line represents the cut adopted to select the disk-like galaxies in this work (see Sec. 2.2). We see that the median is the largest (i.e. ) for total halo masses , and it steeply drops to for both central and satellite galaxies at large total halo masses, i.e. . We also see that there are no central galaxies with for , as also shown in Fig. 2. This indicates that both central and satellite galaxies located in high-density environments with tend to be characterized by an early-type morphology in the TNG50 simulation.
3 Lopsidedness
3.1 Measuring lopsidedness: Fourier analysis
In this section, we describe the method used to measure asymmetries in the mass distribution of the stellar component of disk-like galaxies, which are typically referred to as lopsidedness.
We calculate the lopsidedness of the galaxies in our selected sample by performing an azimuthal Fourier decomposition of the galaxy stellar mass distribution and measuring the amplitude of the first Fourier mode, , as similarly done in previous works (e.g. Rix & Zaritsky 1995; Reichard et al. 2008; Łokas 2022;VL22). The amplitude of the first mode of the Fourier decomposition, i.e. , quantifies the lopsidedness of the galaxy which is the large-scale asymmetry in the stellar mass density distribution between one side of the galaxy and the opposite side.
Firstly, we rotate all our galaxies such that the angular momentum vector of the stars is aligned with the -axis (i.e. the stellar disk lies in the -plane). Then, we bin the galaxy stellar mass in equally-spaced concentric radial annuli of width in the face-on projection. We then apply the Fourier transform to the stellar mass density distribution and we calculate the complex Fourier coefficients within each radial annulus, which are defined as (Grand et al., 2016):
| (1) |
where and is the mass and azimuthal angle of the th stellar particle found within a given radial annulus. The amplitude of the th Fourier mode at a given radial annulus is then given by:
| (2) |
with and being the real and imaginary components of the complex Fourier coefficients in Eq. 1 within the radial annulus. These two components are defined as:
| (3) |
where is the azimuthal angle and is the mass of the th stellar particle found within a given radial annulus. The sum runs over all stellar particles in the radial annulus under consideration. Finally, the ratio between the amplitude of the first Fourier mode and the zeroth mode , measured at each radial annulus is referred to as the lopsidedness parameter, :
| (4) |
where the amplitude of the zeroth Fourier mode, , corresponds to the total stellar mass of the stellar particles in the radial annulus. The averaged value of measured over a chosen radial interval (e.g. between - disk scale lengths as typically adopted in observations; Jog & Combes 2009) defines the global lopsidedness amplitude of the galaxy. Then, if , the galaxy is said to be lopsided. Instead, if , the galaxy is said to be symmetric.
3.2 Global lopsidedness
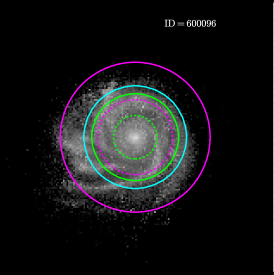
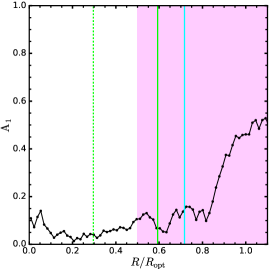
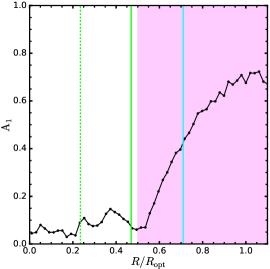
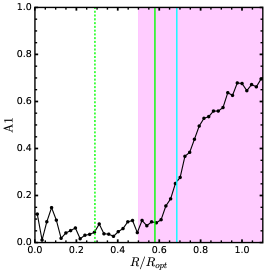
Following VL22, to quantify the present-day global lopsidedness of the galaxies in our selected sample, we calculate the average amplitude considering the radial annulus between -. Here, is the optical radius of the galaxy defined as the radius where the V-band surface brightness drops down to . Similarly to the lopsidedness, we estimate by binning the face-on projection of the galaxy stellar light in radial annuli of width and measuring the stellar surface brightness profile normalized by the area of the circular shell in units of .
In previous works, the global lopsidedness (hereafter, ) of the galaxy was typically measured between - disk scale lengths (see e.g. Jog & Combes 2009 for a review). On the other hand, Reichard et al. (2008) measured between -, where and are the radii containing and of the total galaxy light in the -band. This outer radial limit of the galaxy is typically set by the sky-background noise of the observations in the near infrared. Using the TNG100 simulation, Łokas (2022) measured between -, which is expected to roughly correspond to the radial interval - disk scale lengths used in the observations.
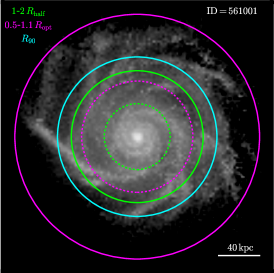
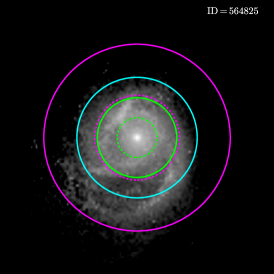
In Fig. 4, we compare the measurements of the global estimated between - (magenta lines/area) and - (green lines) for three example galaxies in our selected galaxy sample. The top panels of Fig. 4 show the face-on projection of the V-band stellar surface brightness of the galaxies at , which is clearly asymmetric in all three cases. The lopsided feature in these three galaxies is also confirmed by the radial profiles shown in the bottom panels of Fig. 4, where we see a steep increase in towards large galactocentric radii, starting from and reaching out to the optical limit of the galaxy. This increment of the lopsidedness amplitude with the galactocentric radius is overall consistent with the trend seen in previous works (Reichard et al. 2008; Jog & Combes 2009; Łokas 2022VL22. In Fig. 4, we see that we miss almost all of the strong lopsided feature if we consider the radial interval between - (green lines), which is the one adopted by Łokas (2022). The radial interval out to adopted by Reichard et al. (2008) (cyan line) is better in comparison to - as it reaches out to larger galactocentric radii, but it still underestimates the lopsidedness compared to the value measured within the radial interval between -. The latter allows us to detect and quantify the full lopsided feature as it reaches out to the optical extension of the galaxies.
For this reason, we measure the global lopsidedness of our selected galaxies as the average over the radial interval between -, similarly to VL22. The inner threshold is chosen because this is typically the point beyond which the lopsidedness amplitude starts to steadily increase with radius out to the outskirts for the galaxies in our selected galaxy sample. Overall, we find that out of galaxies (i.e. ) are lopsided (i.e. ). This fraction is in good agreement with the percentage (i.e. ) of lopsided galaxies reported by the early work of Baldwin et al. (1980) from HI studies. We note that the fraction of lopsided galaxies would drop to and if we adopt the radial interval between - and -, respectively, which is in better agreement with the fraction found in observations (i.e. ). However, the fraction of lopsided galaxies is significantly higher than that in observations if we extend our measurements to the disk optical radius, , suggesting that deep observations of the galaxy outskirts are necessary to detect the lopsided feature.
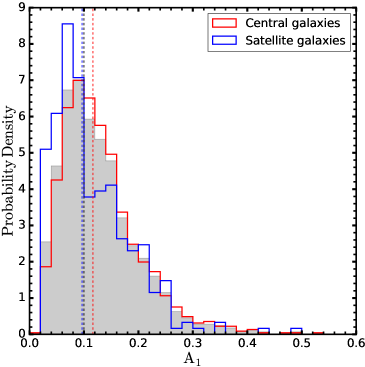
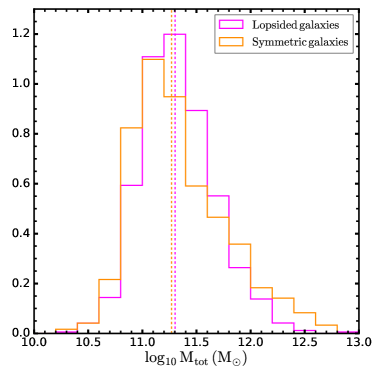
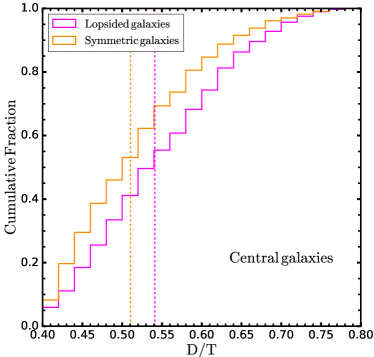
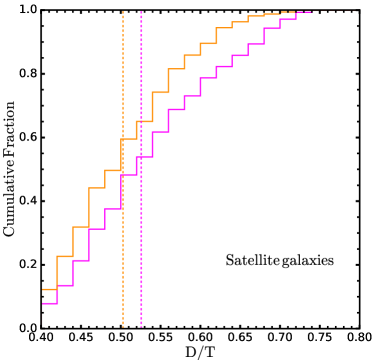
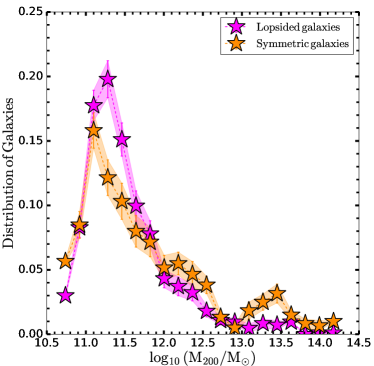
The top left-hand side panel of Fig. 5 shows the distribution of the global lopsidedness amplitudes of our selected galaxies, divided by centrals ( lopsided, symmetric) and satellites ( lopsided, symmetric), while the top right-hand side panel of Fig. 5 shows the total mass distribution of our selected galaxies, divided by lopsided and symmetric. We see that the lopsidedness distribution of our galaxies is very broad, and it can reach values as large as 555We note that two galaxies in our sample also have lopsidedness amplitudes , i.e. with and with .. We also see that central galaxies are on average more lopsided than the satellite galaxies, while both lopsided and symmetric galaxies show similar total mass distributions. The bottom left- and right-hand side panels of Fig. 5 show the cumulative distribution of the for the lopsided and symmetric subsamples, divided by centrals and satellites. For both central and satellite galaxies, we see that the symmetric subsample has, on average, lower than the lopsided one, indicating a possible correlation between lopsidedness, environment and galaxy internal properties, which we will further investigate in the following Sec. 4.
4 Effect of environment on lopsidedness
4.1 Correlations between lopsidedness, environment mass and morphology
As we have seen in Sec. 2.3, our galaxy sample covers from low- () to high-density () environments, including Fornax cluster-like environments. However, in high-density environments, we do not have as many galaxies as we have in low-density ones, as described in Sec. 2.3.
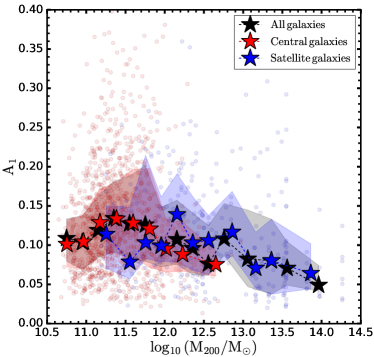
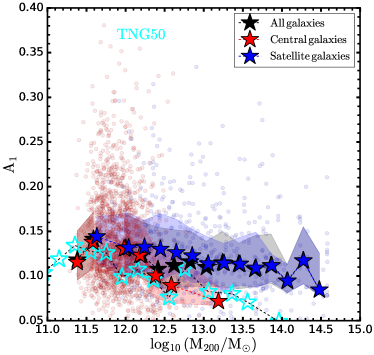
In Fig. 6 we study, for central and satellite galaxies, the behaviour of the lopsidedness amplitude, , as a function of the total halo mass, , of the environment to which each galaxy belongs at . To do this, we calculate the median value of in bins of width . For this procedure we require each bin to contain at least ten data points. If this condition is not satisfied, we merge contiguous bins. We see that the overall median amplitude of shows a mild decrease with increasing , indicating a larger fraction of symmetric galaxies than lopsided ones towards increasing (see black stars in the left panel of Fig. 6). The same decreasing behaviour of with is also seen for the central and satellite galaxies, separately. This result also indicates that satellite galaxies tend to be more symmetric than central ones since the majority of the galaxies are satellites at high halo masses (i.e. ; see Fig. 2), thus explaining the differences in the lopsidedness distributions of central and satellite galaxies described in Fig. 5.
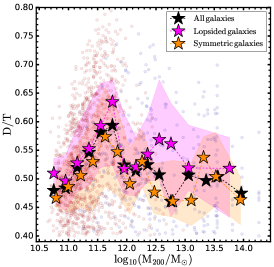
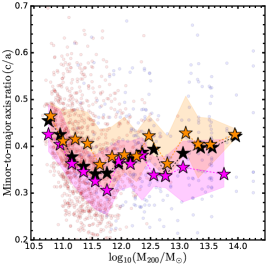
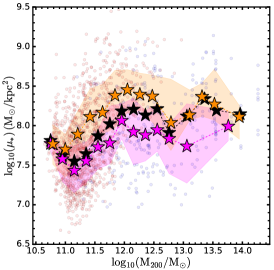
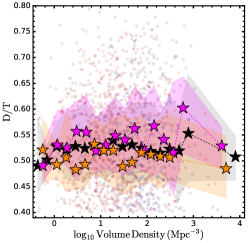
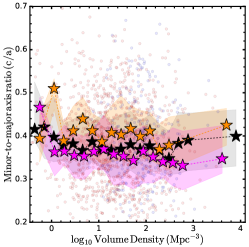
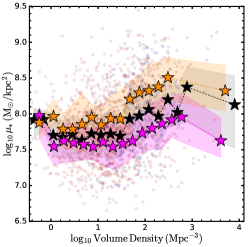
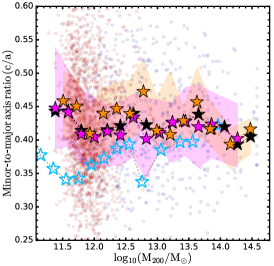
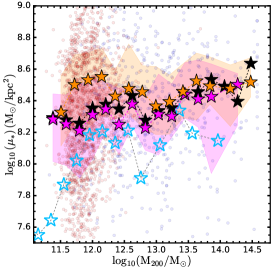
In Fig. 7, we study the behaviour of the , minor-to-major axis ratio () and central stellar mass density () as a function of the of the host galaxy group from the left to the right panel, respectively, similarly to Fig. 6. Here, is given by the eigenvalues of the mass tensor of the stellar component measured within the inner , which is a proxy of the shape of the inner galactic regions. Specifically, small values of indicate flatter inner galactic regions, and large values of indicate rounder inner galactic regions. On the other hand, is defined as the ratio between the stellar mass contained within and the area enclosed within the circular region of radius in the face-on projection of the galaxy. We see that the mildly decreasing behaviour of with increasing (see Fig. 6) seems to correlate with the change in the internal properties of the galaxies with (see black stars in Fig. 7). Specifically, we see that the overall higher lopsidedness amplitude between in Fig. 6 roughly corresponds to the peak in and dip in and in Fig. 7. Beyond , where the overall lopsidedness amplitude starts decreasing, we see that the also decreases while both and slightly increase. This also occurs at low , where we see that the galaxies are, on average, characterized by low and high and .
The results in Fig. 6 and 7 suggests a correlation between lopsidedness and galaxy morphology, where galaxies with more extended disks666As shown in Appendix B, lopsided galaxies show, on average, larger stellar and than the symmetric counterpart (in addition to the, on average larger in Fig. 7), flatter inner galactic regions and lower central stellar mass density (i.e. late-type disk galaxies) are typically more lopsided than galaxies with smaller disks, rounder inner galactic regions and larger central stellar mass density (i.e. early-type disk galaxies). As a result, the mild decrease of towards high is correlated to the change in morphology of the galaxies from late- to early-type disks towards high-density environments. In fact, the change in galaxy morphology with the environment seen in Fig. 7, where galaxies are characterized by, on average, smaller , and larger and at high than at low ones, is consistent with morphology-density relation according to which the fraction of early-type disk galaxies increases towards high-density environments (Dressler, 1980; Dressler et al., 1997; Fasano et al., 2000).
The result that late-type disk galaxies tend to be more lopsided than early-type ones in low density environments as well as the observed decrease of the median lopsidedness amplitude towards high density environments (i.e. large galaxy groups and clusters; ) is consistent with the findings from previous works, which showed that lopsided galaxies tend to have lower concentration and stellar surface mass density than symmetric ones (Conselice et al. 2000; Reichard et al. 2008;VL22). Thus, VL22 suggested that lopsidedness is a consequence of galaxies being less gravitationally cohesive and more susceptible to being perturbed compared to compact galaxies, as a result of the same external perturbation.
In Fig. 7, we see that the lopsided and symmetric galaxies show similar , and behaviours as a function of , and they are both characterized by a late-type disk morphology at low halo masses (i.e. ) and early-type disk morphology at high halo masses (). Nonetheless, we see that the lopsided galaxies always tend to be characterized by, on average, larger , and smaller and than the symmetric galaxies at all halo masses (i.e. regardless of the environment), confirming the correlation between lopsidedness and galaxy morphology. This is, galaxies characterized by large , and small and are more prone to develop lopsidedness than galaxies with small , and large and , as a result of a same external perturbation.
Even though our analysis is based on a limiting sampling of high density environments in TNG50, our results suggest a strong correlation between lopsidedness and the internal galaxy properties regardless of the environment.
The above results do not exclude that the environment may still have an effect in the origin of the lopsided perturbation. By studying the time when each satellite galaxy has fallen into its group environment, we find that lopsided and symmetric galaxies show a similar overall distribution of infall times, but symmetric satellites display a wider spread in infall times than lopsided ones. Some symmetric satellites have fallen into the group environment as early as - ago, while there are no lopsided satellites with infall times greater than ago, we find that symmetric satellites have fallen into the group earlier than lopsided ones. If we only consider satellite galaxies in high-density environments (i.e. Fornax cluster-like masses ), then the infall time difference between the symmetric and lopsided satellites increases to . On the other hand, if we only consider satellite galaxies in low density environments (i.e. ), then symmetric and lopsided galaxies have similar infall times. While this result may indicate that symmetric satellite galaxies have experienced longer interactions or environmental effects (e.g. strangulation, ram-pressure stripping) than lopsided ones, which modified their morphology to that of early-type disks that are typically less lopsided than late-type ones, the overall similarity of the infall time distributions, specifically in low-density environments, indicate that lopsided and symmetric galaxies already had distinct internal properties prior to entering their environment, which allow the development of the lopsided perturbation as a result of an external interaction. Once again, these results suggest a stronger dependence of lopsidedness on galaxy morphology than the environment, which mainly plays a secondary role. The further study of the differences between symmetric and lopsided satellite galaxies, which have fallen at similar times into their group environment, in terms of internal properties and orbits, that may have favoured the development of the lopsided perturbation will be left to a future work.
4.2 Correlations between lopsidedness, number of close neighbours and morphology
In the previous Sec. 4.1, we have seen that the distinct internal galaxy properties, such as their , and , are playing a stronger role in the origin of the lopsidedness than the environment, defined in terms of the total halo mass (i.e. ) of the environment in which galaxies reside in Sec. 4.1.
In this section, we seek to further characterize whether different metrics of the environment do or do not show a correlation with the strength of this asymmetric perturbation. For this purpose, we adopt the following three definitions of the local environment surrounding our galaxies at :
- i)
-
ii)
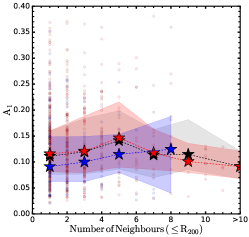
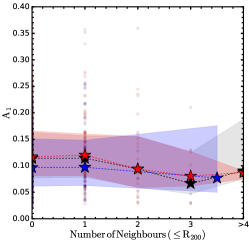
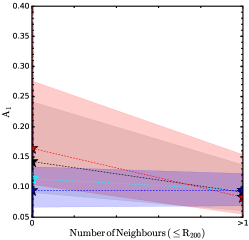
We count the number of galaxies with total mass or or located within a sphere of radius equals to the virial radius, , of the target galaxy. For the central galaxies, we use the of the galaxy at . However, for the satellite galaxies, we use the of the galaxy at the simulation snapshot before the galaxy became a satellite (i.e. when it was still a central) as is not defined for satellite galaxies.
-
iii)
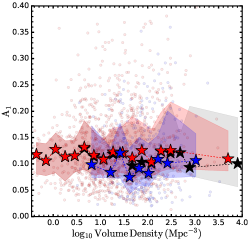
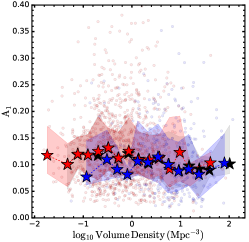
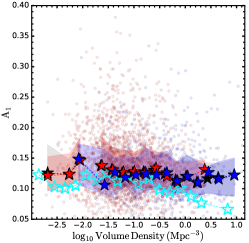
We calculate the local volume density, i.e. , of galaxies with total mass located within a sphere of radius, , centered on the target galaxy. Here, is the radius containing the closest galaxies, similarly to Cappellari et al. (2011). With this definition, we aim to quantify the effect of different distributions of the surrounding galaxies to any target galaxy. We note that we have also repeated this calculation considering the ten closest galaxies, i.e. , however the results do not vary significantly.
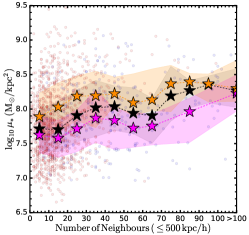
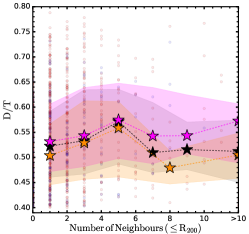
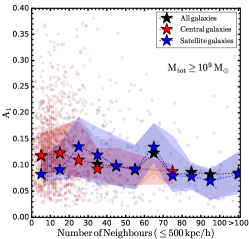
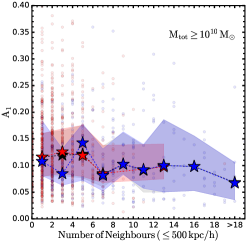
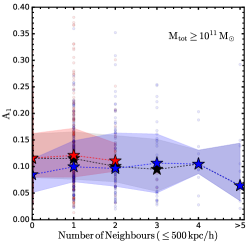
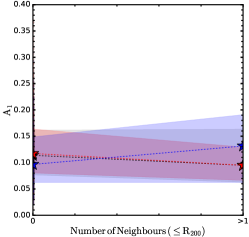
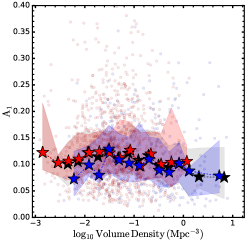
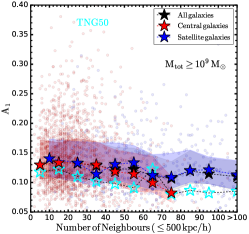
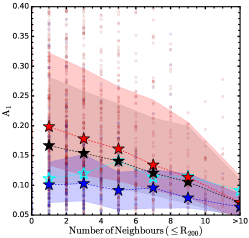
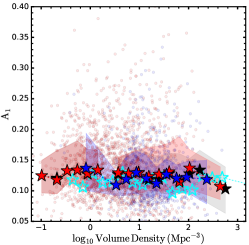
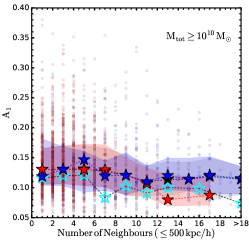
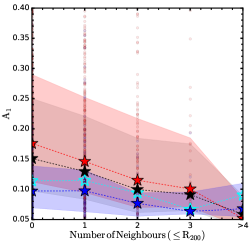
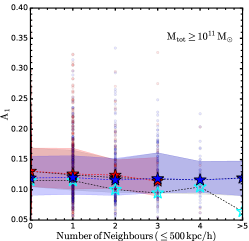
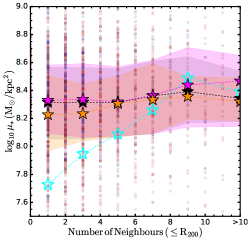
In Fig. 8, we study the behaviour of the lopsidedness amplitude as a function of the local environment at defined in i)-iii) from the left to the right panels, respectively. Here, the median value of is calculated as described in Sec. 4.1. The different rows show the results obtained considering different minimum galaxy mass threshold when counting galaxies in the corresponding local environments. Firstly, we see that the results are overall consistent regardless of the definition of the environment adopted, as well as for the different galaxy total mass cuts. Similarly to Fig. 6, we see that the overall median lopsidedness amplitude only shows a mild decreasing trend with the increasing number of close massive neighbours and local volume density of galaxies (see black stars in Fig. 8). If we separate between central and satellite galaxies, we also find an overall constant to mildly decreasing as a function of the local environment surrounding our galaxies at . In the scenario in which a larger number or density of close massive neighbours may indicate a higher probability of interactions, these results suggest that the specific type or frequency of interactions may not be the primary cause to the origin of the lopsided perturbation, in agreement with previous works (e.g. Bournaud et al. 2005; Wilcots 2010; Varela-Lavin et al. 2022).
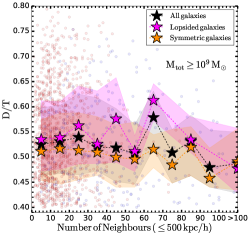
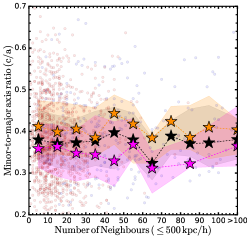
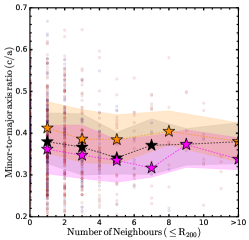
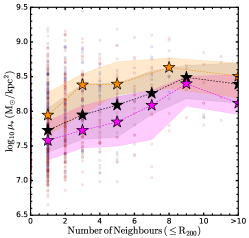
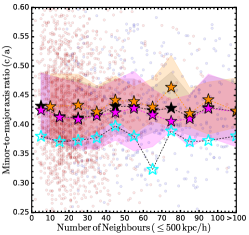
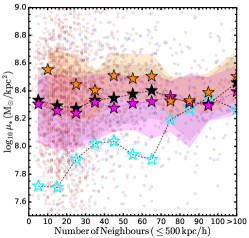
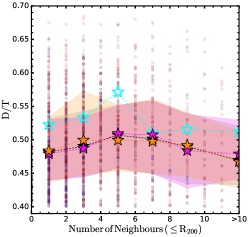
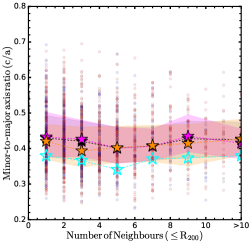
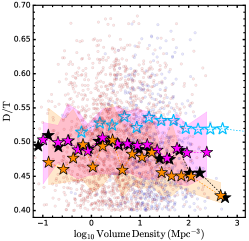
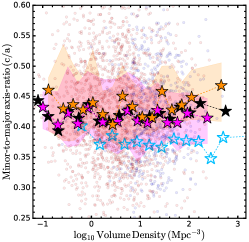
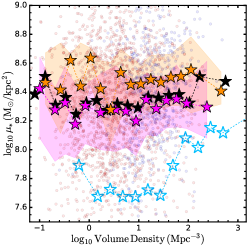
In Fig. 9, we show the behaviour of , and , from the left to the right panels, as a function of the local environment at defined in i)-iii), from the top to the bottom panels, respectively, for a minimum total mass cut of the neighbouring galaxies . For simplicity, we only consider here the case of minimum total mass cut for the neighbouring galaxies. We see that the central stellar mass density, , mildly increases, while the mildly decreases with the increasing number of close massive neighbours and local volume density of galaxies, similarly to the trend seen in Fig. 7 as a function of . The flatness of the inner galactic regions, , remains mainly constant as a function of the number of close massive neighbours and local volume density of galaxies. The change of the and as a function of the local environment surrounding our galaxies suggest that galaxies may experience a morphology transformation from a late-type to an early-type disk galaxy, characterized by a more compact disk and prominent bulge. This is likely the result of the more frequent tidal interactions with the higher number of close massive neighbours, which can trigger bursts of star formation close to the galaxy inner regions and produce early-type disk galaxies, such as S0s (Bekki & Couch, 2011; Gargiulo et al., 2019). Additionally, similarly to Fig. 7, we find that lopsided galaxies are always characterized by, on average, larger , smaller and regardless of the environment. In line with the discussion from Fig. 8, where we find an overall constant to mildly decreasing behaviour of with the increasing number and density of close massive neighbours, these results confirm that lopsidedness does not strongly depend on the specific type or frequency of interactions. On the contrary, the higher probability of interactions likely influences the galaxy morphology such that galaxies become more resistant to developing the lopsided perturbation from future external interactions. Thus, these results confirm the strong correlation between lopsidedness and internal galaxy properties, as suggested in previous works (e.g. Conselice et al. 2000; Bournaud et al. 2005; Reichard et al. 2008; Wilcots 2010;VL22), regardless of the environment.
4.3 Bulge-less galaxies
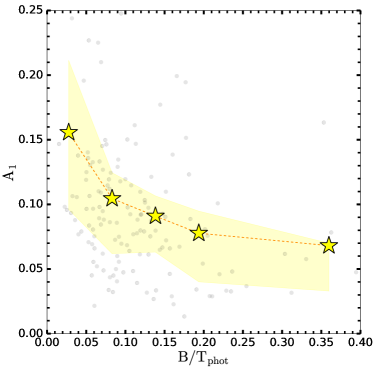
In light of the correlation between lopsidedness and central stellar mass density, present-day galaxies with low bulge-to-total () mass fractions represent possible lopsided candidates. In Fig. 10, we show the behaviour of the lopsidedness amplitude, , as a function of the photometric for a sub-sample of our galaxies. This galaxy sub-sample includes galaxies, which are in common with the sample of Milky Way/M31-like galaxies selected from TNG50 by Gargiulo et al. (2022). For these galaxies, the photometric values are taken from Gargiulo et al. (2022), who performed a two component decomposition of the galaxy surface brightness profiles. In Fig. 10, we clearly see a strong correlation between lopsidedness and photometric , where the median 777Here, the median is calculated as described in Sec. 4.1. decreases with increasing , suggesting that a strong lopsided perturbation is more likely to develop in bulge-less galaxies, as it is observed in the M101 galaxy (e.g. Beale & Davies 1969).
4.4 Correlations between lopsidedness, environment and morphology in the TNG100 simulation
To explore the effect of the environment using a more statistically representative sample of galaxies towards higher density environments (i.e. ) at , we analyze the TNG100 simulation. We repeat the analysis performed in the previous Sec. 4.1 and 4.2 for TNG50 and we find the following results in TNG100, which we briefly summarize below (see Appendix A for more details):
-
•
We find that the behaviour of the lopsidedness amplitude also shows an overall constant to mildly decreasing trend as a function of the environment, typically independent of the metric adopted, similarly to the TNG50 simulation. However, we find that the lopsidedness amplitude tend to decrease more steeply with the increasing number of massive neighbours within the galaxy virial radius, .
-
•
We find that galaxies tend to be more disk-like in TNG50 than in TNG100 at a given total halo mass, with larger , and smaller and , on average. However, we still find evidence in TNG100 of a mild trend of decreasing and increasing towards high-density environments which correlates with the change in the lopsidedness amplitude. Again, this indicates a dependence of lopsidedness with the galaxy morphology as also seen in TNG50 in Fig. 6 and 7.
-
•
We find that lopsided galaxies tend to be characterized by, on average, larger and smaller and than the symmetric galaxies also in TNG100, independently of the environment.
Therefore, the TNG100 simulation confirms the results from the TNG50 simulation that lopsidedness does not significantly depend on the environment but it more strongly correlates with the distinct internal properties of the galaxies, which may originate either as a result of the environmental evolution or the different specific evolutionary histories of the galaxies.
5 The evolution histories of the lopsided and symmetric galaxies
5.1 The star formation history
In the previous Sec. 4, we have studied the correlation between lopsidedness, environment and galaxy morphology at . We have seen that the lopsided galaxies are typically characterized by distinct internal properties (i.e. larger , and smaller and ) than the symmetric galaxies, not only in high-density environments but also in low-density ones where galaxy interactions are less common. In this section, we aim to further investigate the nature of the distinct internal properties of the lopsided and symmetric galaxies by studying their evolution histories.
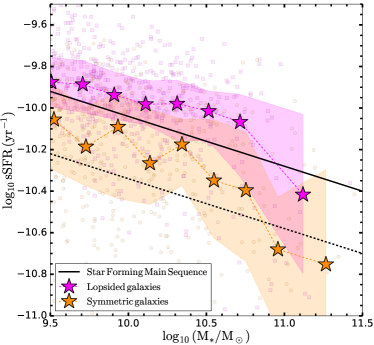
In Fig. 11, we show the present-day specific star formation rate (sSFR) as a function of galaxy total stellar mass at for the lopsided and symmetric galaxies in our selected sample. We see that the lopsided galaxies are, on average, more star forming than the symmetric ones with median sSFR typically above the star forming main sequence (SFMS; Renzini & Peng 2015). This is generally consistent with the results by Łokas (2022), who studied lopsided galaxies in the TNG100 simulation and found that they typically show larger gas fractions, higher star formation rates (SFR), bluer colours and lower metallicity at the present-day than the symmetric counterparts within the inner . Since the authors did not identify any particular type of past interaction in the evolution histories of the galaxies that could have led to their present-day lopsidedness, they suggested asymmetric star formation as mechanism for the origin of lopsidedness due to the large present-day gas fractions and recent increase in SFR seen in their lopsided sample. They also suggest an accreted origin for the gas due to its low metallicity nature (compared to the metallicity of the gas in their symmetric sample). Indeed, they find that, while only of their lopsided galaxies experienced a significant gas-rich merger in recent times (i.e. ), almost all of them continued to accrete small satellite galaxies with until the present-day. However, further studies would be necessary to understand how the in-situ or early/late accreted nature of the gas and its evolution until the present-day may be linked to the origin of lopsidedness.
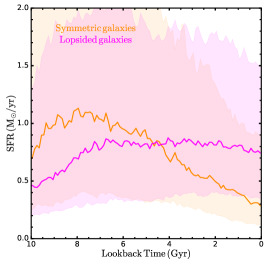
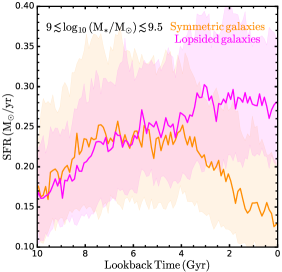
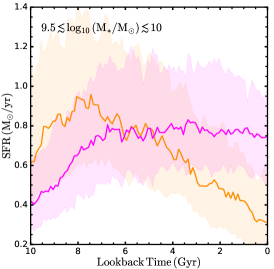
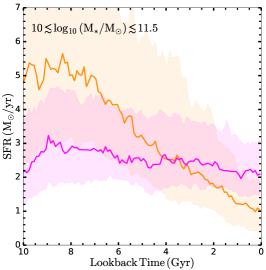
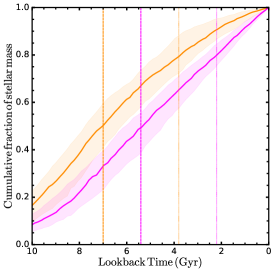
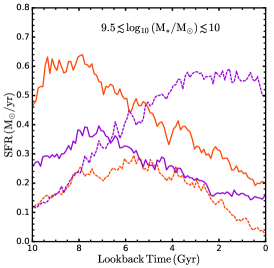
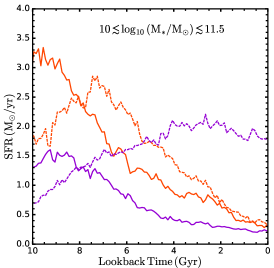
To further explore this, in Fig. 12, we study the star formation histories (SFH) of the lopsided and symmetric galaxies, i.e. the SFR as a function of the lookback time. Our goal is to investigate whether there are any differences in how these galaxies formed their stars and built up their mass over time, thus explaining their distinct present-day internal properties. Specifically, we consider the sub-samples of the most strongly lopsided and most strongly symmetric galaxies, which are obtained by selecting the two outermost quartiles in the distribution in Fig. 5. These two sub-samples contain galaxies each. We then derive the stacked SFH of our lopsided and symmetric sub-samples within the last (see solid lines in the top panel of Fig. 12). For this purpose, we compute the median SFR of each sub-sample at different times. We note that we also derive the stacked SFR of the full lopsided and symmetric samples, using the same method described above. However, considering the consistency of the results, we will focus the discussion on the strongly lopsided and strongly symmetric sub-samples throughout the rest of the section. Here, the individual SFH of a galaxy is calculated by summing up the mass888Here, mass refers to the initial mass of the star particle when it was formed. of all the star particles born in time intervals between now (i.e. lookback time, ) and ago, and normalizing it by the time interval (i.e. ) to obtain the SFR in units of . For this calculation, we consider only the star particles located within the optical radius of the galaxy in the face-on projection.
Fig. 12 reveals that the lopsided and symmetric galaxies show two distinct SFH behaviours. While the symmetric galaxies are characterized by a peaked SFR at early times (i.e. ago) that steeply decreases until , lopsided galaxies are, instead, characterized by a mildly increasing SFR until ago which, subsequently, remains overall constant until . We also see that the lopsided galaxies show on average lower SFR than the symmetric ones at early times (i.e. more than ago), while the opposite is true at recent times (i.e. within the last ), consistent with the finding that the lopsided galaxies are more star forming than the symmetric ones at (see Fig. 11).
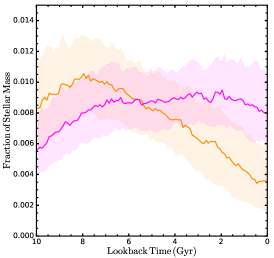
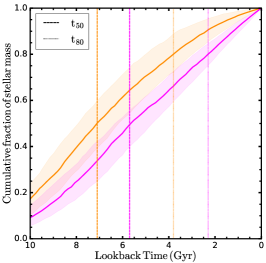
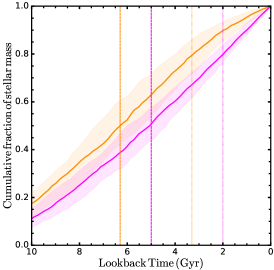
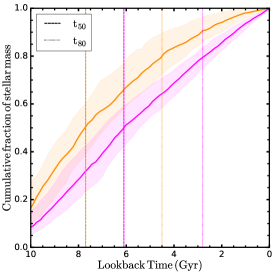
In the middle and right panels of Fig. 12, we show the stellar mass fraction as a function of time, highlighting how these two sub-samples assemble their mass over time. Specifically, we see that the symmetric galaxies have typically built up their total stellar mass earlier and more rapidly than the lopsided ones. In fact, the symmetric galaxies already reached and of their total stellar mass at and ago, while this occurs at and ago for the lopsided galaxies, respectively. Thus, lopsided galaxies assemble their mass later, on average, than the symmetric ones.
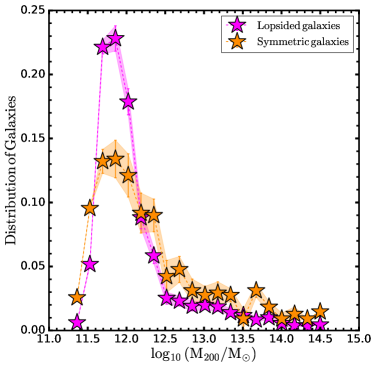
In Fig. 13, we see that the results shown in Fig. 12 continue to hold regardless of the galaxy stellar mass. Here, the stellar mass bins are defined by dividing the galaxies into three equally-sized galaxy groups, containing the same number of galaxies: low (), intermediate () and high () stellar mass bins. In the top panels of Fig. 13, we see that the symmetric galaxies are always characterized by a peaked SFR at early times that steeply decreases until , as seen in Fig. 12, independently of the mass bin considered. The duration and occurrence of the peak in SFR of the symmetric galaxies shows some differences between each mass bin. For example, in the low mass bin, the peak in SFR is less pronounced and lasts longer (i.e. between - ago), while the peak in SFR is stronger and shorter in time (occurring ago) in the intermediate and high mass bins, consistent with the "downsizing" formation scenario. The peak in SFR is also typically stronger in the high mass bin than in the intermediate one. The lopsided galaxies also show an overall similar behaviour in all mass bins without any prominent peak in SFR, consistent with the typically constant SFR as a function of time shown in Fig. 12. Interestingly, we note some differences between the SFH of the lopsided and symmetric galaxies in each mass bin. In the low mass bin, we see that the lopsided and symmetric galaxies have similar early SFR (i.e. ago), but they significantly differ at later times. In fact, the SFR of the lopsided galaxies shows a steadily increasing behaviour towards , as opposed to the peaked and decreasing one of the symmetric galaxies. In the intermediate mass bin, the SFR of the lopsided and symmetric galaxies significantly differs both at early and late times and, as in the low mass bin, we distinguish between an increasing to constant SFR behaviour for the lopsided galaxies and a peaked and decreasing one for the symmetric counterpart towards . Finally, in the high mass bin, both the lopsided and symmetric galaxies show a peaked and decreasing SFR behaviour towards , but the peak in SFR significantly differs at early times. In fact, the lopsided galaxies show a much flatter peak in SFR than the symmetric counterpart. In the bottom panels of Fig. 13, we see, once again, that the two distinct SFH behaviours are driving the different stellar mass growth of the lopsided and symmetric galaxies over time in all mass bin, with the symmetric galaxies typically assembling and of their total stellar mass earlier, on average, than the lopsided ones.
Based on the results shown in Fig. 12 and 13, it is clear that the lopsided and symmetric galaxies have followed different evolution pathways that contributed to shaping their distinct present-day internal properties. The symmetric galaxies have assembled at early times with relatively short and intense bursts of central star formation, possibly triggered by gas-rich major mergers. Since galaxies that form at early times assemble their stars at a time when the Universe was denser and richer in gas, this scenario is generally expected to produce compact galaxies with small sizes (e.g. Wellons et al. 2015) which is consistent with the, on average, higher central stellar mass density, smaller disk size and larger thickness of the inner galactic regions of the symmetric galaxies at seen in Fig. 7 and 9. On the other hand, lopsided galaxies have assembled on longer timescales and with milder initial bursts of star formation. They continued building up their mass until recent times, possibly through the continuous accretion of gas that kept the SFR roughly constant until (Combes, 2004). This scenario may have contributed to producing the lower central stellar mass density and larger disk size, on average, of the lopsided galaxies at seen in Fig. 7 and 9, since they are characterized by a more secular evolution that continued growing the galaxy stellar mass until the present-day without significant initial starbursts as in the symmetric galaxies.
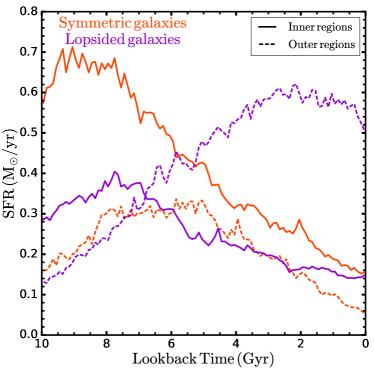
In order to further explore the different SFH displayed by these two different galaxy sub-samples, we dissect each galaxy into the inner (i.e. ; solid lines) and outer (i.e. ; dashed lines) components in Fig. 14. Here, the value to separate between the inner and outer galaxy components corresponds to the median of the distribution of all the galaxies in our sample at 999We have also tried using the of each galaxy to dissect the galaxy into the inner and outer components and we obtain similar results.. For each component, we show the stacked SFH of the strongly lopsided and strongly symmetric sub-samples within the last . Overall, we see that the symmetric galaxies have typically assembled both their inner and outer components in two early bursts of star formation and ago. However, the inner components of the symmetric galaxies have typically assembled with a significantly more intense star formation burst than the outer components. The lopsided galaxies have also assembled their inner components at similar early times as the symmetric counterpart, but with a significantly milder star formation burst. Interestingly, the lopsided galaxies have typically assembled their outer components very recently (i.e. ago) with, on average, a more intense peak in SFR than that of their inner components. The peak in SFR of the outer components of the lopsided galaxies is similar in intensity to that of the inner components of the symmetric galaxies.
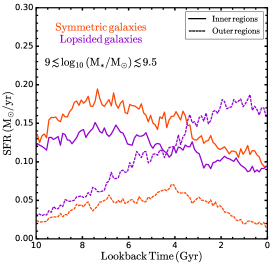
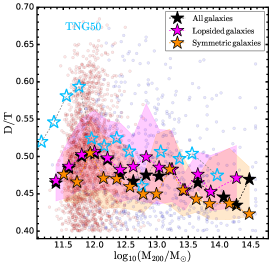
In Fig. 15, we see that the results shown in Fig. 14 continue to hold independently of the galaxy stellar mass. However, in each mass bin, we find some interesting differences in terms of the amplitude in the peak of SFR. The symmetric galaxies are characterized by very low SFR in their outer components in the low and intermediate mass bins. Instead, in the high mass bin, the symmetric galaxies have assembled their outer components at similar times as the inner ones at early times (i.e. ago), in a second relatively short and intense peak in SFR. In all mass bins, the symmetric galaxies continued evolving mostly passively at later times (i.e. ago) until . As previously mentioned, this is consistent with the earlier type disk morphology (i.e. small disk size, rounder shape of the inner galactic regions and high central stellar mass density) of the symmetric galaxies shown in Sec. 4.1 and 4.2. Lopsided galaxies also typically show two peaks in SFR in all mass bins, one of which is associated to the inner component and the other to the outer one. However, while the peak in SFR of the inner component occurs at similar early times (i.e. ago) as that of the symmetric counterpart, the peak in SFR of the outer components occurs at significantly later times (i.e. ago) and with a stronger or similar amplitude than that of the inner components in all mass bins. This shows that the lopsided galaxies have also likely assembled their inner components at early times, possibly with a short burst of central star formation. However, the peak in SFR of the inner components of the lopsided galaxies is milder than that of the symmetric counterpart, thus explaining the lower central stellar mass density, on average, of the lopsided galaxies with respect to the symmetric counterpart. Then, at later times, lopsided galaxies continued growing their outer components until as a result of the continuous accretion of gas that maintained the SFR overall constant. This explains their larger disk size and higher flatness of the inner galactic regions compared to the symmetric counterpart. Overall, this scenario is also consistent with the results found by VL22, where it is shown that the stellar half-mass radius (i.e. ) of the lopsided galaxies increases more significantly than that of the symmetric counterpart towards .
6 Summary and Conclusions
In this work, we have studied the presence of asymmetries (i.e. lopsidedness) in the mass distribution of the stellar component of disk-like galaxies selected from the TNG50 simulation at , as described in Sec. 2. Our sample contains both central and satellite galaxies located in environments characterized by a range of different total halo masses, from (i.e. low-density environments) to (i.e. Fornax cluster-like environments). As in previous works, we have quantified the global lopsidedness by performing an azimuthal Fourier decomposition of the galaxy stellar mass in the face-on view and measuring the amplitude of the first Fourier mode, , in the radial interval between -, where is the optical radius of the galaxy (see Sec. 3). Overall, we identify lopsided galaxies out of the in our sample (i.e. )). As previously mentioned in Sec. 3, this fraction of lopsided galaxies is significantly larger that that obtained using the observational radial interval, suggesting that deep observations extending out to the galaxy outskirts (i.e. disk optical radius, ) are necessary for detecting the full lopsided perturbation.
In Sec. 4, we have investigated the dependence of the lopsidedness with both the environment and galaxy morphology at . We list here our main results from this analysis:
-
(i)
we find a mild correlation between the lopsidedness amplitude and the environment, with only weakly decreasing with increasing total halo masses as well as number and local volume density of close massive neighbours, i.e. high-density environments;
-
(ii)
we find a correlation between lopsidedness and galaxy morphology, where galaxies with more extended disks, flatter inner galactic regions and lower central stellar mass density (i.e. late-type disk galaxies) are typically more lopsided than galaxies with smaller disks, rounder inner galactic regions and larger central stellar mass density. The former (late-type) galaxies are also typically located in lower density environments than the latter (early-type) galaxies, suggesting a change in galaxy morphology with the environment consistent with the observational results from the morphology-density relation;
-
(iii)
lopsided galaxies tend to be characterized by, on average, more extended disks, flatter inner galactic regions and lower central stellar mass density than the symmetric counterpart, independently of the environment.
Overall, these results show evidence of a stronger correlation between lopsidedness and the internal galaxy properties than with the environment, which mainly plays a secondary role in the origin of lopsidedness. The role played by the environment can be characterized by: 1) shaping the evolution of galaxies and their key internal properties in terms of lopsidedness, such as their central surface density and 2) inducing the onset of lopsided perturbations in galaxies with favourable internal properties as a result of an interaction (VL22). The lack of correlation between lopsidedness and environment, and its stronger dependence on galaxy morphology is confirmed using a more statistically representative sample of galaxies in the TNG100 simulation towards higher density environments (i.e. ) at (see Sec. 4.4).
The fact that lopsided galaxies are characterized by, on average, more extended disks, flatter inner galactic regions and lower central stellar mass density than the symmetric counterpart independently of the environment suggests that other mechanisms, such as internal evolution, may be responsible for shaping the distinct present-day galaxy properties. Indeed, in Sec. 5.1, we find two distinct star formation history behaviours for the lopsided and symmetric galaxies. The symmetric galaxies are characterized by a peaked SFR at early times (i.e. ago) that steeply decreases until , while the lopsided galaxies are characterized by an overall constant SFR until . The lopsided galaxies also show, on average, lower SFR than the symmetric ones at early times (i.e. more than ago), while the opposite is true at recent times (i.e. within the last ). These results suggest that the lopsided and symmetric galaxies have followed different evolution pathways that contributed to shaping their distinct present-day internal properties. The symmetric galaxies have assembled at early times with relatively short and intense bursts of central star formation, possibly triggered by gas-rich major mergers, that shaped their, on average, higher central stellar mass density, smaller disk size and larger thickness of the inner galactic regions at (e.g. Wellons et al. 2015). On the other hand, lopsided galaxies have assembled on longer timescales and with milder central bursts of star formation than the symmetric counterpart. They continued building up their outer regions until recent times, possibly through the continuous accretion of gas that kept the SFR roughly constant until (Combes, 2004). This secular evolution scenario contributed to producing the lower central stellar mass density, larger disk size and higher flatness of the inner galactic regions of the lopsided galaxies with respect to the symmetric counterparts at .
To conclude, within this work, we find evidence of a clear connection between lopsidedness and the evolution of galaxies, which highlight the potential of probing the likely evolution history of present-day observed galaxies based on the presence of asymmetric features in their disks. For example, the correlation between lopsidedness and photometric (see Sec. 4.3) indicates that a strong lopsided perturbation is more likely to develop in bulge-less galaxies, as it is observed in M101 (Beale & Davies, 1969), which may have evolved through a more secular evolution scenario based on our results. In a follow-up work, we aim to explore the origin of the distinct SFH of the lopsided and symmetric galaxies by characterizing the nature of the central prominent peak in SFR at early times of the symmetric galaxies, in comparison to the early mild peak in SFR of the lopsided galaxies. To achieve this goal, we aim to characterize the environment of the progenitors of present-day lopsided and symmetric galaxies at high-redshifts (i.e. lookback time - ago) to establish whether the intense burst in star formation in the central regions of the symmetric galaxies may be triggered by early interactions with external galaxies or gas-rich mergers. Overall, this will allow us not only to establish how the distinct SFH can shape the evolution of galaxies and their key internal properties in terms of lopsidedness through cosmic time, but also to probe the role of the environment and internal processes in shaping the SFH and evolution of the galaxies to their present-day properties and morphology.
Acknowledgements
The authors gratefully acknowledge support by the ANID BASAL project FB210003. FAG and AM acknowledge support by FONDECYT Regular grant 1211370 and 1212046, respectively, and funding from the Max Planck Society through a “PartnerGroup” grant. PBT acknowledges partial funding from FONDECYT 1200703 and the LACEGAL Network (Horizon 2030). CS acknowledges support from the Agencia Nacional de Investigación y Desarrollo (ANID) through FONDECYT grant no. 11191125. SVL acknowledges financial support from ANID "Beca de Doctorado Nacional" 21221776.
Data Availability
The data used in this work are publicly available from the IllustrisTNG simulations (Nelson et al., 2019a).
References
- Angiras et al. (2006) Angiras R. A., Jog C. J., Omar A., Dwarakanath K. S., 2006, MNRAS, 369, 1849
- Angiras et al. (2007) Angiras R. A., Jog C. J., Dwarakanath K. S., Verheijen M. A. W., 2007, MNRAS, 378, 276
- Baldwin et al. (1980) Baldwin J. E., Lynden-Bell D., Sancisi R., 1980, MNRAS, 193, 313
- Beale & Davies (1969) Beale J. S., Davies R. D., 1969, Nature, 221, 531
- Bekki & Couch (2011) Bekki K., Couch W. J., 2011, MNRAS, 415, 1783
- Blanton & Moustakas (2009) Blanton M. R., Moustakas J., 2009, ARA&A, 47, 159
- Block et al. (1994) Block D. L., Bertin G., Stockton A., Grosbol P., Moorwood A. F. M., Peletier R. F., 1994, A&A, 288, 365
- Bournaud et al. (2004) Bournaud F., Combes F., Jog C. J., 2004, A&A, 418, L27
- Bournaud et al. (2005) Bournaud F., Combes F., Jog C. J., Puerari I., 2005, A&A, 438, 507
- Cappellari et al. (2011) Cappellari M., et al., 2011, MNRAS, 416, 1680
- Combes (2004) Combes F., 2004, in Block D. L., Puerari I., Freeman K. C., Groess R., Block E. K., eds, Astrophysics and Space Science Library Vol. 319, Penetrating Bars Through Masks of Cosmic Dust. p. 57 (arXiv:astro-ph/0406306), doi:10.1007/978-1-4020-2862-5_4
- Conselice et al. (2000) Conselice C. J., Bershady M. A., Jangren A., 2000, ApJ, 529, 886
- Deeley et al. (2020) Deeley S., et al., 2020, MNRAS, 498, 2372
- Dressler (1980) Dressler A., 1980, ApJ, 236, 351
- Dressler et al. (1997) Dressler A., et al., 1997, ApJ, 490, 577
- Drinkwater et al. (2001) Drinkwater M. J., Gregg M. D., Colless M., 2001, ApJ, 548, L139
- Fasano et al. (2000) Fasano G., Poggianti B. M., Couch W. J., Bettoni D., Kjærgaard P., Moles M., 2000, ApJ, 542, 673
- Foster et al. (2021) Foster C., et al., 2021, Publ. Astron. Soc. Australia, 38, e031
- Gargiulo et al. (2019) Gargiulo I. D., et al., 2019, MNRAS, 489, 5742
- Gargiulo et al. (2022) Gargiulo I. D., et al., 2022, MNRAS, 512, 2537
- Genel et al. (2014) Genel S., et al., 2014, MNRAS, 445, 175
- Genel et al. (2015) Genel S., Fall S. M., Hernquist L., Vogelsberger M., Snyder G. F., Rodriguez-Gomez V., Sijacki D., Springel V., 2015, ApJ, 804, L40
- Ghosh et al. (2022) Ghosh S., Saha K., Jog C. J., Combes F., Di Matteo P., 2022, Monthly Notices of the Royal Astronomical Society, 511, 5878
- Grand et al. (2016) Grand R. J. J., Springel V., Gómez F. A., Marinacci F., Pakmor R., Campbell D. J. R., Jenkins A., 2016, MNRAS, 459, 199
- Haynes et al. (1998) Haynes M. P., Hogg D. E., Maddalena R. J., Roberts M. S., van Zee L., 1998, The Astronomical Journal, 115, 62
- Jog (1997) Jog C. J., 1997, The Astrophysical Journal, 488, 642
- Jog (2002) Jog C. J., 2002, A&A, 391, 471
- Jog & Combes (2009) Jog C. J., Combes F., 2009, Physics Reports, 471, 75
- Joshi et al. (2020) Joshi G. D., Pillepich A., Nelson D., Marinacci F., Springel V., Rodriguez-Gomez V., Vogelsberger M., Hernquist L., 2020, Monthly Notices of the Royal Astronomical Society, 496, 2673
- Łokas (2022) Łokas E. L., 2022, A&A, 662, A53
- Marinacci et al. (2013) Marinacci F., Pakmor R., Springel V., 2013, Monthly Notices of the Royal Astronomical Society, 437, 1750
- Marinacci et al. (2018) Marinacci F., et al., 2018, MNRAS, 480, 5113
- Naiman et al. (2018) Naiman J. P., et al., 2018, MNRAS, 477, 1206
- Nelson et al. (2015) Nelson D., et al., 2015, Astronomy and Computing, 13, 12
- Nelson et al. (2018) Nelson D., et al., 2018, MNRAS, 475, 624
- Nelson et al. (2019a) Nelson D., et al., 2019a, Computational Astrophysics and Cosmology, 6, 2
- Nelson et al. (2019b) Nelson D., et al., 2019b, MNRAS, 490, 3234
- Noordermeer et al. (2001) Noordermeer E., Sparke L. S., Levine S. E., 2001, Monthly Notices of the Royal Astronomical Society, 328, 1064
- Pillepich et al. (2018a) Pillepich A., et al., 2018a, MNRAS, 473, 4077
- Pillepich et al. (2018b) Pillepich A., et al., 2018b, MNRAS, 475, 648
- Pillepich et al. (2019) Pillepich A., et al., 2019, MNRAS, 490, 3196
- Planck Collaboration et al. (2016) Planck Collaboration et al., 2016, A&A, 594, A13
- Reichard et al. (2008) Reichard T. A., Heckman T. M., Rudnick G., Brinchmann J., Kauffmann G., 2008, The Astrophysical Journal, 677, 186
- Renzini & Peng (2015) Renzini A., Peng Y.-j., 2015, ApJ, 801, L29
- Richter & Sancisi (1994) Richter O. G., Sancisi R., 1994, A&A, 290, L9
- Rix & Zaritsky (1995) Rix H.-W., Zaritsky D., 1995, ApJ, 447, 82
- Rudnick & Rix (1998) Rudnick G., Rix H.-W., 1998, AJ, 116, 1163
- Saha et al. (2007) Saha K., Combes F., Jog C. J., 2007, MNRAS, 382, 419
- Sijacki et al. (2015) Sijacki D., Vogelsberger M., Genel S., Springel V., Torrey P., Snyder G. F., Nelson D., Hernquist L., 2015, MNRAS, 452, 575
- Springel (2010) Springel V., 2010, MNRAS, 401, 791
- Springel et al. (2018) Springel V., et al., 2018, MNRAS, 475, 676
- Swaters et al. (1999) Swaters R. A., Schoenmakers R. H. M., Sancisi R., van Albada T. S., 1999, MNRAS, 304, 330
- Varela-Lavin et al. (2022) Varela-Lavin S., Gómez F. A., Tissera P. B., Besla G., Garavito-Camargo N., Marinacci F., 2022, arXiv e-prints, p. arXiv:2211.16577
- Vogelsberger et al. (2014) Vogelsberger M., et al., 2014, Nature, 509, 177
- Walker et al. (1996) Walker I. R., Mihos J. C., Hernquist L., 1996, ApJ, 460, 121
- Weinberger et al. (2017) Weinberger R., et al., 2017, MNRAS, 465, 3291
- Wellons et al. (2015) Wellons S., et al., 2015, Monthly Notices of the Royal Astronomical Society, 449, 361
- Wilcots (2010) Wilcots E. M., 2010, in Verdes-Montenegro L., Del Olmo A., Sulentic J., eds, Astronomical Society of the Pacific Conference Series Vol. 421, Galaxies in Isolation: Exploring Nature Versus Nurture. p. 149
- Zaritsky & Rix (1997) Zaritsky D., Rix H.-W., 1997, The Astrophysical Journal, 477, 118
- Zaritsky & Rix (1999) Zaritsky D., Rix H. W., 1999, in Barnes J. E., Sanders D. B., eds, Vol. 186, Galaxy Interactions at Low and High Redshift. p. 117
Appendix A The role of the environment in the TNG100 simulation
A.1 The galaxy sample
We use the highest resolution version, i.e. TNG100-1 (hereafter, TNG100), of the three available simulation runs, and we select our sample of disk-like galaxies in TNG100 at similarly to Sec. 2.2 by assuming the following two selection criteria, i.e.:
-
(i)
total number of bound stellar particles, ;
-
(ii)
disk morphology, .
Overall, our selected galaxy sample includes galaxies, with centrals and satellites. The top panel of Fig. 16 shows the stellar mass distribution of all our galaxies as well as of the central and satellite galaxies, separately. We see that the central and satellite galaxies have a similar stellar mass distribution with median , which is shifted towards higher stellar masses compared to TNG50. This difference is due to the lower mass resolution of TNG100 than TNG50 and, as a result, low mass galaxies (i.e. ) are not resolved by a sufficiently high number of stellar particles in TNG100 that satisfies our selection criteria described above. However, similarly to TNG50, we also find that only of the satellite galaxies have as opposed to of the central galaxies in TNG100. For this reason, the central galaxies represent the majority () compared to the satellite galaxies (), similarly to what we have seen in Fig. 1 of Sec. 2.2 for TNG50.
On the other hand, the bottom panel of Fig. 16 shows the total halo mass distribution, , of all our galaxies as well as of the central and satellite galaxies, separately. Overall, we see that both the TNG100 and TNG50 simulations cover similar halo masses up to Fornax cluster-like environments (i.e. ), however the TNG100 simulation adds a larger number of galaxies at higher halo masses than TNG50, specifically beyond where the number of galaxies steeply declines in TNG50.
A.2 The lopsidedness distribution
We calculate the present-day global lopsidedness, , of the galaxies in the TNG100 simulation following the procedure described in Sec. 3 for TNG50. Therefore, from the face-on projection of the stellar surface density, we estimate the optical radius, , of the galaxy and measure the lopsidedness, (see Eq. 4), in radial annuli of width out to . Them, the global lopsidedness, , is calculated by averaging the amplitudes measured in each radial annulus between -.
Fig. 17 shows the distribution of the present-day lopsidedness of our selected galaxy sample from the TNG100 simulation. Overall, we find that galaxies are lopsided (i.e. ), while the remaining galaxies are symmetric (i.e. ). Overall, the lopsidedness distribution of the galaxies in TNG100 and TNG50 (see Fig. 5) are generally consistent with the central galaxies being on average more lopsided than the satellite galaxies, even though this difference is less evident in TNG100 than in TNG50.
However, we note that we find a much larger number of lopsided galaxies reaching values as large as - compared to Łokas (2022), who also used the TNG100 simulation, although this difference may be due to the different radial interval used in Łokas (2022) (i.e. -) and in this work (i.e. -) to measure the lopsidedness that can significantly affect the estimation of the lopsidedness, as previously discussed in Sec. 3.2.
A.3 The total halo mass of the host environment of the galaxies
In Fig. 18, we study the behaviour of the lopsidedness amplitude, , as a function of the total halo mass, , of the environment where our galaxies reside at (black stars). We see that the median amplitude of remains overall constant with increasing in the TNG100 simulation with only a mild drop between -, as opposed to the mild, but continuous, decreasing trend seen in TNG50 (light blue stars). The flatter behaviour of as a function of in TNG100 than in TNG50 may be due to the larger statistical galaxy sample provided by TNG100 at higher halo masses, specifically beyond (see Fig. 1), where the median lopsidedness amplitude begins decreasing in TNG50. Therefore, the overall flatness of as a function of shown in Fig. 18 using the TNG100 simulation seems to confirm the finding that the lopsidedness amplitude does not significantly depend on the environment, as we have previously suggested in Sec. 4.1 using the TNG50 simulation.
Similarly to Fig. 7, in Fig. 19, we study the behaviour of the , and as a function of the total halo mass, , of the host environment at (black stars) from the left to the right panel, respectively. Firstly, we see that the galaxies tend to be characterized by on average larger and smaller and in TNG50 than in TNG100, suggesting that the galaxies in TNG50 are more disk-like than in TNG100. Secondly, we also see that the differences between the internal properties of the lopsided and symmetric galaxies are less evident in TNG100 (see Fig. 19) than in TNG50 (see Fig. 7). These differences in the internal properties of the galaxies between TNG50 and TNG100 may be the result of the lower resolution of TNG100, which does not enable to reliably resolve differences in the structural and internal properties of the galaxies and their disks.
Nevertheless, in Fig. 19, we still see that the overall median and are characterized by a mild decreasing and increasing trend with increasing , respectively, suggesting a change to earlier type disk morphology towards high halo masses (i.e. high-density environments), consistent with the results from the TNG50 simulation shown in Fig. 7. Additionally, we also see that the slightly higher lopsidedness amplitude between in Fig. 18 roughly corresponds to a small peak in and small dip in in Fig. 19. Therefore, these results from the TNG100 simulation also seem to suggest the possibility of a stronger correlation between the lopsidedness and the internal properties of the galaxies rather than the environment, consistent with the results from TNG50 described in Sec. 4.1.
A.4 The local environment of the galaxies
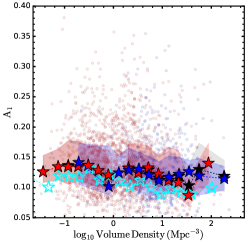
Similarly to Fig. 9, in Fig. 20, we study the behaviour of the lopsidedness amplitude as a function of the local environment at defined in i)-iii) (see Sec. 4.2) from the left to the right panel, respectively, for our selected galaxy sample from the TNG100 simulation. In each panel, we also show the corresponding result from the TNG50 simulation as light blue stars for comparison. We see that the median amplitude of the lopsidedness also shows an overall constant to mild decreasing trend with the increasing number of close massive neighbours and local volume density of galaxies in TNG100, similarly to TNG50. Here, the exception is represented by the environmental definition based on , where we see that the median lopsidedness amplitude shows a steeper decrease (middle panels in Fig. 20. As already mentioned in the previous Sec. A.3, the mild decreasing trend with the environment indicates that lopsidedness does not significantly depend on the number and density of close massive neighbours (i.e. the frequency and type of interactions), consistent with the results from the TNG50 simulation (see Sec. 4.2).
In Fig. 21, we show the behaviour of the , and as a function of the local environment at defined in i)-iii) from the left to the right panel, respectively, for a total mass cut of the neighbouring galaxies , as done for TNG50 in Fig. 9). Similarly to Fig. 19, we see that the galaxies have larger and smaller and in TNG50 than in TNG100, possibly suggesting the effect of the different mass resolution between the two simulations, and that the and show a mild decreasing and increasing trend with the increasing number of close massive neighbours and local volume density of galaxies, respectively, while the remains overall constant, possibly suggesting a change to earlier type disk morphology towards higher density environments as also seen in TNG50 (see Sec. 4). However, in Fig. 21, the lopsided galaxies still seem to be characterized by somewhat larger and smaller and than the symmetric galaxies, similarly to Fig. 19 as a function of , even though the differences are less evident than in TNG50 (see Sec. 4).
Overall, the study of the lopsidedness carried out in this Appendix A using the TNG100 simulation, which provides a larger statistical galaxy sample in high-density environments, seems to confirm the results from the TNG50 simulation in Sec. 4 that the lopsidedness amplitude does not significantly depend on the environment but rather it correlates more strongly with the distinct internal properties of the galaxies, such as their disk fraction, disk thickness and central stellar mass density, overall consistent also with the findings from other previous works (e.g. Reichard et al. 2008; Jog & Combes 2009; Varela-Lavin et al. 2022).
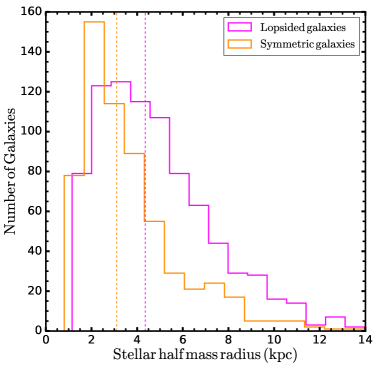
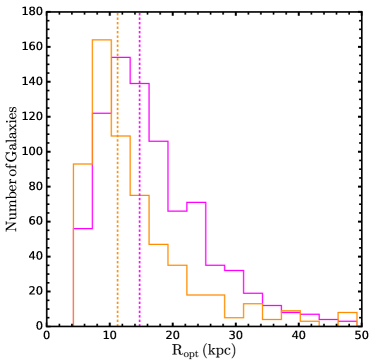
Appendix B Stellar half-mass and optical radii distribution