Data structures for photoabsorption within the ExoMol project–LABEL:lastpage
Data structures for photoabsorption within the ExoMol project
Abstract
The ExoMol database currently provides comprehensive line lists for modelling the spectroscopic properties of molecules in hot atmospheres. Extending the spectral range of the data provided to ultraviolet (UV) wavelengths brings into play three processes not currently accounted for in the ExoMol data structure, namely photodissociation, which is an important chemical process in its own right, the opacity contribution due to continuum absorption and predissociation which can lead to significant and observable line broadening effects. Data structures are proposed which will allow these processes to be correctly captured and the (strong) temperature-dependent effects predicted for UV molecular photoabsorption in general and photodissociation in particular to be represented.
keywords:
Data methods; photoabsorption; exoplanets1 Introduction
The analysis of light as function of wavelengths provides a major window on the Universe. To interpret these signals requires appropriate laboratory data. The ExoMol project (Tennyson & Yurchenko, 2012) was established to provide molecular line list for hot astronomical atmospheres. Up until recently the ExoMol project, in keeping with similar projects such as HITEMP (Rothman et al., 2010; Hargreaves et al., 2019), TheoReTS (Rey et al., 2016) and NASA Ames (Huang et al., 2021), has presented results as (large) lists of transitions or spectral lines. Implicitly this assumes that all lines are discrete transitions between bound states (bound – bound transitions) even though in some cases the upper states may actually lie in the continuum so that these transitions, while still appearing as lines, actually represent part of the bound – free spectrum. The ExoMol project uses a well-defined format for line lists (Tennyson et al., 2013) which has been further developed as part of its data releases (Tennyson et al., 2016b, 2020).
However, a number of recent developments, discussed below, have extended the scope of the ExoMol project and therefore the data it provides. This has caused us to consider how to generalise the ExoMol data structure to accommodate both the increased range of data and also its different uses as bound – free data are important not only for opacities and spectroscopic models but also, in that they represent a route to photodissociation, which is an important process for chemical models. Sharp transitions to states lying above the dissociation limit are already starting to be captured by ExoMol as part of standard line lists (Qu et al., 2021; Owens et al., 2022). However, once occupied these above dissociation states can decay either by emitting a photon, such as UV flourescence which is an important astrophysical process (Lupu et al., 2011; Gérard et al., 2022), or they can dissociate. The above dissociation region also contains a continuum component to the photoabsorpion caused, for example, by excitation to dissociative electronically excited states. Currently neither ExoMol, or indeed none of the databases cited above, capture this component. At the same time we have started to consider the role of photodissociation (Pezzella et al., 2021, 2022) which itself usually comprises sharp lines sitting on top of a continuum. Photoabsorption into the continuum cannot be represented by the current ExoMol line format. We note that continuous opacities on a grid of temperatures and wavelengths for molecules were generated by Kurucz et al. (1987) and tabulated experimental vacuum ultra violet (VUV) cross sections of molecules are collected in the MPI-Mainz UV/VIS Spectral Atlas (Keller-Rudek et al., 2013) as a continuous spectrum.
A third issue is the representation of the so-called predissociation which occurs when transitions to excited electronic states which lie above the dissociation limit spontaneously undergo a further process (usually a curve crossing or tunneling) which leads to dissociation. The resulting lines are observed to be broadened, often significantly, due to the shorter lifetimes associated with predissociating states. So far while the ExoMol project has included states in its line lists which are predissociative, it has ignored the important line broadening effects which result from the reduced lifetime associated with predissociative states. A recent study by Pavlenko et al. (2022) of the spectrum AlH in M-dwarf star Proxima Cen highlights problems with this approach. Pavlenko et al. used the ExoMol AlHambra line list for AlH (Yurchenko et al., 2018b) to model this spectrum. For the majority of transitions, which do not show any effects due to predissociation, this line list worked well but it proved to be less accurate for transitions to predissociating states. Importantly, only the lines which showed broadening, often by as much as 5 cm-1, due to predissociation are not saturated in the stellar spectra meaning that it was only by analysing these broadened lines that Pavlenko et al. were able to retrieve abundances of AlH. It would therefore clearly be advantageous to include consideration of predissociation effects in the ExoMol database.
In this research note we propose a generalisation of the current ExoMol format to allow for the various processes discussed above. At the same time we draw a clear distinction between the photoabsorption data, needed for spectral and opacity models, and for the data needed for modelling the chemical consequences of photodissociation.
2 The present ExoMol data model
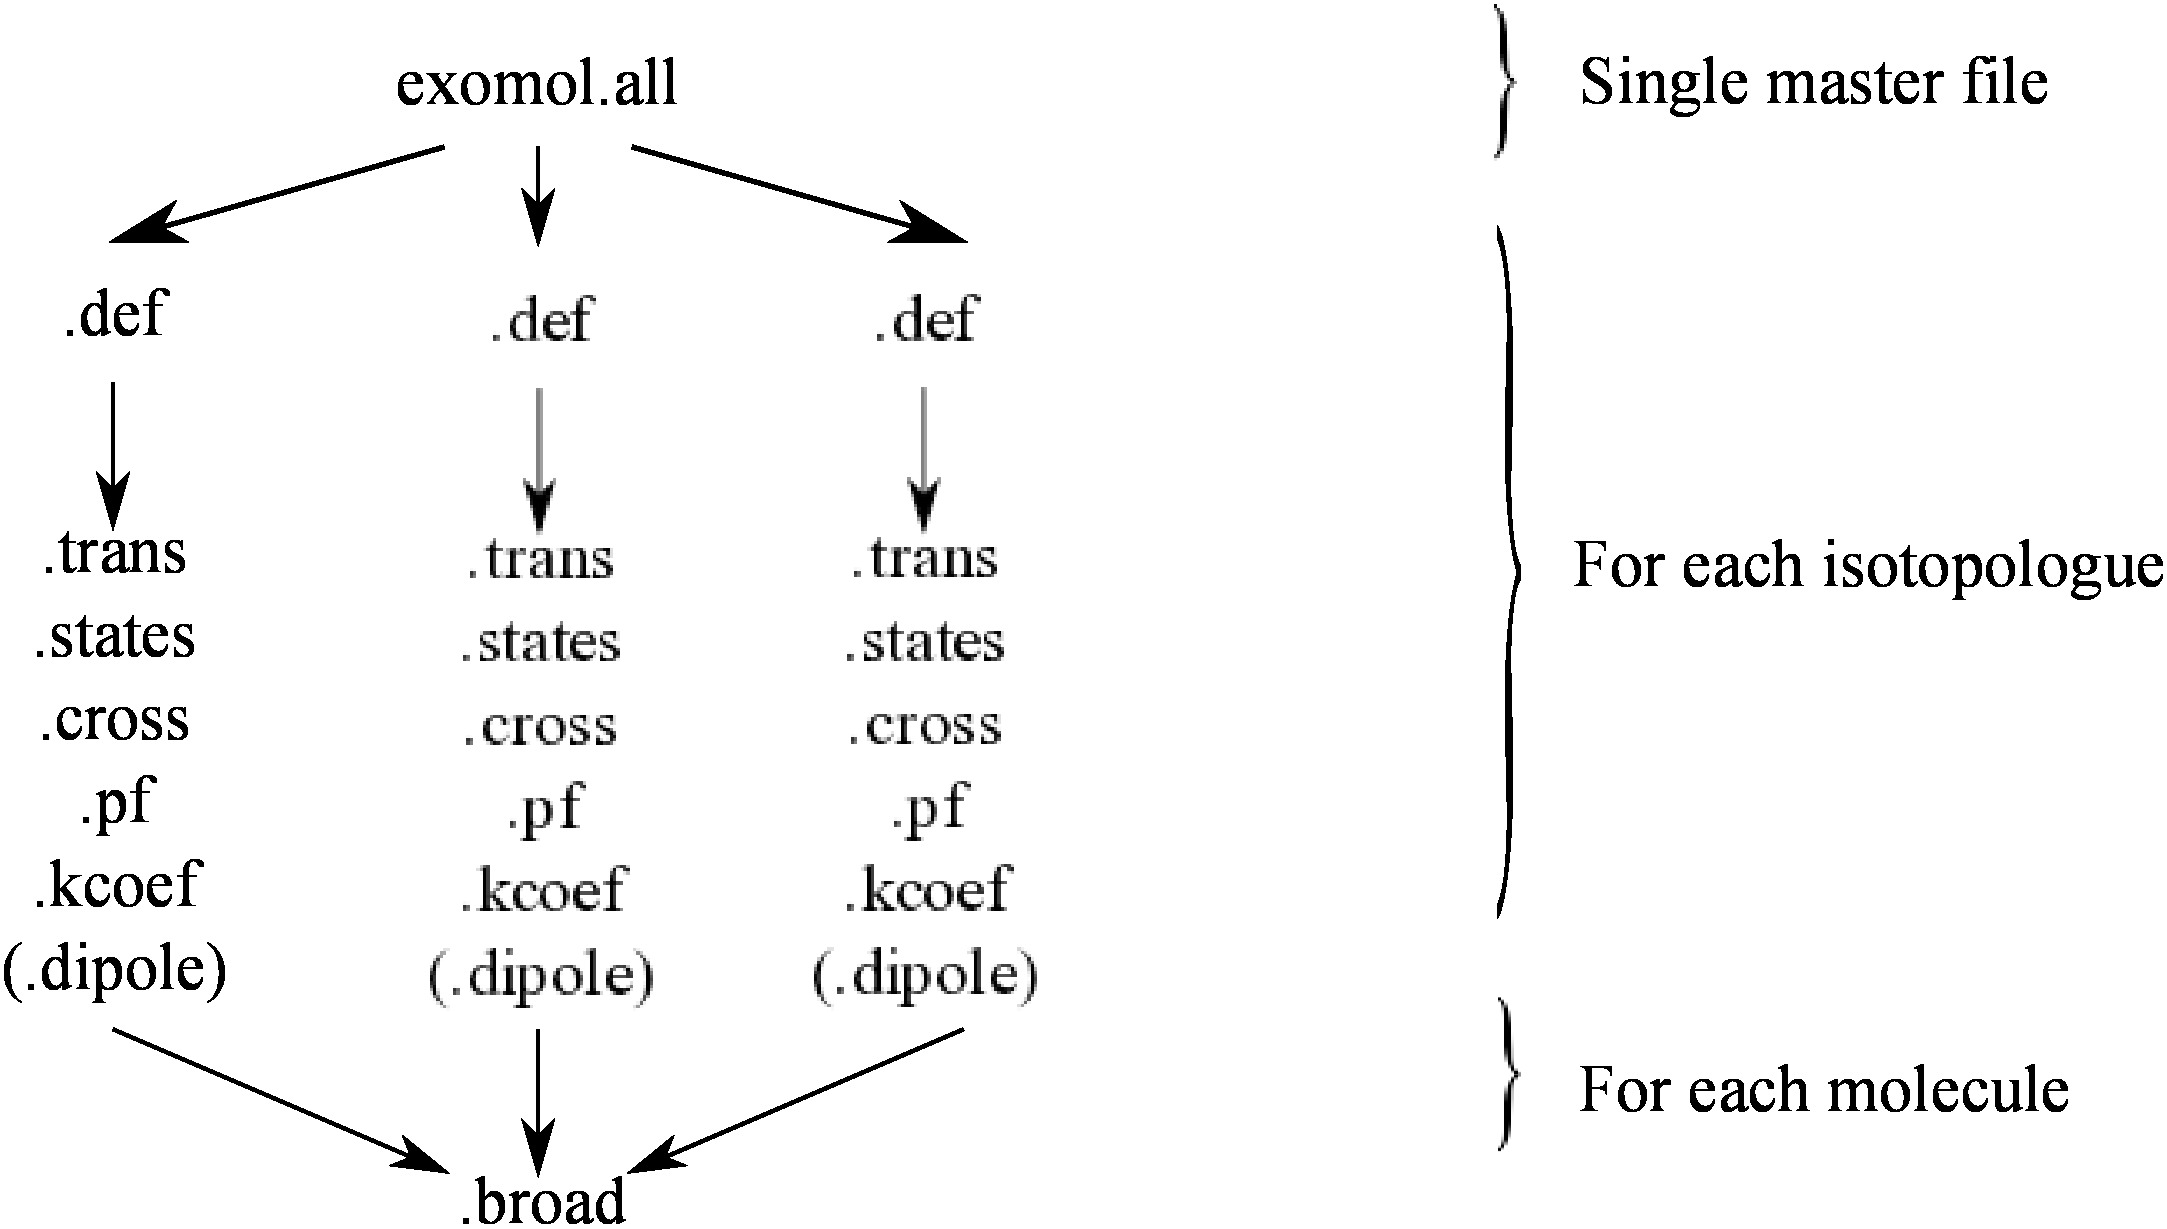
Figure 1 gives a simplified ExoMol data structure; a complete specification of the file types is given in Table 1. The master file exomol.all (https://www.exomol.com/exomol.all) gives an overview of the entire database and points towards the .def files which characterise the recommended line lists for each isotopologue for which data is available. The .def file contains specification of the dataset in terms of what is available, for example uncertainties or lifetimes, quantum numbers used in the states file and file sizes. It also gives a version number in yyyymmdd date format. The core of the database are the .states and .trans files which provide a compact form of the line list data.
| File extension | File DSname | Contents | |
|---|---|---|---|
| .all | 1 | Master | Single file defining contents of the ExoMol database. |
| .def | Definition | Defines contents of other files for each isotopologue. | |
| .states | States | Energy levels, quantum numbers, lifetimes, (Landé -factors, Uncertainties). | |
| .trans | a | Transitions | Einstein coefficients, (wavenumber). |
| .broad | Broadening | Parameters for pressure-dependent line profiles. | |
| .cross | b | Cross sections | Temperature or temperature and pressure-dependent cross sections. |
| .kcoef | c | -coefficients | Temperature and pressure-dependent -coefficients. |
| .pf | Partition function | Temperature-dependent partition function, (cooling function). | |
| .dipoles | Dipoles | Transition dipoles including phases. | |
| .super | d | Super-lines | Temperature dependent super-lines (histograms) on a wavenumber grid. |
| .nm | e | VUV cross sections | Temperature and pressure dependent VUV cross-sections (wavelength, nm). |
| .fits, .h5, .kta | f | Opacities | Temperature and pressure dependent opacities for radiative-transfer applications. |
| .overview | Overview | Overview of datasets available. | |
| .readme | Readme | Specifies data formats. | |
| .model | Model | Model specification. | |
| .cont | Continuum | Continuum contribution to the photoabsorption. | |
| .pdef | Definition | Defines contents of .photo files for each isotopologue. | |
| .photo | Photodissociation | Photodissociation cross sections for each lower state. |
total number of possible files;
Number of molecules in the database;
is the sum of for the molecules in the
database;
Number of isotopologues considered for the given molecule.
a There are sets of .trans files but for molecules
with large
numbers of transitions the .trans files are subdivided into wavenumber
regions.
b There are sets of .cross files for
isotopologue.
c There are sets of .kcoef files for each
isotopologue.
d There are sets of -dependent super-lines.
e There are sets of VUV cross sections.
f Set of opacity files in the format native to specific radiative-transfer programs.
| Field | Fortran Format | C Format | Description |
|---|---|---|---|
| I12 | %12d | State ID | |
| F12.6 | %12.6f | State energy in | |
| I6 | %6d | State degeneracy | |
| I7/F7.1 | %7d/%7.1f | -quantum number (integer/half-integer) | |
| (unc) | F12.6 | %12.6f | Uncertainty in state energy in (optional) |
| () | ES12.4 | %12.4e | Lifetime in s (optional) |
| () | F10.6 | %10.6f | Landé -factor (optional) |
ID: state identifier: a non-negative integer index, starting at 1
: total angular momentum quantum, excluding nuclear spin
Fortran format, integer: (I12,1x,F12.6,1x,I6,I7,1x,ES12.4,1x,F10.6)
or half-integer: (I12,1x,F12.6,1x,I6,F7.1,1x,ES12.4,1x,F10.6)
Table 2 gives the specifications for the mandatory part of the .states file. These specifications include the optional components: uncertainties in the term values, the state lifetime and Landé -factor. The specification of term value uncertainties was introduced as part of the last data release (Tennyson et al., 2020) and the aim is to make their inclusion compulsory once the available datasets have all had uncertainties added. The lifetimes column has thus far contained radiative lifetimes computed using the Einstein A coefficients available in the transitions file (Tennyson et al., 2016a); so far lifetime effects due to other processes such as predissociation have not been considered. As discussed below we propose changing this.
After the mandatory fields, the states files contains data on the quantum numbers and other meta-data used to specify each state. The number and format of these quantum numbers is specified in by the .def file associated with that dataset. Other metadata associated with level can also be included in this section. Table 3 shows the start of the states file for the recently update AlHambra line list for 27Al16O (Bowesman et al., 2021). Note that we have taken the opportunity to update our quantum number specifications to conform with the PyValem python package for parsing, validating, manipulating quantum states labels of atoms, ions and small molecules (Hill & Hanicinec, 2022; Hill et al., 2023b). In general, this change only affects electronic state designations for which X2SIGMA+, A2PI and soforth are updated to X(2SIGMA+), A(2PI), etc.. This update adds two characters to the electronic state field but otherwise should be transparent to users; however, it means that all state labels can now be parsed using PyValem which is important for some uses of the database (Owens et al., 2023).
Table 4 gives the specification of the simpler but generally much larger .trans file.
| (cm-1) | unc (cm-1) | (s) | e/f | State | || | || | || | Source Label | |||||
|---|---|---|---|---|---|---|---|---|---|---|---|---|---|
| 1 | 0.000000 | 12 | 0.5 | 0.000001 | inf | + | e | X(2SIGMA+) | 0 | 0 | 0.5 | 0.5 | EH |
| 2 | 965.416878 | 12 | 0.5 | 0.001651 | 3.6193e+01 | + | e | X(2SIGMA+) | 1 | 0 | 0.5 | 0.5 | PS |
| 3 | 1916.827286 | 12 | 0.5 | 0.010519 | 9.1761e+00 | + | e | X(2SIGMA+) | 2 | 0 | 0.5 | 0.5 | PS |
| 4 | 2854.162814 | 12 | 0.5 | 0.022148 | 4.2147e+00 | + | e | X(2SIGMA+) | 3 | 0 | 0.5 | 0.5 | PS |
| 5 | 3777.464572 | 12 | 0.5 | 0.019275 | 2.3874e+00 | + | e | X(2SIGMA+) | 4 | 0 | 0.5 | 0.5 | PS |
| 6 | 4686.658929 | 12 | 0.5 | 0.016235 | 1.2041e+00 | + | e | X(2SIGMA+) | 5 | 0 | 0.5 | 0.5 | PS |
| 7 | 5346.089546 | 12 | 0.5 | 0.009700 | 2.0501e-04 | + | e | A(2PI) | 0 | 1 | 0.5 | 0.5 | Ma |
| 8 | 5581.908884 | 12 | 0.5 | 0.014747 | 4.3685e-02 | + | e | X(2SIGMA+) | 6 | 0 | 0.5 | 0.5 | PS |
-
•
: State counting number;
-
•
: Term value (in cm-1);
-
•
: Total state degeneracy;
-
•
: Total angular momentum quantum number;
-
•
unc: Estimated uncertainty of energy level (in cm-1);
-
•
: Lifetime (in s-1);
-
•
: Total parity;
-
•
e/f: Rotationless parity;
-
•
State: Electronic term value;
-
•
: Vibrational quantum number;
-
•
||: Absolute value of the projection of electronic angular momentum;
-
•
||: Absolute value of the projection of the electronic spin;
-
•
||: Absolute value of the projection of the total angular momentum;
-
•
Source Label: Method used to generate term value (McKemmish et al., 2023).
| Field | Fortran Format | C Format | Description |
|---|---|---|---|
| I12 | %12d | Upper state ID | |
| I12 | %12d | Lower state ID | |
| ES10.4 | %10.4e | Einstein coefficient in | |
| E15.6 | %15.6e | Transition wavenumber in cm-1 (optional). |
Fortran format: (I12,1x,I12,1x,ES10.4,1x,ES15.6)
3 Proposed updated ExoMol data model
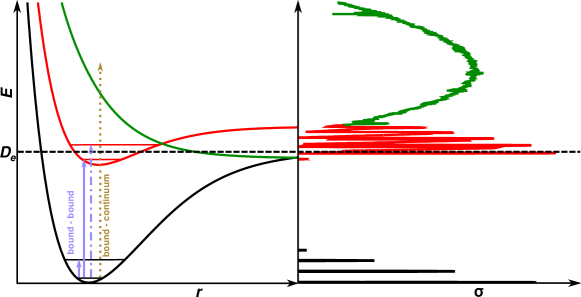
There are three new aspects that need to be included in an updated ExoMol data structure: predissociation, the continuum contribution to the opacity and photodissociation. Figure 2 illustrates the various photoabsorption processes for the case of a diatomic molecule.
3.1 Predissociation
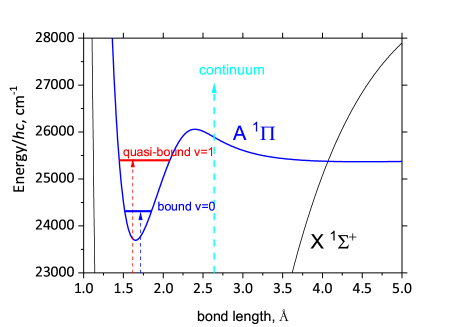
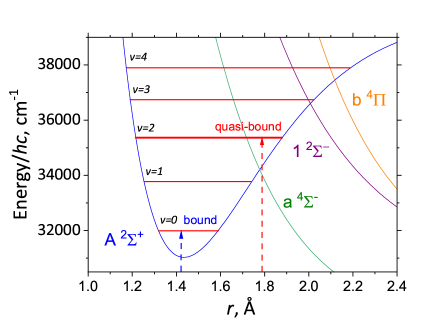
Figure 3 illustrates the main mechanism leading to predissociation; for AlH it is caused by tunneling through a small barrier to a dissociation, while for SH it is caused by couplings to dissociative states crossing the state to which the transition goes to. The effect of predissociation can be included by a minor adjustment to the current ExoMol data structure. Predissociation manifests as a shortened lifetime which leads to enhanced natural line-broadening of any transition to (or from) the state concerned. We therefore propose to generalise the definition of the lifetime, , given in the .states file. For most line lists, where predissociation is not important, is defined as the natural lifetime due to radiative decay. In cases where predissociation is considered, will represent the natural life due to both radiative decay and predissociation. For example, the radiative lifetime of A state of SH was calculated by Gorman et al. (2019) as 5.13 ns, while the predissociative lifetimes was measured as 5.45(24) ps () (Wheeler et al., 1997). A similar example of the predissociation effects in the spectra of AlH is the predissociative lifetime of the , , A state of 27AlH, which was measured by Baltayan & Nedelec (1979) as 4.5 ns, while the radiation lifetime is calculated to be 101.7 ns (Yurchenko et al., 2018b). The reduced lifetime affects the line broadening of the corresponding transitions and therefore is an important factor in retrievals of AlH abundance from stellar spectra, as was recently demonstrated by Pavlenko et al. (2022).
Cases where predissociation effects are included in this lifetime will be marked by a new flag, prediss, included in the .def file; prediss will default to 0 (none) and be set to 1 when the effects are present.
In principle, the natural lifetime provides a contribution to the line profile which sits alongside the temperature-dependent effects of Doppler broadening and pressure-dependent collisional broadening. In practice, the natural lifetime usually makes a minimal contribution to the line profile and is thus neglected. For predissociating states this is no longer the case. However, including the effect of lifetime broadening within a standard Voigt profile is straightforward. Lifetime broadening leads to a Lorentzian line shape like pressure broadening where , the half-width in cm-1 due lifetime broadening, is given by
| (1) |
This half-width can simply be added to the pressure-broadening half-width, , to give the total Lorentzian component of the line profile. Given that a Voigt profile is already being used, this has little computational impact on a calculation which suggests that routine use of for half-width would avoid the need to worry about whether predissociation needs to be considered or not. To this end, for states with non-negligible predissociative lifetimes, the radiative values of in the ExoMol States files will be replaced by . In the example of the , , A state of 27AlH, the ExoMol value s can be replaced by the experimental value s (Baltayan & Nedelec, 1979), otherwise calculated values will be used.
3.2 Continuum absorption
Both continuum absorption and photodissociation need to be represented as cross sections rather than lines as they are continuum processes. However, in our proposed data model continuum absorption will be represented as a function of wavenumber (cm-1) to retain consistency with the line spectra, while photodissication cross sections will be stored as function of wavelength (nm).
When considering photoabsorption by molecules to states lying above the dissociation limit, the spectrum can be thought of broadly dividing into two classes: line spectra comprising what looks like sharp bound-bound transitions, and absorption directly into the continuum. Predissociation spectra form an intermediate between these two cases and, as discussed above, will be treated as line spectra. The line spectra can be represented using the form of the standard line lists (line positions, Einstein A coefficients, lower/upper state energies and other state descriptions), as captured by the .states and .trans files. However, the bound-continuum photoabsorption is best represented as temperature-dependent photo-absorption cross-sections. These continuum photoabsorption cross sections, whose data specification is given below, will be stored as part of the standard line list data base as separate files for each isotopologue. The temperature-dependent photoabsorption spectrum is then obtained by adding the appropriate line and continuum cross-sections using software such as ExoCross (Yurchenko et al., 2018a) or PyExoCross (Zhang et al., 2023).
Continuum molecular absorption due to collision induced absorption (CIA) (Richard et al., 2012; Karman et al., 2019) is already routinely considered as part of astronomical models; it has also been recently recommended that absorption due to the so-called ‘water continuum’ be considered in model atmospheres for water-rich exoplanets (Anisman et al., 2022).
The data model we propose for including continuum absorption due to simply photoabsorption into continuum states is given in Table 5. Again these cross-sections will be temperature dependent but, unlike CIA and the water continuum, it is probably safe to assume that this continuum is not strongly pressure dependent. The presence of a continuum absorption contribution to the photoabsorption will be indicated by a new flag, continuum, included in the .def file; continuum will default to 0 (none) and be set to 1 when the effects are present.
We note that our proposal involves providing photodissociation data on a wavelength grid (in nm) while continuum absorption cross sections will be provided on a wavenumber grid (in cm-1). This latter choice ties in closely with line lists which already prove transitions wavenumber (in cm-1). The data structure of continuum absorption cross sections is presented in Table 5. The file names have the
following structure:
'<ISO-SLUG>__<DSNAME>__<RANGE>__T<TEMP>K__P<PRESSURE>bar__<STEP>.cont',
where ISO-SLUG is the iso-slug molecule name (Tennyson et al., 2020), DSNAME is the name of the line list, RANGE is the wavenumber range in cm-1, TEMP is the temperature in K, PRESSURE is the pressure in bar, STEP is the wavenumber step in cm-1.
| Field | Fortran Format | C Format | Description |
|---|---|---|---|
| F12.6 | %12.6f | Central bin wavenumber, cm-1 | |
| ES14.8 | %14.8e | Absorption cross section, |
Fortran format: (F12.6,1x,ES14.8)
3.3 Photodissociation
Photodissociation cross sections are separated from the line list and form a distinct section in the ExoMol database. At present this section contains calculated cross sections for HCl and HF (Pezzella et al., 2022) and measured cross sections for CO, H2O, CO2, SO2, NH3, H2CO and C2H4 due to Fateev et al. (2023) and CO2 due to Venot et al. (2018). The immediate plan is also to add temperature-dependent cross sections due to Qin and co-workers who have performed photodissociation calculations on MgO (Bai et al., 2021), AlH (Qin et al., 2021), AlCl (Qin et al., 2021), AlF (Qin et al., 2022a) and O2 (Hu et al., 2023), as well as HF and HCl (Qin et al., 2022b). In due course a structure of photodissociation .pdef files will be implemented to aid the navigation of this section of the database.
As the photodissociation cross sections form a distinct part of the ExoMol database, we have added a new photodissociation definition file (.pdef) file to the data structure; the proposed format of this file is given in Table 6. This gives the necessary metadata to access and interpret the recommended photodissociation cross sections. The information section mirror those given in the .def for the same system. For completeness we have added two more flags to the master file, line and photo, which define whether the line spectra and photodissociation cross sections are present (=1) or not (=0). The default values are line=1 and photo=0 which aligns with structure of previous master files which assumed all data was in the form of a line list.
A file structure for photodissociation was already proposed by Pezzella et al. (2022); however, this is updated and extended here to align with the one proposed for VUV spectra
in Tennyson et al. (2020); Table 7 gives the formal specification of the file
structure. As a file naming convention we adopt the following:
'<ISO-SLUG>__<DSNAME>__<RANGE>__T<TEMP>K__P<PRESSURE>bar__<STEP>.photo',
where ISO-SLUG is the iso-slug molecule name, DSNAME is the name of the line list, RANGE is the wavelength range in nm, TEMP is the temperature in K, PRESSURE is the pressure in bar, STEP is the wavelength step in nm. For example, the states file of the photodissociation cross sections for HF the filename: 1H-19F__PTY__90.0-400.1__T200K__P0bar__0.1.nm, see Table 8.
Pezzella et al. (2022) found that their cross sections depended strongly on the temperature of the molecule and proposed presenting these data for 34 temperatures between and K. This data model implicitly assumes that the molecule is in local thermodynamic equilibrium (LTE). We discuss issues with treating non-LTE effects and other issues with this data model in the next section. These data are all implicitly at zero pressure as pressure broadening effects are neglected. Data from other sources will have different temperature and pressure grids.
| Field | Fortran Format | C Format | Description |
|---|---|---|---|
| Header Information | |||
| ID | A11 | %11s | Always the ASCII string “EXOMOL.pdef” |
| IsoFormula | A27 | %27s | Isotopologue chemical formula |
| Iso-slug | A160 | %160s | Isotopologue identifier, see text for details |
| DSName | A10 | %10s | Isotopologue dataset name |
| I8 | %8d | Version number with format YYYYMMDD | |
| MolKey | A27 | %27s | Standard inchi key of the molecule |
| I4 | %4d | Number of atoms | |
| Atom definition (The following 2 lines occur times) | |||
| I3 | %3d | Isotope number | |
| Atom | A3 | %3s | Element symbol |
| Isotopologue Information | |||
| F12.6,1X,ES14.8 | %12.6f %14.8e | Isotopologue mass in Da and kg | |
| A6 | %6s | Molecular symmetry Group (if then C or D) | |
| I4 | %4d | Number of irreducible representations | |
| ExoMol Information | |||
| FileType | A27 | %27s | Data source: ExoMol, Expt., etc. |
| F8.2 | %8.2f | Maximum temperature for cross sections | |
| I3 | No. of temperatures available | ||
| I3 | No. of pressures available | ||
| Field | Fortran Format | C Format | Description |
|---|---|---|---|
| F10.3 | %10.3f | Central bin wavelength, nm | |
| ES13.6 | %13.6e | Photodissociation cross section, |
Fortran format: (F10.3,1x,ES13.6)
| 90.00 | 4.48427452E-19 |
| 90.10 | 4.50720456E-19 |
| 90.20 | 4.52964494E-19 |
| 90.30 | 4.55158741E-19 |
| 90.40 | 4.57293432E-19 |
| 90.50 | 4.59377114E-19 |
| 90.60 | 4.62624329E-19 |
| 90.70 | 1.68471832E-18 |
: Central bin wavelength, nm;
: Photodissociation cross section, .
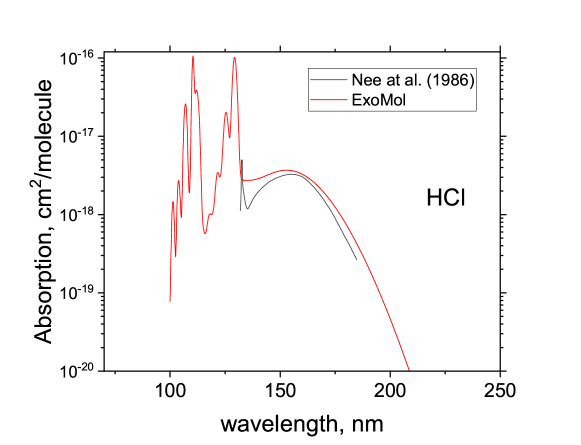
Experimental cross sections of molecules covering the VUV region has been curated by the MPI-Mainz UV/VIS Spectral Atlas (Keller-Rudek et al., 2013) using a similar, wavelength (in nm) format. In Fig. 4, we illustrate photodissocitasion cross sections of HCl from ExoMol (Pezzella et al., 2022) and by Nee et al. (1986) at room temperature as provided by the MPI-Mainz UV/VIS Atlas.
4 Omissions from the updated data model
The assumption of LTE for a molecule undergoing photodissociation may not be valid in all cases. Our method of calculating these cross sections does indeed involve computing the initial/final-state dependent data which would be required for a non-LTE representation of photodissociation. However, given that even for diatomic molecules a large number of initial states have to be considered, even considering the vibronic states only, the volume of these data is large. As yet no-one has asked us for non-LTE photodissociation cross sections so at present we do not propose including them in the standard data distribution; if they are required they can be obtained from the present authors. Examples of the state-dependent non-LTE cross sections include the continuous opacities of CH and OH provided by Kurucz et al. (1987) as well as the CH data produced by Popa et al. (2022) and used in their non-LTE analysis of CH in metal-poor stellar atmospheres.
Another issue with our data model for photodissociation is that at present it provides no information of dissociation products. In comparison with the Leiden database (Heays et al., 2017), which provides low-temperature photodissociation cross sections for molecules of astrophysical interest, gives the dissociation products which are given at the threshold to photodissociation but does not provide information on other possible photodissociation products as they may arise at shorter wavelengths. Although our methodology is capable of providing the partial cross sections (or branching ratios) associated with dissociation to different products, so far our models have not been constructed to produce these data. While the initial step in photodissociation generally involves dipole allowed transition to an electronically excited state, the subsequent dissociation step may involve crossings to states which cannot be reached by dipole transitions from the ground state such as ones with different spin multiplicity. Allowing for these extra states represents a significant complication in the calculation and again, so far, no one has asked for these data. However, should these partial cross sections be needed it would be relatively simple to extend our proposed data model to accommodate them; we note that the International Atomic Energy Agency’s CollisionDB database (Hill, 2023; Hill et al., 2023a) already used PyValem to address this issue in collision cross sections.
5 Conclusion
The present research note sets out how we propose to extend the current ExoMol data model to accommodate photoabsorption processes which occur at shorter wavelengths where the possibility of either direct or indirect absorption into the continuum can occur. Broadly these processes are classified as predissociation, continuum absorption and photodissociation contribution to the opacity. While both predissociation and continuum absorption can be accommodated by generalising our current line; a new branch starting form a photodissociation definition file has been added for the photodissociation cross sections.
Given that these various processes considered are not mutually exclusive as, for example, photodissociation also provides a contribution to the opacity, some care is required in defining data structures to facilitate the use of our extended data. We believe our proposals satisfy this requirement but that further expansion will be required to allow for pressure-dependent continuum absorption, photodissociation of molecules not in LTE, or to account for the possibility that photodissociation might result in creation of a variety of different photodissociation products.
Acknowledgements
We thank Ahmed Al-Refaie, Richard Freedman, Christian Hill, Roxana Lupu, Zhi Qin, Olivia Venot and Ingo Waldmann for helpful discussions on the topic of this work. This work was supported by the European Research Council under Advanced Investigator Project 883830.
Data Availability
The data discussed in this article is available from the ExoMol database which can be accessed at www.exomol.com.
References
- Anisman et al. (2022) Anisman, L., Chubb, K. L., Elsey, J., Al-Refaie, A., Changeat, Q., Yurchenko, S. N., Tennyson, J., & Tinetti, G., 2022. Cross-sections for heavy atmospheres: H2O continuum, J. Quant. Spectrosc. Radiat. Transf., 278, 108013.
- Bai et al. (2021) Bai, T., Qin, Z., & Liu, L., 2021. Rovibrationally resolved direct photodissociation of MgO, MNRAS, 505, 2177–2185.
- Baltayan & Nedelec (1979) Baltayan, P. & Nedelec, O., 1979. Lifetimes and predissociation in AlH (AlD) A , J. Chem. Phys., 70, 2399–2403.
- Bowesman et al. (2021) Bowesman, C. A., Shuai, M., Yurchenko, S. N., & Tennyson, J., 2021. A high resolution line list for AlO, MNRAS, 508, 3181–3193.
- Fateev et al. (2023) Fateev, A., Clausen, S., Wang, Y., Owens, A., Tennyson, J., & Yurchenko, S. N., 2023. Experimental VUV cross sections of molecules: ExoMol database update, J. Quant. Spectrosc. Radiat. Transf..
- Gérard et al. (2022) Gérard, J.-C., Soret, L., Lee, R., Ajello, J., Evans, J. S., Schneider, N., & Jain, S., 2022. The CO Cameron bands in the Mars dayglow and aurora:consequences of revised cross sections, in European Planetary Science Congress, pp. EPSC2022–260.
- Gorman et al. (2019) Gorman, M., Yurchenko, S. N., & Tennyson, J., 2019. ExoMol Molecular linelists – XXXVI. – and – transitions of SH, MNRAS, 490, 1652–1665.
- Hargreaves et al. (2019) Hargreaves, R. J., Gordon, I. E., Rothman, L. S., Tashkun, S. A., Perevalov, V. I., Lukashevskaya, A. A., Yurchenko, S. N., Tennyson, J., & Müller, H. S. P., 2019. Spectroscopic line parameters of NO, NO2, and N2O for the HITEMP database, J. Quant. Spectrosc. Radiat. Transf., 232, 35 – 53.
- Heays et al. (2017) Heays, A.-N., Bosman, A.-D., & van Dishoeck, E.-F., 2017. Photodissociation and photoionisation of atoms and molecules of astrophysical interest, A&A, 602, A105/1–62.
- Hill (2023) Hill, C., 2023. CollisionDB, a database of plasma collisional processes, https://db-amdis.org/collisiondb, Published by the Atomic and Molecular Data Unit at the IAEA.
- Hill & Hanicinec (2022) Hill, C. & Hanicinec, M., 2022. A Python package for managing simple chemical species and states, https://github.com/xnx/pyvalem, version 2.5.12.
- Hill et al. (2023a) Hill, C., , Dipti, Asztalos, O., Pokol, G., & Hanicinec, M., 2023a. CollisionDB: A new database of atomic and molecular collisional processes with an interactive API, Physica Scripta, Manuscript in preparation.
- Hill et al. (2023b) Hill, C., , Dipti, Hanicinec, M., & et al., 2023b. PyValem: a machine-readable notation and Python library for atomic and molecular structures and states, Physica Scripta, Manuscript in preparation.
- Hu et al. (2023) Hu, P., Qin, Z., & Bai, T., 2023. A theoretical study of temperature-dependent photodissociation cross sections and rates for molecular oxygen, ApJS.
- Huang et al. (2021) Huang, X., Schwenke, D. W., & Lee, T. J., 2021. What it takes to compute highly accurate rovibrational line lists for use in astrochemistry, Acc. Chem. Res., 54, 1311–1321.
- Karman et al. (2019) Karman, T., Gordon, I. E., van der Avoird, A., Baranov, Y. I., Boulet, C., Drouin, B. J., Groenenboom, G. C., Gustafsson, M., Hartmann, J.-M., Kurucz, R. L., Rothman, L. S., Sun, K., Sung, K., Thalman, R., Tran, H., Wishnow, E. H., Wordsworth, R., Vigasin, A. A., Volkamer, R., & van der Zande, W. J., 2019. Update of the hitran collision-induced absorption section, Icarus, 328, 160–175.
- Keller-Rudek et al. (2013) Keller-Rudek, H., Moortgat, G. K., Sander, R., & Sörensen, R., 2013. The MPI-Mainz UV/VIS Spectral Atlas of Gaseous Molecules of Atmospheric Interest, Earth Syst. Sci. Data, 5(2), 365–373.
- Kurucz et al. (1987) Kurucz, R. L., van Dishoeck, E. F., & Tarafdar, S. P., 1987. OH and CH Continuous Opacity in Solar and Stellar Atmospheres, ApJ, 322, 992–998.
- Lupu et al. (2011) Lupu, R. E., Feldman, P. D., McCandliss, S. R., & Strobel, D. F., 2011. Observations and modeling of h2 fluorescence with partial frequency redistribution in giant planet atmospheres, ApJ, 732, 37.
- McKemmish et al. (2023) McKemmish, L. K., Syme, A. M., Bowesman, C. A., Kefela, K., Yurchenko, S. N., & Tennyson, J., 2023. A combined approach to generating line lists for high accuracy studies of exoplanets and other hot astronomical objects, RASTI, (in preparation).
- Nee et al. (1986) Nee, J. B., Suto, M., & Lee, L. C., 1986. Quantitative photoabsorption and fluorescence study of hcl in vacuum ultraviolet, J. Chem. Phys., 85, 719–724.
- Owens et al. (2022) Owens, A., Dooley, S., McLaughlin, L., Tan, B., Zhang, G., Yurchenko, S. N., & Tennyson, J., 2022. ExoMol line lists – XLV. Rovibronic molecular line lists of calcium monohydride (CaH) and magnesium monohydride (MgH), MNRAS, 511, 5448–5461.
- Owens et al. (2023) Owens, A., He, T., Hanicinec, M., Hill, C., Mohr, S., & Tennyson, J., 2023. LiDB: Database of molecular vibronic state radiative lifetimes for plasma processes, Plasma Sources Sci. Technol., (in preparation).
- Pavlenko et al. (2022) Pavlenko, Y., Tennyson, J., Yurchenko, S. N., Jones, H. R. A., Lyubchik, Y., & Suárez Mascareño, A., 2022. Molecular bands in the blue spectra of ultracool dwarfs. A case of AlH in Proxima Cen spectrum, MNRAS, 516, 5655–5673.
- Pezzella et al. (2021) Pezzella, M., Yurchenko, S. N., & Tennyson, J., 2021. A method for calculating temperature-dependent photodissociaiton cross sections and rates, Phys. Chem. Chem. Phys., 23, 16390–16400.
- Pezzella et al. (2022) Pezzella, M., Yurchenko, S. N., & Tennyson, J., 2022. ExoMol photodissociation cross sections I – HCl and HF, MNRAS, 514, 4413–4425.
- Popa et al. (2022) Popa, S. A., Hoppe, R., Bergemann, M., Hansen, C. J., Plez, B., & Beers, T. C., 2022. Nlte analysis of the methylidyne radical (ch) molecular lines in metal-poor stellar atmospheres.
- Qin et al. (2021) Qin, Z., Bai, T., & Liu, L., 2021. Temperature-dependent direct photodissociation cross sections and rates of AlCl, MNRAS, 508, 2848–2854.
- Qin et al. (2022a) Qin, Z., Bai, T., & Liu, L., 2022a. Destruction of AIF: a quantum study of its ground -state photodissociation, MNRAS, 510, 3011–3018.
- Qin et al. (2022b) Qin, Z., Bai, T., & Liu, L., 2022b. An ab initio study for the photodissociation of HCl and HF, MNRAS, 516, 550–561.
- Qin et al. (2021) Qin, Z., Bai, T., & Liu, L., 2021. Rovibrationally Resolved Photodissociation of AlH via Excited Electronic States, ApJ, 917, 87.
- Qu et al. (2021) Qu, Q., Yurchenko, S. N., & Tennyson, J., 2021. ExoMol molecular line lists – XLII: Rovibronic molecular line list for the low-lying states of NO, MNRAS, 504, 5768–5777.
- Rey et al. (2016) Rey, M., Nikitin, A. V., Babikov, Y. L., & Tyuterev, V. G., 2016. TheoReTS – an information system for theoretical spectra based on variational predictions from molecular potential energy and dipole moment surfaces, J. Mol. Spectrosc., 327, 138–158.
- Richard et al. (2012) Richard, C., Gordon, I. E., Rothman, L. S., Abel, M., Frommhold, L., Gustafsson, M., Hartmann, J. M., Hermans, C., Lafferty, W. J., Orton, G. S., Smith, K. M., & Tran, H., 2012. New section of the HITRAN database: Collision-induced absorption (CIA), J. Quant. Spectrosc. Radiat. Transf., 113, 1276–1285.
- Rothman et al. (2010) Rothman, L. S., Gordon, I. E., Barber, R. J., Dothe, H., Gamache, R. R., Goldman, A., Perevalov, V. I., Tashkun, S. A., & Tennyson, J., 2010. HITEMP, the High-Temperature Molecular Spectroscopic Database, J. Quant. Spectrosc. Radiat. Transf., 111, 2139–2150.
- Tennyson & Yurchenko (2012) Tennyson, J. & Yurchenko, S. N., 2012. ExoMol: molecular line lists for exoplanet and other atmospheres, MNRAS, 425, 21–33.
- Tennyson et al. (2013) Tennyson, J., Hill, C., & Yurchenko, S. N., 2013. Data structures for ExoMol: Molecular line lists for exoplanet and other atmospheres, in 6th international conference on atomic and molecular data and their applications ICAMDATA-2012, vol. 1545 of AIP Conference Proceedings, pp. 186–195, AIP, New York.
- Tennyson et al. (2016a) Tennyson, J., Hulme, K., Naim, O. K., & Yurchenko, S. N., 2016a. Radiative lifetimes and cooling functions for astrophysically important molecules, J. Phys. B: At. Mol. Opt. Phys., 49, 044002.
- Tennyson et al. (2016b) Tennyson, J., Yurchenko, S. N., Al-Refaie, A. F., Barton, E. J., Chubb, K. L., Coles, P. A., Diamantopoulou, S., Gorman, M. N., Hill, C., Lam, A. Z., Lodi, L., McKemmish, L. K., Na, Y., Owens, A., Polyansky, O. L., Rivlin, T., Sousa-Silva, C., Underwood, D. S., Yachmenev, A., & Zak, E., 2016b. The ExoMol database: molecular line lists for exoplanet and other hot atmospheres, J. Mol. Spectrosc., 327, 73–94.
- Tennyson et al. (2020) Tennyson, J., Yurchenko, S. N., Al-Refaie, A. F., Clark, V. H. J., Chubb, K. L., Conway, E. K., Dewan, A., Gorman, M. N., Hill, C., Lynas-Gray, A. E., Mellor, T., McKemmish, L. K., Owens, A., Polyansky, O. L., Semenov, M., Somogyi, W., Tinetti, G., Upadhyay, A., Waldmann, I., Wang, Y., Wright, S., & Yurchenko, O. P., 2020. The 2020 release of the ExoMol database: Molecular line lists for exoplanet and other hot atmospheres, J. Quant. Spectrosc. Radiat. Transf., 255, 107228.
- Venot et al. (2018) Venot, O., Bénilan, Y., Fray, N., Gazeau, M.-C., Lefèvre, F., Es-sebbar, E., Hébrard, E., Schwell, M., Bahrini, C., Montmessin, F., Lefèvre, M., & Waldmann, I. P., 2018. VUV-absorption cross section of carbon dioxide from 150 to 800 K and applications to warm exoplanetary atmospheres, A&A, 609, A34.
- Wheeler et al. (1997) Wheeler, M. D., Orr-Ewing, A. J., & Ashfold, M. N. R., 1997. Predissociation dynamics of the A(2)Sigma(+) state of SH and SD, J. Chem. Phys., 107, 7591–7600.
- Yurchenko et al. (2018a) Yurchenko, S. N., Al-Refaie, A. F., & Tennyson, J., 2018a. ExoCross: A general program for generating spectra from molecular line lists, A&A, 614, A131.
- Yurchenko et al. (2018b) Yurchenko, S. N., Williams, H., Leyland, P. C., Lodi, L., & Tennyson, J., 2018b. ExoMol line lists XXVIII: The rovibronic spectrum of AlH, MNRAS, 479, 1401–1411.
- Zhang et al. (2023) Zhang, J., Tennyson, J., & Yurchenko, S. N., 2023. PyExoCross: a Python program for generating spectra from molecular line lists, RASTI, (in preparation).