Progress on from Lattice QCD
Abstract
I review the status of lattice QCD calculations of the hadronic contributions to the muon’s anomalous magnetic moment, focussing on the hadronic vacuum polarisation contribution which dominates the uncertainty of the Standard Model prediction. This quantity exhibits a tension between recent lattice QCD results and the traditional data-driven dispersive method. I discuss the implications for the running of the electromagnetic coupling and the consistency of global fits using electroweak precision data.
1 Introduction
The anomalous magnetic moment, , of a lepton parameterises the fraction of the lepton’s interaction strength with a magnetic field due to quantum corrections. Lepton anomalous magnetic moments are sensitive probes of the Standard Model and play a pivotal role in the quest for new physics that may be able to explain the dark matter puzzle or the observed disparity between matter and antimatter. The observation of a non-zero deficit between experiment and SM prediction would be attributed to physics beyond the SM, i.e.
| (1) |
The muon anomalous magnetic moment is a particularly promising quantity due to the fact that the BSM contribution scales like , where is the lepton mass and the BSM scale. Hence, the sensitivity of is enhanced relative to by a factor . Moreover, can be measured with a precision of 0.46 ppm [1] which is much more precise than what can currently be achieved experimentally for , which would be even more sensitive.
A consensus value for the SM prediction has been reported in a 2020 White Paper by the Muon Theory Initiative.[2] The quoted overall precision of 0.37 ppm is limited by the strong interaction, notably the contributions from hadronic vacuum polarisation (HVP) and light-by-light scattering (HLbL), i.e. . By far the biggest share of the theory error (i.e. 83%) is due to while accounts for almost 17% of the uncertainty. The White Paper-recommended value for is based on the “data-driven” evaluation of the HVP contribution in terms of dispersion integrals and experimentally measured hadronic cross sections. It exhibits a sizeable tension of standard deviations with the current experimental average
| (2) |
which is tantalisingly close to the threshold required to claim a quantitative failure of the SM. Lattice QCD provides a viable alternative to the data-driven method.[3, 4, 5, 6, 7, 8, 9, 10, 11, 12, 13, 14, 15] As of today, however, only the BMW collaboration [13] has published a lattice result for the leading-order HVP contribution with similar precision compared to the data-driven method. If one were to replace in the White Paper (WP) by BMW’s estimate, the difference to the experimental average would be reduced to just , i.e.
| (3) |
At the same time, the result is in tension with the data-driven value at the level of . Clearly, this requires an independent validation. By contrast, the situation regarding the hadronic light-by-light scattering contribution is quite stable, with lattice calculations [16, 17, 18, 19] in good agreement with phenomenological estimates.[20, 21, 22, 23, 24, 25, 26, 27, 28, 29, 30, 31, 32]
2 Hadronic vacuum polarisation contribution
2.1 The data-driven approach
The standard method to determine the leading-order HVP contribution is based on the evaluation of a dispersion integral over the so-called -ratio , i.e. the normalised total hadronic cross section for , times a slowly varying kernel function :
| (4) |
Owing to the factor of in the denominator, the integral receives its main contribution from the low-energy region, in particular from the dominant channel . Since perturbation theory in the strong coupling cannot be applied near the pion threshold, one has to resort to experimental measurements of the -ratio to evaluate the integral in eq. (4), implying that the resulting theoretical prediction is subject to experimental uncertainties. Indeed, there is a long-standing tension in the dominant two-pion channel between the measurements of the KLOE [33] and BaBar [34] collaborations. The WP-recommended value takes this into account by quoting a separate systematic error in addition to the experimental error
| (5) |
which also accounts for differences in the analyses of cross-section data [35, 36, 37, 38, 39, 40] while the third quoted error is related to theoretical uncertainties. Adding the individual errors in quadrature results in a total precision of 0.6%. However, the recent measurement of the dominant two-pion channel by the CMD-3 experiment [41] has made the situation considerably more complicated: not only does it disagree with the earlier result from the predecessor experiment CMD-2 but also with all other measurements published prior to 2023. Taken at face value, the CMD-3 result is consistent with the higher estimate for suggested by lattice QCD. However, the tension among the data has increased significantly and must be understood.
2.2 The HVP contribution in lattice QCD
The lattice approach to determining differs substantially from the data-driven method. For once, lattice QCD does not compute the -ratio from first principles. Rather, the value of is obtained from the spatially summed correlator of the electromagnetic current convoluted with an analytically known function and integrated over the Euclidean time variable , i.e. [42]
| (6) |
This expression, known as the “time-momentum representation” (TMR) allows for an inclusive determination of and is not sensitive to individual hadronic channels. The integrand is shown in the left panel of Fig. 1. The evaluation of the TMR integral in lattice QCD does not rely on experimental data, except for simple input quantities such as hadron masses to set the scale and calibrate the quark masses. However, the goal of determining with sub-percent precision presents several challenges for lattice calculations. The first is related to the tail of the integrand, i.e. the region of , which contributes about 3% to the value of but is subject to strong statistical fluctuations due to the exponentially increasing statistical noise in the correlator as . The large- regime also contributes the bulk of finite-volume effects which the data must be corrected for. The region of small Euclidean distances is most sensitive to discretisation effects (“lattice artefacts”) which must be removed via a careful extrapolation to the continuum limit. This is increasingly challenging for sub-percent statistical precision, since it requires the ability to disentangle a complicated pattern of terms beyond the leading corrections in the lattice spacing.[43, 44, 45] Finally, for sub-percent precision, isospin-breaking effects arising from unequal up- and down-quark masses and electromagnetism must be accounted for.
The chosen discretisation of the quark action has a major influence on the quality and cost of lattice calculations for . Among the most widely used quark actions are rooted staggered fermions, Wilson-type quarks, and domain wall fermions. A detailed overview of different actions is presented in Appendix A.2 of the review.[46] Here we only mention that rooted staggered quarks are subject to sizeable lattice artefacts from remnant spurious degrees of freedom called “tastes”, which must be removed analytically before results are extrapolated to vanishing lattice spacing. Wilson-type quarks do not require such corrections but are not rigorously protected against the appearance of small or negative eigenvalues of the Wilson-Dirac operator, as a result of explicit chiral symmetry breaking. This not only increases the numerical cost but also makes it harder to simulate at the physical value of the pion mass. The domain wall action describes a single quark flavour and preserves chiral symmetry up to exponentially small corrections. This comes at the significant expense of having to simulate the theory on a five-dimensional lattice.
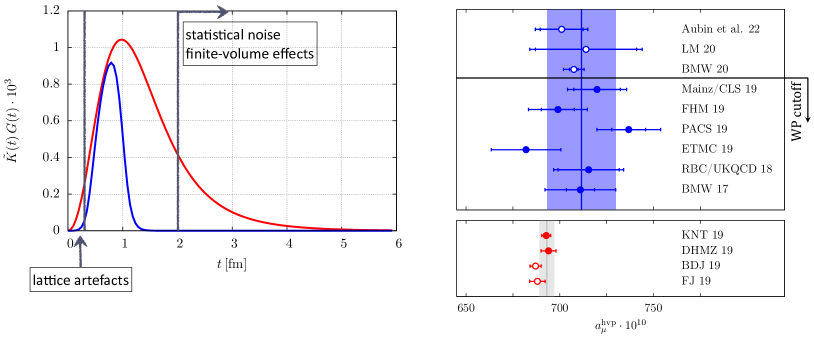
The current set of avaliable lattice results for is shown in the right upper panel of Fig. 1. The blue band represents the average of peer-reviewed, published results at the time of the release of the WP. While the central value is higher than the estimate from the data-driven method of Eq. (5), the relative uncertainty of 2.6% is larger by more than a factor four. Given that the discretisations of the quark action and and the procedures employed to produce the lattice results shown in Fig. 1 are quite different, it is remarkable and highly non-trivial that they agree at this level of precision. The result labelled RBC/UKQCD 18 [6] has been obtained on two ensembles of domain wall quarks, with lattice spacings of fm and fm, both directly at the physical pion mass. The leading isospin-breaking corrections of about 1% have been computed and added to the result before extrapolating the results to the continuum limit assuming an ansatz proportional to , augmented by an O()-term. The precision at the physical point is 2.6%. The calculation by Mainz/CLS [10] is based on a total of 15 ensembles of O()-improved Wilson fermions, covering four values of the lattice spacing between fm and pion masses in the range MeV. In order to account for the neglected isospin-breaking effects, the size of the isospin-breaking correction computed by the ETM collaboration [7] has been added to the error of the final result which has a total uncertainty of 2.2%. The BMW collaboration [13] computed using 27 ensembles of rooted staggered quarks at six values of the lattice spacing between fm, all at the physical pion mass. Several different models were applied to remove taste-induced lattice artefacts prior to performing extrapolations in the lattice spacing to the continuum limit. The final result is selected from a distribution of different fits. After correcting for strong and electromagnetic isospin-breaking effects, BMW quote a value of , which has a total precision of 0.8%, only slightly worse than that of the data-driven result. This result, when supplied for the HVP contribution rather than the estimate of Eq. (5), is responsible for the reduction of the tension between SM prediction and experimental average in Eq. (3).
2.3 Window observable
A cross-check of the BMW result with sub-percent precision can be performed by restricting the integration in the TMR integral, Eq. (6), to a subinterval which essentially removes the regions of strong statistical fluctuations, large finite-volume effects and large lattice artefacts. This is the idea behind the so-called “window observables”, first introduced by RBC/UKQCD.[6] More specifically, the “intermediate window observable” is obtained via a convolution of the TMR integrand with an additional weight function according to
| (7) |
where the smoothed step function is defined as . Choosing fm, fm and the width as fm yields the blue curve in the left panel of Fig. 1. With this choice one finds that finite-volume corrections to are reduced to just 0.25% and that the total uncertainty is dominated by statistics. This makes the intermediate window observable an ideal benchmark quantity for comparing different lattice calculations. In addition, it is possible to evaluate using the -ratio. Indeed, motivated by the procedure used to determine the WP estimate for from cross section data published prior to 2023, one finds [51]
| (8) |
The collection of lattice results for the window observable is shown in Fig. 2.
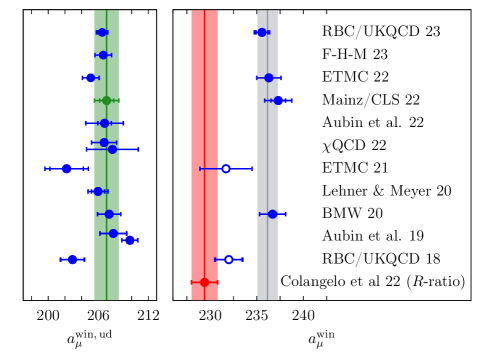
From the compilation shown in the left panel one concludes that lattice QCD produces consistent results for the dominant light-quark connected contribution for a wide range of different discretisations and with sub-percent precision. The only exceptions are the calculations labelled RBC/UKQCD 18 [6] and ETMC 21 [56] which have since been superseded by RBC/UKQCD 23 [52] and ETMC 22.[54] After adding the contributions to from strange and charm quarks, as well as quark-disconnected contributions and isospin-breaking corrections, one obtains the results shown in the right panel, which can be readily compared to the data-driven estimate of Eq. (8). One observes a clear tension between the most recent lattice estimates and the corresponding result extracted from hadronic cross sections. In order to arrive at a more quantitative statement, I have performed a global average of the results labelled BMW 20 [13], Mainz/CLS 22 [50], ETMC 22 [54] and RBC/UKQCD 23 [52] assuming that the results are 100% correlated. In this way one obtains a tentative lattice average of , which differs from Eq. (8) by , i.e.
| (9) |
Thus, there is a confirmed tension between lattice QCD and data prior to 2023 (i.e. excluding the recent CMD-3 result). It is also interesting to note that the intermediate window accounts for 50% of the tension between the -ratio estimate and the BMW result for , as can be easily seen by comparing Eqs. (2) and (3). One can go one step further and study the implications of the confirmed tension in the window observable for the SM prediction of and the direct measurement. Since the -ratio estimate for is based on the same procedure as the WP-recommended value for , I have performed the exercise of subtracting Eq. (8) from the SM prediction and replacing it by the global average of lattice results for . This reduces the discrepancy between the SM prediction and the experimental average to just over three standard deviations, i.e.
| (10) |
A more thorough and complete analysis will be presented in an update of the 2020 WP, which is currently being prepared by the Muon Theory Initiative.
Tracing the origin of the tension between lattice QCD and the data-driven approach is obviously a burning issue. One proposal [57] stresses the role of window observables defined for alternative parameter choices for and . Alternatively, attempts have been made to determine the spectral function associated with the vector correlator and compare it to the -ratio measured in annihilation.[58] It is clearly a crucial question in which energy range the two spectral functions differ. Owing to the restriction of the integration to the interval between 0.4 fm and 1.0 fm, the two-pion channel, which contributes about 70% to the value of , is less dominant in the window observable . An interesting observation in this context was made by Mainz/CLS [50] based on a phenomenological model: Namely, if the spectral function associated with were somehow enhanced by an amount in the interval MeV relative to , this would produce an enhancement of in both and . Taking the ratio of the lattice average with Eq. (8) one finds which, according to the above reasoning, implies that would be larger by about 5% compared to in the region MeV. An enhancement of this magnitude would suggest that the value of might be even larger than the estimate published by BMW.
3 Relation to the hadronic running of the electromagnetic coupling
An important consistency check can be performed for the closely related quantity which denotes the hadronic contribution to the running of the electromagnetic coupling . Like the HVP contribution to the muon , is accessible via the vector correlator . For instance, let be a given spacelike momentum transfer, then can be computed from the convolution integral [42]
| (11) |
Alternatively, one can express for some (spacelike or timelike) momentum transfer via the principal value of a dispersion integral involving the -ratio, according to
| (12) |
Mainz/CLS have compared the results from a direct lattice calculation [59] of to those from data-driven evaluations [40, 39, 61] for several fixed values of in the range between and . Indeed, for , lattice and dispersive estimates differ at the level of , in complete correspondence to the tension observed for the window observable . Interestingly, in a recent paper [60] it was found that the Adler function (which is the derivative of ), computed in massive QCD perturbation theory at four loops, shows good agreement with derived from the lattice calculation of , while there is a tension with the Adler function determined from data.
Since and are directly correlated, one might think that an enhancement of both quantities as suggested by lattice QCD would produce a tension with the prediction of the hadronic running of from global fits to electroweak precision data. To see whether this is the case, we must convert the lattice estimate for into an estimate at the pole. This can be done reliably using the “Euclidean split technique”, in which is divided into three separate contributions, according to [67]
| (13) | |||||
To determine one can use the lattice result for by Mainz/CLS at as input, while the two terms in square brackets on the right-hand side can be evaluated in QCD perturbation theory. This yields the result [59]
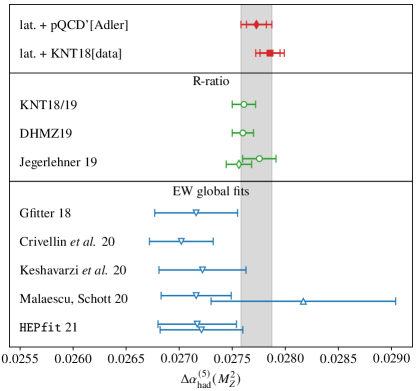
| (14) |
where the first error is the total uncertainty of the lattice calculation, the second error quantifies the neglected contribution from bottom quarks, and the third error accounts for the uncertainty of the perturbative running and matching. In Fig. 3 the above result, shown as the grey vertical band, is compared to dispersion theory and global electroweak fits. Clearly, the results are compatible within errors, which signals that larger values of and are not excluded by electroweak precision data. At first sight, the agreement of between lattice QCD and dispersion theory in Fig. 3 seems to contradict the earlier statement that a -discrepancy is observed at low Euclidean momentum transfers. However, the resolution of this apparent paradox is obtained by realising that the same running and matching factors are applied when converting at low to the corresponding estimate at the pole. The associated uncertainties in the running cancel in the correlated difference between lattice QCD and dispersion theory, thereby preserving the tension.[68]
4 Summary and outlook
An unambiguous interpretation of the new measurement of the muon by the E989 experiment at Fermilab [1] is impeded by several tensions that have been exposed since the publication of the 2020 White Paper: (1) There is a tension of between a single lattice calculation [13] and the WP-recommended value for , based on cross section data published prior to 2023; (2) There is a tension of almost between several lattice calculations [13, 50, 54, 52] and the corresponding dispersive estimate [51] based on the same data; (3) There is a tension of in the hadronic running of , as estimated by two lattice calculations [13, 59] and data; (4) There is a slight tension of in the Adler function determined from lattice and perturbative QCD on the one hand, and data on the other; (5) Finally, there is a tension of in the dominant channel between BaBar [34] and KLOE [33], as well as a tension of about between CMD-3 [41] and all other experiments. In this context, it is important to realise that a larger SM prediction for is not in contradiction with global electroweak constraints, at least at the current level of precision. Obviously, an independent cross-check of the BMW lattice result for with sub-percent precision is badly needed. Furthermore, the tension among data must be elucidated, a task for which the alternative determination of the -ratio from decays could be useful.[69] These activities are currently in progress. The Muon Theory Initiative is preparing an update of the original WP, which will thoroughly address the issues that have come to the fore since 2020.
Acknowledgments: It is a pleasure to thank the organisers for the invitation to La Thuile. I am grateful to Achim Denig, Harvey Meyer and Toni Pich for stimulating discussions, and to Aida El Khadra and Martin Hoferichter for useful comments. This work is partially supported by the Cluster of Excellence Precision Physics, Fundamental Interactions, and Structure of Matter (PRISMA+ EXC 2118/1) funded by DFG within the German Excellence Strategy (Project ID 39083149). Calculations by Mainz/CLS were performed on HPC platforms at Mainz, JSC Jülich and HLRS Stuttgart. The support of the Gauss Centre for Supercomputing (GCS) and the John von Neumann-Institut für Computing (NIC) for projects CHMZ21 and CHMZ23 at JSC and project GCS-HQCD at HLRS is gratefully acknowledged.
References
References
- [1] B. Abi et al., Phys. Rev. Lett. 126 (2021) 141801 [2104.03281].
- [2] T. Aoyama et al., Phys. Rept. 887 (2020) 1 [2006.04822].
- [3] M. Della Morte et al., JHEP 10 (2017) 020 [1705.01775].
- [4] B. Chakraborty et al., Phys. Rev. Lett. 120 (2018) 152001 [1710.11212].
- [5] S. Borsányi et al., Phys. Rev. Lett. 121 (2018) 022002 [1711.04980].
- [6] T. Blum et al., Phys. Rev. Lett. 121 (2018) 022003 [1801.07224].
- [7] D. Giusti et al., Phys. Rev. D99 (2019) 114502 [1901.10462].
- [8] E. Shintani and Y. Kuramashi, Phys. Rev. D 100 (2019) 034517 [1902.00885].
- [9] C. T. H. Davies et al., Phys. Rev. D 101 (2020) 034512 [1902.04223].
- [10] A. Gérardin et al., Phys. Rev. D100 (2019) 014510 [1904.03120].
- [11] C. Aubin et al., Phys. Rev. D101 (2020) 014503 [1905.09307].
- [12] D. Giusti and S. Simula, PoS LATTICE2019 (2019) 104 [1910.03874].
- [13] S. Borsányi et al., Nature 593 (2021) 51 [2002.12347].
- [14] C. Lehner and A. S. Meyer, Phys. Rev. D 101 (2020) 074515 [2003.04177].
- [15] C. Aubin et al., Phys. Rev. D 106 (2022) 054503 [2204.12256].
- [16] T. Blum et al. Phys. Rev. Lett. 124 (2020) 132002 [1911.08123].
- [17] E.-H. Chao et al., Eur. Phys. J. C 81 (2021) 651 [2104.02632].
- [18] E.-H. Chao et al., Eur. Phys. J. C 82 (2022) 664 [2204.08844].
- [19] T. Blum et al., 2304.04423.
- [20] K. Melnikov and A. Vainshtein, Phys. Rev. D70 (2004) 113006 [hep-ph/0312226].
- [21] P. Masjuan and P. Sánchez-Puertas, Phys. Rev. D95 (2017) 054026 [1701.05829].
- [22] G. Colangelo et al., JHEP 04 (2017) 161 [1702.07347].
- [23] M. Hoferichter et al., JHEP 10 (2018) 141 [1808.04823].
- [24] A. Gérardin et al., Phys. Rev. D100 (2019) 034520 [1903.09471].
- [25] J. Bijnens et al., Phys. Lett. B798 (2019) 134994 [1908.03331].
- [26] G. Colangelo et al., JHEP 03 (2020) 101 [1910.13432].
- [27] V. Pauk and M. Vanderhaeghen, Eur. Phys. J. C74 (2014) 3008 [1401.0832].
- [28] I. Danilkin and M. Vanderhaeghen, Phys. Rev. D95 (2017) 014019 [1611.04646].
- [29] F. Jegerlehner, Springer Tracts Mod. Phys. 274 (2017) 1.
- [30] M. Knecht et al., Phys. Lett. B787 (2018) 111 [1808.03848].
- [31] G. Eichmann et al. Phys. Rev. D101 (2020) 054015 [1910.06795].
- [32] P. Roig and P. Sánchez-Puertas, Phys. Rev. D101 (2020) 074019 [1910.02881].
- [33] A. Anastasi et al., JHEP 03 (2018) 173 [1711.03085].
- [34] J. P. Lees et al., BaBar collaboration, Phys. Rev. D 86 (2012) 032013 [1205.2228].
- [35] M. Davier et al., Eur. Phys. J. C77 (2017) 827 [1706.09436].
- [36] A. Keshavarzi et al., Phys. Rev. D97 (2018) 114025 [1802.02995].
- [37] G. Colangelo, M. Hoferichter and P. Stoffer, JHEP 02 (2019) 006 [1810.00007].
- [38] M. Hoferichter, B.-L. Hoid and B. Kubis, JHEP 08 (2019) 137 [1907.01556].
- [39] M. Davier et al., Eur. Phys. J. C80 (2020) 241 [1908.00921].
- [40] A. Keshavarzi et al., Phys. Rev. D101 (2020) 014029 [1911.00367].
- [41] F. V. Ignatov et al., 2302.08834.
- [42] D. Bernecker and H. B. Meyer, Eur. Phys. J. A47 (2011) 148 [1107.4388].
- [43] N. Husung, P. Marquard and R. Sommer, Eur. Phys. J. C 80 (2020) 200 [1912.08498].
- [44] M. Cè et at., JHEP 12 (2021) 215 [2106.15293].
- [45] N. Husung, Eur. Phys. J. C 83 (2023) 142 [2206.03536].
- [46] H. B. Meyer and H. Wittig, Prog. Part. Nucl. Phys. 104 (2019) 46 [1807.09370].
- [47] C. T. H. Davies et al., Phys. Rev. D101 (2020) 034512 [1902.04223].
- [48] M. Benayoun et al., Eur. Phys. J. C 80 (2020) 81 [1903.11034].
- [49] F. Jegerlehner, EPJ Web Conf. 166 (2018) 00022 [1705.00263].
- [50] M. Cè et al., Phys. Rev. D 106 (2022) 114502 [2206.06582].
- [51] G. Colangelo et al., Phys. Lett. B 833 (2022) 137313 [2205.12963].
- [52] T. Blum et al., 2301.08696.
- [53] A. Bazavov et al., 2301.08274.
- [54] C. Alexandrou et al., Phys. Rev. D 107 (2023) 074506 [2206.15084].
- [55] G. Wang et al., Phys. Rev. D 107 (2023) 034513 [2204.01280].
- [56] D. Giusti and S. Simula, PoS LATTICE2021 (2022) 189 [2111.15329].
- [57] C. T. H. Davies et al., Phys. Rev. D 106 (2022) 074509 [2207.04765].
- [58] C. Alexandrou et al., 2212.08467.
- [59] M. Cè et al., JHEP 08 (2022) 220 [2203.08676].
- [60] M. Davier et al., JHEP 04 (2023) 067 [2302.01359].
- [61] F. Jegerlehner, CERN Yellow Reports: Monographs 3 (2020) 9.
- [62] A. Crivellin et al., Phys. Rev. Lett. 125 (2020) 091801 [2003.04886].
- [63] A. Keshavarzi et al., Phys. Rev. D 102 (2020) 033002 [2006.12666].
- [64] B. Malaescu and M. Schott, Eur. Phys. J. C 81 (2021) 46 [2008.08107].
- [65] J. Haller et al., Eur. Phys. J. C 78 (2018) 675 [1803.01853].
- [66] J. de Blas et al., Phys. Rev. D 106 (2022) 033003 [2112.07274].
- [67] F. Jegerlehner, Nucl. Phys. B Proc. Suppl. 181-182 (2008) 135 [0807.4206].
- [68] M. T. San José Pérez et al., PoS LATTICE2022 (2023) 328 [2212.02366].
- [69] P. Masjuan, A. Miranda and P. Roig, 2305.20005.