Multimodal Fusion Interactions: A Study of Human and Automatic Quantification
Multimodal Fusion Interactions:
A Study of Human and Automatic Quantification
Abstract.
In order to perform multimodal fusion of heterogeneous signals, we need to understand their interactions: how each modality individually provides information useful for a task and how this information changes in the presence of other modalities. In this paper, we perform a comparative study of how humans annotate two categorizations of multimodal interactions: (1) partial labels, where different annotators annotate the label given the first, second, and both modalities, and (2) counterfactual labels, where the same annotator annotates the label given the first modality before asking them to explicitly reason about how their answer changes when given the second. We further propose an alternative taxonomy based on (3) information decomposition, where annotators annotate the degrees of redundancy: the extent to which modalities individually and together give the same predictions, uniqueness: the extent to which one modality enables a prediction that the other does not, and synergy: the extent to which both modalities enable one to make a prediction that one would not otherwise make using individual modalities. Through experiments and annotations, we highlight several opportunities and limitations of each approach and propose a method to automatically convert annotations of partial and counterfactual labels to information decomposition, yielding an accurate and efficient method for quantifying multimodal interactions.
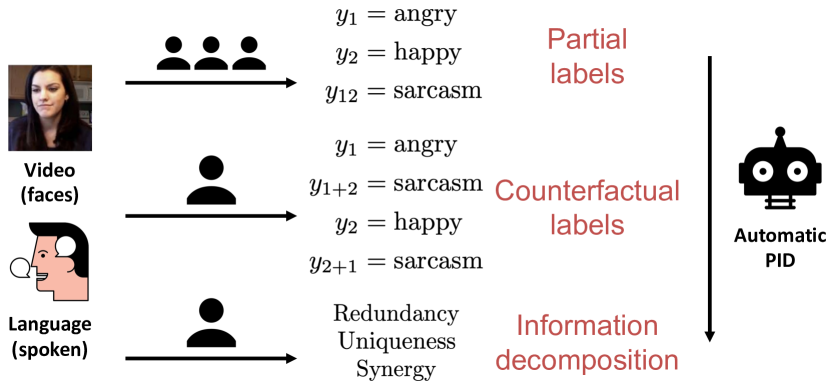
[Overview of human annotation schemes]We study human annotation of multimodal fusion interactions via three categorizations: (1) partial labels in which different randomly assigned annotators annotate the task given the first, second, and both modalities, (2) counterfactual labels, where the same annotator is tasked to annotate the label given the first modality, before asking them to reason about how their answer chances when given the second, and vice versa, and (3) information decomposition where annotators annotate the degrees of modality redundancy, uniqueness, and synergy in predicting the task.
1. Introduction
A core challenge in multimodal machine learning lies in understanding the ways that different modalities interact with each other in combination for a given prediction task (Liang et al., 2022). We define the study of multimodal fusion interactions as the categorization and measurement of how each modality individually provides information useful for a task and how this information changes in the presence of other modalities (Provost et al., 2015; D’mello and Kory, 2015; Pantic et al., 2005). Learning complex interactions are often quoted as motivation for many successful multimodal modeling paradigms in the machine learning and multimodal interaction communities, such as contrastive learning (Radford et al., 2021; Kim et al., 2021), modality-specific representations (Tsai et al., 2019; Yuan et al., 2021), and higher-order interactions (Zadeh et al., 2017; Liang et al., 2018; Jayakumar et al., 2020). Despite progress in new models that seem to better capture various interactions from increasingly complex real-world multimodal datasets (Zadeh et al., 2017; Jayakumar et al., 2020), formally quantifying and measuring the interactions that are necessary to solve a multimodal task remains a fundamental research question (Liang et al., 2022; Liang et al., 2023c; Hessel and Lee, 2020).
In this paper, we perform a comparative study of how reliably human annotators can be leveraged to quantify different interactions in real-world multimodal datasets (see Figure 1). We first start with a conventional method which we term partial labels, where different randomly assigned annotators annotate the task given only the first modality (), only the second modality (), and both modalities () (Provost et al., 2015; D’mello and Kory, 2015; Pantic et al., 2005; Ruiz et al., 2006). Beyond partial labels, we extend this idea to counterfactual labels, where the same annotator is tasked to annotate the label given the first modality (), before giving them the second modality and asking them to explicitly reason about how their answer changes (), and vice versa ( and ) (Soleymani et al., 2011). Additionally, we propose an alternative taxonomy of multimodal interactions grounded in information theory (Williams and Beer, 2010; Liang et al., 2023a), which we call information decomposition: decomposing the total information two modalities provide about a task into redundancy, the extent to which individual modalities and both in combination all give similar predictions on the task, uniqueness, the extent to which the prediction depends only on one of the modalities and not the other, and synergy, the extent to which task prediction changes with both modalities as compared to using either modality individually (Williams and Beer, 2010; Liang et al., 2023a). Information decomposition has an established history in understanding feature interactions in neuroscience (Timme et al., 2016; Wibral et al., 2017; Pica et al., 2017; Wibral et al., 2015), physics (Flecker et al., 2011; Harder et al., 2013), and biology (Colenbier et al., 2020; Chan et al., 2017) since it exhibits desirable properties such as disentangling redundancy and synergy, normalization with respect to the total information two features provide towards a task, and established methods for automatic computation.
However, it remains a challenge to scale information decomposition to real-world high-dimensional and continuous modalities (Liang et al., 2023a, b; Bertschinger et al., 2014), which has hindered its application in machine learning and multimodal interaction where complex video, audio, text, and other sensory modalities are prevalent. To quantify information decomposition for real-world multimodal tasks, we propose a new human annotation scheme where annotators provide estimates of redundancy, uniqueness, and synergy when presented with both modalities and the label. We find that this method works surprisingly well with strong annotator agreement and self-reported annotator confidence. Finally, given the promises of information decomposition (Liang et al., 2023a; Jayakumar et al., 2020; D’Mello et al., 2018), we additionally propose a scheme to automatically convert annotations of partial and counterfactual labels to information decomposition using an information-theoretic method (Williams and Beer, 2010; Bertschinger et al., 2014), which makes it compatible with existing methods of annotating interactions (Provost et al., 2015; D’mello and Kory, 2015; Pantic et al., 2005; Ruiz et al., 2006). Through comprehensive experiments on multimodal analysis of sentiment, humor, sarcasm, and question-answering, we compare these methods of quantifying multimodal interactions and summarize our key findings. We release our data and code at https://github.com/pliang279/PID.
2. Related Work
Multimodal fusion interactions have been studied based on the dimensions of response, information, and mechanics (Liang et al., 2022). We define and highlight representative works in each category:
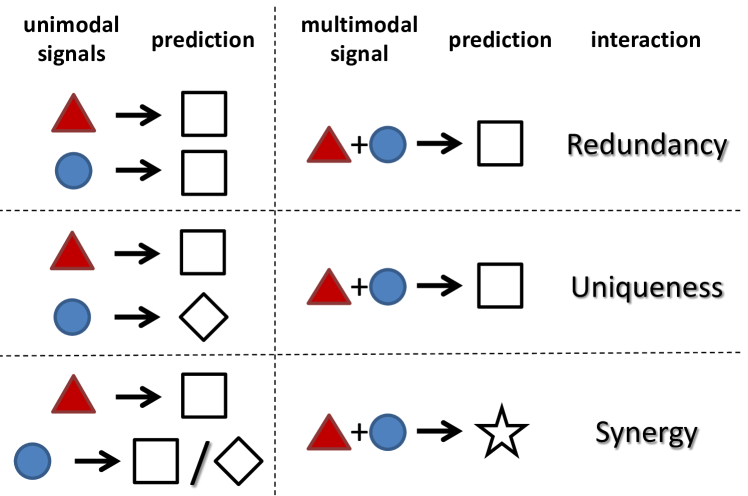
[Definitions of multimodal interactions]Categories of interaction response: redundancy happens when using either and both modalities give similar task predictions, uniqueness studies whether prediction depends on one of the modalities and not the other, and synergy measures how prediction changes with both modalities as compared to using either modality individually.
Interaction response studies how the inferred response changes when two or more modalities are fused (Liang et al., 2022) (see Figure 2). For example, two modalities create a redundant response if the fused response is the same as responses from either modality or enhanced if the fused response displays higher confidence. Non-redundant interactions such as modulation or emergence can also happen (Partan and Marler, 1999). Many of these terms actually started from research in human and animal communicative modalities (Partan and Marler, 1999, 2005; Flom and Bahrick, 2007; Ruiz et al., 2006) and multimedia (Bateman, 2014; Marsh and Domas White, 2003). Inspired by these ideas, a common measure of interaction response redundancy is defined as the distance between prediction logits using either feature (Mazzetto et al., 2021). This definition is also commonly used in minimum-redundancy feature selection (Yu and Liu, 2003, 2004; Auffarth et al., 2010). Research in multimedia has also categorized interactions into divergent, parallel, and additive (Bateman, 2014; Kruk et al., 2019; Zhang et al., 2018). Finally, human annotations have been leveraged to identify redundant modalities via a proxy of cognitive load (Ruiz et al., 2006). This paper primarily focuses on interaction response since it is the one easiest understood and annotated by humans, but coming up with formal definitions and measures of other interactions are critical directions for future work.
Interaction information investigates the nature of information overlap between multiple modalities. The information important for a task can be shared in both modalities, unique to one modality, or emerge only when both are present (Liang et al., 2022). Information-theoretic measures naturally provide a mathematical formalism in the study of interaction information, for example through the mutual information between two variables (Tosh et al., 2021; Tian et al., 2020). In the presence of two modalities and a label, extensions of mutual information to three variables, such as through total correlation (Watanabe, 1960; Garner, 1962) interaction information (McGill, 1954; Te Sun, 1980), or partial information decomposition (Williams and Beer, 2010; Bertschinger et al., 2014) have been proposed, and recent work has explored their estimation on large-scale real-world multimodal datasets (Liang et al., 2023b, a). From a semantic perspective, research in multimedia has studied various relationships that can exist between images and text (Otto et al., 2020; Marsh and Domas White, 2003), which has also inspired work in representing shared information through contrastive learning (Radford et al., 2021). While interaction information and response are naturally related, interaction response can be more fine-grained with respect to individual datapoints.
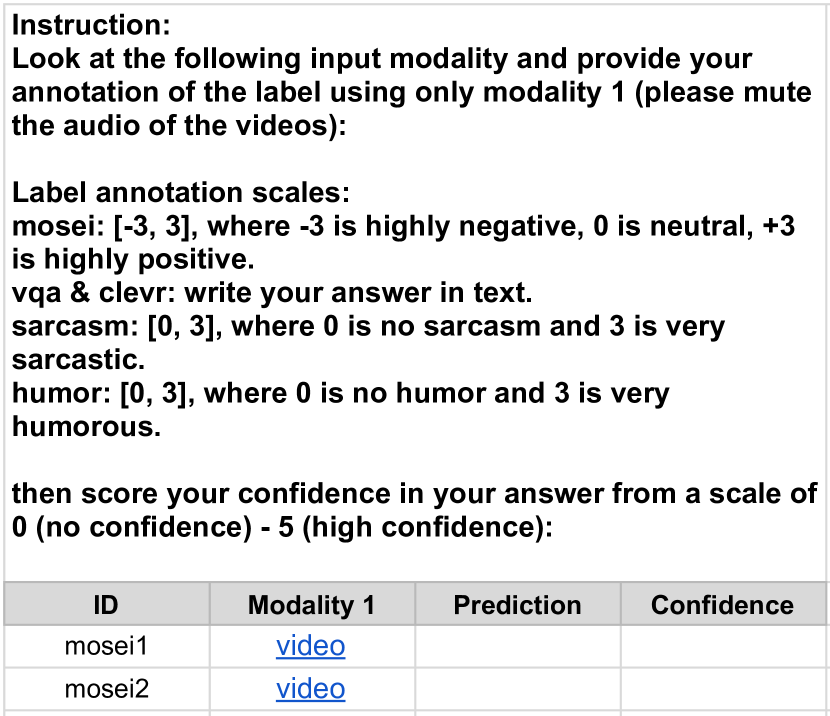
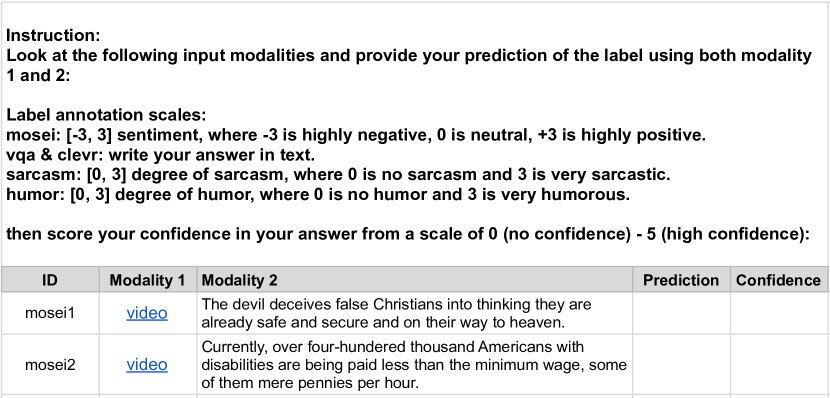
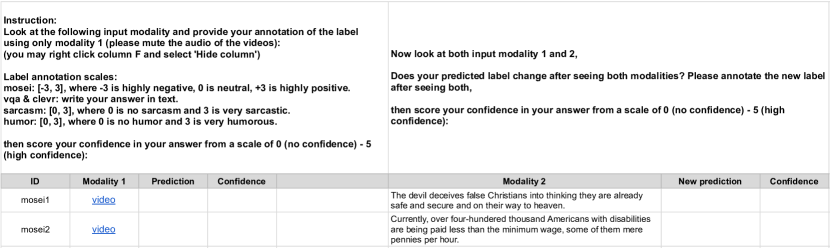
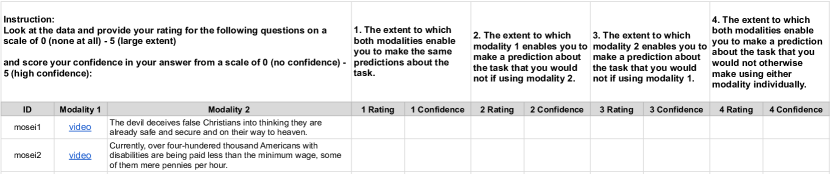
[Screenshots of user annotation interfaces]We show sample user interfaces for annotating partial labels for video and language modalities, counterfactual labels for how the label changes from observing the video modality and then language, and for annotating information decomposition of redundancy, uniqueness, and synergy.
Finally, the study of interaction mechanics studies how mathematical operators can be used to capture interactions during multimodal fusion. For example, interaction mechanics can be expressed as additive (Friedman and Popescu, 2008), multiplicative (Jayakumar et al., 2020), tensor (Zadeh et al., 2017), non-linear (Ngiam et al., 2011), and recurrent (Liang et al., 2018) forms, as well as logical, causal, or temporal operations (Unsworth and Cléirigh, 2014). By making assumptions on a specific functional form of interactions (e.g., additive vs non-additive), prior work has been able to quantify their presence or absence (Sorokina et al., 2008; Tsang et al., 2018, 2019) in real-world multimodal datasets and models through studies of architecture-specific attention and parameter weights , model-agnostic gradient-based visualizations (Lyu et al., 2022; Wang et al., 2021; Liang et al., 2023c), and projections into simpler models (Hessel and Lee, 2020; Wörtwein et al., 2022).
3. Annotating Multimodal Interactions
In order to study interaction response during multimodal fusion, we first review the estimation of partial labels via random assignment, before discussing an alternative approach through counterfactual labels. Finally, we motivate information decomposition into redundancy, uniqueness, and synergy, which offers a different perspective and new benefits for studying multimodal interactions.
3.1. Annotating partial labels
The standard approach involves tasking randomly assigned annotators to label their prediction of the label when presented with only the first modality (), the label when presented with only the second modality (), and the label when presented with both modalities () (Provost et al., 2015; D’mello and Kory, 2015; Pantic et al., 2005). Annotators are typically randomly assigned to each modality so that their labeling process is not influenced by observing other modalities, resulting in independently annotated partial labels. In this setup, the instructions given are:
-
(1)
: Show modality 1, and ask the annotator to predict the label.
-
(2)
: To another annotator, show only modality 2, and ask the annotator to predict the label.
-
(3)
: To yet another annotator, show both modalities, and ask the annotator to predict the label.
After reporting each partial label, the annotators are also asked to report confidence on a 0-5 scale (0: no confidence, 5: high confidence). We show a screenshot of a sample user interface in Figure 3 (top) and provide more annotation details in Appendix A.1.
3.2. Annotating counterfactual labels
As another alternative to random assignment, we draw insight from counterfactual estimation where the same annotator annotates the label given a single modality, before giving them the second modality and asking them to reason about how their answer changes. The instructions provided to the first annotator are:
-
(1)
: Show modality 1, and ask them to predict the label.
-
(2)
: Now show both modalities and ask if their predicted label explicitly changes after seeing both modalities.
To a separate annotator, we provide the following instructions:
-
(1)
: Show modality 2, and ask them to predict the label.
-
(2)
: Now show both modalities and ask if their predicted label explicitly changes after seeing both modalities.
The annotators also report confidence on a 0-5 scale (see sample user interface in Figure 3 (middle) and exact annotation procedures in Appendix A.2). While the first method by random assignment estimates the average effect of each modality on the label as is commonly done in randomized control trials (Benson and Hartz, 2000) (since estimates of partial labels for each modality are done separately in expectation over all users), this counterfactual approach measures the actual causal effect of seeing the second modality towards the label for the same user (Kaushik et al., 2019; Abbasnejad et al., 2020; Goyal et al., 2019).
3.3. Annotating information decomposition
Finally, we propose an alternative categorization of multimodal interactions based on information theory, which we call information decomposition: decomposing the total information two modalities provide about a task into redundancy, the extent to which individual modalities and both in combination all give similar predictions on the task, uniqueness, the extent to which the prediction depends only on one of the modalities and not the other, or synergy, the extent to which task prediction changes with both modalities as compared to using either modality individually (Williams and Beer, 2010; Liang et al., 2023a).
This view of interactions is useful since it has a formal grounding in information theory (Shannon, 1948) and information decomposition (Williams and Beer, 2010). Information theory formalizes the amount of information that a variable () provides about another (), and is quantified by Shannon’s mutual information (MI):
| (1) |
which measures the amount of information (in bits) obtained about by observing . By extension, conditional MI is the expected value of the MI of two random variables (e.g., and ) given the value of a third (e.g., ):
| (2) |
3.3.1. Multivariate information theory
While information theory works well in two variables, the extension of information theory to measure redundancy and other interactions requires its extension to three or more variables, which remains an open challenge. The most natural extension, through interaction information (McGill, 1954; Te Sun, 1980), has often been indirectly used as a measure of redundancy in co-training (Blum and Mitchell, 1998; Balcan et al., 2004; Christoudias et al., 2008) and multi-view learning (Tosh et al., 2021; Tsai et al., 2020; Tian et al., 2020; Sridharan and Kakade, 2008). It is defined for three variables as the difference in mutual information and conditional mutual information:
| (3) |
and can be defined inductively for more than three variables. However, interaction information has some significant shortcomings: can be both positive and negative, leading to considerable difficulty in its interpretation when redundancy as an information quantity is negative (Jakulin and Bratko, 2003; Liang et al., 2023a). Furthermore, the total information is only equal to redundancy and uniqueness (), and there is no measurement of synergy in this framework.
3.3.2. Information decomposition
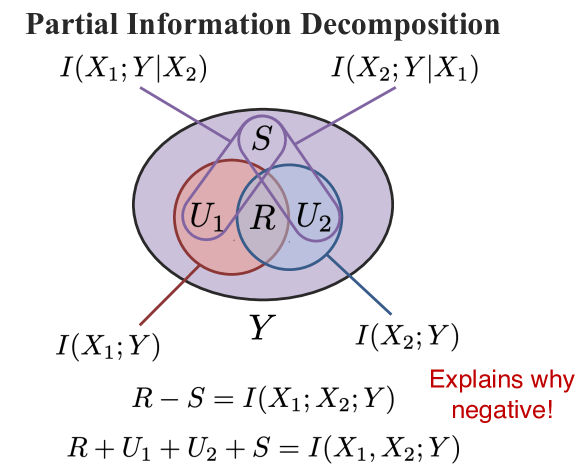
[Illustration of partial information decomposition]A venn diagram showing the areas depicting information redundant between 2 modalities, unique to one modality, and synergistic only when both modalities are present.
Partial information decomposition (PID) (Williams and Beer, 2010) was designed to solve some of the issues with multivariate information theory. PID is a class of definitions for redundancy between and , unique information in and in , and synergy when both and are present such that the following equations hold (see Figure 4 for a visual depiction):
| (4) | ||||||
| (5) | ||||||
| (6) | ||||||
PID resolves the issue of negative in conventional information theory by separating and such that , identifying that prior redundancy measures confound actual redundancy and synergy. Furthermore, if then existing frameworks are unable to distinguish between positive values of true and canceling each other out, while PID separates and can estimate non-zero (but equal) values of both and .
3.3.3. Annotating information decomposition
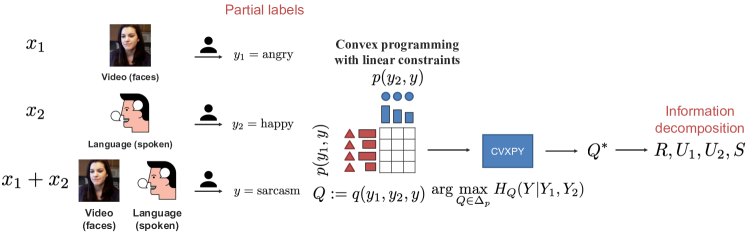
[Overview of our proposed method to convert partial or counterfactual labels to information decomposition values]We convert partial or counterfactual labels to information decomposition values via a convex optimization method with marginal constraints, which can be done accurately and efficiently. This method is applicable to many annotated multimodal datasets and yields consistent, comparable, and standardized interaction estimates.
While information decomposition has a formal definition and exhibits nice properties, it remains a challenge to scale information decomposition to real-world high-dimensional and continuous modalities (Liang et al., 2023a; Bertschinger et al., 2014). To quantify information decomposition for real-world tasks, we investigate whether human judgment can be used as a reliable estimator. We propose a new annotation scheme where we show both modalities and the label and ask each annotator to annotate the degree of redundancy, uniqueness, and synergy on a scale of 0-5 using the following definitions inspired by the formal definitions in information decomposition:
-
(1)
: The extent to which using the modalities individually and together gives the same predictions on the task,
-
(2)
: The extent to which enables you to make a prediction about the task that you would not if using ,
-
(3)
: The extent to which enables you to make a prediction about the task that you would not if using ,
-
(4)
: The extent to which only both modalities enable you to make a prediction about the task that you would not otherwise make using either modality individually,
alongside their confidence in their answers on a scale of 0-5. We show a sample user interface for the annotations in Figure 3 (bottom) and include exact annotation procedures in Appendix A.3.
4. Converting Partial Labels to PID
Finally, we propose a method to automatically convert partial labels, which are present in many existing multimodal datasets (Provost et al., 2015; D’mello and Kory, 2015; Pantic et al., 2005), into information decomposition interaction values. Define the multimodal label as in the case of partial labels and the average of and in the case of counterfactual labels. Then, the partial and counterfactual labels are related to redundancy, uniqueness, and synergy in the following ways:
-
(1)
is high when , , and are all close to each other,
-
(2)
is high when is close to but is far from ,
-
(3)
is high when is close to but is far from ,
-
(4)
is high when are both far from .
While these partial labels are intuitively related to information decomposition, coming up with a concrete equation to convert , , and to actual interaction values is surprisingly difficult and involves many design decisions. For example, what distance measure do we use to measure closeness in label space? Furthermore, computing depends on 3 distances, and depend on 2 distances but inversely on 1 distance, and depends on 2 distances. How do we obtain interaction values that lie on comparable scales so that they can be compared reliably?
| Datasets | Modalities | Size | Prediction task | Research Area |
| VQA 2.0 (Goyal et al., 2017) | QA | Multimedia | ||
| CLEVR (Johnson et al., 2017) | QA | Multimedia | ||
| MOSEI (Zadeh et al., 2018) | sentiment, emotions | Affective Computing | ||
| UR-FUNNY (Hasan et al., 2019) | humor | Affective Computing | ||
| MUStARD (Castro et al., 2019) | sarcasm | Affective Computing |
4.1. Automatic conversion
Our key insight is that the aforementioned issues are exactly what inspired much of the research in information theory and decomposition in the first place: in information theory, the lack of a distance measure is solved by working with probability distributions where information-theoretic distances like KL-divergence are well-defined and standardized, the issues of normalization are solved using a standardized unit of measure (bits in log-base 2), and the issues of incomparable scales are solved by the consistency equations (4)-(6) relating PID values to each other and to the total task-relevant information in both modalities.
Armed with these formalisms of information theory and information decomposition, we propose a method to convert human-annotated partial predictions into redundancy, uniqueness, and synergy (see Figure 5 for an overview). To do so, we treat the dataset of partial predictions as a joint distribution with and as ‘multimodal inputs’ sampled over the label support , and the target label as the ‘output’ also over . Following this, we adopt a precise definition of redundancy, uniqueness, and synergy used by Bertschinger et al. (2014), where the interactions are defined as the solution to the optimization problems:
| (7) | ||||
| (8) | ||||
| (9) |
where and the notation and disambiguates MI under joint distributions and respectively. The key difference in this definition of PID lies in optimizing to satisfy the marginals , but relaxing the coupling between and : need not be equal to . The intuition behind this is that one should be able to infer redundancy and uniqueness given only access to separate marginals and , and therefore they should only depend on which match these marginals. Synergy, however, requires knowing the coupling , and this is reflected in equation (9) depending on the full distribution.
4.2. Estimating information decomposition
These optimization problems can be solved accurately and efficiently using convex programming. Importantly, the that solves (7)-(9) can be rewritten as the solution to the max-entropy optimization problem: (Bertschinger et al., 2014). Since the support of the label space is usually small and discrete for classification, or small and continuous for regression, we can represent all valid joint distributions as a set of tensors of shape with each entry representing . The problem then boils down to optimizing over tensors that are valid joint distributions and that match marginals over each modality and the label (i.e., making sure ).
Given a tensor parameter , our objective is , which is concave. This is therefore a convex optimization problem and the marginal constraints can be written as linear constraints. Given a dataset , and are first estimated before enforcing and through linear constraints: the 3D-tensor summed over the second dimension gives and summed over the first dimension gives . Our final optimization problem is given by
| (10) | ||||
| (11) | such that | |||
| (12) |
Since this is a convex optimization problem with linear constraints, CVXPY (Diamond and Boyd, 2016) returns the exact answer efficiently. Plugging the learned into equations (7)-(9) yields the desired estimates for redundancy, uniqueness, and synergy.
Therefore, this estimator can automatically convert partial or counterfactual labels annotated by humans in existing multimodal datasets (Provost et al., 2015; D’mello and Kory, 2015; Pantic et al., 2005) into information decomposition interactions, yielding consistent, comparable, and standardized estimates.
5. Experiments
In this section, we design experiments to compare the annotation of multimodal interactions via randomized partial labels, counterfactual labels, and information decomposition into redundancy, uniqueness, and synergy.
5.1. Experimental setup
5.1.1. Datasets and tasks
Our experiments involve a large collection of datasets spanning the language, visual, and audio modalities across affective computing and multimedia. We summarize the datasets used in Table 1 and provide more details here:
1. VQA 2.0 (Goyal et al., 2017) is a balanced version of the popular VQA (Agrawal et al., 2017) dataset by collecting complementary images such that every question is associated with a pair of similar images that result in two different answers to the same question. This reduces the occurrence of spurious correlations in the dataset and enables the training of more robust models.
2. CLEVR (Johnson et al., 2017) is a dataset for studying the ability of multimodal systems to perform visual reasoning. It contains rendered images and about unique automatically generated questions that test visual reasoning abilities such as counting, comparing, logical reasoning, and memory.
3. MOSEI (Zadeh et al., 2018) is a collection of opinion video clips annotated with labels for subjectivity and sentiment intensity. The dataset includes per-frame, and per-opinion annotated visual features, and per-milliseconds annotated audio features. Sentiment intensity is annotated in the range . Videos are collected from YouTube with a focus on video blogs which reflect real-world speakers expressing their behaviors through monologue videos.
4. UR-FUNNY (Hasan et al., 2019): Humor is an inherently multimodal communicative tool involving the effective use of words (text), accompanying gestures (visual), and prosodic cues (acoustic). UR-FUNNY consists of more than video samples from TED talks annotated for humor, and covers speakers from various backgrounds, ethnic groups, and cultures.
5. MUStARD (Castro et al., 2019) is a multimodal video corpus for research in sarcasm detection compiled from popular TV shows including Friends, The Golden Girls, The Big Bang Theory, and Sarcasmaholics Anonymous. MUStARD consists of audiovisual utterances annotated with sarcasm labels. Sarcasm requires careful modeling of complementary information, particularly when the information from each modality does not agree with each other.
Overall, the datasets involved in our experiments cover diverse modalities such as images, video, audio, and text, with prediction tasks spanning humor, sarcasm sentiment, emotions, and question-answering from affective computing and multimedia.
5.1.2. Annotation details
Participation in all annotations was fully voluntary and we obtained consent from all participants prior to annotations. The authors manually took anonymous notes on all results and feedback in such a manner that the identities of annotators cannot readily be ascertained directly or through identifiers linked to the subjects. Participants were not the authors nor in the same research groups as the authors, but they all hold or are working towards a graduate degree in a STEM field and have knowledge of machine learning. None of the participants knew about this project before their session and each participant only interacted with the setting they were involved in.
We sample datapoints from each of the datasets in Table 1 and give them to a total of different annotators:
-
•
3 annotators for direct annotation of interactions,
-
•
3 annotators for partial labeling of , , and ,
-
•
3 annotators for counterfactual, labeling first then ,
-
•
3 annotators for counterfactual, labeling first then .
We summarize the results and key findings:
5.2. Annotating partial and counterfactual labels
| Task | Agreement | Confidence | ||||
| Measure | ||||||
| Partial labels | ||||||
| Task | Agreement | Confidence | ||||||
| Measure | ||||||||
| Counterfactual | ||||||||
| Task | Agreement | Confidence | ||||||
| Measure | ||||||||
| Info. decomposition | ||||||||
We show the agreement scores of partial and counterfactual labels in Table 2 and note some observations below:
-
•
Comparing partial with counterfactual labels: Counterfactual label agreement () is similar to randomized label agreement (). In particular, annotating the video-only modality () for video datasets in the randomized setting appears to be confusing with an agreement of only . We hypothesize that this is due to the challenge of detecting sentiment, sarcasm, and humor in videos without audio and when no obvious facial expression or body language is shown. Furthermore, we observe similar confidence in predicting the label when adding the second modality in the counterfactual setting versus showing both modalities upfront in the randomized setting: vs .
-
•
Agreement and confidence datasets: We examined the agreement for each dataset in the randomized and counterfactual settings respectively. In both settings, we found MOSEI is the easiest dataset with the highest agreement of , , for annotating , , and and , , , for annotating , , , and . Meanwhile, MUStARD is the hardest, with the agreement as low as , , and in the randomized setting. The average confidence for annotating partial labels is actually high (above ) for all datasets except unimodal predictions for VQA and CLEVR, which is as low as and . This is understandable since these two image-based question-answering tasks are quite synergistic and cannot be performed using only one of the modalities, whereas annotator confidence when seeing both modalities is a perfect .
-
•
Effect of counterfactual order: Apart from a slight decrease in agreement in labeling first then and the slight increase in agreement in then , we do not observe a significant difference caused by the counterfactual order. This is confirmed by the qualitative feedback from annotators: one responded that they found no difference between both orders and gave mostly similar responses to both.
Overall, we find that while both partial and counterfactual labels are reasonable choices for quantifying multimodal interactions, the annotation of counterfactual labels yields higher agreement and confidence than partial labels via random assignment.
5.3. Annotating information decomposition
| Task | VQA 2.0: image+text | CLEVR: image+text | MOSEI: video+text | UR-FUNNY: video+text | MUStARD: video+text | |||||||||||||||
| Measure | ||||||||||||||||||||
| Info. decomposition | ||||||||||||||||||||
| Partial+PID | ||||||||||||||||||||
| Counterfactual+PID | ||||||||||||||||||||
We now turn our attention to annotating information decomposition. Referencing the average annotated interactions in Table 3 with agreement scores in Table 2, we explain our findings regarding annotation quality and consistency. We also note qualitative feedback from annotators regarding any challenges they faced.
-
•
General observations on interactions, agreement, and confidence: The annotated interactions align with prior intuitions on these multimodal datasets and do indeed explain the interactions between modalities, such as VQA and CLEVR with significantly high synergy, as well as language being the dominant modality in sentiment, humor, and sarcasm (high values). Overall, the Krippendorff’s alpha for inter-annotator agreement in directly annotating the interactions is quite high (roughly for each interaction) and the average confidence scores are also quite high (above for each interaction), indicating that the human-annotated results are reasonably reliable.
-
•
Uniqueness vs synergy in video datasets: There was some confusion between uniqueness in the language modality and synergy in the video datasets, resulting in cases of low agreement in annotating and : , for MOSEI, , for UR-FUNNY and , for MUStARD respectively. We believe this is due to subjectivity in interpreting whether sentiment, humor, and sarcasm are present in the language only or present only when contextualizing both language and video.
-
•
Information decomposition in non-video datasets: On non-video datasets, there are cases of disagreement due to the subjective definitions of information decomposition. For example, there was some confusion regarding VQA and CLEVR, where images are the primary source of information that must be selectively filtered by the question. This results in response synergy but information uniqueness. One annotator consistently annotated high visual uniqueness as the dominant interaction, while the other two recognized synergy as the dominant interaction, so the agreement of annotating synergy was low ().
-
•
On presence vs absence of an attribute: We further investigated the difference between agreement and confidence in the presence or absence of an attribute (e.g., humor or sarcasm). Intuitively, the presence of an attribute is clearer: taking the example of synergy, humans can judge that there is no inference of sarcasm from text only and there is no inference of sarcasm from the visual modality only, but there is sarcasm when both modalities interact together (Castro et al., 2019). Indeed, we examined videos that show and do not show an attribute separately and found in general, humans reached higher agreement on annotating attribute-present videos. The agreement of annotating is when the attribute is present, compared to when absent.
Overall, we find that while annotating information decomposition can perform well, there are some sources of confusion regarding certain interactions and during the absence of an attribute.
5.4. Converting partial and counterfactual labels to information decomposition
Finally, we present results on converting partial and counterfactual labels into interactions using our information-theoretic method (PID). We report these results in Table 3 in the rows called Partial+PID and Counterfactual+PID, and note the following:
-
•
Partial+PID vs counterfactual+PID: In comparing conversions on both partial and counterfactual labels, we find that the final interactions are very consistent with each other: the highest interaction is always the same across the datasets and the relative order of interactions is also maintained.
-
•
Comparing with directly annotated interactions: In comparison to the interaction that human annotators rate as the highest, PID also assigns the largest magnitude to the same interaction ( for VQA 2.0 and CLEVR, for UR-FUNNY and MUStARD), so there is strong agreement. For MOSEI there is a small difference: both and are annotated as equally high by humans, while PID estimates as the highest.
-
•
Normalized comparison scale: Observe that the converted results fall into a new scale and range, especially for the MOSEI, UR-FUNNY, and MUStARD video datasets. This is expected since PID conversion inherits the properties of information theory where add up to the total information that the two modalities provide about a task, indicating that the three video datasets are more subjective and are harder to predict.
-
•
Propagation of subjectivity: On humor and sarcasm, the subjectivity in initial human partial labeling can be propagated when we subsequently apply automatic conversion - after all, we do not expect the automatic conversion to change the relative order apart from estimating interactions in a principled way.
Therefore, we believe that the conversion method we proposed is a stable method for estimating information decomposition, combining human-in-the-loop labeling of partial labels (which shows high agreement and scales to high-dimensional data) with information-theoretic conversion which enables comparable scales, normalized values, and well-defined distance metrics.
5.5. An overall guideline
Given these findings, we summarize the following guidelines for quantifying multimodal fusion interactions:
-
•
For modalities and tasks that are more objective (e.g., visual question answering), direct annotation of information decomposition is a reliable alternative to conventional methods of partial and counterfactual labeling to study multimodal interactions.
-
•
For modalities and tasks that may be subjective (e.g., sarcasm, humor), it is useful to obtain counterfactual labels before using PID conversion to information decomposition values, since counterfactual labeling exhibits higher annotator agreement while PID conversion is a principled method to obtain interactions.
6. Conclusion
Our work aims to quantify various categorizations of multimodal interactions using human annotations. Through a comprehensive study of partial labels, counterfactual labels, and information decomposition, we elucidated several pros and cons of each approach and proposed a hybrid estimator that can convert partial and counterfactual labels to information decomposition interaction estimates. On real-world multimodal fusion tasks, we show that we can estimate interaction values accurately and efficiently which paves the way towards a deeper understanding of these multimodal datasets.
Limitations and future work: The annotation schemes in this work are limited by the subjectivity of the modalities and task. Automatic conversion of partial labels to information decomposition requires the label space to be small and discrete (i.e., classification), and does not yet extend to regression or text answers unless approximate discretization is first performed. Future work can also scale up human annotations to more datapoints and fusion tasks, and ask annotators to provide their explanations for ratings that have low agreement. Finally, we are aware of challenges in evaluating interaction estimation and emphasize that they should be interpreted as a relative sense of which interaction is most important and a guideline to inspire model selection and design.
Acknowledgements
This material is based upon work partially supported by Meta, National Science Foundation awards 1722822 and 1750439, and National Institutes of Health awards R01MH125740, R01MH132225, R01MH096951 and R21MH130767. PPL is partially supported by a Facebook PhD Fellowship and a Carnegie Mellon University’s Center for Machine Learning and Health Fellowship. RS is supported in part by ONR N000141812861, ONR N000142312368 and DARPA/AFRL FA87502321015. Any opinions, findings, conclusions, or recommendations expressed in this material are those of the author(s) and do not necessarily reflect the views of the NSF, NIH, Meta, CMLH, ONR, DARPA, or AFRL, and no official endorsement should be inferred. We are grateful to the anonymous reviewers for their valuable feedback. Finally, we would also like to acknowledge NVIDIA’s GPU support.
References
- (1)
- Abbasnejad et al. (2020) Ehsan Abbasnejad, Damien Teney, Amin Parvaneh, Javen Shi, and Anton van den Hengel. 2020. Counterfactual vision and language learning. In Proceedings of the IEEE/CVF conference on computer vision and pattern recognition. 10044–10054.
- Agrawal et al. (2017) Aishwarya Agrawal, Jiasen Lu, Stanislaw Antol, Margaret Mitchell, C. Lawrence Zitnick, Devi Parikh, and Dhruv Batra. 2017. VQA: Visual Question Answering. International Journal of Computer Vision (2017).
- Auffarth et al. (2010) Benjamin Auffarth, Maite López, and Jesús Cerquides. 2010. Comparison of redundancy and relevance measures for feature selection in tissue classification of CT images. In Industrial conference on data mining. Springer, 248–262.
- Balcan et al. (2004) Maria-Florina Balcan, Avrim Blum, and Ke Yang. 2004. Co-training and expansion: Towards bridging theory and practice. Advances in neural information processing systems 17 (2004).
- Bateman (2014) John Bateman. 2014. Text and image: A critical introduction to the visual/verbal divide. Routledge.
- Benson and Hartz (2000) Kjell Benson and Arthur J Hartz. 2000. A comparison of observational studies and randomized, controlled trials. New England Journal of Medicine 342, 25 (2000), 1878–1886.
- Bertschinger et al. (2014) Nils Bertschinger, Johannes Rauh, Eckehard Olbrich, Jürgen Jost, and Nihat Ay. 2014. Quantifying unique information. Entropy 16, 4 (2014), 2161–2183.
- Blum and Mitchell (1998) Avrim Blum and Tom Mitchell. 1998. Combining labeled and unlabeled data with co-training. In Proceedings of the eleventh annual conference on Computational learning theory. 92–100.
- Castro et al. (2019) Santiago Castro, Devamanyu Hazarika, Verónica Pérez-Rosas, Roger Zimmermann, Rada Mihalcea, and Soujanya Poria. 2019. Towards Multimodal Sarcasm Detection (An _Obviously_ Perfect Paper). In ACL. 4619–4629.
- Chan et al. (2017) Thalia E Chan, Michael PH Stumpf, and Ann C Babtie. 2017. Gene regulatory network inference from single-cell data using multivariate information measures. Cell systems 5, 3 (2017), 251–267.
- Christoudias et al. (2008) C Mario Christoudias, Raquel Urtasun, and Trevor Darrell. 2008. Multi-view learning in the presence of view disagreement. In Proceedings of the Twenty-Fourth Conference on Uncertainty in Artificial Intelligence. 88–96.
- Colenbier et al. (2020) Nigel Colenbier, Frederik Van de Steen, Lucina Q Uddin, Russell A Poldrack, Vince D Calhoun, and Daniele Marinazzo. 2020. Disambiguating the role of blood flow and global signal with partial information decomposition. Neuroimage 213 (2020), 116699.
- Diamond and Boyd (2016) Steven Diamond and Stephen Boyd. 2016. CVXPY: A Python-embedded modeling language for convex optimization. Journal of Machine Learning Research 17, 83 (2016), 1–5.
- D’mello and Kory (2015) Sidney K D’mello and Jacqueline Kory. 2015. A review and meta-analysis of multimodal affect detection systems. ACM computing surveys (CSUR) 47, 3 (2015), 1–36.
- D’Mello et al. (2018) Sidney D’Mello, Arvid Kappas, and Jonathan Gratch. 2018. The affective computing approach to affect measurement. Emotion Review 10, 2 (2018), 174–183.
- Flecker et al. (2011) Benjamin Flecker, Wesley Alford, John M Beggs, Paul L Williams, and Randall D Beer. 2011. Partial information decomposition as a spatiotemporal filter. Chaos: An Interdisciplinary Journal of Nonlinear Science 21, 3 (2011), 037104.
- Flom and Bahrick (2007) Ross Flom and Lorraine E Bahrick. 2007. The development of infant discrimination of affect in multimodal and unimodal stimulation: The role of intersensory redundancy. Developmental psychology 43, 1 (2007), 238.
- Friedman and Popescu (2008) Jerome H Friedman and Bogdan E Popescu. 2008. Predictive learning via rule ensembles. The annals of applied statistics 2, 3 (2008), 916–954.
- Garner (1962) Wendell R Garner. 1962. Uncertainty and structure as psychological concepts. (1962).
- Goyal et al. (2017) Yash Goyal, Tejas Khot, Douglas Summers-Stay, Dhruv Batra, and Devi Parikh. 2017. Making the v in vqa matter: Elevating the role of image understanding in visual question answering. In Proceedings of the IEEE Conference on Computer Vision and Pattern Recognition. 6904–6913.
- Goyal et al. (2019) Yash Goyal, Ziyan Wu, Jan Ernst, Dhruv Batra, Devi Parikh, and Stefan Lee. 2019. Counterfactual visual explanations. In International Conference on Machine Learning. PMLR, 2376–2384.
- Harder et al. (2013) Malte Harder, Christoph Salge, and Daniel Polani. 2013. Bivariate measure of redundant information. Physical Review E 87, 1 (2013), 012130.
- Hasan et al. (2019) Md Kamrul Hasan, Wasifur Rahman, AmirAli Bagher Zadeh, Jianyuan Zhong, Md Iftekhar Tanveer, Louis-Philippe Morency, and Mohammed Ehsan Hoque. 2019. UR-FUNNY: A Multimodal Language Dataset for Understanding Humor. In EMNLP. 2046–2056.
- Hessel and Lee (2020) Jack Hessel and Lillian Lee. 2020. Does my multimodal model learn cross-modal interactions? It’s harder to tell than you might think!. In EMNLP.
- Jakulin and Bratko (2003) Aleks Jakulin and Ivan Bratko. 2003. Quantifying and visualizing attribute interactions: An approach based on entropy. (2003).
- Jayakumar et al. (2020) Siddhant M. Jayakumar, Wojciech M. Czarnecki, Jacob Menick, Jonathan Schwarz, Jack Rae, Simon Osindero, Yee Whye Teh, Tim Harley, and Razvan Pascanu. 2020. Multiplicative Interactions and Where to Find Them. In International Conference on Learning Representations. https://openreview.net/forum?id=rylnK6VtDH
- Johnson et al. (2017) Justin Johnson, Bharath Hariharan, Laurens Van Der Maaten, Li Fei-Fei, C Lawrence Zitnick, and Ross Girshick. 2017. Clevr: A diagnostic dataset for compositional language and elementary visual reasoning. In Proceedings of the IEEE conference on computer vision and pattern recognition. 2901–2910.
- Kaushik et al. (2019) Divyansh Kaushik, Eduard Hovy, and Zachary C Lipton. 2019. Learning the difference that makes a difference with counterfactually-augmented data. International Conference on Learning Representations (2019).
- Kim et al. (2021) Wonjae Kim, Bokyung Son, and Ildoo Kim. 2021. Vilt: Vision-and-language transformer without convolution or region supervision. In International Conference on Machine Learning. PMLR, 5583–5594.
- Kruk et al. (2019) Julia Kruk, Jonah Lubin, Karan Sikka, Xiao Lin, Dan Jurafsky, and Ajay Divakaran. 2019. Integrating Text and Image: Determining Multimodal Document Intent in Instagram Posts. In Proceedings of the 2019 Conference on Empirical Methods in Natural Language Processing and the 9th International Joint Conference on Natural Language Processing (EMNLP-IJCNLP). 4622–4632.
- Liang et al. (2023a) Paul Pu Liang, Yun Cheng, Xiang Fan, Chun Kai Ling, Suzanne Nie, Richard Chen, Zihao Deng, Faisal Mahmood, Ruslan Salakhutdinov, and Louis-Philippe Morency. 2023a. Quantifying & Modeling Feature Interactions: An Information Decomposition Framework. arXiv preprint arXiv:2302.12247 (2023).
- Liang et al. (2023b) Paul Pu Liang, Chun Kai Ling, Yun Cheng, Alex Obolenskiy, Yudong Liu, Rohan Pandey, Alex Wilf, Louis-Philippe Morency, and Ruslan Salakhutdinov. 2023b. Multimodal Learning Without Labeled Multimodal Data: Guarantees and Applications. arXiv preprint arXiv:2306.04539 (2023).
- Liang et al. (2018) Paul Pu Liang, Ziyin Liu, AmirAli Bagher Zadeh, and Louis-Philippe Morency. 2018. Multimodal Language Analysis with Recurrent Multistage Fusion. In Proceedings of the 2018 Conference on Empirical Methods in Natural Language Processing. 150–161.
- Liang et al. (2023c) Paul Pu Liang, Yiwei Lyu, Gunjan Chhablani, Nihal Jain, Zihao Deng, Xingbo Wang, Louis-Philippe Morency, and Ruslan Salakhutdinov. 2023c. MultiViz: Towards Visualizing and Understanding Multimodal Models. In International Conference on Learning Representations. https://openreview.net/forum?id=i2_TvOFmEml
- Liang et al. (2022) Paul Pu Liang, Amir Zadeh, and Louis-Philippe Morency. 2022. Foundations and recent trends in multimodal machine learning: Principles, challenges, and open questions. arXiv preprint arXiv:2209.03430 (2022).
- Lyu et al. (2022) Yiwei Lyu, Paul Pu Liang, Zihao Deng, Ruslan Salakhutdinov, and Louis-Philippe Morency. 2022. DIME: Fine-Grained Interpretations of Multimodal Models via Disentangled Local Explanations (AIES ’22). Association for Computing Machinery, New York, NY, USA, 455–467. https://doi.org/10.1145/3514094.3534148
- Marsh and Domas White (2003) Emily E Marsh and Marilyn Domas White. 2003. A taxonomy of relationships between images and text. Journal of documentation (2003).
- Mazzetto et al. (2021) Alessio Mazzetto, Dylan Sam, Andrew Park, Eli Upfal, and Stephen Bach. 2021. Semi-Supervised Aggregation of Dependent Weak Supervision Sources With Performance Guarantees. In Proceedings of The 24th International Conference on Artificial Intelligence and Statistics (Proceedings of Machine Learning Research), Arindam Banerjee and Kenji Fukumizu (Eds.), Vol. 130. PMLR, 3196–3204. https://proceedings.mlr.press/v130/mazzetto21a.html
- McGill (1954) William McGill. 1954. Multivariate information transmission. Transactions of the IRE Professional Group on Information Theory 4, 4 (1954), 93–111.
- Ngiam et al. (2011) Jiquan Ngiam, Aditya Khosla, Mingyu Kim, Juhan Nam, Honglak Lee, and Andrew Y Ng. 2011. Multimodal deep learning. In Proceedings of the 28th international conference on machine learning (ICML-11). 689–696.
- Otto et al. (2020) Christian Otto, Matthias Springstein, Avishek Anand, and Ralph Ewerth. 2020. Characterization and classification of semantic image-text relations. International Journal of Multimedia Information Retrieval 9 (2020), 31–45.
- Pantic et al. (2005) Maja Pantic, Nicu Sebe, Jeffrey F Cohn, and Thomas Huang. 2005. Affective multimodal human-computer interaction. In Proceedings of the 13th annual ACM international conference on Multimedia. 669–676.
- Partan and Marler (1999) Sarah Partan and Peter Marler. 1999. Communication goes multimodal. Science 283, 5406 (1999), 1272–1273.
- Partan and Marler (2005) Sarah R Partan and Peter Marler. 2005. Issues in the classification of multimodal communication signals. The American Naturalist 166, 2 (2005), 231–245.
- Pica et al. (2017) Giuseppe Pica, Eugenio Piasini, Houman Safaai, Caroline Runyan, Christopher Harvey, Mathew Diamond, Christoph Kayser, Tommaso Fellin, and Stefano Panzeri. 2017. Quantifying how much sensory information in a neural code is relevant for behavior. Advances in Neural Information Processing Systems 30 (2017).
- Provost et al. (2015) Emily Mower Provost, Yuan Shangguan, and Carlos Busso. 2015. UMEME: University of Michigan emotional McGurk effect data set. IEEE Transactions on Affective Computing 6, 4 (2015), 395–409.
- Radford et al. (2021) Alec Radford, Jong Wook Kim, Chris Hallacy, Aditya Ramesh, Gabriel Goh, Sandhini Agarwal, Girish Sastry, Amanda Askell, Pamela Mishkin, Jack Clark, et al. 2021. Learning transferable visual models from natural language supervision. In International Conference on Machine Learning. PMLR, 8748–8763.
- Ruiz et al. (2006) Natalie Ruiz, Ronnie Taib, and Fang Chen. 2006. Examining the redundancy of multimodal input. In Proceedings of the 18th Australia conference on Computer-Human Interaction: Design: Activities, Artefacts and Environments. 389–392.
- Shannon (1948) Claude Elwood Shannon. 1948. A mathematical theory of communication. The Bell system technical journal 27, 3 (1948), 379–423.
- Soleymani et al. (2011) Mohammad Soleymani, Maja Pantic, and Thierry Pun. 2011. Multimodal emotion recognition in response to videos. IEEE transactions on affective computing 3, 2 (2011), 211–223.
- Sorokina et al. (2008) Daria Sorokina, Rich Caruana, Mirek Riedewald, and Daniel Fink. 2008. Detecting statistical interactions with additive groves of trees. In Proceedings of the 25th international conference on Machine learning. 1000–1007.
- Sridharan and Kakade (2008) Karthik Sridharan and Sham M Kakade. 2008. An information theoretic framework for multi-view learning. In Conference on Learning Theory.
- Te Sun (1980) Han Te Sun. 1980. Multiple mutual informations and multiple interactions in frequency data. Inf. Control 46 (1980), 26–45.
- Tian et al. (2020) Yonglong Tian, Chen Sun, Ben Poole, Dilip Krishnan, Cordelia Schmid, and Phillip Isola. 2020. What makes for good views for contrastive learning? Advances in Neural Information Processing Systems 33 (2020), 6827–6839.
- Timme et al. (2016) Nicholas M Timme, Shinya Ito, Maxym Myroshnychenko, Sunny Nigam, Masanori Shimono, Fang-Chin Yeh, Pawel Hottowy, Alan M Litke, and John M Beggs. 2016. High-degree neurons feed cortical computations. PLoS computational biology 12, 5 (2016), e1004858.
- Tosh et al. (2021) Christopher Tosh, Akshay Krishnamurthy, and Daniel Hsu. 2021. Contrastive learning, multi-view redundancy, and linear models. In Algorithmic Learning Theory. PMLR, 1179–1206.
- Tsai et al. (2019) Yao-Hung Hubert Tsai, Paul Pu Liang, Amir Zadeh, Louis-Philippe Morency, and Ruslan Salakhutdinov. 2019. Learning Factorized Multimodal Representations. In International Conference on Learning Representations.
- Tsai et al. (2020) Yao-Hung Hubert Tsai, Yue Wu, Ruslan Salakhutdinov, and Louis-Philippe Morency. 2020. Self-supervised Learning from a Multi-view Perspective. In International Conference on Learning Representations.
- Tsang et al. (2019) Michael Tsang, Dehua Cheng, Hanpeng Liu, Xue Feng, Eric Zhou, and Yan Liu. 2019. Feature Interaction Interpretability: A Case for Explaining Ad-Recommendation Systems via Neural Interaction Detection. In International Conference on Learning Representations.
- Tsang et al. (2018) Michael Tsang, Dehua Cheng, and Yan Liu. 2018. Detecting Statistical Interactions from Neural Network Weights. In International Conference on Learning Representations.
- Unsworth and Cléirigh (2014) Len Unsworth and Chris Cléirigh. 2014. Multimodality and reading: The construction of meaning through image-text interaction. Routledge.
- Wang et al. (2021) Xingbo Wang, Jianben He, Zhihua Jin, Muqiao Yang, Yong Wang, and Huamin Qu. 2021. M2Lens: Visualizing and explaining multimodal models for sentiment analysis. IEEE Transactions on Visualization and Computer Graphics 28, 1 (2021), 802–812.
- Watanabe (1960) Satosi Watanabe. 1960. Information theoretical analysis of multivariate correlation. IBM Journal of research and development 4, 1 (1960), 66–82.
- Wibral et al. (2015) Michael Wibral, Joseph T Lizier, and Viola Priesemann. 2015. Bits from brains for biologically inspired computing. Frontiers in Robotics and AI 2 (2015), 5.
- Wibral et al. (2017) Michael Wibral, Viola Priesemann, Jim W Kay, Joseph T Lizier, and William A Phillips. 2017. Partial information decomposition as a unified approach to the specification of neural goal functions. Brain and cognition 112 (2017), 25–38.
- Williams and Beer (2010) Paul L Williams and Randall D Beer. 2010. Nonnegative decomposition of multivariate information. arXiv preprint arXiv:1004.2515 (2010).
- Wörtwein et al. (2022) Torsten Wörtwein, Lisa Sheeber, Nicholas Allen, Jeffrey Cohn, and Louis-Philippe Morency. 2022. Beyond Additive Fusion: Learning Non-Additive Multimodal Interactions. In Findings of the Association for Computational Linguistics: EMNLP 2022. 4681–4696.
- Yu and Liu (2003) Lei Yu and Huan Liu. 2003. Efficiently handling feature redundancy in high-dimensional data. In Proceedings of the ninth ACM SIGKDD international conference on Knowledge discovery and data mining. 685–690.
- Yu and Liu (2004) Lei Yu and Huan Liu. 2004. Efficient feature selection via analysis of relevance and redundancy. The Journal of Machine Learning Research 5 (2004), 1205–1224.
- Yuan et al. (2021) Xin Yuan, Zhe Lin, Jason Kuen, Jianming Zhang, Yilin Wang, Michael Maire, Ajinkya Kale, and Baldo Faieta. 2021. Multimodal contrastive training for visual representation learning. In Proceedings of the IEEE/CVF Conference on Computer Vision and Pattern Recognition. 6995–7004.
- Zadeh et al. (2017) Amir Zadeh, Minghai Chen, Soujanya Poria, Erik Cambria, and Louis-Philippe Morency. 2017. Tensor Fusion Network for Multimodal Sentiment Analysis. In EMNLP.
- Zadeh et al. (2018) AmirAli Bagher Zadeh, Paul Pu Liang, Soujanya Poria, Erik Cambria, and Louis-Philippe Morency. 2018. Multimodal language analysis in the wild: Cmu-mosei dataset and interpretable dynamic fusion graph. In ACL.
- Zhang et al. (2018) Mingda Zhang, Rebecca Hwa, and Adriana Kovashka. 2018. Equal But Not The Same: Understanding the Implicit Relationship Between Persuasive Images and Text. In British Machine Vision Conference (BMVC).
Appendix A Human Annotation Details
Participation in all annotations was fully voluntary and we obtained consent from all participants prior to annotations. The authors manually took anonymous notes on all results and feedback in such a manner that the identities of annotators cannot readily be ascertained directly or through identifiers linked to the subjects. Participants were not the authors nor in the same research groups as the authors, but they all hold or are working towards a graduate degree in a STEM field and have knowledge of machine learning. None of the participants knew about this project before their session and each participant only interacted with the setting they were involved in.
We sample datapoints from each of the datasets in Table 1 and give them to a total of different annotators:
-
•
3 annotators for direct annotation of interactions,
-
•
3 annotators for partial labeling of , , and ,
-
•
3 annotators for counterfactual, labeling first then ,
-
•
3 annotators for counterfactual, labeling first then .
All annotations were performed via google spreadsheets.
A.1. Annotating partial labels
We asked 3 annotators to predict the partial labels in a randomized setting. For each annotator, we asked them to annotate then given only modality 1 or 2 respectively, and finally given both modalities. This completion order is designed on purpose to minimize possible memorization of the data so that the annotators can provide completely independent unimodal and multimodal predictions on the label. When annotating the visual modality of the video datasets, we explicitly require the annotators to mute the audio and predict the partial labels based only on the video frames. After that, all annotators are asked to provide a confidence score on a scale of (no confidence) to (high confidence) about their annotations. The confidence scale is applied to all annotation settings below. We aggregated annotator ’s response, annotator ’s response, and annotator ’s response as one set of complete partial labels. Similarly, we collected ’s , ’s , and ’s as the second set, ’s , ’s , and ’s as the third set.
A.2. Annotating counterfactual labels
We asked 6 annotators to predict the counterfactual labels in this setting. For each group of 2 annotators, we asked the first annotator to annotate partial labels given only the first modality and provide confidence scores, then presented them with the other modality and asked for their new predictions and corresponding confidence ratings. We asked the second annotator to predict similarly with only the second modality and then with both modalities presented.
A.3. Annotating information decomposition
We asked 3 annotators to directly annotate the information decomposition values. Given both modalities, each annotator is asked to provide a rating on a scale of (none at all) to (large extent) for the following questions that correspond to , , , and respectively:
-
(1)
The extent to which both modalities enable them to make the same predictions about the task;
-
(2)
The extent to which modality 1 enables them to make a prediction that they would not if using modality 2;
-
(3)
The extent to which modality 2 enables them to make a prediction that they would not if using modality 1;
-
(4)
The extent to which both modalities enable them to make a prediction that they would not if using either modality individually.
Finally, they are asked to rate their confidence for each rating they provided, on a scale of (no confidence) to (high confidence).
A.4. Video and audio presentation
Annotators were provided with the full video link which opens up in a separate video player. They asked to either annotate based on all modalities in the video (i.e., video + audio), or asked to mute the videos themselves when annotating based on vision only, or are not provided the video at all when annotating based only on the transcript. We did not completely remove the audio from videos because in all tasks, annotators have to use video only (with mute), followed by audio+transcripts, and finally with all modalities (video+audio+transcripts). In the counterfactual setting they may see video only (with mute), before playing the entire video with audio. Hence, we instructed the annotators to mute the videos for video-only prediction, and unmute the video for predictions that involve audio. We specifically checked with the annotators and they strictly followed these guidelines.
A.5. Label space for QA tasks
For VQA and CLEVR datasets, annotators were requested to write the answer themselves. For CLEVR the answer is always yes/no. For VQA we let the users write their own answer, but we post-hoc modify these answers to define a similarity with the final answer : whether or are the same as multimodal , or otherwise different. This binary distance function is sufficient to distinguish different interactions.