On variations of global mean surface temperature: When Laplace meets Milanković
Abstract
In his mathematical theory of climate, Milankovic finds a link between the heat received by the Earth surface per unit time as a function of the solar ephemerids and derives a model of climate changes at periods longer than a few (tens of) thousand years and more. In this paper, we investigate the potential connections of global temperature and Earth rotation at much shorter periods, in the complementary range of one to a few hundred years. For temperature, we select the HadCrut05 data set from 1850 to the Present. For Earth rotation, defined by pole coordinates and length of day, we use the IERS data sets from 1962 to the Present and from 1832 to the Present (annual sampling). Using iterative Singular Spectrum Analysis (iSSA), we extract the trend and quasi-periodic components of these time series. The trends of lod and temperature are anti-correlated, the former decreasing by 1.8 ms when the latter increases by 1.3°C. The first quasi-periodic components (period 80-90 years) are expressions of the Gleissberg cycle and are identical (at the level of uncertainty of the data). Taken together, the trend and Gleissberg components allow one to reconstruct 87% of the variance of the data for lod and 48% for temperature. The next four iSSA components, with periods 40, 22, 15 and 9 years, match the now well-known list of commensurable periods of the Jovian planets. There is an ongoing debate on the origin of the forcing of these components (astronomical vs Earth-bound). The Lagrange and Laplace theories imply that the derivative of pole motion should be identical to lod variations: this strong check is passed by the trend + Gleissberg reconstructions. The annual oscillations of pole motion and lod are linked to annual variations in Sun-Earth distance, in agreement with an astronomical, but not a climatic origin. The results obtained in this paper for the observed temperature/rotation couple add to the growing list of evidence of solar and planetary forcings of gravitational nature on a number of geophysical processes (including sea-level, sea-level pressure, sea-ice extent, oceanic climate indices). The components found in this paper can be considered as a shorter-period extension of the Milankovic cycles: the excellent phase coincidence between annual cycles of temperature and lod implies Lagrangian forcing of temperature at this period, that is the very idea of Milankovic.
1 Introduction
Despite difficulties in defining and measuring the Earth’s “mean global temperature”, there is a broad consensus on its variations since the beginning of the industrial era in the mid-1800s.
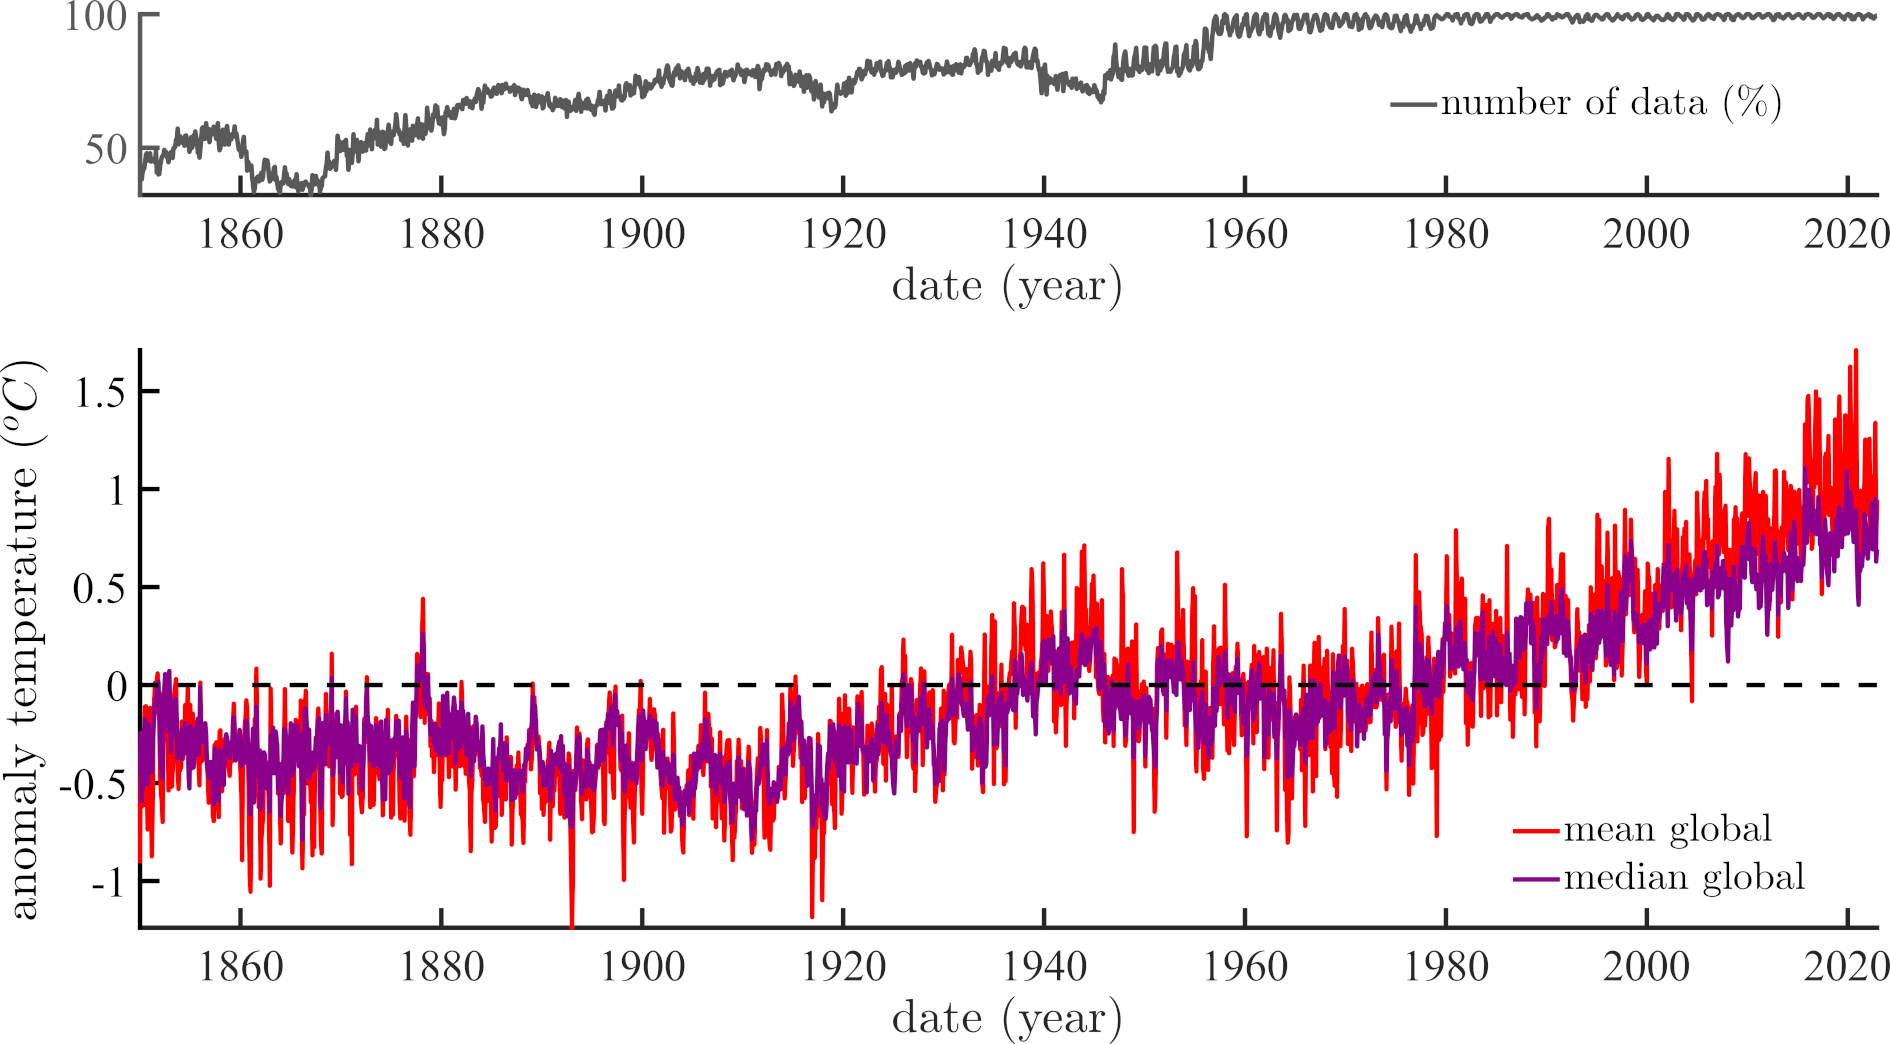
We select as a representative data set the HadCrut111https://crudata.uea.ac.uk/cru/data/temperature/ file (cf. [1, 2]) version 05, the one used in the latest IPCC AR6 report (cf. [3]), shown here in Figure 1 (bottom). General interest focuses on the warming segments (1920-1940 and 1980-2000 or 2020). One should recall that the data coverage is far from complete before 1960 (Figure 1 top). This is one of the many reasons for discrepancies between observed and modelled temperatures (eg. [4, 5, 6]). The temperature anomalies are an indicator of temperature variations.
In his mathematical theory of climates, Milanković ([7], page 15, equation 20) proposes a link between the amount of heat received by the Earth’s surface by unit time, at a location with latitude and longitude and as a function of the Sun’s declination and and hour angle ,
where is the solar constant and the Sun-Earth distance. Lopes et al. ([8]) have extended the use of this equation to shorter periods in the range from less than 1 year up to 300 years. As first shown by Laplace ([9]), the Sun’s ephemerids (,) are connected directly to variations in pole rotation, that is to the coordinates of the pole (,) and to the length of the day (lod) (eg. [10, 11, 12]). It has been known for decades (eg. [13]), with renewed interest in recent years (eg. [14, 11, 15]), that many geophysical and astrophysical time series involve the same sets of pseudo-periodical components, all of them connected to commensurable periods of the planets. The very same pseudo-periodic and periodic components, found in many geophysical phenomena (eg. [16, 17, 13, 18, 19, 20, 21, 22, 23, 24, 25, 26, 27]) are also found in proxies of solar activity (eg. [28, 29, 30, 31, 32]). And for the specific problem of variations in climate-sensitive indices there is an already long list of examples: Courtillot et al. ([33]), Scafetta et al. ([34, 35, 36]), Gupta et al. ([37]), Kristoufek et al. ([38]), Dai et al. ([39]), Le Mouël et al. ([40, 41]), Connolly et al. ([42]), Le Mouël et al. ([43]), Lopes et al. ([44]), Courtillot et al. ([45, 46]), Li et al. ([47]), Lopes et al. ([11]), Ormaza-González et al. ([48]), Lopes et al. ([49]) and Scafetta and Bianchini ([50]). The main remaining problem is to find whether these correlations (sharing the same sets of periodic and pseudo-periodic components) imply causal physical mechanisms. One can provide a partial answer to this important question, at least in the field of geophysics. In most other scientific disciplines, particularly those involving data mining, knowledge discovery, or pattern recognition, determining whether certain patterns are related involves the comparison of their Fourier spectra, of their wavelet coefficients, etc …(eg. [51, 52]). That is precisely what is proposed here.
Milanković ([7]) imagined that the mechanism that could explain the distribution of climates on Earth had to be geometrical. Recall that in ancient greek (pronounced clima) meant “inclination of Earth towards the pole starting at the equator”. We have known since Lagrange ([53]) and Laplace ([9]) that planets behave as tops and that variations in their inclination axis and rotation velocity (or length of day) are linked. Milanković ([7]), and more recently Laskar et al. ([54]) relate insolation and variation in obliquity of the Earth’s rotation axis, that itself is related to this rotation. In this paper we pursue along those lines, with the temperature/rotation couple in mind.
Following the present introduction (section 1), section 2 is devoted to a discussion of the data on Earth rotation and the length of day. Periodic and semi-periodic components of temperature and lod are extracted by singular spectral analysis (iSSA) and compared in section 3. The first two components are presented in some detail, followed by a sub-section in which the derivative of polar coordinates is shown to be a proxy of lod, leading to some interesting results. The discussion and conclusions form section 4.
2 Earth rotation and the length of day
The Earth’s rotation involves three co-ordinates, the two coordinates of the rotation pole and the rotation velocity or the related length of day (lod). We refer the interested reader to the reference book by Lambeck ([10]) (chapter 5.2, page 73). There is an ongoing debate between the original treatment of what is now called the Liouville-Euler system of equations by pioneers Lagrange ([53]) and Laplace ([9]) and the way they are understood by a number of specialists in geodesy (Lambeck [10], chapter 3). Our contribution to this debate is in Lopes et al. ([12]). As far as lod is concerned, the two approaches differ on the origin of the forcing, involving mainly astronomical sources for some ([18, 11]) or earth-bound sources for others (cf. Lambeck [10], page 34).
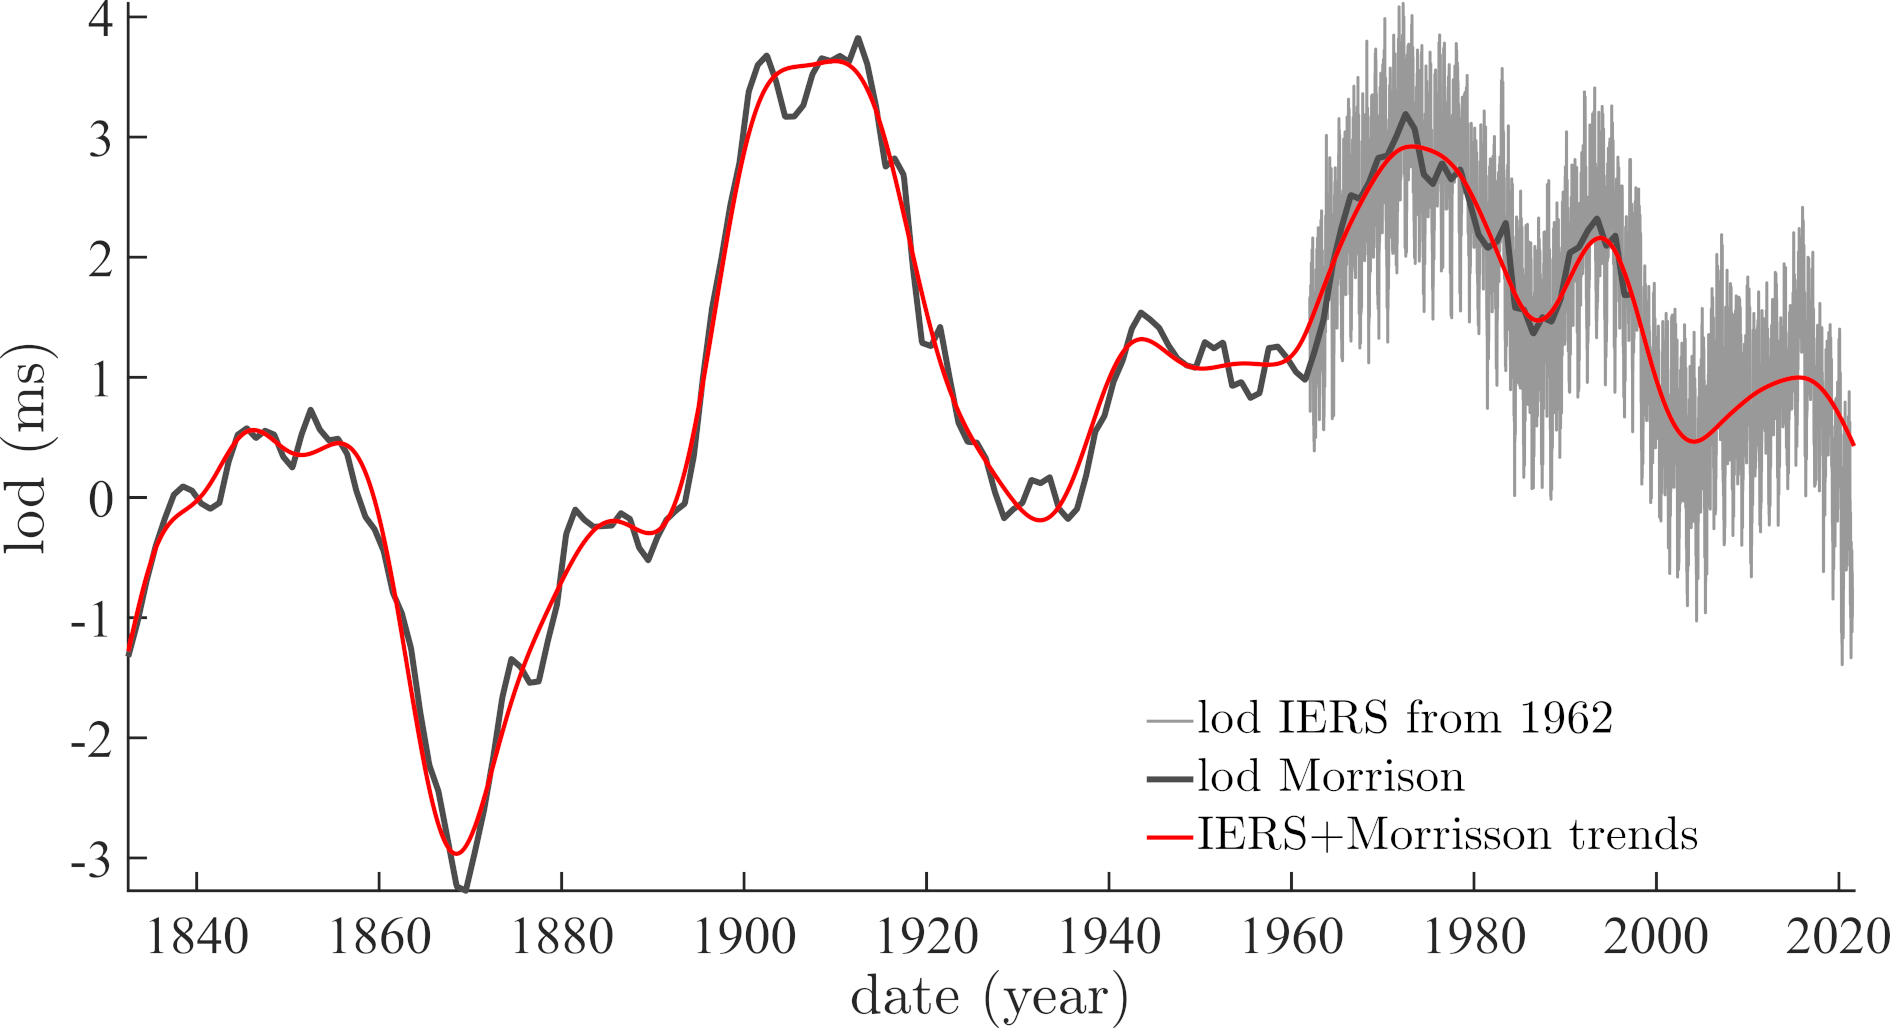
The lod has been measured by satellites with great precision daily since 1962. The data is accessed through the site of the International Earth Rotation and Reference Systems service (IERS222https://www.iers.org/IERS/EN/DataProducts/EarthOrientationData/eop.html). There is also a time series going back to 1832, with annual sampling ([55, 56]). We have combined the two series and generated a suite of annual means (red curve in Figure 2), as we had already done in Lopes et al. ([11]).
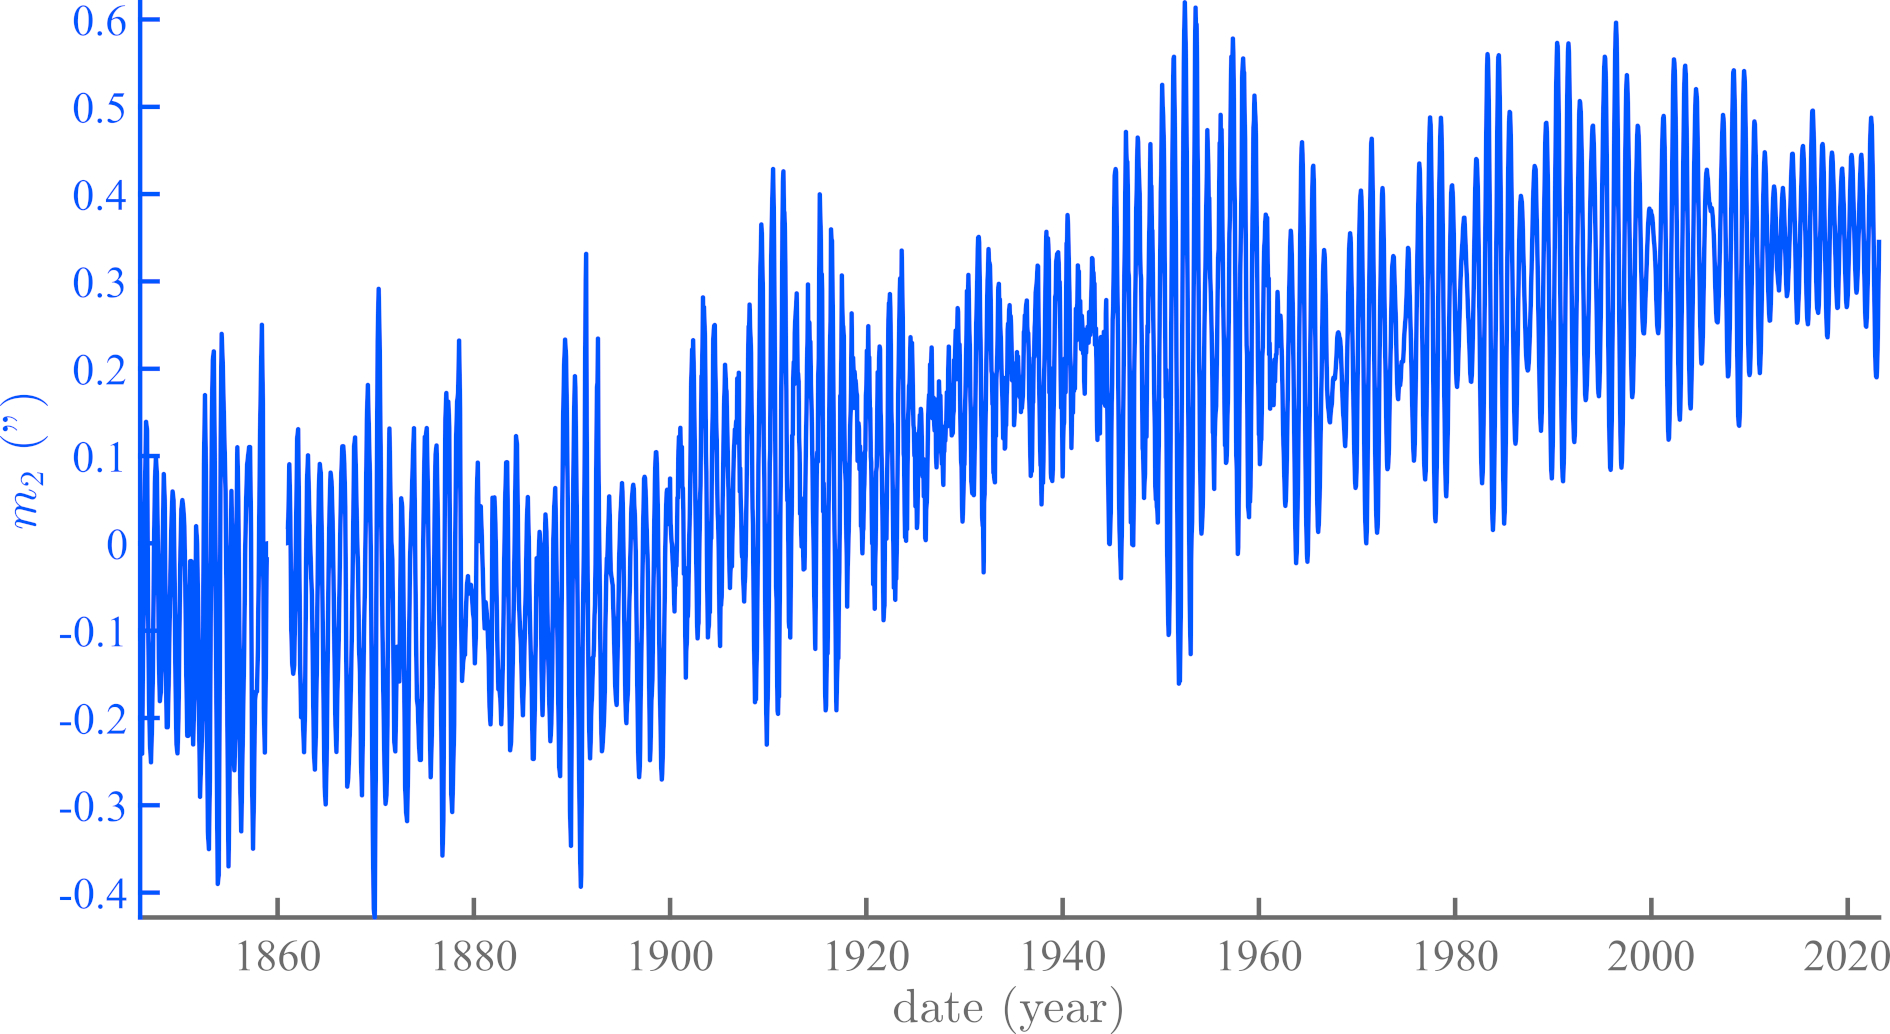
On Figure 3, we present the time evolution of the component of the polar motion since 1846; these values are also provided by the IERS. Pole motion is defined by the couple of components ( , ) in the plane (, , ) which is tangent to the North Pole (or in the equatorial plane). O represents a conventional origin, the axis , lies along the Greenwich meridian, and the axis , lies along the 90∘E meridian (see [57, 12] for more details).
3 Extraction and comparison of pseudo-periodic components
We have applied iterative Singular Spectrum Analysis (iSSA, eg. [58]) in order to extract the trend (first component) and the first periodic and pseudoperiodic components (next sub-section) from the time series of global temperature and length of day. SSA uses the mathematical properties of descending order diagonal matrices (Hankel, Toeplitz matrices; see Lemmerling and Van Huffel[59]) and their orthogonalization by singular value decomposition (SVD, Golub and Reinsch[60]).
3.1 The first two components
A quick look at the relative amounts of information carried by the monthly mean curves of temperature HadCrut5 (Figure 1) versus lod (Figure 2) leads one to conclude that the comparison is unlikely to be worthwhile beyond three components. Let us look at the first two.
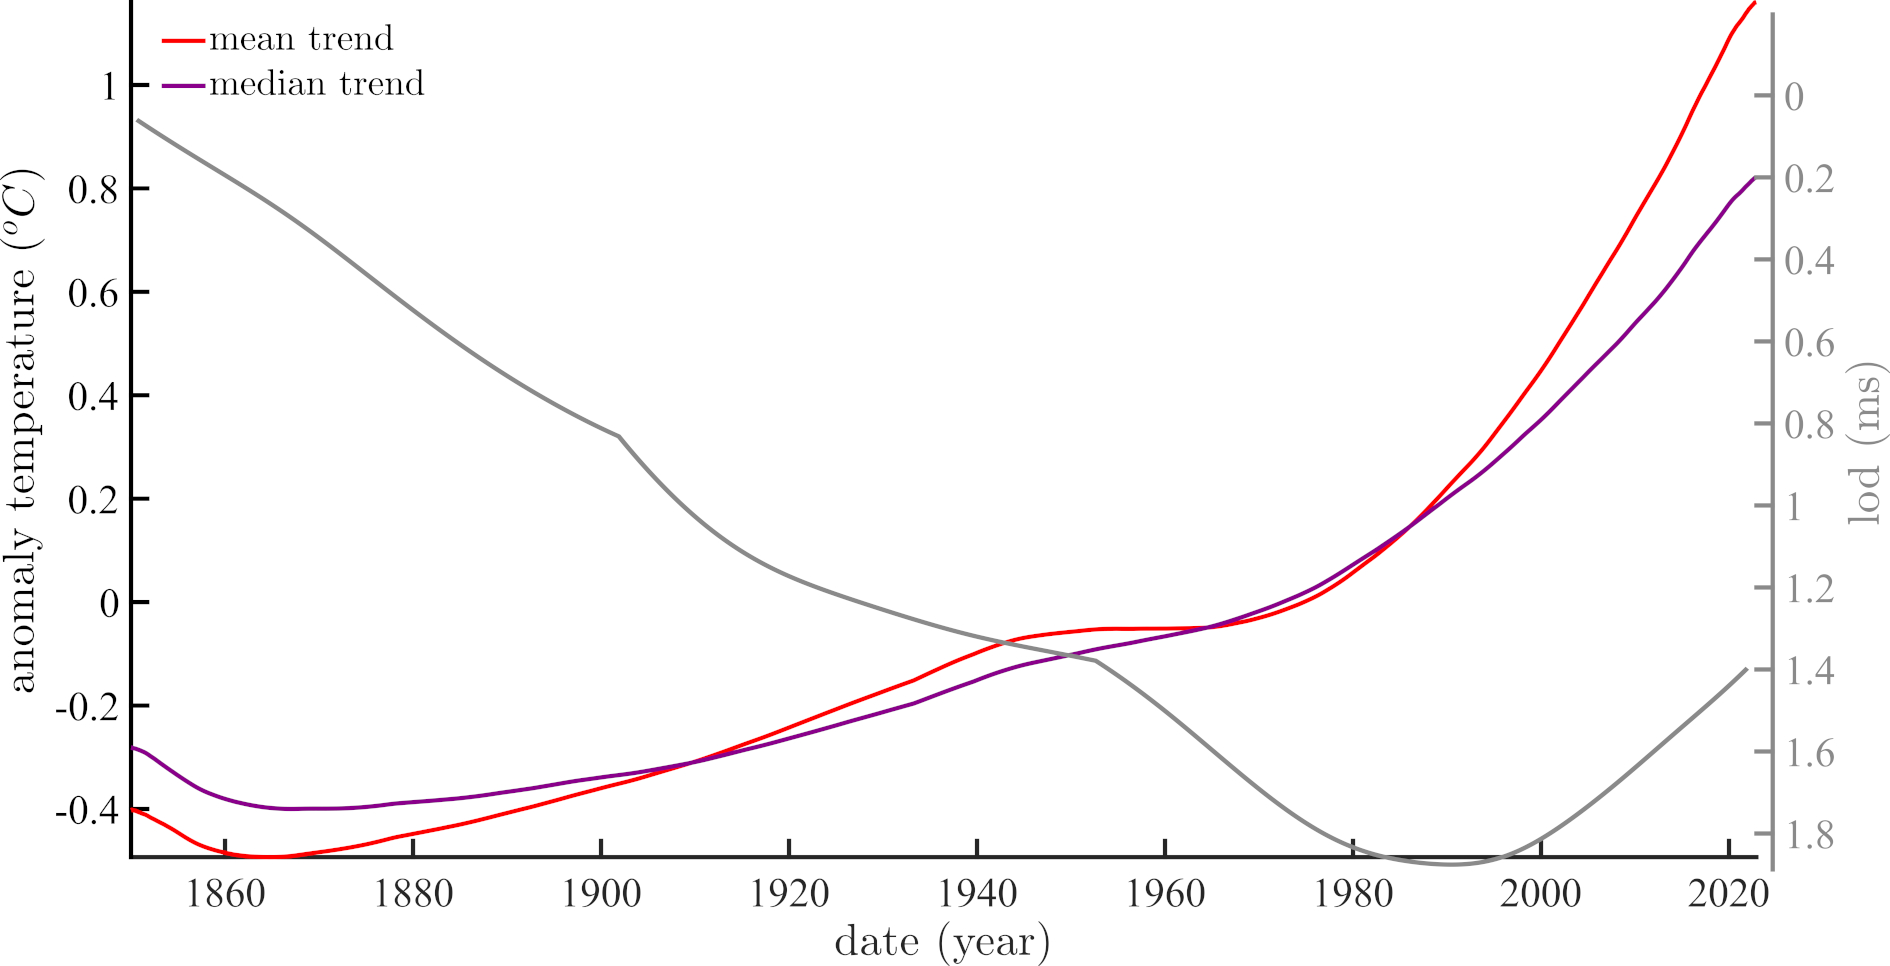
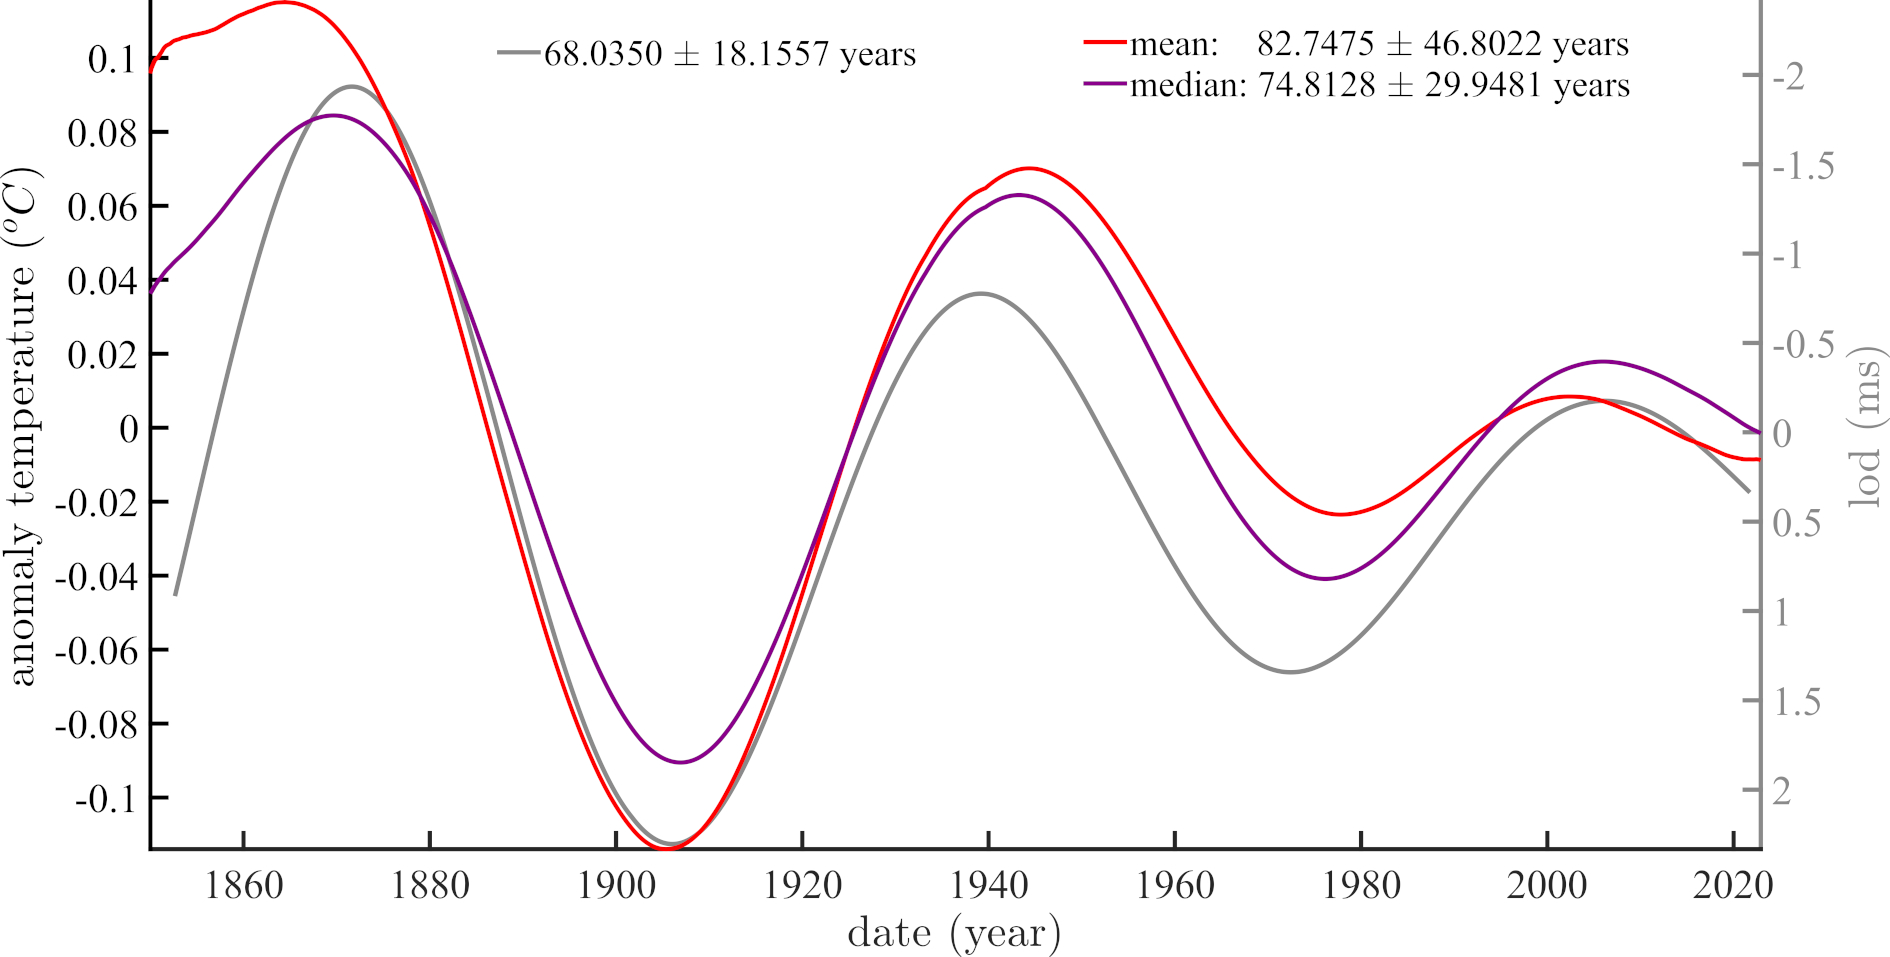
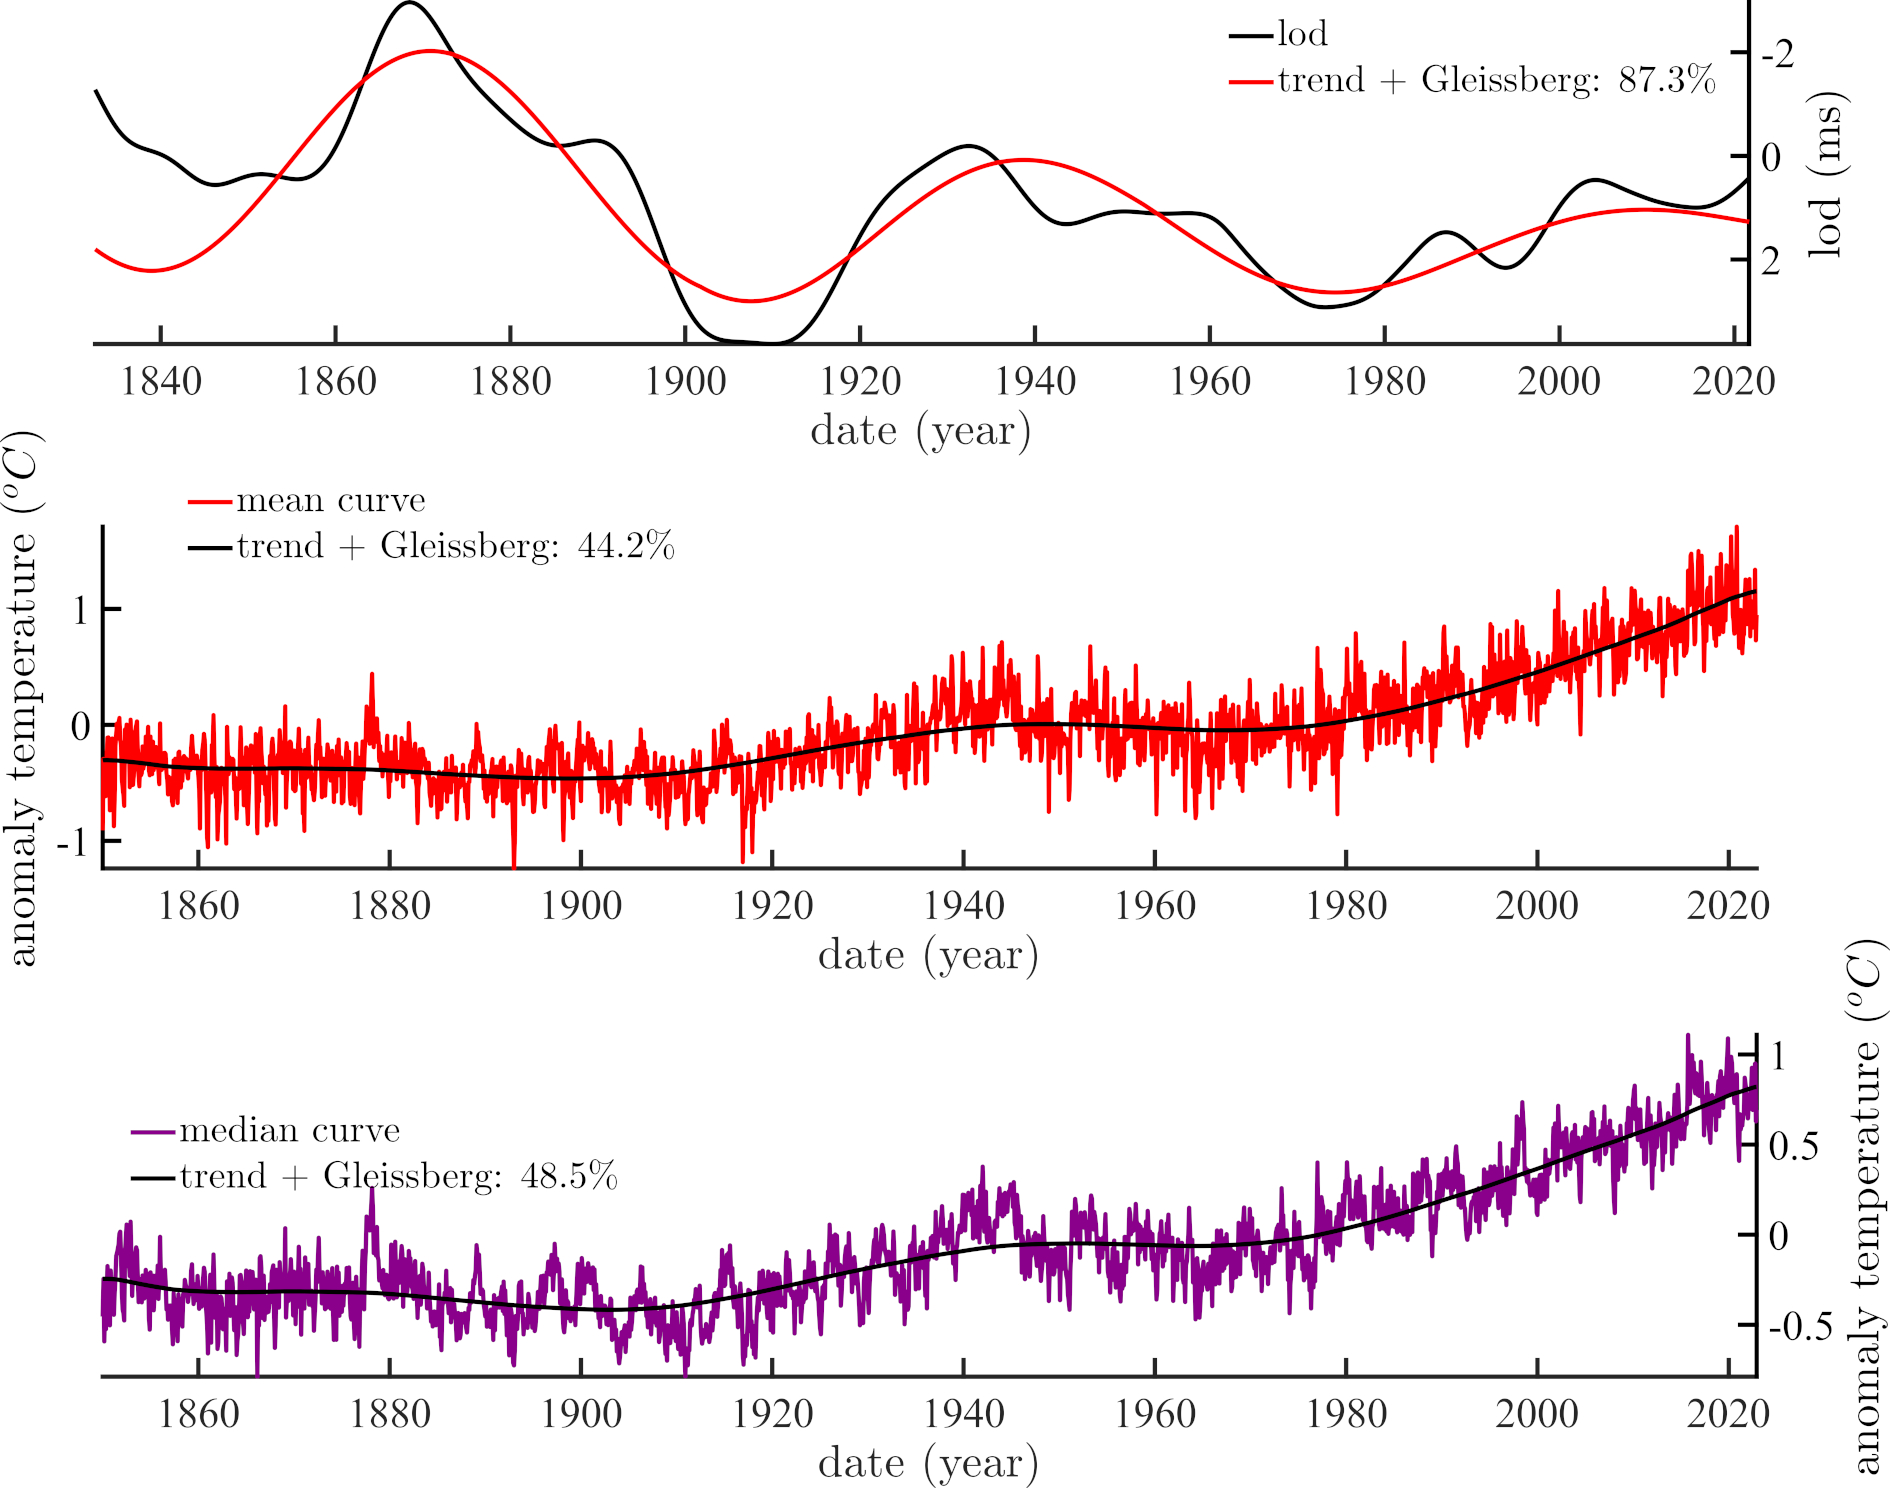
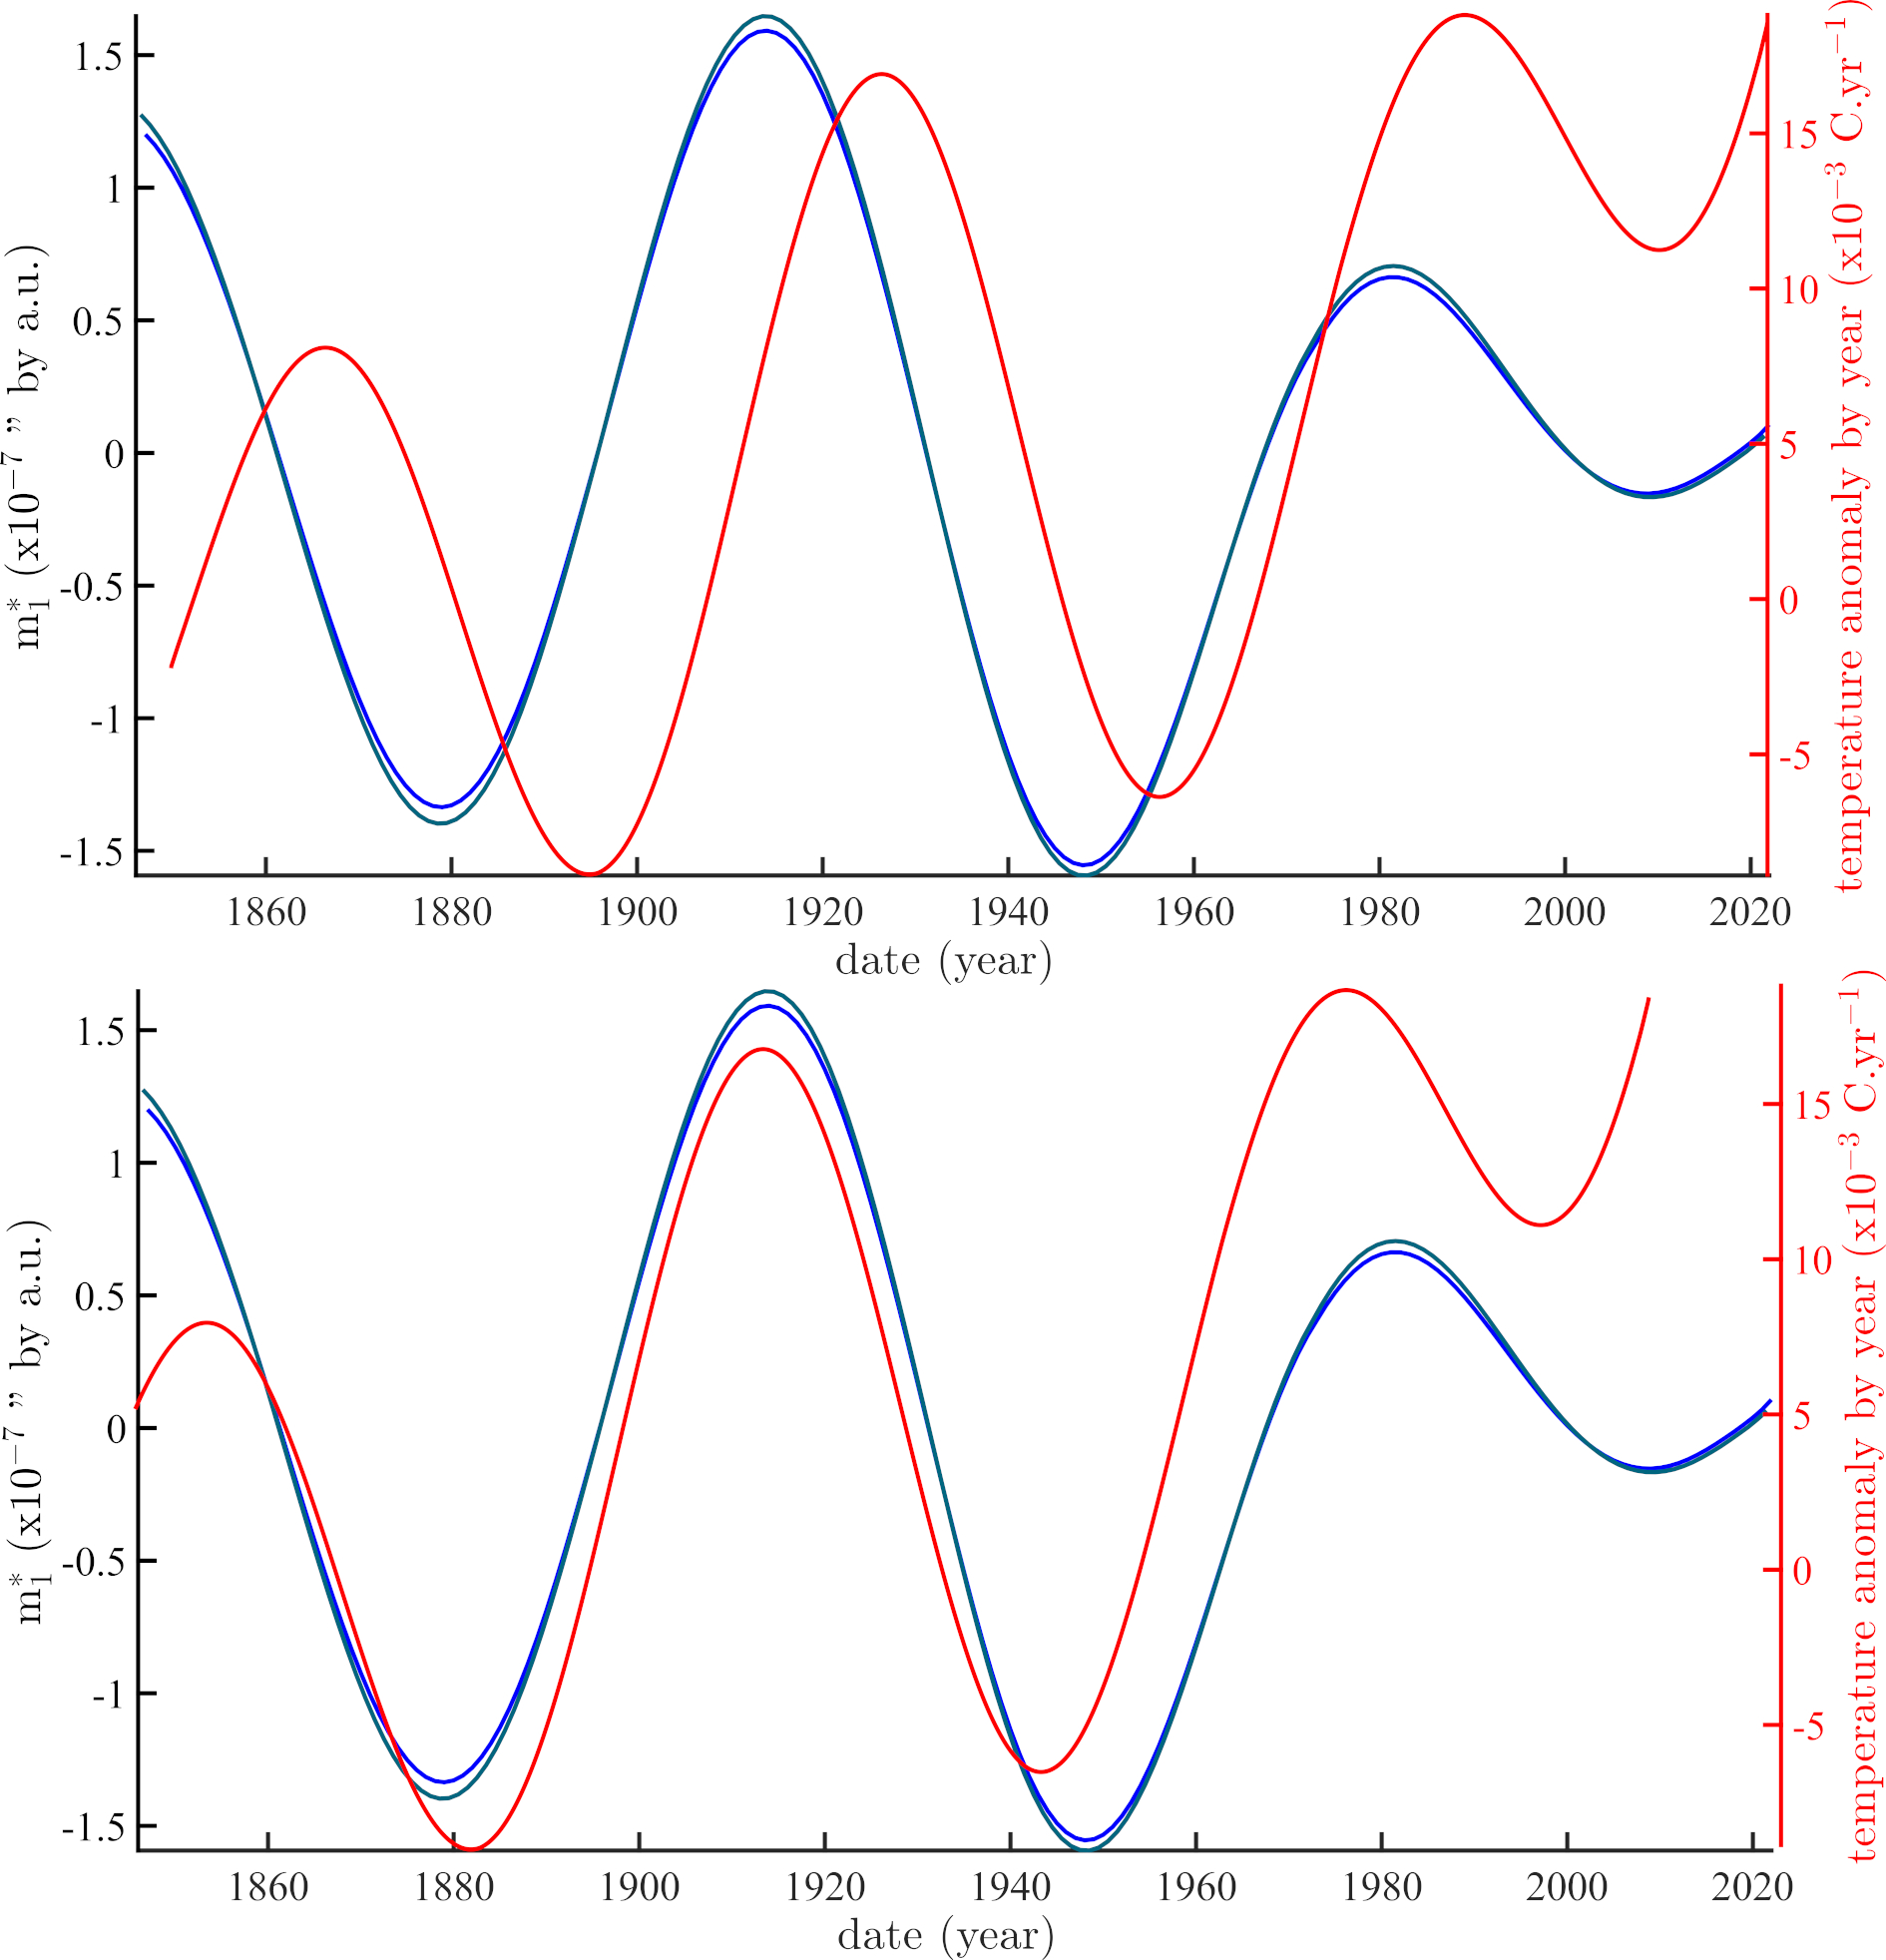
Figures 4 and 5 display the first two iSSA components (trend and 80 to 90 year Gleissberg cycle) for the three time series of temperature (mean and median) and lod. As usual, we will draw no conclusions from the trends, which can be represented mathematically by either high-order polynomials or pseudo-cycles. One can guess some long term anti-correlation between the two low-degree trends (Figure 4), with superimposed weak multi-decadal oscillations. On the other hand, the correlations of what we interpret as expressions of the Gleissberg cycle (Figure 5) are truly remarkable, and the main finding of this paper. We show in Figure 6 the reconstructed curves with only the trend and Gleissberg cycle included; the variance of the data captured by this simple model is respectively 87% for lod, and 44 and 48% for the mean and median temperatures respectively.
3.2 The derivative of (IERS rotation pole coordinate) as a proxy of lod.
As seen in Figure 5, the correlation of the Gleissberg cycles of temperature and length of day is remarkable both in phase and amplitude. In Lopes et al. ([12]) and Le Mouël et al. ([27]), we have shown (based on actual observations) that lod and mean polar motion should be linked by a simple derivative operator, as demonstrated in theory by Lagrange ([53]) and Laplace ([9]). Therefore, we have computed the derivative of (or as well) and extracted its iSSA components as in Lopes et al. ([44]). Indeed, Figure 3 confirms that the derivative of is an excellent proxy of lod variations since 1846.
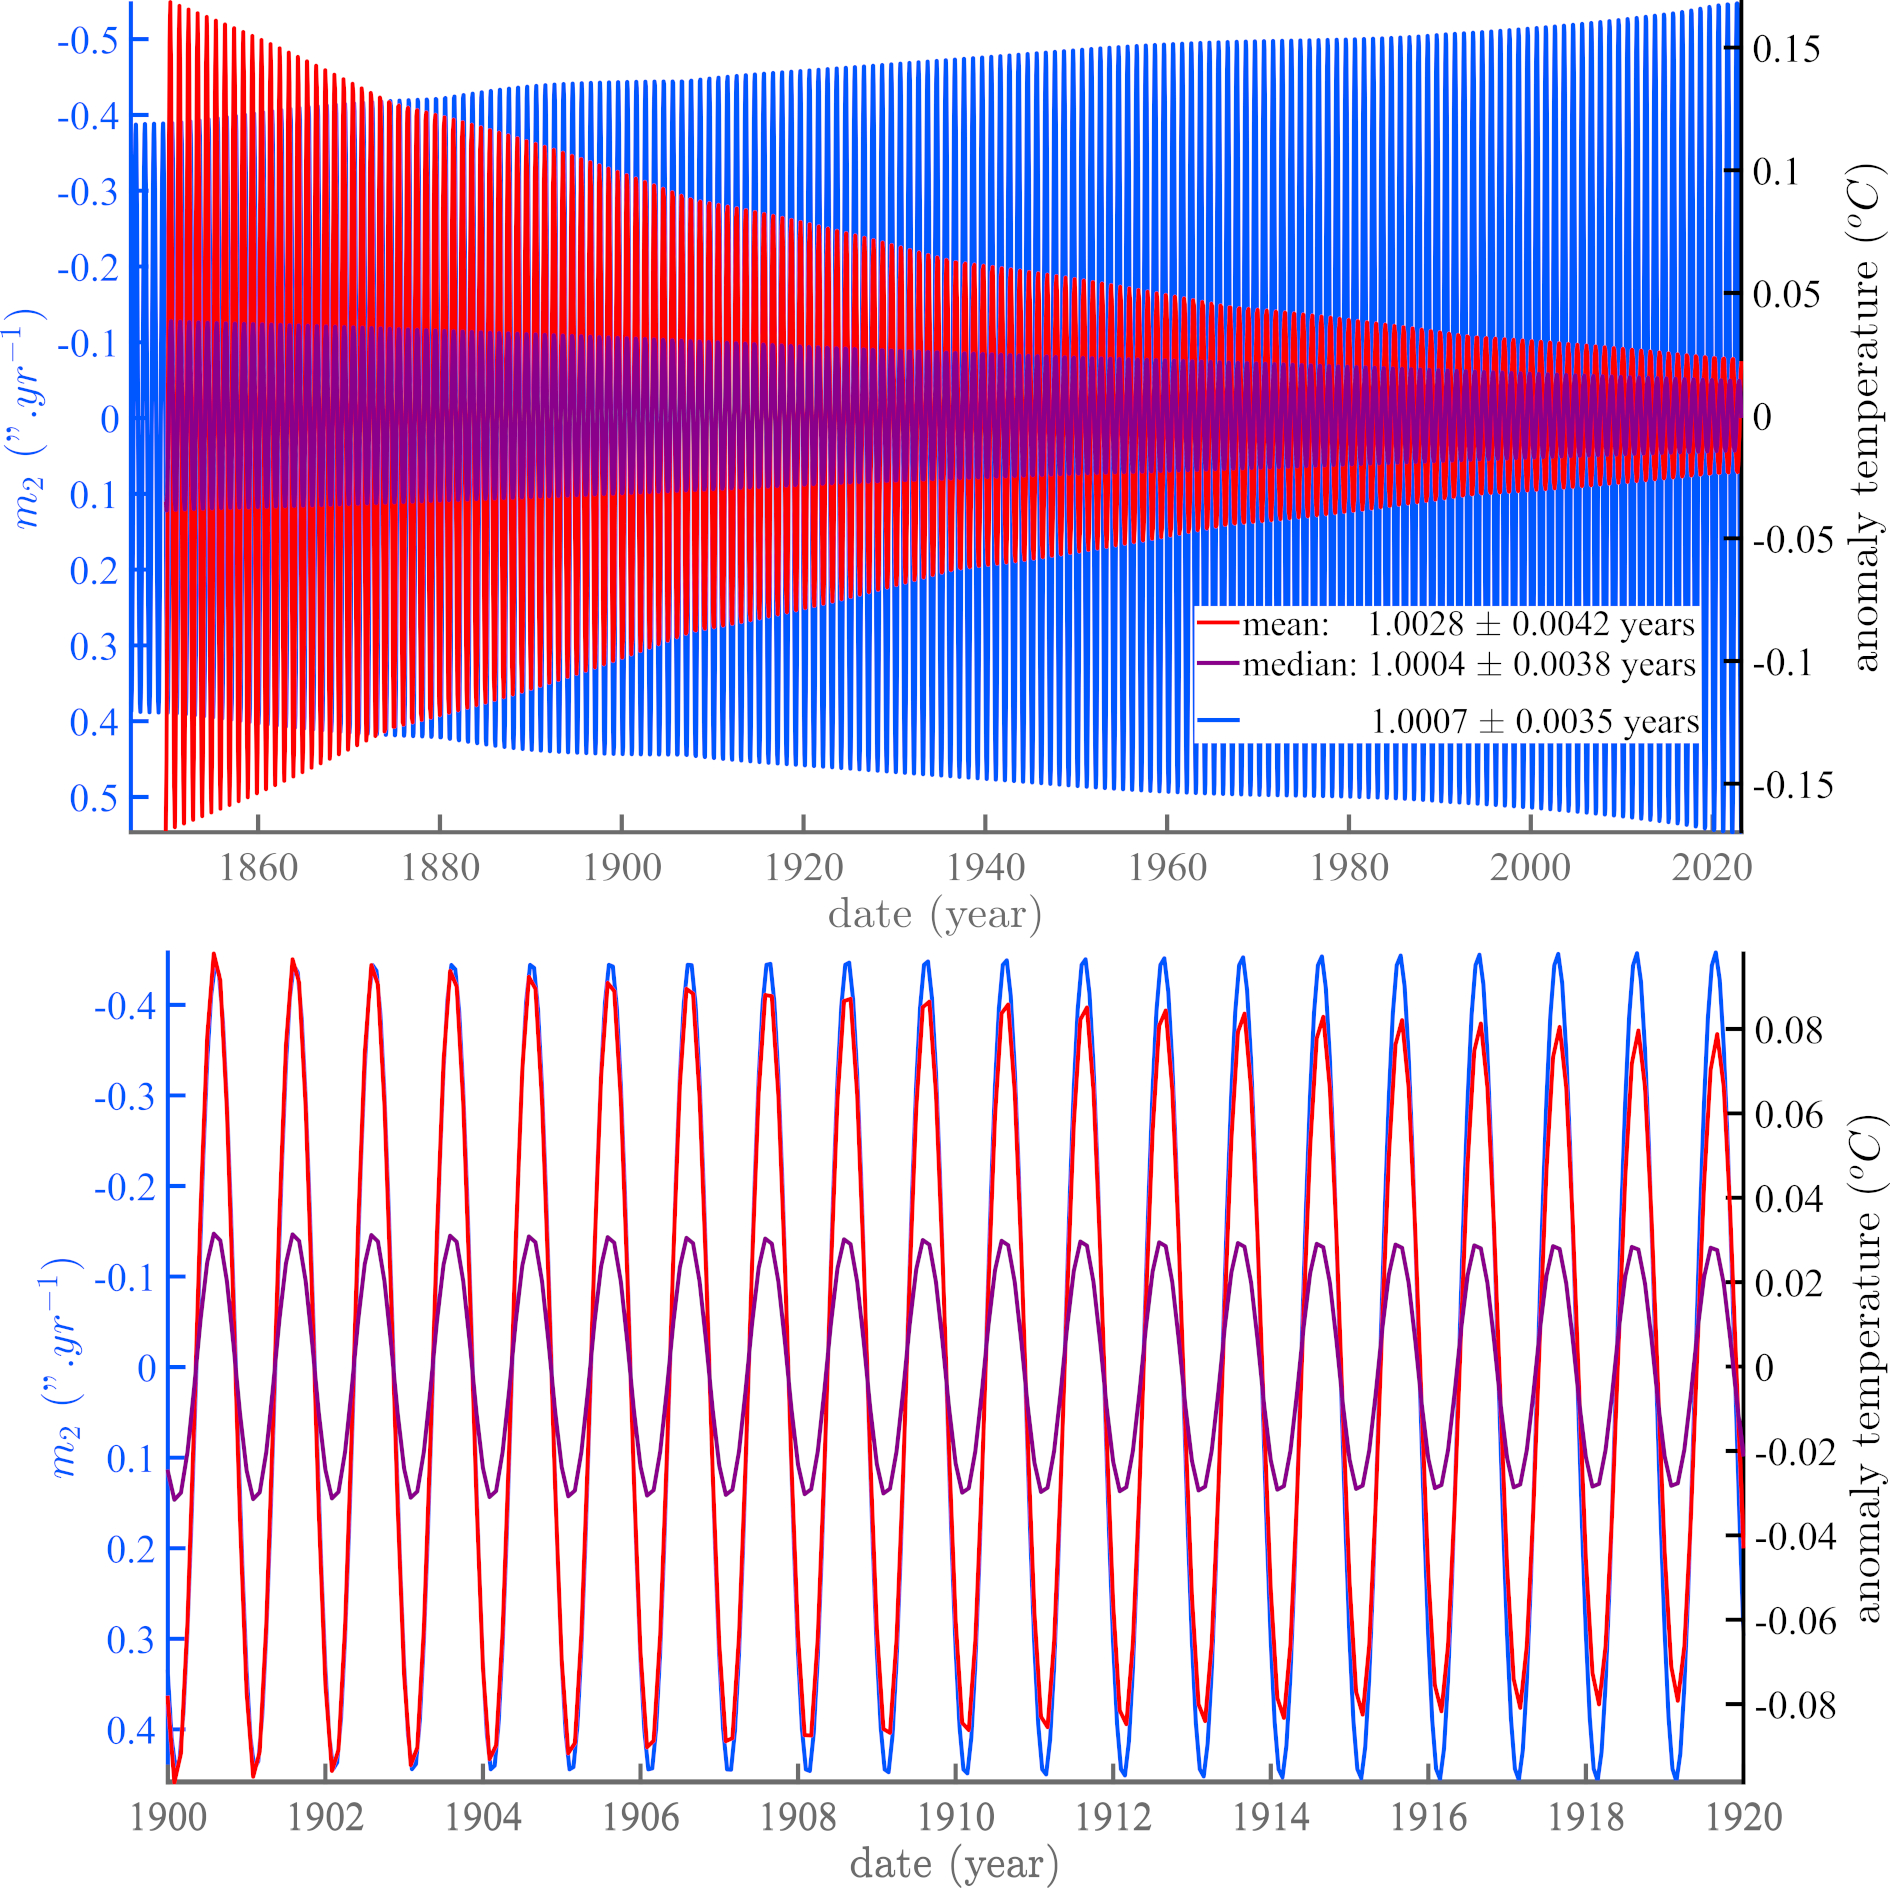
The first three components of polar motion are in decreasing order the trend, also called Markowitz([61])-Stoyko([62]) drift, the Chandler([63, 64]) free oscillation and the forced annual oscillation (eg. Lambeck [10] chapter 7; [45, 49]). In comparison, the temperature curve has a trend (discussed in the previous section) and an annual component but no equivalent of the Chandler oscillation. The forced annual oscillations of mean and median temperatures and length of day can be compared in Figure 7. The temperature and lod components are in phase opposition (note that the positive direction of the ordinate is arbitrary). We have shown in Lopes et al. ([12]) that the annual oscillations of pole motion and lod were directly linked (as in the Lagrange theory) to annual variations of the Sun-Earth distance. We see here that such remains the case, at least as far as the phases of temperature components are concerned. This is in agreement with an astronomical/gravitational origin of the annual pole motion as understood by Milanković ([7]), but on the contrary in contradiction with a climatic origin as preferred by Lambeck ([10], chapter 7, page 146) ”The principal seasonal oscillation in the wobble is the annual term which has generally been attributed to a geographical redistribution of mass associated with meteorological causes”.
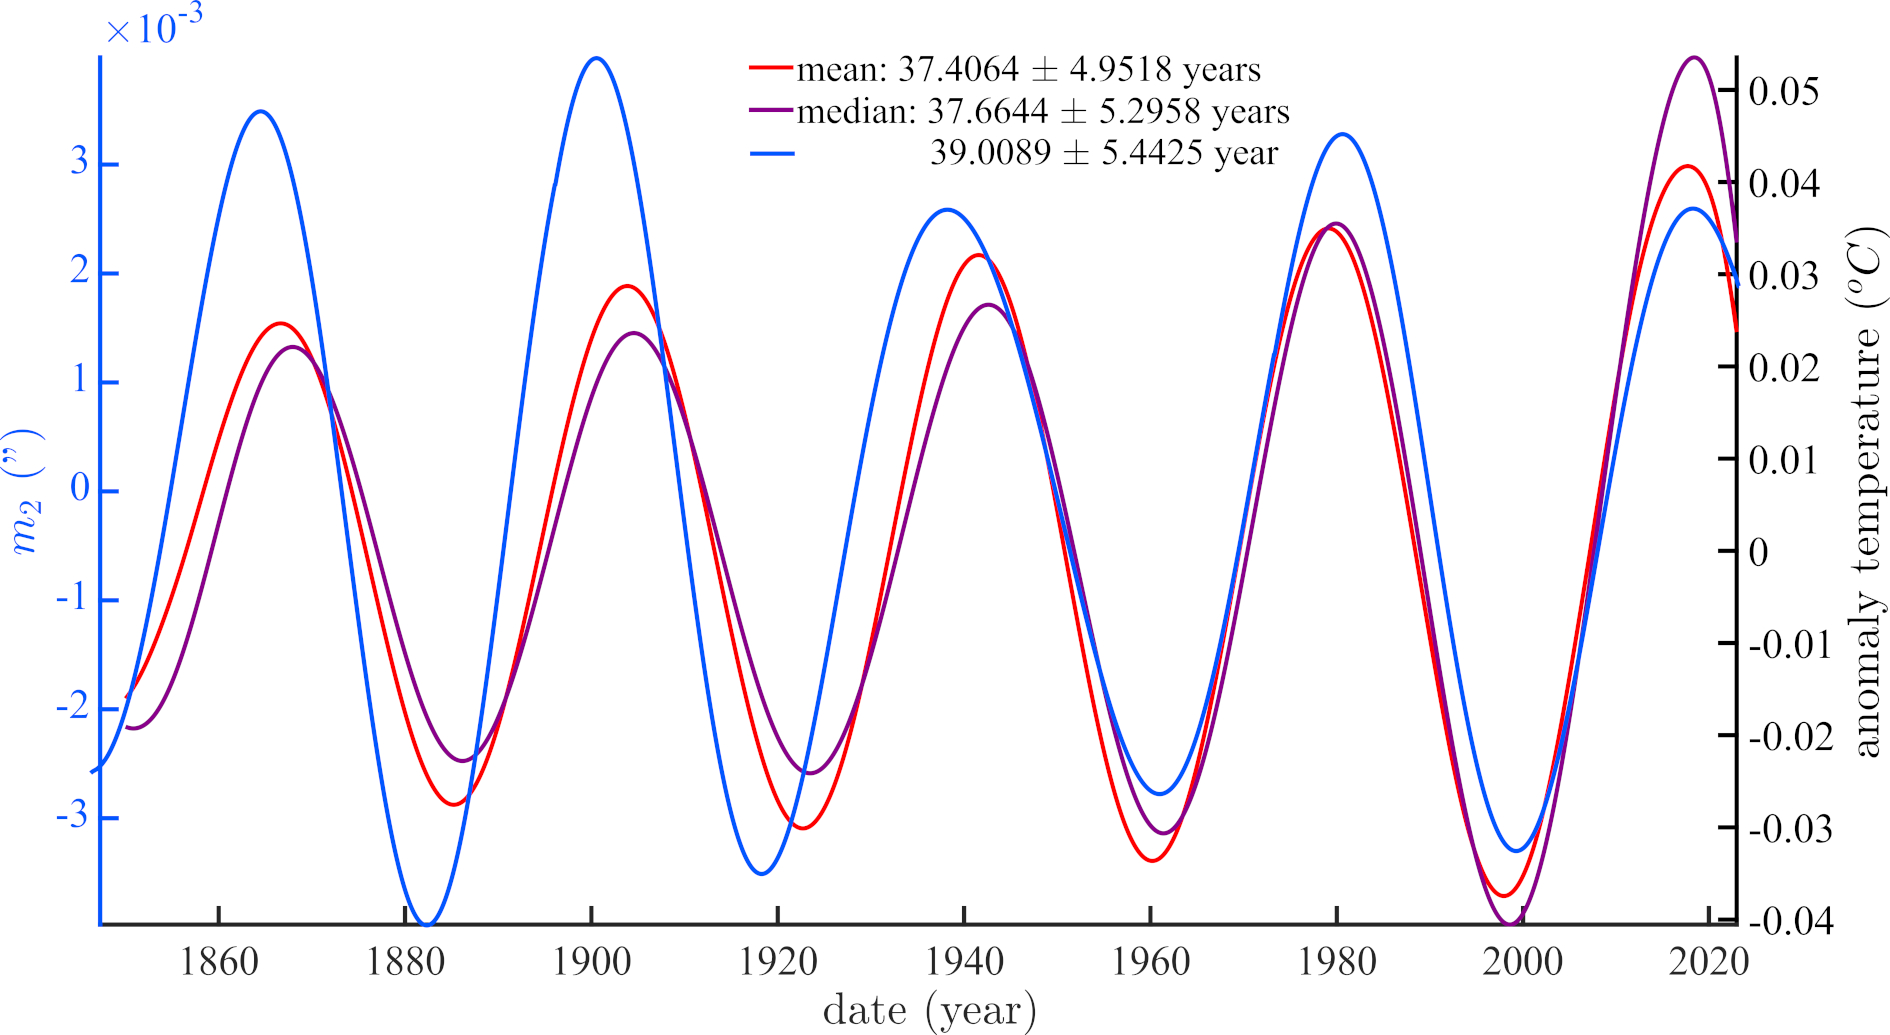
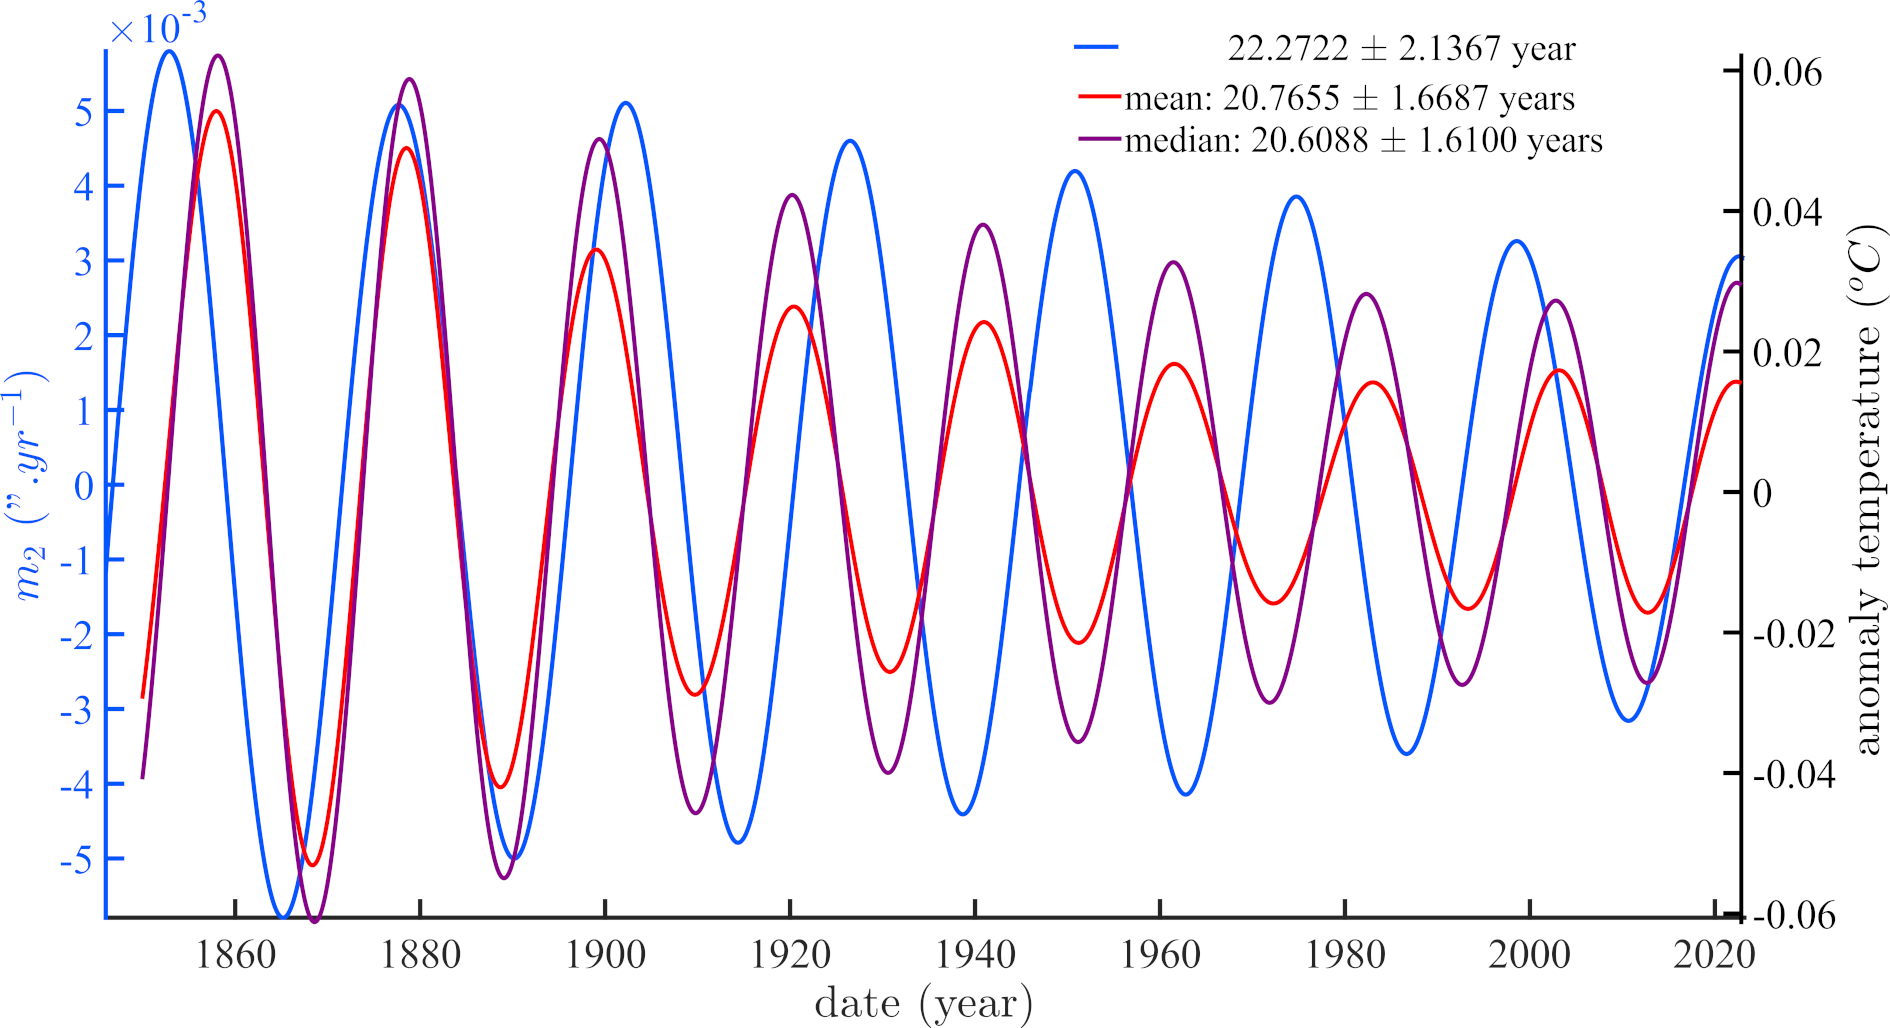
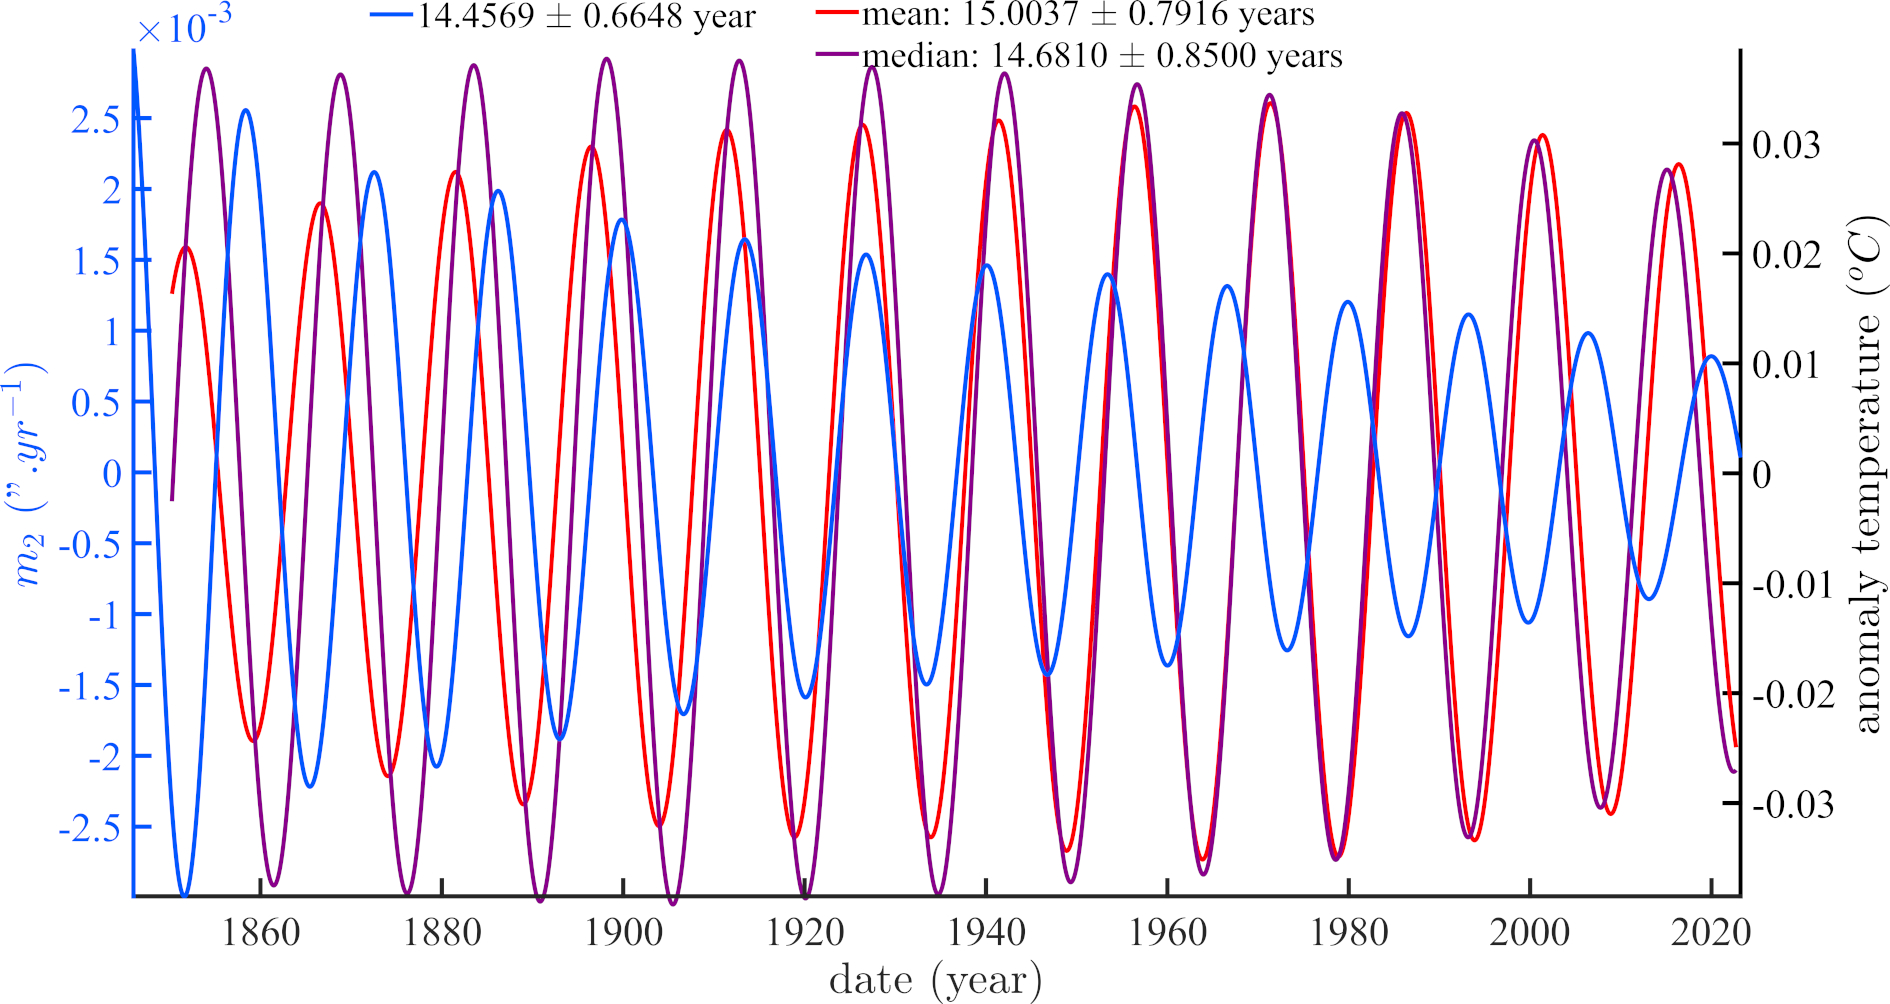
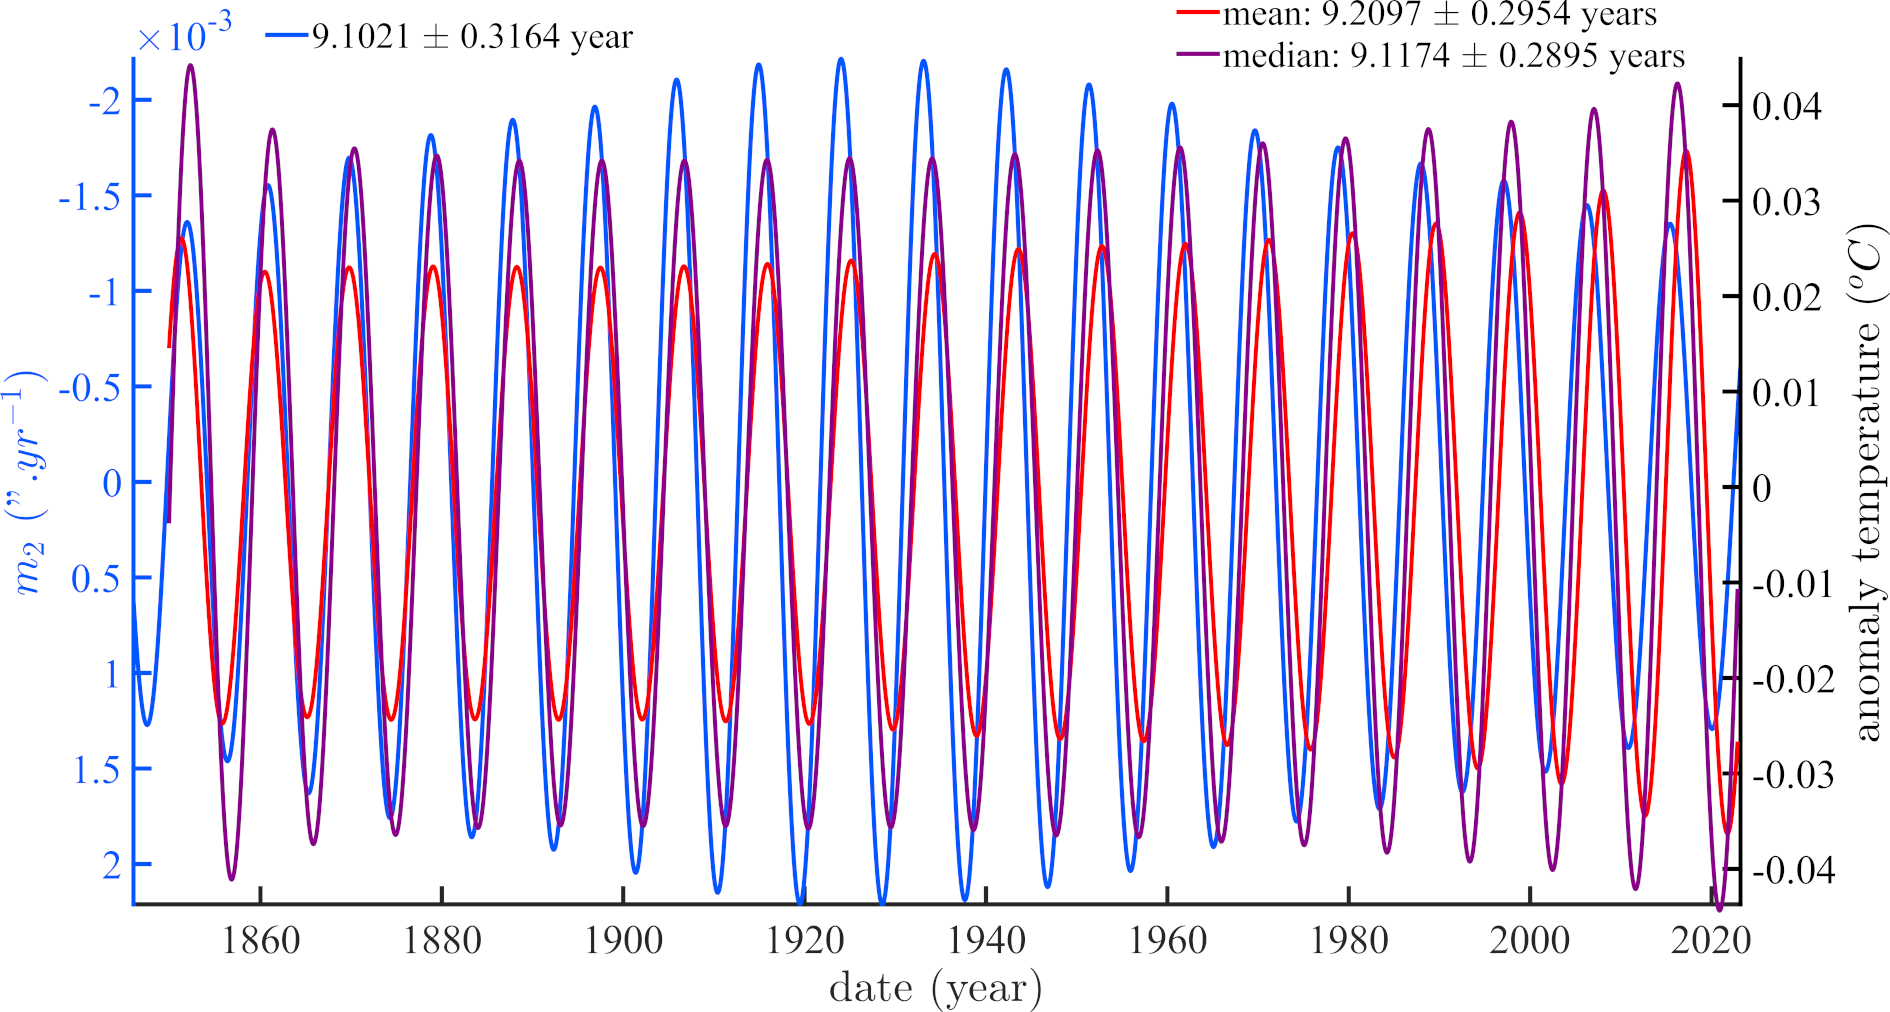
After having shown the trend and Gleissberg (90 yr) components, we briefly discuss the next four iSSA components common to lod and HadCrut5 temperatures, in order of decreasing period. They are displayed in Appendix A in order to make the paper lighter. These components have periods of 40, 22, 15 and 9 years (Figures A.1 to A.4). The components common to temperature and the polar motion, with periods of 40 and 9 years, appear to more or less remain in phase throughout the entire observation series. This is not the case for the cycles of 22 and 15 years. We observed the same behavior regarding the phases, for the same common pseudo-cycles, when we compared the pole motion to the global volcanic eruption series (see [65]).
Table 1 lists the periods of the periodic (or pseudo-periodic) components common to the three time series, together with their uncertainties. This list is now well known and misses only a 30 yr component. A more exhaustive list is given by Le Mouël et al. ([18]) and Lopes et al. ([44]) for lod and polar motion, and by Le Mouël et al. ([41]) for HadCrut5 temperatures.
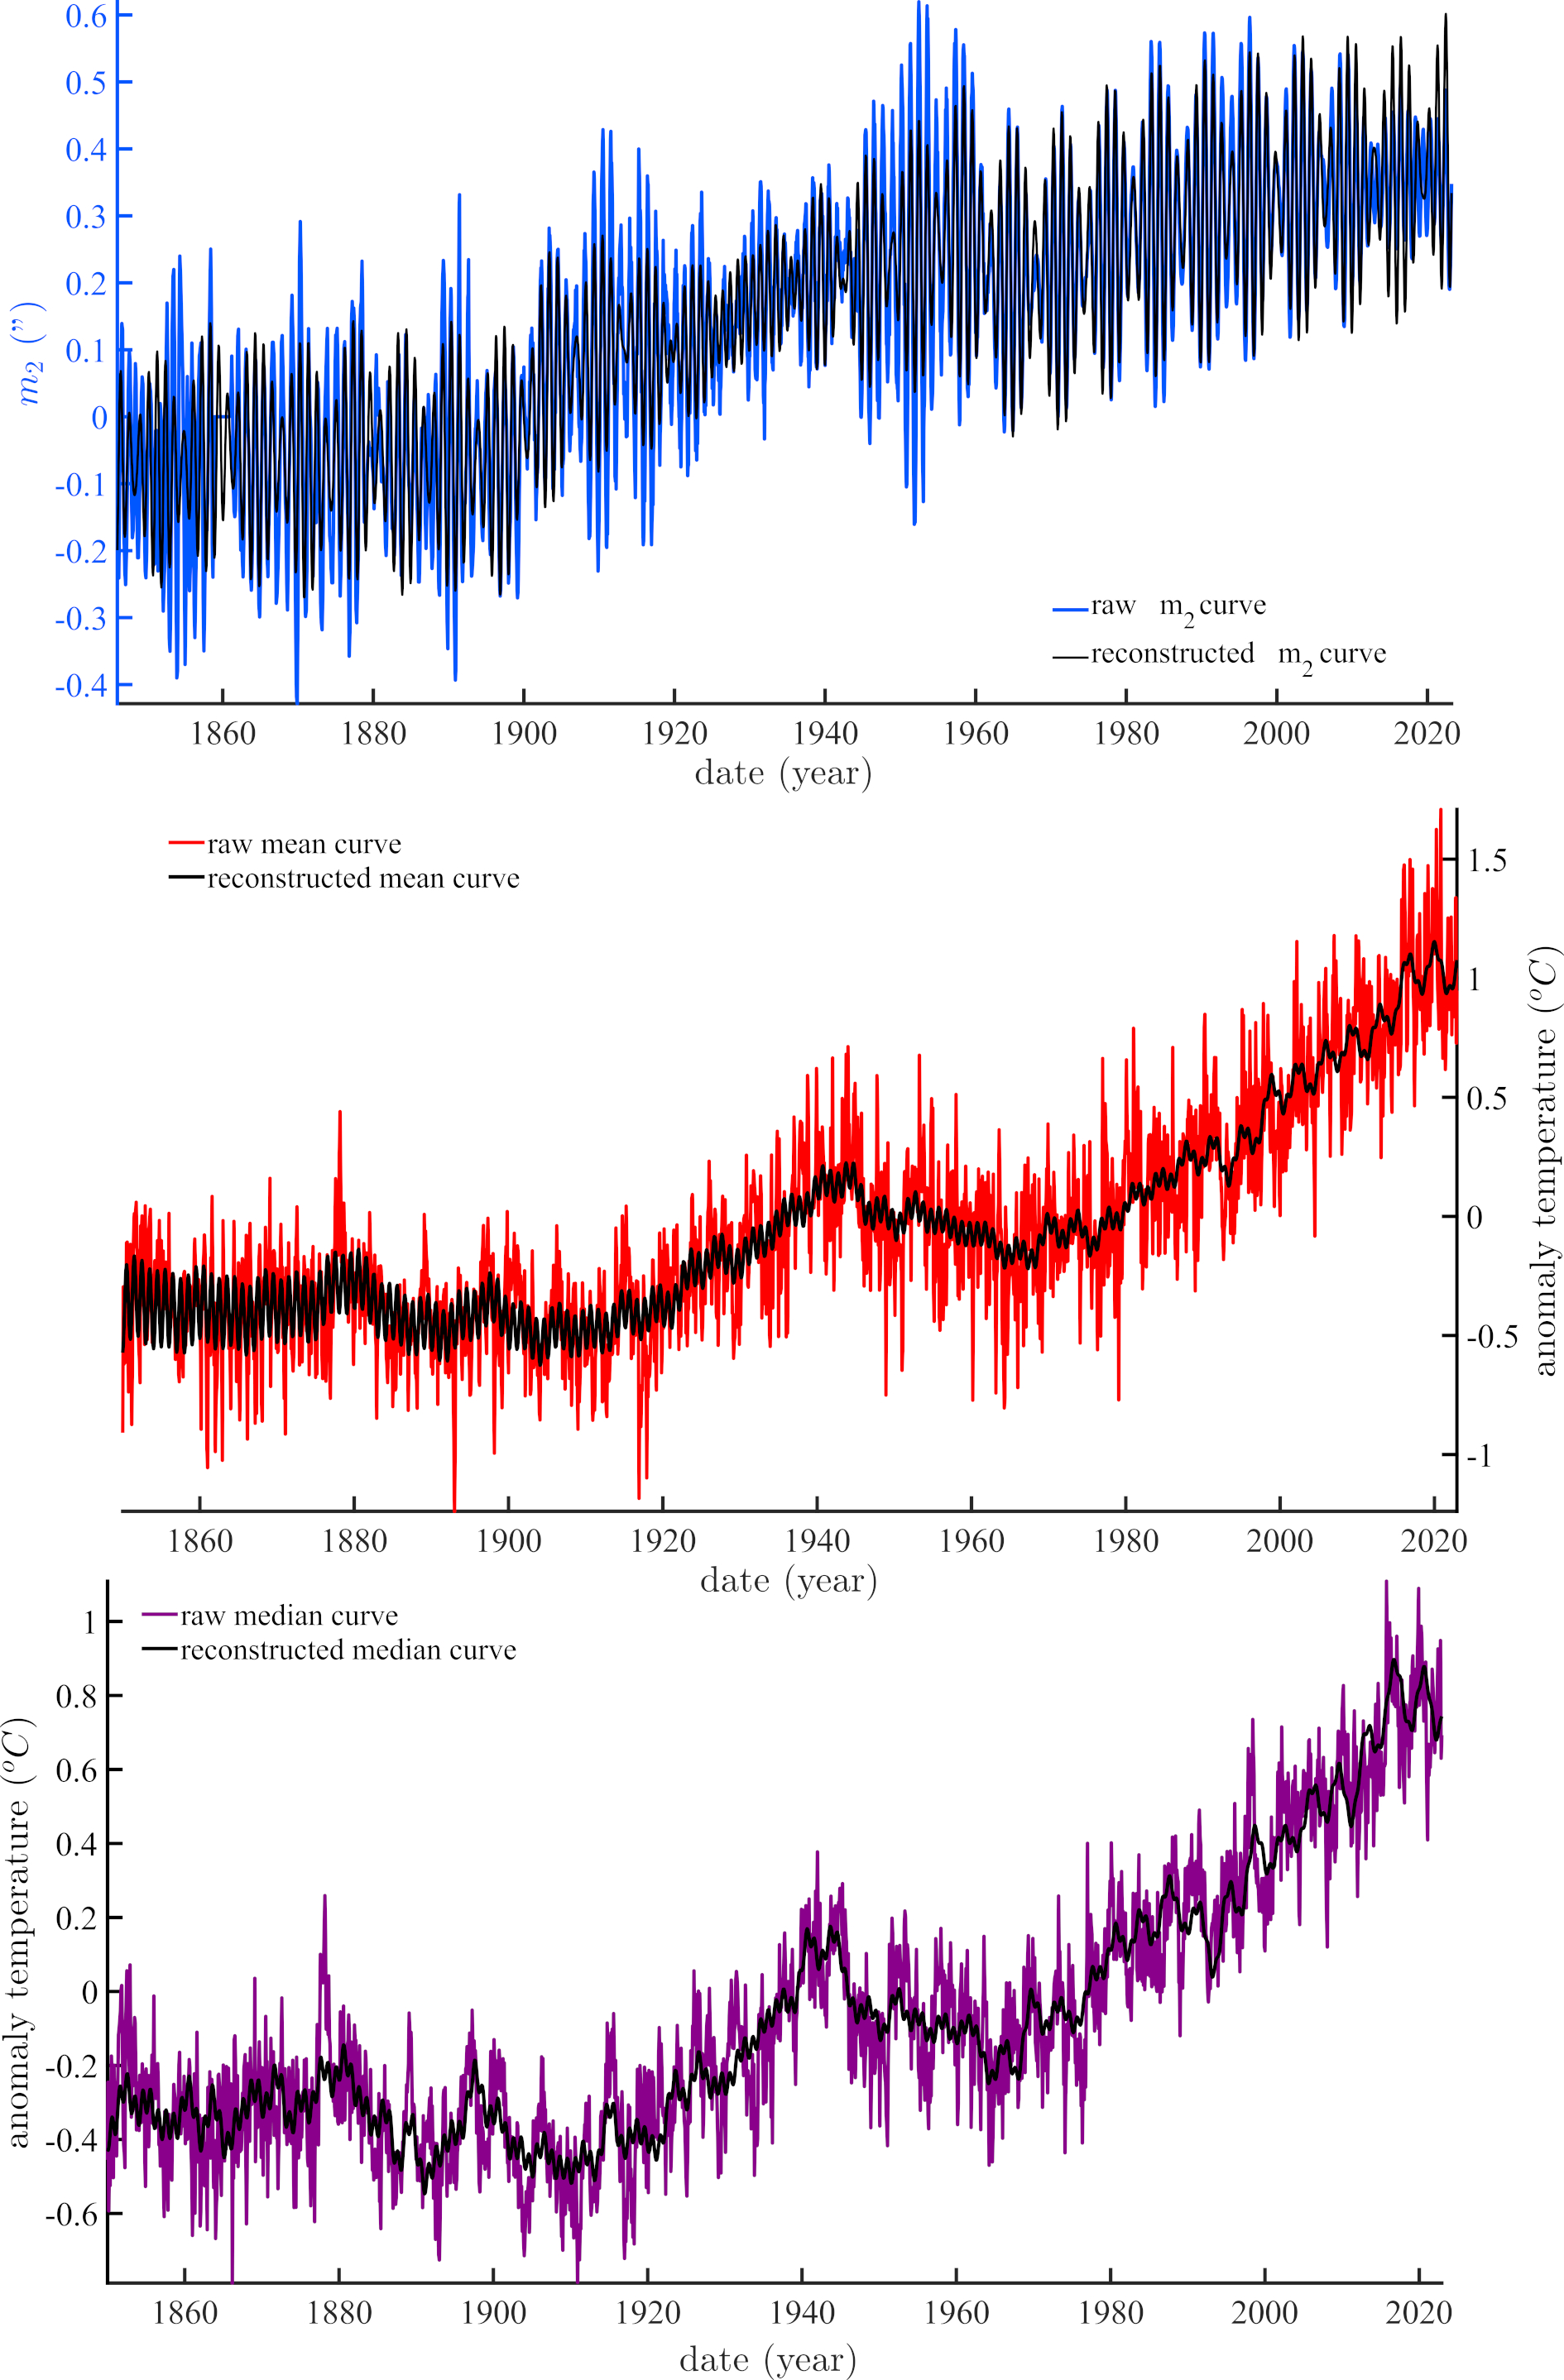
When one adds the 6 common components, the reconstructed series capture respectively 49% (mean temperature), 63% (median temperature), and 69% ( component of polar motion) of the original series variance. The reconstructed curves are shown in black in Figure 8, where the trends have been added.
| mean curve | mediane curve | |
|---|---|---|
| 68.03 18.16 | 82.75 46.80 | 74.81 29.95 |
| 39.01 5.44 | 37.41 4.95 | 37.66 5.29 |
| 22.27 2.14 | 20.77 1.67 | 20.61 1.61 |
| 14.46 0.07 | 15.01 0.80 | 14.68 0.85 |
| 9.10 0.32 | 9.21 0.30 | 9.12 0.29 |
| 1.00 0.01 | 1.00 0.01 | 1.01 0.01 |
4 Discussion and Conclusion
This paper is part of a series in which we find strong evidence of solar and planetary forcings of gravitational nature on a number of natural geophysical processes, such as variations of length of day, sea-level, sea-level pressure, extent of sea-ice, the main climatic indices, In the present paper, we focus on the database of surface temperature anomalies that is put forward in the latest IPCC AR6 report ([3]).
We have first recalled that the Milanković ’s ([7]) mathematical theory of climates links the rotation and revolution periods of planets to the amount of heat (insolation) they receive (see also Laskar et al. [54, 66]; Lopes et al. [8]). The inclination of the rotation axis and the amount (duration) of insolation force the temperature at any point given by its latitude and longitude, as envisioned by Laplace ([9]).We have recently extended the Milanković ’s theory to the range of periods from 0 to 300 years
In order to estimate how much variations of planetary rotation could influence (force) surface temperature variations, as represented by the HadCrut5 data set, we have analyzed with iSSA the historical curves of lod from Stephenson and Morrison ([55]) and Gross ([56]). We have, somewhat conservatively, limited a detailed analysis to the first two components, the trend and the 90 yr Gleissberg cycle ([67, 68]). As shown in Figure 6, the sum of these two components accounts for 50% of the temperature variance. Figure 4 shows that the trends of lod and temperature are anti-correlated, the former decreasing by 1.8 ms as the latter increases by 1.3∘C. The most remarkable result is displayed in Figure 5 in which the Gleissberg cycles of length of day and temperature anomaly are seen to be almost perfectly correlated in phase and amplitude (modulation) over more than two cycles (since 1850). Note that given the uncertainties the periods of all three curves can be reasonably assumed to be the same.
In a previous study (Lopes et al. [44]), we have shown that the two components of polar motion (, ) can be decomposed on a base of pseudo-cycles with the same periods (see Table 1). We also know that temperature and lod share a number of more minor cycles (eg. [57, 41, 44, 32]). The extracted components with periods of 90, 40, 30, 22, 15, 9 and 1 yr) are displayed in Figures 5, A.1, A.2, A.3, A.4 and 7. Disregarding the trends, these 7 components represent respectively 49%, 63% and 69% of the original signal variance of . All the periods encountered are within uncertainty planetary commensurable periods, that is connected to the four giant (Jovian) planets (eg. [13, 14]).
The annual oscillation of temperature (and in general of climate and also of pole motion) is generally considered as evidence of a climatic forcing (eg. [10], chapter 7). But we (cf. [45, 46, 8, 27, 49]) and others have shown that this forced annual oscillation, be it recorded as variations of sea-ice extent, of sea-level, of lod, of polar motion, and even of the geomagnetic field, is clearly and precisely connected to the Earth ephemerdis in full agreement with the theories of Lagrange ([53]) and Laplace ([9]). The excellent phase coincidence shown in the zoom of Figure 7 (bottom) between the mean and median annual cycles of temperature and that of length of day (an external parameter as recalled by Lambeck ([10], chapter 03) implies a Lagrangian forcing of temperature for this precise period. This is the very idea of Milanković ([7]). Thus, one can conclude that reorganization of fluid masses is not the origin of this cycle.
We recall that in Lopes et al. ([8]) we showed that the trend (mean drift) of temperatures is closely connected to the precession of solstices, as predicted by d’Alembert ([69]). Given Milanković ’s ([7]) equation 20 (page 15), recalled in section 1, the mean insolation, ie. amount of heat received by Earth in a unit of time, is proportional to the inverse square of distance to the Sun. Thus, in Lopes et al. ([8]) we obtained Figure 9, in which the time derivative of the trend of temperature anomaly HadCrut5 is seen to correlate very well (with a phase difference) with the inverse of distance at the terrestrial solstices.
These two lines of observation (and reasoning) fully validate the joint use of Laplace ’s ([9]) and Milanković ’s ([7]) theories regarding measured surface temperatures. Variations in rotation and revolution lead to short period changes in temperature (and climate in general), whereas variations in the obliquity, precession and eccentricity of the rotation axis lead to much longer periods.
For Laplace as well as for Milanković , and more recently Laskar, who are interested in the longer periods, characteristic of paleo-climate changes, the parameters whose paleo-variations matter most, the important (i.e. the precession of equinoxes and longer) parameters are the position and orientation of the planet’s axis of rotation that governs the amount of heat received by the planet, hence its temperature. But for shorter time scales, as implied by Milankovic’s equation, one is dealing with climate at shorter periods (the ones we list from 1 to 90 years in particular).
Very unexpectedly, the detected periodicities extracted from the temperature anomalies, as well as their in-phase behavior with the polar motion, are more than compatible with what we have recently highlighted by comparing the same polar motion with the global volcanic eruption series (see Le Mouël et al. [65]). Whether this is a coincidence will be the topic of further work.
Appendix A iSSA components 3 to 6 (or 4 to 7 if Chandler counted but not common).
References
- [1] C. P. Morice, J. J. Kennedy, N. A. Rayner, J. Winn, E. Hogan, R. Killick, R. Dunn, T. Osborn, P. Jones, and I. Simpson, “An updated assessment of near-surface temperature change from 1850: The hadcrut5 data set,” Journal of Geophysical Research: Atmospheres, vol. 126, no. 3, p. e2019JD032361, 2021.
- [2] T. J. Osborn, P. D. Jones, D. H. Lister, C. P. Morice, I. R. Simpson, J. Winn, E. Hogan, and I. C. Harris, “Land surface air temperature variations across the globe updated to 2019: The crutem5 data set,” Journal of Geophysical Research: Atmospheres, vol. 126, no. 2, p. e2019JD032352, 2021.
- [3] V. Masson-Delmotte, P. Zhai, A. Pirani, S. L. Connors, C. Péan, S. Berger, N. Caud, Y. Chen, L. Goldfarb, M. Gomis, et al., “Climate change 2021: the physical science basis,” Contribution of working group I to the sixth assessment report of the intergovernmental panel on climate change, vol. 2, 2021.
- [4] P. Thorne, D. Parker, B. Santer, M. P. McCarthy, D. Sexton, M. Webb, J. Murphy, M. Collins, H. Titchner, and G. Jones, “Tropical vertical temperature trends: A real discrepancy?,” Geophysical Research Letters, vol. 34, no. 16, 2007.
- [5] D. H. Douglass, J. R. Christy, B. D. Pearson, and S. F. Singer, “A comparison of tropical temperature trends with model predictions,” International Journal of Climatology: A Journal of the Royal Meteorological Society, vol. 28, no. 13, pp. 1693–1701, 2008.
- [6] B. D. Santer, P. Thorne, L. Haimberger, K. E. Taylor, T. Wigley, J. Lanzante, S. Solomon, M. Free, P. J. Gleckler, P. Jones, et al., “Consistency of modelled and observed temperature trends in the tropical troposphere,” International Journal of Climatology: A Journal of the Royal Meteorological Society, vol. 28, no. 13, pp. 1703–1722, 2008.
- [7] M. Milankovic, Théorie mathématique des phénomènes thermiques produits par la radiation solaire. Gauthier-Villars, 1920.
- [8] F. Lopes, V. Courtillot, D. Gibert, and J.-L. Le Mouël, “Extending the range of milankovic cycles and resulting global temperature variations to shorter periods (1–100 year range),” Geosciences, vol. 12, no. 12, p. 448, 2022.
- [9] P. S. Laplace, Traité de Mécanique Céleste. Imprimerie de Crapelet: Paris, France, 1799.
- [10] K. Lambeck, The Earth’s variable rotation: geophysical causes and consequences. Cambridge University Press, 2005.
- [11] F. Lopes, V. Courtillot, D. Gibert, J. Le Mouël, and B. J.B, “On distributions law of planetary rotations and revolutions as a function of aphelia, following lagrange’s formulation,” arXiv preprint arXiv:2209.07213, 2022.
- [12] F. Lopes, V. Courtillot, D. Gibert, and J.-L. L. Mouël, “On two formulations of polar motion and identification of its sources,” Geosciences, vol. 12, no. 11, p. 398, 2022.
- [13] H. Mörth and L. Schlamminger, “Planetary motion, sunspots and climate,” in Solar-Terrestrial Influences on Weather and Climate: Proceedings of a Symposium/Workshop held at the Fawcett Center for Tomorrow, The Ohio State University, Columbus, Ohio, 24–28 August, 1978, pp. 193–207, Springer, 1979.
- [14] M. J. Bank and N. Scafetta, “Scaling, mirror symmetries and musical consonances among the distances of the planets of the solar system,” Frontiers in Astronomy and Space Sciences, vol. 8, p. 758184, 2022.
- [15] N. Scafetta and A. Bianchini, “Cthe planet theory of solar activity variability, a review,” Frontiers Astronomical and Space Sciences, vol. 9, 2022.
- [16] C. J. Lyons, “Sun spots and hawaiian eruptions,” Monthly Weather Review, vol. 27, no. 4, pp. 144–144, 1899.
- [17] J. Bartels, “Terrestrial-magnetic activity and its relations to solar phenomena,” Terrestrial Magnetism and Atmospheric Electricity, vol. 37, no. 1, pp. 1–52, 1932.
- [18] J. Le Mouël, F. Lopes, V. Courtillot, and D. Gibert, “On forcings of length of day changes: From 9-day to 18.6-year oscillations,” Physics of the Earth and Planetary Interiors, vol. 292, pp. 1–11, 2019.
- [19] J. Le Mouël, F. Lopes, and V. Courtillot, “Singular spectral analysis of the aa and dst geomagnetic indices,” Journal of Geophysical Research: Space Physics, vol. 124, no. 8, pp. 6403–6417, 2019.
- [20] S. Dumont, J.-L. Le Mouël, V. Courtillot, F. Lopes, F. Sigmundsson, D. Coppola, E. P. Eibl, and C. J. Bean, “The dynamics of a long-lasting effusive eruption modulated by earth tides,” Earth and Planetary Science Letters, vol. 536, p. 116145, 2020.
- [21] D. Zaccagnino, F. Vespe, and C. Doglioni, “Tidal modulation of plate motions,” Earth-science reviews, vol. 205, p. 103179, 2020.
- [22] S. Dumont, G. Silveira, S. Custódio, F. Lopes, J.-L. Le Mouël, M. Gouhier, and Y. Guéhenneux, “Response of fogo volcano (cape verde) to lunisolar gravitational forces during the 2014–2015 eruption,” Physics of the Earth and Planetary Interiors, vol. 312, p. 106659, 2021.
- [23] F. Lopes, J. Le Mouël, V. Courtillot, and D. Gibert, “On the shoulders of laplace,” Physics of the Earth and Planetary Interiors, vol. 316, p. 106693, 2021.
- [24] S. Dumont, S. Custodio, S. Petrosino, A. M. Thomas, and G. Sottili, “Tides, earthquakes, and volcanic eruptions,” A Journey through Tides, 2022.
- [25] S. Petrosino and S. Dumont, “Tidal modulation of hydrothermal tremor: Examples from ischia and campi flegrei volcanoes, italy,” Frontiers in Earth Science, vol. 9, p. 775269, 2022.
- [26] D. Zaccagnino, L. Telesca, and C. Doglioni, “Correlation between seismic activity and tidal stress perturbations highlights growing instability within the brittle crust,” Scientific Reports, vol. 12, no. 1, p. 7109, 2022.
- [27] J. Le Mouël, F. Lopes, V. Courtillot, D. Gibert, and J. Boulé, “Is the earth’s magnetic field a constant? on seasonal variations of the geomagnetic field: a legacy of poisson,” arXiv preprint arXiv:2303.09235, 2023.
- [28] F. Stefani, A. Giesecke, N. Weber, and T. Weier, “Synchronized helicity oscillations: A link between planetary tides and the solar cycle?,” Solar Physics, vol. 291, no. 8, pp. 2197–2212, 2016.
- [29] F. Stefani, A. Giesecke, and T. Weier, “A model of a tidally synchronized solar dynamo,” Solar Physics, vol. 294, no. 5, p. 60, 2019.
- [30] J. Le Mouël, F. Lopes, and V. Courtillot, “Solar turbulence from sunspot records,” Monthly Notices of the Royal Astronomical Society, vol. 492, no. 1, pp. 1416–1420, 2020.
- [31] N. Scafetta, “Solar oscillations and the orbital invariant inequalities of the solar system,” Solar Physics, vol. 295, no. 2, p. 33, 2020.
- [32] V. Courtillot, F. Lopes, and J. Le Mouël, “On the prediction of solar cycles,” Solar Physics, vol. 296, pp. 1–23, 2021.
- [33] V. Courtillot, J.-L. Le Mouël, V. Kossobokov, D. Gibert, and F. Lopes, “Multi-decadal trends of global surface temperature: A broken line with alternating~ 30 yr linear segments?,” Atmospheric and Climate Sciences, vol. 3, no. 3, 2013.
- [34] N. Scafetta, “Solar and planetary oscillation control on climate change: hind-cast, forecast and a comparison with the cmip5 gcms,” Energy & Environment, vol. 24, no. 3-4, pp. 455–496, 2013.
- [35] N. Scafetta, “Discussion on climate oscillations: Cmip5 general circulation models versus a semi-empirical harmonic model based on astronomical cycles,” Earth-Science Reviews, vol. 126, pp. 321–357, 2013.
- [36] N. Scafetta, “Discussion on the spectral coherence between planetary, solar and climate oscillations: a reply to some critiques,” Astrophysics and Space Science, vol. 354, no. 2, pp. 275–299, 2014.
- [37] R. Gupta, L. A. Gil-Alana, and O. S. Yaya, “Do sunspot numbers cause global temperatures? evidence from a frequency domain causality test,” Applied Economics, vol. 47, no. 8, pp. 798–808, 2015.
- [38] L. Kristoufek, “Has global warming modified the relationship between sunspot numbers and global temperatures?,” Physica A: Statistical Mechanics and its Applications, vol. 468, pp. 351–358, 2017.
- [39] Z. Dai, J. Du, Z. Tang, S. Ou, S. Brody, X. Mei, J. Jing, and S. Yu, “Detection of linkage between solar and lunar cycles and runoff of the world’s large rivers,” Earth and Space Science, vol. 6, no. 6, pp. 914–930, 2019.
- [40] J.-L. Le Mouël, F. Lopes, and V. Courtillot, “A solar signature in many climate indices,” Journal of Geophysical Research: Atmospheres, vol. 124, no. 5, pp. 2600–2619, 2019.
- [41] J. Le Mouël, F. Lopes, and V. Courtillot, “Characteristic time scales of decadal to centennial changes in global surface temperatures over the past 150 years,” Earth and Space Science, vol. 7, no. 4, p. e2019EA000671, 2020.
- [42] R. Connolly, W. Soon, M. Connolly, S. Baliunas, J. Berglund, C. J. Butler, R. G. Cionco, A. G. Elias, V. M. Fedorov, H. Harde, et al., “How much has the sun influenced northern hemisphere temperature trends? an ongoing debate,” Research in Astronomy and Astrophysics, vol. 21, no. 6, p. 131, 2021.
- [43] J.-L. Le Mouël, F. Lopes, and V. Courtillot, “Sea-level change at the brest (france) tide gauge and the markowitz component of earth’s rotation,” Journal of Coastal Research, vol. 37, no. 4, pp. 683–690, 2021.
- [44] F. Lopes, P. Zuddas, V. Courtillot, J.-L. Le Mouël, J.-B. Boulé, A. Maineult, and M. Gèze, “Milankovic pseudo-cycles recorded in sediments and ice cores extracted by singular spectrum analysis,” Climate of the Past Discussions, pp. 1–17, 2021.
- [45] V. Courtillot, J.-L. Le Mouël, F. Lopes, and D. Gibert, “On sea-level change in coastal areas,” Journal of Marine Science and Engineering, vol. 10, no. 12, p. 1871, 2022.
- [46] V. Courtillot, J.-L. Le Mouël, F. Lopes, and D. Gibert, “On the nature and origin of atmospheric annual and semi-annual oscillations,” Atmosphere, vol. 13, no. 11, p. 1907, 2022.
- [47] Z. Li, L. Chang, J. Lou, Y. Shen, and H. Yan, “Multi-scale analysis of the relationships between solar activity, co2 and global surface temperature,” Research in Astronomy and Astrophysics, vol. 22, no. 9, p. 095019, 2022.
- [48] F. I. Ormaza-González, M. E. Espinoza-Celi, and H. M. Roa-López, “Did schwabe cycles 19–24 influence the enso events, pdo, and amo indexes in the pacific and atlantic oceans?,” Global and Planetary Change, vol. 217, p. 103928, 2022.
- [49] F. Lopes, V. Courtillot, D. Gibert, and J.-L. L. Mouël, “On the annual and semi-annual components of variations in extent of arctic and antarctic sea-ice,” Geosciences, vol. 13, no. 1, p. 21, 2023.
- [50] N. Scafetta and A. Bianchini, “Overview of the spectral coherence between planetary resonances and solar and climate oscillations,” Climate, vol. 11, no. 4, p. 77, 2023.
- [51] E. Keogh, K. Chakrabarti, M. Pazzani, and S. Mehrotra, “Dimensionality reduction for fast similarity search in large time series databases,” Knowledge and information Systems, vol. 3, pp. 263–286, 2001.
- [52] J. Lin, E. Keogh, S. Lonardi, and B. Chiu, “A symbolic representation of time series, with implications for streaming algorithms,” in Proceedings of the 8th ACM SIGMOD workshop on Research issues in data mining and knowledge discovery, pp. 2–11, 2003.
- [53] J.-L. Lagrange, “Mécanique analytique (paris),” MJ Bertrand. Mallet-Bachelier, 1788.
- [54] J. Laskar, F. Joutel, and F. Boudin, “Orbital, precessional, and insolation quantities for the earth from-20 myr to+ 10 myr,” Astronomy and Astrophysics (ISSN 0004-6361), vol. 270, no. 1-2, p. 522-533., vol. 270, pp. 522–533, 1993.
- [55] F. R. Stephenson and L. V. Morrison, “Long-term changes in the rotation of the earth: 700 bc to ad 1980,” Philosophical Transactions of the Royal Society of London. Series A, Mathematical and Physical Sciences, vol. 313, no. 1524, pp. 47–70, 1984.
- [56] R. S. Gross, “A combined length-of-day series spanning 1832–1997: Lunar97,” Physics of the Earth and Planetary Interiors, vol. 123, no. 1, pp. 65–76, 2001.
- [57] F. Lopes, J.-L. Le Mouël, and D. Gibert, “The mantle rotation pole position. a solar component,” Comptes Rendus Geoscience, vol. 349, no. 4, pp. 159–164, 2017.
- [58] N. Golyandina and A. Zhigljavsky, Singular spectrum analysis. Springer, 2013.
- [59] P. Lemmerling and S. Van Huffel, “Analysis of the structured total least squares problem for hankel/toeplitz matrices,” Numerical algorithms, vol. 27, pp. 89–114, 2001.
- [60] G. H. Golub and C. Reinsch, “Singular value decomposition and least squares solutions,” Linear algebra, vol. 2, pp. 134–151, 1971.
- [61] W. Markowitz, “Concurrent astronomical observations for studying continental drift, polar motion, and the rotation of the earth,” in Symposium-International Astronomical Union, vol. 32, pp. 25–32, Cambridge University Press, 1968.
- [62] N. Stoyko, “Variation séculaire des longitudes,” in Symposium-International Astronomical Union, vol. 32, pp. 57–62, Cambridge University Press, 1968.
- [63] S. Chandler, “On the variation of latitude, i,” The Astronomical Journal, vol. 11, pp. 59–61, 1891.
- [64] S. Chandler, “On the variation of latitude, ii,” The Astronomical Journal, vol. 11, pp. 65–70, 1891.
- [65] J. Mouël, D. Gibert, V. Courtillot, S. Dumont, J. Ars, S. Petrosino, P. Z. F. Lopes, J. Boulé, M. Neves, S. Custódio, et al., “On the external forcing of global eruptive activity in the past 300 years,” Frontiers in Earth Science, 2023.
- [66] J. Laskar, P. Robutel, F. Joutel, M. Gastineau, A. C. Correia, and B. Levrard, “A long-term numerical solution for the insolation quantities of the earth,” Astronomy & Astrophysics, vol. 428, no. 1, pp. 261–285, 2004.
- [67] W. Gleissberg, “A long-periodic fluctuation of the sun-spot numbers,” The Observatory, vol. 62, pp. 158–159, 1939.
- [68] J.-L. Le Mouël, F. Lopes, and V. Courtillot, “Identification of gleissberg cycles and a rising trend in a 315-year-long series of sunspot numbers,” Solar Physics, vol. 292, no. 3, p. 43, 2017.
- [69] J. L. R. d’Alembert, Recherches sur la précession des equinoxes: et sur la nutation de l’axe de la terre, dans le systême Newtonien. chez David l’aîné, 1749.