GCD-DDPM: A Generative Change Detection Model Based on Difference-Feature Guided DDPM
Abstract
Deep learning (DL)-based methods have recently shown great promise in bitemporal change detection (CD). However, most existing methods are ineffective in simultaneously capturing long-range dependencies and exploiting local spatial information, resulting in inaccurate CD maps with discerning edges. To overcome these obstacles, a novel Denoising Diffusion Probabilistic Model (DDPM)-based generative CD approach called GCD-DDPM is proposed for remote sensing data. More specifically, GCD-DDPM is designed to directly generate CD maps by leveraging variational inference, which enables GCD-DDPM to accurately distinguish subtle and irregular buildings or natural scenes from the background. Furthermore, an adaptive calibration conditional difference encoding technique is proposed for GCD-DDPM to enhance the CD map through guided sampling of the differences among multi-level features. Finally, a noise suppression-based semantic enhancer (NSSE) is devised to cope with the high-frequency noise incurred in the CD map by capitalizing on the prior knowledge derived from the current step. Extensive experiments on four CD datasets, namely CDD, WHU, Levier and GVLM, confirm the good performance of the proposed GCD-DDPM.
Index Terms:
Denoising diffusion probabilistic model, Change detection, generative modelsI Introduction
Change detection (CD) for multi-temporal remote sensing (RS) imagery is a critical research area in urban and rural development investigation [1], natural hazard evaluation [2], and ecosystem observation [3, 4]. Various CD techniques have been developed using the image algebra, image transformation, and deep learning approaches. For instance, the image algebra-based approach extracts change magnitudes by exploiting either image differencing [5] or change vector analysis (CVA) [6, 7] whereas the image transformation-based approach aims to amplify the change information [8, 9]. Recently, the deep learning (DL)-based approach has attracted much research attention for its outstanding performance in pixel classification. These DL-based CD methods often utilize deep neural networks to extract distinguishable features from the input bitemporal images by capitalizing on convolutional neural networks (CNN) with residual operations [10, 11, 12, 13]. In [14], the Siamese CNN is employed to extract deep features whereas [15] introduced two Siamese extensions of fully connected CNNs to extract multi-scale features. Despite their good performance, these models are ineffective in preserving accurate detailed information due to the consecutive downsampling operations during the convolution process. To cope with this challenge, [16] proposed a densely connected Siamese network to aggregate and refine features of multiple semantic levels, which helps to narrow semantic gaps and suppress localization errors. However, these CNN-based models are incapable of accurately extracting global interactions between contexts due to their limited receptive fields. Recently, the attention mechanisms have been introduced into CD to capture long-range dependencies and refine feature representations, thereby facilitating change map reconstruction [17, 18, 19, 20, 21]. For instance, [17] introduced a self-attention mechanism for CD by exploiting the Transformer architecture [22, 23, 24], capturing abundant spatial-temporal relationships to obtain illumination-invariant features. In [21], semantic segmentation and binary change detection are integrated by utilizing a semantic-aware encoder and a temporal-symmetric transformer. However, it has been reported in [25] that these models equipped with the self-attention mechanism are ineffective in capturing intricate local variations and edge details. As a result, these models cannot accurately characterize the change boundaries, which incurs prediction performance degradation.
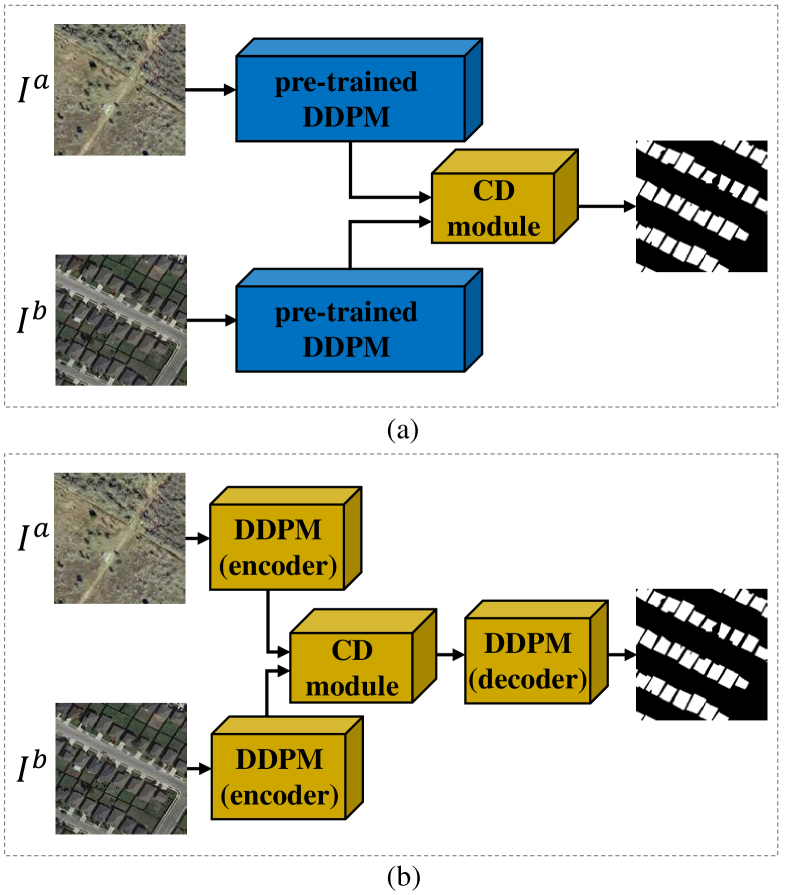
In the meantime, the Denoising Diffusion Probabilistic Model (DDPM) has been recently proposed to enhance the generative capabilities of the diffusion model [26]. It has been shown that the DDPM outperforms the conventional Generative Adversarial Networks (GANs) and the Transformer in various applications, including super-resolution [27, 28, 29, 30], segmentation [31, 32, 33], inpainting [34, 35, 36], and conditional image generation [37, 38, 39, 40]. Recently, a DDPM-based model called DDPM-CD [41] has been developed in [41] for semantic segmentation and change detection by employing the DDPM as a feature extractor for capturing semantic information. Specifically, a diffusion model can be trained through a variational inference procedure on an extensive collection of off-the-shelf remote sensing images to generate images that increasingly resemble authentic images over a finite time period. The resulting diffusion model progressively improves its semantic extraction capability, which is instrumental in acquiring accurate CD maps. However, existing DDPM-based methods mostly utilize pre-trained DDPM as encoders to directly extract segmentation information through a single forward propagation. We argue that such a design overlooks the potential benefits of the gradual learning and refinement capability provided by the DDPM.
Motivated by the aforementioned challenges, a novel DDPM-based approach called GCD-DDPM is proposed in this work by adopting an end-to-end architecture. The proposed GCD-DDPM progressively generates accurate CD maps by iteratively exploiting the current-step predictions. More specifically, the diffusion model employed in the proposed GCD-DDPM utilizes probabilistic modeling to capture the diversity and complexity of input images, establishing intricate data distribution models, which enables the model to adapt to various scenes and image features including the shape, size, and texture of ground objects. In particular, the diffusion model in the proposed GCD-DDPM is trained with Variational Inference (VI) [42], a robust method for approximating complex probability distributions. VI allows the model to encapsulate the inherent complexities in CD maps by efficiently approximating a posterior distribution over the latent variables contributing to changes. As a result, the proposed GCD-DDPM can gradually learn and refine its data representation, leading to more accurate CD maps.
-
1.
An end-to-end DDPM-based architecture called GCD-DDPM is proposed to directly generate CD maps by leveraging the variational inference to gradually learn and refine data representations, which helps to effectively distinguish subtle and irregular buildings or natural scenes from the background;
-
2.
An adaptive calibration method is proposed to enhance the CD map by first computing the difference among multi-level features extracted from the pre- and post-change images. The difference is then utilized to guide a sampling process for CD map generation;
-
3.
Finally, a noise suppression-based semantic enhancer (NSSE) is proposed by employing an attentive-like mechanism to suppress high-frequency noise in the CD information derived in the current step, which helps to enhance the differential information and ultimately the quality of the resulting CD map.
The rest of this paper is organized as follows. Section II describes the related work of deep learning-based CD methods and the recent DDPM-based models reported in the RS literature. After that, Section III provides the details on the proposed GCD-DDPM whereas extensive experimental results are presented in Section IV. Finally, the conclusion is given in Section V.
II Related work
II-A CNN-based models
Conventional CNN-based models have been widely used for extracting difference maps and features, primarily focusing on capturing local spatial information [43, 44, 15]. For example, a symmetric convolutional coupling network called SCCN [45] employed unsupervised learning to optimize a coupling function based on heterogeneous images, aiming to capture the intrinsic relationship with emphasis on the difference between input images. In addition, skip-connections were introduced in [46] to handle temporal connections in multi-temporal data while extracting rich spectral-spatial features. However, these CNN-based methods have inherent limitations in modeling global dependencies and capturing comprehensive spatial-temporal information as they primarily focused on local regions. As a result, these CNN-based models exhibit poor performance in capturing complex patterns and changes that occur over larger areas of intricate spatial distributions.
II-B Transformer-based models
In contrast, the Transformer architecture has demonstrated exceptional performance in various computer vision tasks, including CD, by effectively addressing the challenge of capturing long-range dependencies [47, 48]. The use of self-attention modules in the Transformer architecture enables the capturing of global contextual relationships, which helps overcome the limited receptive field problem plaguing the CNN-based models. Several studies have built upon this success by introducing Transformer-based models tailored for CD. For instance, [49] introduced a pure Transformer network with a Siamese U-shaped structure called SwinsUnet, leveraging the Swin Transformer block for the encoding, fusion, and decoding components. Despite their many advantages, the Transformer-based models suffer from inaccurate prediction of fine-grained details of CD maps due to the inherent characteristics of the Transformer architecture. As a result, the predicted CD maps exhibit relatively low precision and coarse estimation of edge details. Furthermore, while the Transformers excel at capturing global contextual information, they are less effective in capturing intricate local variations and edge details [25]. This limitation hinders them from accurately delineating the boundaries of change regions.
II-C DDPM-based models
Compared to CNNs and Transformers, the DDPM-based generative models offer several advantages that enable them to capture complex data distributions, leading to accurate prediction of fine-grained details and edge information in CD maps. More specifically, the diffusion model employed in DDPM captures the diversity and complexity of input images by leveraging probabilistic modeling. Furthermore, the model can adapt to various scenes and image features, including the shape, size, and texture of ground objects, through learning to transform a standard normal distribution into an empirical data distribution.
However, most these existing models do not fully exploit the benefits of DDPM. For instance, the DDPM-CD model reported in [41] utilized the pre-trained DDPM as a segmentation extractor into which the remote sensing images are directly fed for segmentation features extraction as depicted in Fig. 1. These extracted segmentation features are subsequently channeled into a light-weight CD module while the DDPM is held constant. We consider such a design ineffective in exploiting the prior information. To address this drawback, we introduce GCD-DDPM endowed with variational inference to facilitate a more nuanced and robust probabilistic framework as compared to DDPM-CD. Furthermore, it employs an end-to-end training architecture that directly generates accurate CD maps through iterative refinements during the inference process. This transformative model adaptively captures the intrinsic complexities and variances present in change detection scenarios, thereby substantially outperforming existing solutions in terms of both accuracy and adaptability. The difference between the conventional DDPM-CD and the proposed GCD-DDPM is illustrated in Fig. 1 in which and denote the pre- and post-change images, respectively.
III METHODOLOGY
III-A GCD-DDPM
The proposed GCD-DDPM is a generative model consisting of two stages, namely, the forward diffusion stage and the reverse diffusion stage. In the forward process, the segmentation label is gradually added with Gaussian noise through a series of steps . During the reverse diffusion stage, a neural network is trained as a noise predictor to reverse the noising process and subsequently, recover the original data.
III-A1 Forward Process
The diffusion process involves generating a series of data points , , …, conditioned on a given initial data distribution . This process can be mathematically formulated as follows:
| (1) |
where
| (2) |
with the variance schedule consisting of a set of hyperparameters and denoting a Gaussian distribution. This recursive formulation represents a Gaussian distribution characterized by a mean of and a variance of . Furthermore,the mathematical relationship between and is formulated as:
| (3) |
where
| (4) |
with being modeled with the standard normal distribution of zero mean and unit variance.
III-A2 Reverse Process
the reverse process involves transforming the latent variable distribution into the data distribution parameterized by . This transformation is defined by a Markov chain featuring learned Gaussian transitions with the initial distribution modeled as the standard normal distribution . Mathematically, the transformation can be represented as:
| (5) |
where
| (6) |
with denoting the parameters governing this reverse process.
In the training phase, based on viriational inference, the objective is to optimize these parameters such that the reverse diffusion process accurately approximates the original data distribution. To achieve this, we introduce a neural network-based noise predictor, denoted as . This function estimates the noise for given as follows:
| (7) |
We adopt a mean squared error loss function , aiming to minimize the discrepancy between and :
| (8) |
During the inference stage, we begin by sampling an initial from the standard Gaussian distribution. Using as the starting point, subsequent data points are sampled recursively based on the learned transition models defined by Eq. (5) and Eq. (6) with
| (9) | |||||
| (10) |
for . The process is iteratively applied to reconstruct the noise image, ultimately yielding a clear segmentation during the inference phase.
III-B Network Details
Most existing DDPM-based methods utilized the DDPM as a feature extractor to extract multidimensional features without fully exploiting the current estimate as prior knowledge during inference process [41]. In this work, we propose to generate high-quality CD maps directly through end-to-end training without the necessity of additional training of the diffusion models.
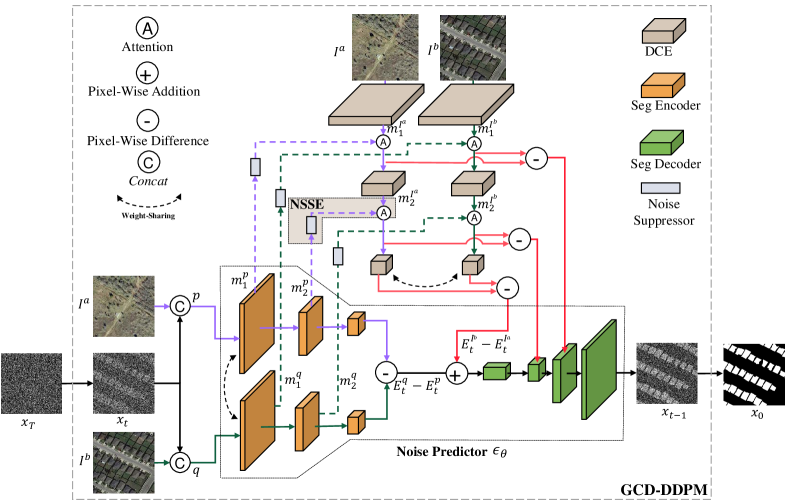
The proposed network consists of two key components, namely a noise predictor denoted as built on an classical Segmentation (Seg) Encoder-Decoder architecture and a novel CD module called Difference Conditional Encoder (DCE). The Seg Encoder in the noise predictor is designed to effectively estimate noise feature before DCE seamlessly fuses the difference information derived from pre- and post-change images. In addition, to effectively leverage the multi-step iterative prediction capability of the diffusion model, we further propose a noise suppression-based semantic enhancer called NSSE to integrate the current-step CD noise features from the Seg Encoder into the conditional encoding for enhancement. After that, multi-scale feature maps that contain difference information from DCE are fused with the current-step CD noise features through the pixel-wise addition and skip connections in the Seg Decoder to obtain current-step CD-related noise. The resulting fused information is then employed as prior information for next iteration. By iteratively sampling the Gaussian noise, the proposed GCD-DDPM progressively improves the accuracy of the resulting CD maps by accurately characterizing the difference between the input images. An illustration of the proposed GCD-DDPM is presented in Fig. 2. In the following sections, details about the Noise Predictor, DCE, and NSSE will be discussed.
III-B1 Noise Predictor
In accordance with the standard implementation of the DDPM, a U-Net is employed as a noise predictor as shown in Fig. 2. Furthermore, the step estimation function is conditioned on raw images and takes the following form:
| (11) |
where is the Seg decoder for the last-step CD maps. Furthermore, and denote the conditional embedding features from DCE whereas and stand for the noise features from the Seg Encoder in step . Thereby, and represent the difference of the bitemporal conditional embedding features and the bitemporal noise features, respectively. Finally, and are the noise features in the noise predictor and defined as follows:
| (12) | |||||
| (13) |
with being the concatenation operator.
III-B2 Difference Conditional Encoder (DCE)
We propose a novel DCE to extract change information for each sample from the diffusion model as shown in the top part of Fig. 2. Mathematically, the -th level conditional feature maps for derived from pre- and post-change images are denoted by and , respectively. Despite that the pre-change feature and the post-change feature contain raw segmentation target information without distortion, it is challenging to directly compute the difference from . In contrast, the current-step CD map, despite being less accurate, contains enhanced target regions. Inspired by this observation, this work proposes to integrate the current-step CD map information into DCE by extracting information from multi-level noise features. More specifically, the extracted multi-level conditional features and in DCE is integrated with the current-step corresponding segmentation information and . Thus motivated, we propose the NSSE module to enhance and calibrate the conditional embedding features.
III-B3 NSSE
In this section, only the -th level data flow for the pre-change features in NSSE is shown while the post-change features are processed in the same fashion. Without loss of generality, we concentrate on the operations in step and omit temporal index for notational simplicity.
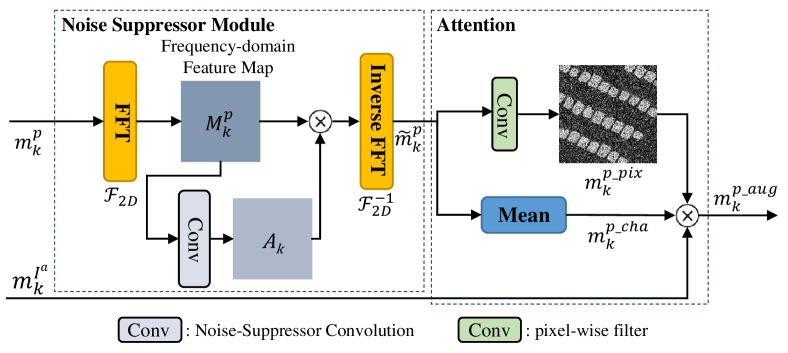
As shown in Fig. 3, the proposed NSSE consists of a noise-suppressor module designed to suppress noise inherent in by eliminating high-frequency noise using a parameterized attention map. The -th level noise feature can be generated by passing initial noise features through the corresponding Seg Encoder convolution layer within the Seg Encoder architecture as:
| (14) |
where stands for a convolutional layer.
After that, we transform into using a 2D Fast Fourier transform (FFT) along the spatial dimensions as follows:
| (15) |
where represents the 2D FFT function.
Next, we multiply with a parameterized attentive map before converting the resulting weighted feature map back to the spatial domain using the inverse 2D FFT. Mathematically, the above process can be modeled as:
| (16) |
where stands for the inverse FFT function.
The -th level feature map denoted by can be generated by passing through a convolution layer within the ResNet Encoder architecture as:
| (17) |
After that, we transform into using a 2D Fast Fourier transform (FFT) along the spatial dimensions as follows:
| (18) |
where represents the 2D FFT function.
Next, we multiply with a parameterized attentive map before converting the results back to the spatial domain using the inverse 2D FFT. Mathematically, the above process can be modeled as:
| (19) |
where stands for the inverse FFT function.
The noise suppression module discussed above can be considered as adaptive frequency filters commonly employed in digital image processing [50]. In sharp contrast to the conventional spatial attention, the proposed module can learn to constrain the high-frequency component for adaptive integration by globally adjusting filtering frequencies.
After obtaining , pixel-wise and channel-wise attention mechanisms are employed to facilitate the fusion process between and the conditional embedding . Specifically, CD feature extracted from noise feature is fed into two separate convolution layers :
| (20) | |||||
| (21) |
where the function maps to a feature map with only one single channel, serving as a trainable pixel-wise filter. In addition, the function represents the global average pooling operation, yielding a one-dimensional vector of channel length. Furthermore, stands for the linear normalization function. Finally, we can compute the augmented conditinal embedding as follows:
| (22) |
Repeating the procedures in Eqs (14)-(22) by replacing with , we can compute the -th level post-change features denoted by .
Finally, the multi-scale feature maps encapsulating differential information from the conditional encoders are seamlessly fused with the current-step Change Detection (CD) features, denoted as , where . This fusion is executed within the Seg Decoder through pixel-wise addition operations and skip connections, as illustrated in Fig. 2. These fused features are then passed onto the last encoding layer before a decoder equipped with a residual network decodes the high-dimensional features. By iteratively sampling Gaussian noise, the proposed GCD-DDPM model incrementally enhances the precision of the resulting CD map by accurately characterizing the difference between the input images.
IV Experiment
IV-A Experimental Dataset
In this section, extensive computer experiments are performed on four CD datasets, namely the CD Dataset (CDD) [51], the LEVIR-CD dataset [21], the WHU-CD [52] and the Global Very-high-resolution Landslide Mapping (GVLM) [53].
-
•
CD Dataset (CDD) is a publicly available large-scale CD dataset containing image pairs across four seasons. Furthermore, the spatial resolution of its images varies from to centimeters/pixel, which enables the dataset to accurately characterize objects of various sizes, ranging from cars to large construction structures. In particular, the CDD covers seasonal changes of natural objects, including a single tree and wide forest areas. Finally, we divide the dataset into a training set of images, a test set of images and a validation set of images with each image of size pixels;
-
•
LEVIR-CD is a public large-scale building CD dataset containing pairs of high-resolution remote sensing images of spatial resolution of meter. After cropping the original images into small non-overlapping patches of size from the original images, we obtained , and pairs of patches for training, validation and testing, respectively;
-
•
WHU-CD [52] is a public building CD dataset containing high-resolution aerial images of size spatial resolution of centimeters. After cropping the original images into small non-overlapping patches of size , we randomly divide the resulting data into a training set of patches, a test set of patches and a validation set of patches, respectively;
-
•
Global Very-high-resolution Landslide Mapping (GVLM) is a publicly available CD dataset specifically designed for landslide monitoring. It contains pairs of high-resolution landslide images for landslide monitoring and mitigation algorithm development and evaluation.
IV-B Implementation Details
Our experiments were implemented using the PyTorch framework empowered by a single NVIDIA GeForce RTX 4090 Ti GPU. In the experiments, diffusion steps were performed for the inference. All images were uniformly resized to the dimension of pixels. Furthermore, the stochastic gradient descent (SGD) algorithm with momentum was adopted as the optimization algorithm to train the model with a batch size of . In addition, the momentum and the weight decay parameters are set to and , respectively. Finally, the learning rate was initially set to before linearly decaying to zero over the course of epochs.
IV-C Evaluation Metrics
The F1-score, Intersection over Union (), and overall accuracy () are common performance metrics used to evaluate the effectiveness of various models, particularly in tasks such as CD. Each of these metrics provides a different perspective on the performance of the CD model under evaluation. More specifically, the F1-score stands for a balanced assessment of a model’s accuracy and completeness. It is a harmonic mean of and and calculated as follows:
| (23) | |||||
| (24) | |||||
| (25) |
where , and represent the number of true positive, false positive, and false negative respectively.
In additiona, IoU is a metric used to evaluate the degree of overlap between two sets, typically the predicted segmentation map and the ground truth. In the context of CD, IoU for the change category is calculated as follows:
| (26) |
is a measure of the proportion of correctly classified instances out of the total instances. It is calculated as:
| (27) |
where denotes the number of true negative.
IV-D Comparison
Comprehensive comparison was performed to compare the proposed approach against five state-of-the-art models reported in the literature, namely three convolution-based techniques, namely FC-SC [14], SNUNet [16] and DT-SCN [54], as well as the transformer-based BIT [47] and the DDPM-based DDPM-CD [41]. More specifically, FC-SC leverages a Siamese FCN to extract multi-level features while employing feature concatenation as its fusion strategy for bitemporal information [14]. Furthermore, SNUNeT extracts high-resolution high-level features by jointly exploiting the Siamese network and NestedUNet [16] whereas DT-SCN in [54] exploits the inter-dependency between channels and spatial positions using a dual-attention module (DAM) for more comprehensive feature-level fusion. Finally, BIT facilitates the identification of changes of interest while excluding irrelevant alterations by incorporating the transformer architecture into the CD task [47] while the DDPM-CD performs change detection by employing the DDPM as a feature extractor.
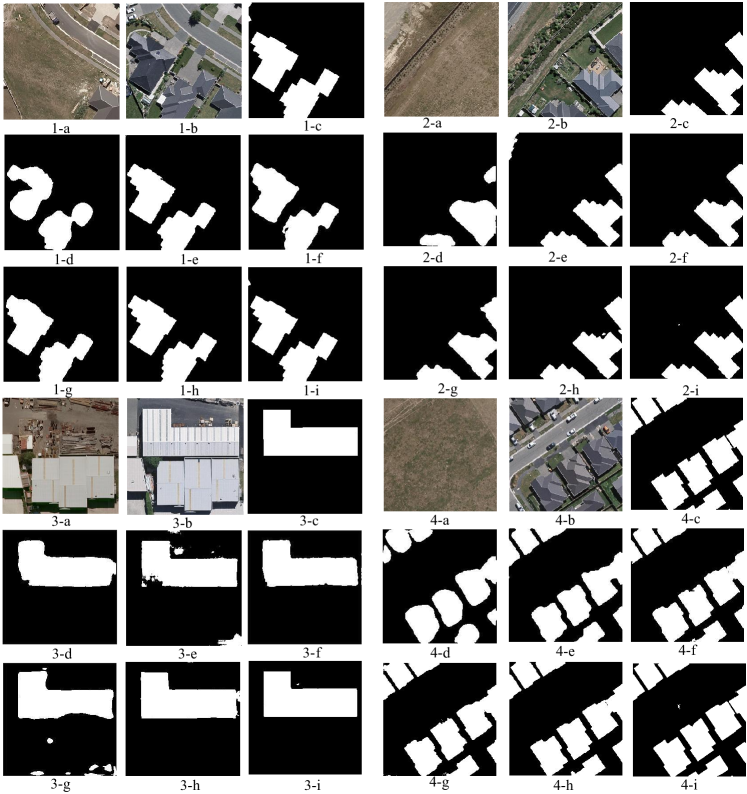
IV-E Experiment on CD DataSet (CDD)
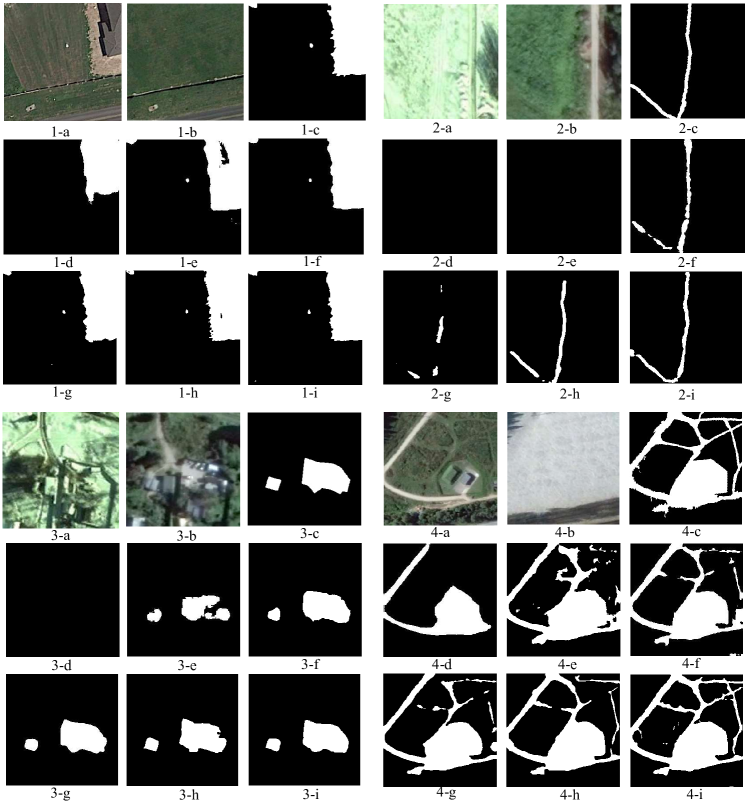
The CDD dataset with emphasize on seasonal changes in remote sensing images was specifically designed for CD algorithm development by incorporating images acquired across different seasons. Fig. 4(a)-(c) show the pre- and post-change images as well as the ground truth. As illustrated in Fig. 4(a)-(c), the CD images include different types of land cover and land use types, such as urban areas, and agricultural fields in different seasons, which enables the evaluation of CD algorithms across different spectral characteristics and scenarios. Fig. 4(d)-(i) illustrates the predictive capabilities of all methods under consideration. Inspection of Fig. 4 shows that the seasonal changes in vegetation and other land cover types can lead to areas of pseudo-changes in the CD maps, which makes it challenging to identifying the actual changes from those caused by seasonal variability. It is evidenced in Fig. 4 that the proposed GCD-DDPM could better preserve the actual boundaries of changed objects while generating predicted change maps of greater details.
| Method | Recall | Precision | OA | F1 | Iou |
|---|---|---|---|---|---|
| FC-SC | 71.10 | 78.62 | 94.55 | 74.67 | 58.87 |
| SNUNet | 80.29 | 84.52 | 95.73 | 82.35 | 69.91 |
| DT-SCN | 89.54 | 92.76 | 97.95 | 91.12 | 83.59 |
| BIT | 90.75 | 86.38 | 97.13 | 88.51 | 79.30 |
| DDPM-CD | 94.43 | 95.05 | 98.81 | 94.74 | 90.05 |
| Proposed GCD-DDPM | 95.10 | 94.76 | 98.87 | 94.93 | 90.56 |
Table I shows the performance of the six models under consideration in terms of OA, F1-score, precise, and IoU. Inspection of Table I reveals that the proposed GCD-DDPM achieved the best performance in most performance metrics. In particular, the conventional DDPM-CD generated a slightly higher precision, i.e. , at the cost of worse FN and subsequently recall performance. In contrast, the proposed GCD-DDPM achieved comparable precision performance of as well as impressive recall performance.
| Method | Recall | Precision | OA | F1 | Iou |
|---|---|---|---|---|---|
| FC-SC | 86.54 | 72.03 | 98.42 | 78.62 | 64.37 |
| SNUNet | 81.33 | 85.66 | 98.68 | 83.44 | 71.39 |
| DT-SCN | 93.60 | 88.05 | 99.32 | 90.74 | 83.55 |
| BIT | 87.94 | 89.98 | 99.30 | 88.95 | 81.53 |
| DDPM-CD | 92.05 | 92.71 | 99.37 | 92.38 | 85.84 |
| Proposed GCD-DDPM | 92.29 | 92.79 | 99.39 | 92.54 | 86.52 |
| Method | Recall | Precision | OA | F1 | Iou |
|---|---|---|---|---|---|
| FC-SC | 77.29 | 89.04 | 98.25 | 82.75 | 69.95 |
| SNUNet | 84.33 | 88.55 | 98.70 | 86.39 | 76.11 |
| DT-SCN | 87.03 | 85.33 | 98.65 | 86.17 | 75.09 |
| BIT | 87.85 | 90.26 | 98.83 | 89.04 | 80.12 |
| DDPM-CD | 89.67 | 91.39 | 99.06 | 90.52 | 82.73 |
| Proposed GCD-DDPM | 91.24 | 90.68 | 99.14 | 90.96 | 83.56 |
| Method | Recall | Precision | OA | F1 | Iou |
|---|---|---|---|---|---|
| FC-SC | 89.53 | 74.47 | 96.47 | 81.31 | 67.24 |
| SNUNet | 91.67 | 87.22 | 98.97 | 89.39 | 80.85 |
| DT-SCN | 92.95 | 82.05 | 97.16 | 87.16 | 77.31 |
| BIT | 91.15 | 87.39 | 98.70 | 89.23 | 83.76 |
| DDPM-CD | 93.26 | 93.92 | 99.31 | 93.59 | 87.29 |
| Proposed GCD-DDPM | 94.25 | 93.79 | 99.32 | 94.02 | 89.09 |
IV-F Experiment on WHU Building CD Data Set
We repeated the experiments above on the WHU building change detection dataset. The WHU dataset primarily focuses on urban changes, capturing various types of alterations such as construction, demolition, and land cover transformations. In particular, the WHU dataset contains intricate urban structures and diverse land cover types, which may lead to pseudo-changes and mis-classifications in the CD maps. For instance, inspection of Fig. 5(c)-(h) reveals that existing models suffered from noticeable omissions and false alarms in various urban objects. In contrast, the proposed GCD-DDPM achieved impressive performance by effectively mitigating noise and pseudo-changes while preserving the internal compactness of urban objects.
The observation above was confirmed in Table II. The proposed GCD-DDPM achieved superior performance by accurately detecting urban changes in terms of F1 score, OA, and IoU as compared to other existing methods.
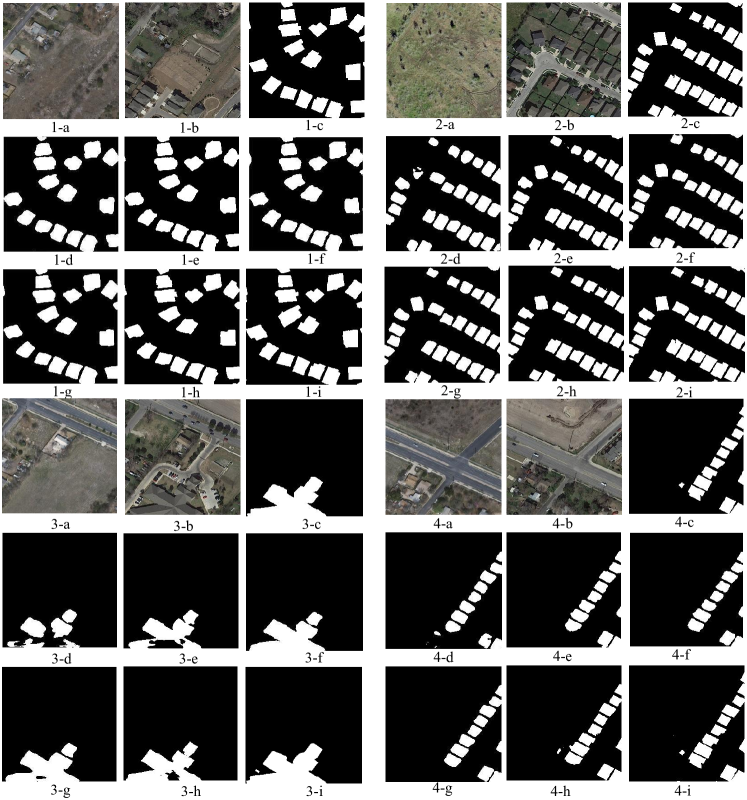
IV-G Evaluation on LEVIR-CD Dataset
Next, we performed similar experiments on the LEVIR-CD dataset designed to detect building changes of various scales. As shown in Fig. 6, the proposed GCD-DDPM could better preserve the internal compactness of building objects while suppressing noise as compared to other existing models. In particular, as seasonal and illumination changes in the bitemporal images often result in large spectral variability, areas of pseudo-changes commonly occurred in the CD maps. This problem can be observed from the small building targets in Fig. 6 where pseudo-changes were caused in the building roofs while many small building targets were ignored. In comparison, the proposed GCD-DDPM accurately detected most of the small targets while suppressing pseudo-changes.
As shown in Table III, the proposed GCD-DDPM outperformed the existing models on the LEVIR-CD dataset in terms of all performance metrics.
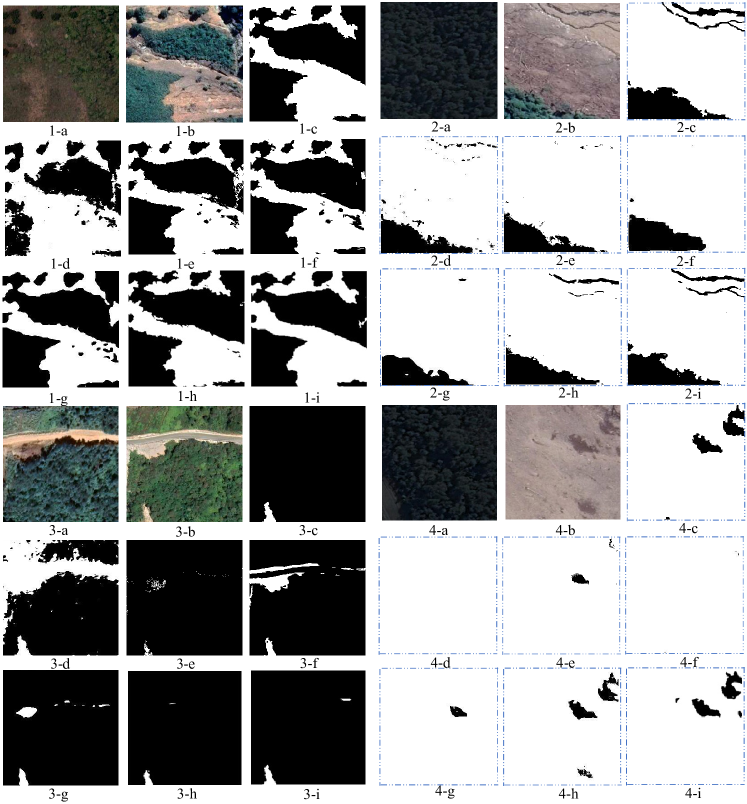
IV-H Experiments on the GVLM Dataset
Finally, we performed experiments on the GVLM dataset designed for detecting landslide areas from bitemporal images by quantifying land cover changes. The dataset consists of various types of landslides of irregular shapes occurring in regions under different land cover conditions. As illustrated in Fig. 7, the CD maps generated by the existing models contained salt-and-pepper noise, especially on the boundaries of landslide objects of irregular shapes. In sharp contrast, the proposed GCD-DDPM preserved the details of landslide objects and their boundaries. As a result, the proposed GCD-DDPM was able to generate more accurate CD maps. This observation was confirmed by the numerical results shown in Table IV where the proposed GCD-DDPM achieved the best performance in all performance metrics.
IV-I Visualization via Gradient-Based Localization
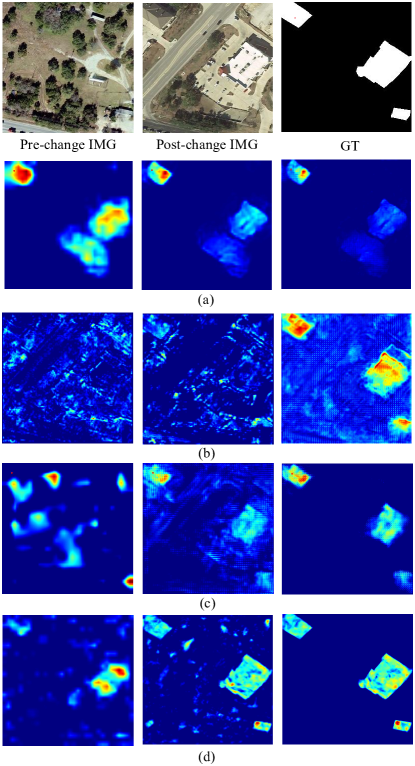
To better illuminate the performance enhancements achieved, the Gradient-weighted Class Activation Mapping (Grad-CAM) technique reported in [55] was employed to visually examine the feature map output from each decoder layer. However, unlike image classification tasks that assign a single class label to each image, change detection of bitemporal images involves labeling each pixel. To cater to this difference, we adopted a modified Grad-CAM approach proposed in [56] for change detection, enabling visualization of classification decisions made by the proposed GCD-DDPM for each pixel. In particular, the modified GradCAM technique can discover the essential locations on the feature map for the final decision by tracking the gradient information flow. Consequently, class-discriminative locations in the Grad-CAM maps can show higher scores.
The images on the first row of Fig. 8 are the pre-change image, post-change image and the ground truth (GT), respectively. We show the modified Grad-CAM heatmaps derived from the localization decoder module using FC-SC, BIT, ChangeFormer and the proposed GCD-DDPM in the next four rows in Fig. 8. Furthermore, the three columns of the visualization results represent the heatmaps of the smallest, intermediate, and largest scales in the decoder, respectively. In particular, a black dot was marked in the change region. It is important to note that brighter pixels have higher scores and are more likely to be classified as change regions. It is observed in Fig. 8 that the feature maps generated by the existing FC-SC, BIT and ChangeFormer were not sufficiently representative for the recognition of the changed region, particularly for the high-resolution shallow features that retain fine-grained details. In contrast, the proposed GCD-DDPM generated more discriminative and change-aware feature maps in all levels. This is because that the proposed GCD-DDPM can enhance the representation and discrimination capabilities of the shallow features while preserving rich local structures. As a result, the proposed GCD-DDPM is capable of handling targeted ground objects of different scales more effectively than its transformer and CNN-based counterparts.
IV-J Ablation Study
| NSSE | SCALE1 | SCALE2 | SCALE3 | OA | F1 | IoU |
|---|---|---|---|---|---|---|
| ✓ | ✓ | 99.32 | 91.32 | 84.35 | ||
| ✓ | ✓ | ✓ | 99.37 | 92.18 | 85.93 | |
| ✓ | ✓ | ✓ | ✓ | 99.39 | 92.54 | 86.52 |
| ✓ | ✓ | ✓ | 99.33 | 91.52 | 84.69 |
Next, we conducted two sets of ablation experiments on the proposed GCD-DDPM. First, we investigated the importance of multi-scale Difference Conditional Encoding Information for change detection performance. We considered difference feature maps of three scales that are referred to as SCALE1, SCALE2 and SCALE3 with SCALE3 being the smallest scale. Two ablation experiments were conducted. In the first ablation experiment, the difference information of the medium scale (SCALE2) and the smallest scale (SCALE3) is employed. In contrast, the second ablation experiment directly feeds the information from the smallest scale (SCALE3) into the last encoding stage without employing the proposed NSSE.
As shown in the first three rows of Table V, the results of the ablation experiments reveal that the performance of the original model outperformed the other two ablated models, indicating that the multi-scale Difference Conditional Encoding Information played a crucial role in enhancing the change detection results. In particular, the large improvement were derived from incorporating both SCALE2 and SCALE3 (the second row), as compared to the case with SCALE3 only (the first row), which confirmed the importance of the medium scale (SCALE2) information.
In the second set of ablation experiments, the proposed NSSE module was removed from the proposed CDDMP. As shown in the last row of Table V, the removal of the proposed NSSE incurred noticeable performance degradation in all three performance metrics as compared to the complete GCD-DDPM. In particular, the F1-score suffered from a large degradation of whereas IoU . This ablation experiment confirmed the crucial role played by the NSSE module in enhancing the model’s performance in change detection tasks.
IV-K Efficiency
| Method | GFLOPs (G) | Para (M) |
|---|---|---|
| FC-EF | 4.727 | 1.350 |
| DT-SCN | 13.22 | 31.26 |
| SNUNet | 13.79 | 3.012 |
| Bit | 8.752 | 3.037 |
| ChangeFormer | 202.7 | 41.02 |
| DDPM-CD | 838.6 | 434.9 |
| GCD-DDPM | 269.5 | 130.8 |
In order to assess the efficiency of the proposed GCD-DDPM, we evaluated its computational and space complexity against other state-of-the-art CD models including FC-EF, DTSCN, Bit, SNUNet, and DDPM-CD in terms of floating-point operations per second (FLOPs) and the number of trainable parameters. As shown in Table VI, the computational complexity of GCD-DDPM is GFLOPs that is significantly lower than that of DDPM-CD ( GFLOPs) but higher than the other non-DDPM based models. In terms of space complexity, GCD-DDPM required million trainable parameters that is greater than most of the other non-DDPM based models. However, GCD-DDPM’s higher computational complexity can be justified by its significantly improved CD performance, as demonstrated in the previous sections.
V CONCLUSION
In this paper, a denoising diffusion probabilistic model-based change detection model called GCD-DDPM has been proposed for remote sensing images. The proposed GCD-DDPM can directly generate high-quality CD maps through end-to-end training, which eliminates the necessity of additional pre-training of diffusion models. In particular, the proposed GCD-DDPM is designed to extract the change information by exploiting a novel Difference Conditional Encoder, which effectively discriminates change information between pre- and post-change images by integrating information from the current-step CD map into the multi-level information derived from the conditional encoder. In addition, attention mechanisms are employed to accomplish information fusion before the change information is extracted from a pixel-wise difference operation. As a result, the proposed GCD-DDPM can dynamically localize and fine-tune the detection results. Extensive experimental results on four CD datasets, namely CDD, WHU, Levier and GVLM, have confirmed that the proposed GCD-DDPM outperform the conventional CD models.
References
- Tian et al. [2013] J. Tian, S. Cui, and P. Reinartz, “Building change detection based on satellite stereo imagery and digital surface models,” IEEE Transactions on Geoscience and Remote Sensing, vol. 52, no. 1, pp. 406–417, 2013.
- Blackman and Yuan [2020] R. Blackman and F. Yuan, “Detecting long-term urban forest cover change and impacts of natural disasters using high-resolution aerial images and lidar data,” Remote Sensing, vol. 12, no. 11, p. 1820, 2020.
- Coppin and Bauer [1996] P. R. Coppin and M. E. Bauer, “Digital change detection in forest ecosystems with remote sensing imagery,” Remote sensing reviews, vol. 13, no. 3-4, pp. 207–234, 1996.
- Woodcock et al. [2020] C. E. Woodcock, T. R. Loveland, M. Herold, and M. E. Bauer, “Transitioning from change detection to monitoring with remote sensing: A paradigm shift,” Remote Sensing of Environment, vol. 238, p. 111558, 2020.
- Singh [1986] A. Singh, “Change detection in the tropical forest environment of northeastern india using landsat,” Remote sensing and tropical land management, vol. 44, pp. 273–254, 1986.
- Zhuang et al. [2016] H. Zhuang, K. Deng, H. Fan, and M. Yu, “Strategies combining spectral angle mapper and change vector analysis to unsupervised change detection in multispectral images,” IEEE Geoscience and Remote Sensing Letters, vol. 13, no. 5, pp. 681–685, 2016.
- Saha et al. [2019] S. Saha, F. Bovolo, and L. Bruzzone, “Unsupervised deep change vector analysis for multiple-change detection in vhr images,” IEEE Transactions on Geoscience and Remote Sensing, vol. 57, no. 6, pp. 3677–3693, 2019.
- Xiao et al. [2019] X. Xiao, Z. Qiang, J. Zhao, Y. Qiang, P. Wang, and P. Han, “A feature extraction method for lung nodules based on a multichannel principal component analysis network (pcanet),” Multimedia Tools and Applications, vol. 78, pp. 17 317–17 335, 2019.
- Lv et al. [2020] Z. Lv, T. Liu, C. Shi, and J. A. Benediktsson, “Local histogram-based analysis for detecting land cover change using vhr remote sensing images,” IEEE Geoscience and Remote Sensing Letters, vol. 18, no. 7, pp. 1284–1287, 2020.
- Zhang and Shi [2020] M. Zhang and W. Shi, “A feature difference convolutional neural network-based change detection method,” IEEE Transactions on Geoscience and Remote Sensing, vol. 58, no. 10, pp. 7232–7246, OCT 2020.
- Ji et al. [2019] S. Ji, S. Wei, and M. Lu, “Fully convolutional networks for multisource building extraction from an open aerial and satellite imagery data set,” IEEE Transactions on Geoscience and Remote Sensing, vol. 57, no. 1, pp. 574–586, JAN 2019.
- Hou et al. [2020] B. Hou, Q. Liu, H. Wang, and Y. Wang, “From w-net to cdgan: Bitemporal change detection via deep learning techniques,” IEEE Transactions on Geoscience and Remote Sensing, vol. 58, no. 3, pp. 1790–1802, MAR 2020.
- Yang et al. [2019] M. Yang, L. Jiao, F. Liu, B. Hou, and S. Yang, “Transferred deep learning-based change detection in remote sensing images,” IEEE Transactions on Geoscience and Remote Sensing, vol. 57, no. 9, pp. 6960–6973, SEP 2019.
- Zhan et al. [2017] Y. Zhan, K. Fu, M. Yan, X. Sun, H. Wang, and X. Qiu, “Change detection based on deep siamese convolutional network for optical aerial images,” IEEE Geoscience and Remote Sensing Letters, vol. 14, no. 10, pp. 1845–1849, 2017.
- Daudt et al. [2018] R. C. Daudt, B. Le Saux, and A. Boulch, “Fully convolutional siamese networks for change detection,” in 2018 25th IEEE International Conference on Image Processing (ICIP). IEEE, 2018, pp. 4063–4067.
- Fang et al. [2022] S. Fang, K. Li, J. Shao, and Z. Li, “Snunet-cd: A densely connected siamese network for change detection of vhr images,” IEEE Geoscience and Remote Sensing Letters, vol. 19, pp. 1–5, 2022.
- Zhang et al. [2020] C. Zhang, P. Yue, D. Tapete, L. Jiang, B. Shangguan, L. Huang, and G. Liu, “A deeply supervised image fusion network for change detection in high resolution bi-temporal remote sensing images,” ISPRS Journal of photogrammetry and remote sensing, vol. 166, pp. 183–200, AUG 2020.
- Shi et al. [2022] Q. Shi, M. Liu, S. Li, X. Liu, F. Wang, and L. Zhang, “A deeply supervised attention metric-based network and an open aerial image dataset for remote sensing change detection,” IEEE Transactions on Geoscience and Remote Sensing, vol. 60, pp. 1–16, 2022.
- Zhu et al. [2022] Q. Zhu, X. Guo, W. Deng, S. Shi, Q. Guan, Y. Zhong, L. Zhang, and D. Li, “Land-use/land-cover change detection based on a siamese global learning framework for high spatial resolution remote sensing imagery,” ISPRS Journal of photogrammetry and remote sensing, vol. 184, pp. 63–78, FEB 2022.
- Zhang et al. [2022a] X. Zhang, W. Yu, and M.-O. Pun, “Multilevel deformable attention-aggregated networks for change detection in bitemporal remote sensing imagery,” IEEE Transactions on Geoscience and Remote Sensing, vol. 60, pp. 1–18, 2022.
- Chen and Shi [2020] H. Chen and Z. Shi, “A spatial-temporal attention-based method and a new dataset for remote sensing image change detection,” Remote Sensing, vol. 12, no. 10, p. 1662, 2020.
- Zheng et al. [2022] Z. Zheng, Y. Zhong, S. Tian, A. Ma, and L. Zhang, “ChangeMask: Deep multi-task encoder-transformer-decoder architecture for semantic change detection,” ISPRS Journal of photogrammetry and remote sensing, vol. 183, pp. 228–239, January 2022.
- Xu et al. [2023] X. Xu, J. Li, and Z. Chen, “Tcianet: Transformer-based context information aggregation network for remote sensing image change detection,” IEEE Journal of Selected Topics in Applied Earth Observations and Remote Sensing, vol. 16, pp. 1951–1971, 2023.
- Zhang et al. [2021] X. Zhang, W. Yu, M.-O. Pun, and M. Liu, “Style transformation-based change detection using adversarial learning with object boundary constraints,” in 2021 IEEE International Geoscience and Remote Sensing Symposium IGARSS. IEEE, 2021, pp. 3117–3120.
- Guo et al. [2022] J. Guo, K. Han, H. Wu, Y. Tang, X. Chen, Y. Wang, and C. Xu, “CMT: Convolutional neural networks meet vision transformers,” in Proceedings of the IEEE/CVF Conference on Computer Vision and Pattern Recognition, 2022, pp. 12 175–12 185.
- Ho et al. [2020] J. Ho, A. Jain, and P. Abbeel, “Denoising diffusion probabilistic models,” Advances in Neural Information Processing Systems, vol. 33, pp. 6840–6851, 2020.
- Li et al. [2022] H. Li, Y. Yang, M. Chang, S. Chen, H. Feng, Z. Xu, Q. Li, and Y. Chen, “Srdiff: Single image super-resolution with diffusion probabilistic models,” Neurocomputing, vol. 479, pp. 47–59, 2022.
- Liu et al. [2022] J. Liu, Z. Yuan, Z. Pan, Y. Fu, L. Liu, and B. Lu, “Diffusion model with detail complement for super-resolution of remote sensing,” Remote Sensing, vol. 14, no. 19, p. 4834, 2022.
- Gao et al. [2023] S. Gao, X. Liu, B. Zeng, S. Xu, Y. Li, X. Luo, J. Liu, X. Zhen, and B. Zhang, “Implicit diffusion models for continuous super-resolution,” in Proceedings of the IEEE/CVF Conference on Computer Vision and Pattern Recognition, 2023, pp. 10 021–10 030.
- Shang et al. [2023] S. Shang, Z. Shan, G. Liu, and J. Zhang, “Resdiff: Combining cnn and diffusion model for image super-resolution,” arXiv preprint arXiv:2303.08714, 2023.
- Wolleb et al. [2022] J. Wolleb, R. Sandkühler, F. Bieder, P. Valmaggia, and P. C. Cattin, “Diffusion models for implicit image segmentation ensembles,” in International Conference on Medical Imaging with Deep Learning. PMLR, 2022, pp. 1336–1348.
- Brempong et al. [2022] E. A. Brempong, S. Kornblith, T. Chen, N. Parmar, M. Minderer, and M. Norouzi, “Denoising pretraining for semantic segmentation,” in Proceedings of the IEEE/CVF conference on computer vision and pattern recognition, 2022, pp. 4175–4186.
- Pinaya et al. [2022] W. H. Pinaya, M. S. Graham, R. Gray, P. F. Da Costa, P.-D. Tudosiu, P. Wright, Y. H. Mah, A. D. MacKinnon, J. T. Teo, R. Jager et al., “Fast unsupervised brain anomaly detection and segmentation with diffusion models,” in International Conference on Medical Image Computing and Computer-Assisted Intervention. Springer, 2022, pp. 705–714.
- Rombach et al. [2022] R. Rombach, A. Blattmann, D. Lorenz, P. Esser, and B. Ommer, “High-resolution image synthesis with latent diffusion models,” in Proceedings of the IEEE/CVF Conference on Computer Vision and Pattern Recognition, 2022, pp. 10 684–10 695.
- Lugmayr et al. [2022] A. Lugmayr, M. Danelljan, A. Romero, F. Yu, R. Timofte, and L. Van Gool, “Repaint: Inpainting using denoising diffusion probabilistic models,” in Proceedings of the IEEE/CVF Conference on Computer Vision and Pattern Recognition, 2022, pp. 11 461–11 471.
- Lei et al. [2023] J. Lei, J. Tang, and K. Jia, “Rgbd2: Generative scene synthesis via incremental view inpainting using rgbd diffusion models,” in Proceedings of the IEEE/CVF Conference on Computer Vision and Pattern Recognition, 2023, pp. 8422–8434.
- Ho et al. [2022] J. Ho, C. Saharia, W. Chan, D. J. Fleet, M. Norouzi, and T. Salimans, “Cascaded diffusion models for high fidelity image generation.” J. Mach. Learn. Res., vol. 23, no. 47, pp. 1–33, 2022.
- Ramesh et al. [2022] A. Ramesh, P. Dhariwal, A. Nichol, C. Chu, and M. Chen, “Hierarchical text-conditional image generation with clip latents,” arXiv preprint arXiv:2204.06125, 2022.
- Kim et al. [2023] M. Kim, F. Liu, A. Jain, and X. Liu, “Dcface: Synthetic face generation with dual condition diffusion model,” in Proceedings of the IEEE/CVF Conference on Computer Vision and Pattern Recognition, 2023, pp. 12 715–12 725.
- Dorjsembe et al. [2023] Z. Dorjsembe, H.-K. Pao, S. Odonchimed, and F. Xiao, “Conditional diffusion models for semantic 3d medical image synthesis,” arXiv preprint arXiv:2305.18453, 2023.
- Bandara et al. [2022] W. G. C. Bandara, N. G. Nair, and V. M. Patel, “DDPM-CD: Remote sensing change detection using denoising diffusion probabilistic models,” arXiv preprint arXiv:2206.11892, 2022.
- Salimans et al. [2015] T. Salimans, D. Kingma, and M. Welling, “Markov chain monte carlo and variational inference: Bridging the gap,” in International conference on machine learning. PMLR, 2015, pp. 1218–1226.
- Zhang et al. [2018] M. Zhang, G. Xu, K. Chen, M. Yan, and X. Sun, “Triplet-based semantic relation learning for aerial remote sensing image change detection,” IEEE Geoscience and Remote Sensing Letters, vol. 16, no. 2, pp. 266–270, 2018.
- Wang et al. [2020] M. Wang, K. Tan, X. Jia, X. Wang, and Y. Chen, “A deep siamese network with hybrid convolutional feature extraction module for change detection based on multi-sensor remote sensing images,” Remote Sensing, vol. 12, no. 2, p. 205, 2020.
- Liu et al. [2016] J. Liu, M. Gong, K. Qin, and P. Zhang, “A deep convolutional coupling network for change detection based on heterogeneous optical and radar images,” IEEE transactions on neural networks and learning systems, vol. 29, no. 3, pp. 545–559, 2016.
- Mou et al. [2018] L. Mou, L. Bruzzone, and X. X. Zhu, “Learning spectral-spatial-temporal features via a recurrent convolutional neural network for change detection in multispectral imagery,” IEEE Transactions on Geoscience and Remote Sensing, vol. 57, no. 2, pp. 924–935, 2018.
- Chen et al. [2021] H. Chen, Z. Qi, and Z. Shi, “Remote sensing image change detection with transformers,” IEEE Transactions on Geoscience and Remote Sensing, vol. 60, pp. 1–14, 2021.
- Bandara and Patel [2022a] W. G. C. Bandara and V. M. Patel, “A transformer-based siamese network for change detection,” in IGARSS 2022-2022 IEEE International Geoscience and Remote Sensing Symposium. IEEE, 2022, pp. 207–210.
- Zhang et al. [2022b] C. Zhang, L. Wang, S. Cheng, and Y. Li, “Swinsunet: Pure transformer network for remote sensing image change detection,” IEEE Transactions on Geoscience and Remote Sensing, vol. 60, pp. 1–13, 2022.
- Pratt [2013] W. K. Pratt, Introduction to digital image processing. CRC press, 2013.
- Lebedev et al. [2018] M. Lebedev, Y. V. Vizilter, O. Vygolov, V. Knyaz, and A. Y. Rubis, “Change detection in remote sensing images using conditional adversarial networks.” International Archives of the Photogrammetry, Remote Sensing & Spatial Information Sciences, vol. 42, no. 2, 2018.
- Bandara and Patel [2022b] W. G. C. Bandara and V. M. Patel, “Revisiting consistency regularization for semi-supervised change detection in remote sensing images,” arXiv preprint arXiv:2204.08454, 2022.
- Zhang et al. [2023] X. Zhang, W. Yu, M.-O. Pun, and W. Shi, “Cross-domain landslide mapping from large-scale remote sensing images using prototype-guided domain-aware progressive representation learning,” ISPRS Journal of Photogrammetry and Remote Sensing, vol. 197, pp. 1–17, 2023.
- Liu et al. [2020] Y. Liu, C. Pang, Z. Zhan, X. Zhang, and X. Yang, “Building change detection for remote sensing images using a dual-task constrained deep siamese convolutional network model,” IEEE Geoscience and Remote Sensing Letters, vol. 18, no. 5, pp. 811–815, 2020.
- Selvaraju et al. [2017] R. R. Selvaraju, M. Cogswell, A. Das, R. Vedantam, D. Parikh, and D. Batra, “Grad-cam: Visual explanations from deep networks via gradient-based localization,” in 2017 IEEE International Conference on Computer Vision (ICCV), 2017, pp. 618–626.
- Ma et al. [2022] X. Ma, X. Zhang, and M.-O. Pun, “A crossmodal multiscale fusion network for semantic segmentation of remote sensing data,” IEEE Journal of Selected Topics in Applied Earth Observations and Remote Sensing, vol. 15, pp. 3463–3474, 2022.