\toolName: Performance Testing for Serverless Computing
Abstract.
Serverless computing is an emerging cloud computing paradigm that allows software engineers to develop cloud applications as a set of functions (called serverless functions). However, accurately obtaining the performance (i.e., response latency) of serverless functions is challenging due to the highly dynamic nature of the environment in which they run. To tackle this problem, a possible solution is to use performance testing to determine how many repetitions of a serverless function with a given input are needed to cater to the performance fluctuation. To this end, we conduct an empirical study of state-of-the-art performance testing techniques for traditional cloud applications on 65 serverless functions collected from top-tier research venues. We find that these techniques exhibit low accuracy. Therefore, we propose \toolName, the first performance testing approach tailored specifically for serverless computing. \toolNameincorporates an accuracy check and a stability check to obtain accurate and reliable performance results. The evaluation demonstrates that \toolNameprovides testing results with 97.22% accuracy, 39.91 percentage points higher than the best currently available technique. We have publicly released the code and data from this study to facilitate future replication and extension.
1. Introduction
Serverless computing is an emerging cloud computing paradigm that has been widely adopted in various software applications (Fouladi et al., 2017; Wu et al., 2022; Müller et al., 2020). It frees software engineers from tedious and error-prone infrastructure management and allows them to focus on developing a cloud application as a set of event-driven functions, called serverless functions (Wen et al., 2021a). Serverless functions can be executed on serverless platforms provided by cloud vendors, such as AWS Lambda (aws, 2022) and Google Cloud Functions (goo, 2022).
The emergence of serverless computing attracts increasing interest from different research communities, such as Software Engineering (SE) and Systems (Wen et al., 2023). Performance is the most studied topic in serverless computing research (Wen et al., 2023). Indeed, it is challenging to obtain accurate and reliable performance (i.e., response latency) measurements for serverless functions due to the following reasons: (1) Serverless platforms, where serverless functions are executed, have a highly dynamic underlying infrastructure (Mahgoub et al., 2022; Fuerst and Sharma, 2022; Perron et al., 2020); (2) Serverless functions typically implement short-lived tasks that require a small memory size (Shahrad et al., 2020; Singhvi et al., 2021). This results in a high-density deployment environment, increasing the risk of performance fluctuations (Zhao et al., 2021; Patterson et al., 2022); (3) Serverless functions can be invoked in a bursty and concurrent manner, which introduces additional performance uncertainty (Shahrad et al., 2019; Mahgoub et al., 2022; Wang et al., 2018a). Under these circumstances, a serverless function can produce highly fluctuating performance results even with multiple identical runs.
To tackle this problem, a possible solution is to use performance testing, a standard procedure for obtaining and evaluating the performance of a software application (Zhao et al., 2019; Burger et al., 2019; He et al., 2021). Typically, performance testing is conducted by repeatedly executing the application-under-test with a set of inputs until a stopping criterion deems that the performance results obtained from the test are accurate (Mostafa et al., 2017; Maricq et al., 2018; Uta et al., 2020; He et al., 2019, 2021; Alghmadi et al., 2016).
Recently, the SE literature has witnessed a series of performance testing techniques for cloud applications, including the state-of-the-art PT4Cloud (He et al., 2019) presented at ESEC/FSE 2019 and Metior (He et al., 2021) presented at ASE 2021. These techniques are designed for cloud applications that are developed based on a traditional cloud computing paradigm, i.e., Infrastructure-as-a-Service (IaaS) (Bhardwaj et al., 2010), which requires engineers to configure and manage the infrastructure. PT4Cloud and Metior analyze the given performance results of traditional cloud applications obtained from daily or weekly run intervals to determine whether the performance results meet the designed stopping criterion. Their stopping criterion is when there is no significant change in stability between the performance result set of the current test and the performance result set obtained from the previous run intervals. Although these techniques have been demonstrated to be effective for traditional cloud applications, it is unclear whether their effectiveness can be generalized to the new cloud computing paradigm - serverless computing.
In this paper, we first conduct an empirical study on the effectiveness of PT4Cloud and Metior on serverless computing. To this end, we collect 65 serverless functions from 59 papers published in top-tier research venues. We use the performance results of 1,000 identical runs (the maximum number of runs used in the literature) of a serverless function as its ground-truth performance. The evaluation of the 65 serverless functions shows that PT4Cloud and Metior can respectively provide testing results with only 48.64% and 57.31% accuracy. The low accuracy can be attributed to the characteristic of serverless functions. For example, serverless functions typically perform short-lived tasks (often in milliseconds) (Wang et al., 2018a; Shahrad et al., 2020; Singhvi et al., 2021). Their response latency shows trivial fluctuation in numerical values compared to traditional cloud applications with longer execution times. Therefore, it is easier for PT4Cloud and Metior to achieve their stopping criterion and stop repeated runs.
Inspired by the empirical results, we propose \toolName, the first performance testing approach tailored specifically for serverless computing. It poses a strict requirement on accuracy and utilizes an accuracy check and a stability check to determine the stopping criterion for repeated runs. The accuracy check uses the non-parametric confidence interval to check whether a specific performance is accurate. For the performance result set of the current test, if most of its performance satisfies this accuracy check, it is considered accurate. The stability check examines whether the performance result set of the current test and the performance result set obtained from the previous run intervals are both accurate. If this is true, \toolNamedeems that the performance result set of the current test is sufficient to represent accurate serverless function performance and terminate the run repetitions. We evaluate \toolNameusing the aforementioned 65 serverless functions. On average, \toolNameprovides testing results with 97.22% accuracy, 48.58 percentage points higher than PT4Cloud, and 39.91 percentage points higher than Metior. In summary, this paper makes the following contributions:
-
•
Study: An empirical study of the effectiveness of state-of-the-art performance testing techniques originally designed for traditional cloud applications for serverless functions.
-
•
Technique: The first performance testing technique tailored specifically for serverless computing, which utilizes an accuracy check and a stability check.
-
•
Replication package: A public repository including all the data and scripts used in this study (our, 2023).
2. Background
2.1. Serverless computing
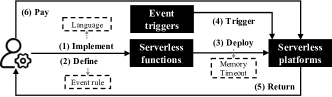
In serverless computing, developers can focus on application implementation based on serverless functions. Figure 1 depicts the process of using serverless computing for software developers. (1) First, developers implement event-driven serverless functions using high-level programming languages, e.g., Python and JavaScript (ser, 2022a, b; Eskandani and Salvaneschi, 2021; Eismann et al., 2021). (2) Second, developers can define specific rules that bind their serverless functions to the corresponding events, e.g., HTTP requests and data updates in cloud storage. (3) Then, serverless functions are deployed to the serverless platform along with their dependent libraries, e.g., Numpy. During this phase, developers can provide specific function configurations, e.g., memory size and timeout time (Wen et al., 2023; Hassan et al., 2021). (4) When the serverless function is triggered by predefined events, the serverless platform automatically launches new function instances or reuses existing ones to process requests. (5) Upon completion of executions, the serverless platform returns the results to developers. (6) Finally, developers pay for the cost according to the number of requests and the resources actually allocated or consumed by the serverless function (Lin and Khazaei, 2020; Wen et al., 2023).
The performance of serverless computing has gained widespread attention in the serverless computing literature (Wen et al., 2023; Li et al., 2022a; Mampage et al., 2021; Hassan et al., 2021). Researchers have proposed various solutions to optimize serverless function performance (Lin and Khazaei, 2020; Singhvi et al., 2021; Shahrad et al., 2020; Liu et al., 2023). Serverless function performance can be classified into two types: cold-start performance and warm-start performance. When the serverless function is executed on newly launched instances in the serverless platform, it will produce cold-start performance. If the serverless platform has reusable instances for the same serverless function to handle requests within a short keep-alive time (e.g., 7 minutes for AWS Lambda (aws, 2021)), the serverless function will produce warm-start performance.
In this paper, the serverless function performance that we focus on is response latency, i.e., the time period between sending a request to invoke a function and receiving the execution result. Response latency is a common metric used for performance evaluation and optimization of serverless functions (Mahgoub et al., 2022; Zhao et al., 2021; Eismann et al., 2021; Wen et al., 2021b, a).
2.2. State-of-the-art performance testing for cloud applications: PT4Cloud and Metior
The serverless computing literature lacks research on performance testing for serverless functions. However, two state-of-the-art performance testing techniques for traditional cloud applications have recently been proposed: PT4Cloud (He et al., 2019) and Metior (He et al., 2021). The cloud applications that they test are developed based on IaaS (Bhardwaj et al., 2010), a traditional cloud computing pattern that allows developers to lease the required computation, storage, and network resources and then configure and manage the infrastructure. PT4Cloud (He et al., 2019) and Metior (He et al., 2021) analyze the performance results of traditional cloud applications collected at daily or weekly run intervals to check whether they reach the stopping criterion that deems the tested performance results to be accurate. In fact, their stopping criterion relies on the stability assessment of performance distributions. PT4Cloud and Metior respectively compare the distribution similarity and changes in a performance metric between two sets of performance results: the performance result set of the current test and the performance result set obtained from the previous run intervals. Next, we will introduce the main design of PT4Cloud and Metior.
PT4Cloud employs a statistical approach to determine the similarity between and . PT4Cloud returns a similarity probability that indicates the likelihood of the two sets being similar. Developers set an objective probability (e.g., 90%) to represent their accuracy requirements. Generally, a higher indicates a stricter accuracy demand and may require more repeated runs. If , it indicates that is stable and can be used to report the performance of the application. Otherwise, repeated runs of the next run interval are conducted to add new performance data to .
The computation of between and involves three steps. First, and are transformed as the non-parametric probability density functions (Parzen, 1962), denoted as and , respectively. Second, Kullback-Leibler (KL) divergence, which can handle any distribution (Kullback and Leibler, 1951), is utilized to measure the degree of divergence between and . Finally, to provide an intuitive understanding of the degree of divergence, PT4Cloud transforms KL values using multinomial likelihood from the likelihood theory (Shlens, 2007) into the similarity probability . A value of 100% for indicates that and are completely the same.
Metior leverages the block bootstrapping method (Politis and White, 2004) to determine if there is a maximum possible change in a performance metric (e.g., the median) for and . Developers can specify a maximum allowed percentage error (e.g., 3%), which can be adjusted per their requirements. A lower represents a stricter allowable error. If the maximum possible change for and is less than , it indicates that the maximum difference between and is often smaller than . Then, is considered stable, and repeated runs can be terminated since the performance from is deemed accurate. If the maximum possible change exceeds , repeated runs of the next run interval will be conducted to add new performance data to for new performance testing.
The maximum possible change for and is calculated as follows. First, Metior obtains the values of a specific performance metric from and , respectively. For instance, the median value of is , while that of is . Second, Metior determines the percentage difference between and , i.e., . In particular, Metior utilizes the block bootstrapping method (Politis and White, 2004) to obtain multiple sets of performance results (i.e., and ) by resampling from and , respectively. Metior calculates the corresponding metric values (i.e., and ) from and , as well as their percentage difference . For example, conducting 1,000 resamples can yield 1,000 percentage differences, i.e., , , …, . Metior ranks percentage differences and calculates their confidence interval, denoted by (, ), with a confidence level (e.g., 95%). Finally, Metior checks whether (, ) falls within the range of (-, ) to stop the repeated runs. In Metior, the block size of the block bootstrapping method can be automatically selected based on the performance distribution.
3. Study on PT4Cloud and Metior
PT4Cloud and Metior have been evaluated on performance results produced by traditional cloud applications. However, it is unclear whether their effectiveness can be generalized to serverless computing. Therefore, we conduct an empirical study to evaluate their effectiveness on performance results of serverless functions. We first present two research questions. To answer them, we collect relevant serverless functions to be tested.
3.1. Research questions
We explore two research questions to study the effectiveness of PT4Cloud and Metior on performance results of serverless functions.
RQ1: How effective are the state-of-the-art performance testing techniques for serverless functions? This RQ explores the effectiveness of PT4Cloud and Metior with the default configurations in testing serverless function performance. Moreover, we further analyze testing results obtained by PT4Cloud and Metior under different constraints of their stopping criteria to investigate the characteristics of these techniques.
RQ2: How well do the state-of-the-art techniques apply to serverless functions under different numbers of repetitions of the run interval? This RQ investigates the effect of different numbers of repetitions of the run interval on the effectiveness of PT4Cloud and Metior in performance testing for serverless functions.
3.2. Collection of serverless functions
To obtain relevant serverless functions, we collect research papers on serverless computing and select serverless functions from them.
|
2017 | 2018 | 2019 | 2020 | 2021 | 2022 | |
|---|---|---|---|---|---|---|---|
| #Papers | 1 | 7 | 5 | 14 | 19 | 22 |
Relevant research papers. Several research communities, such as Software Engineering (Wen et al., 2023), Operating Systems (Mahgoub et al., 2022), Services Computing (Li et al., 2022a), and Computer Networks (Fouladi et al., 2017), have extensively investigated serverless computing and published their studies at the corresponding top-tier conferences. Thus, we collect relevant research papers from top-tier conferences suggested by Computer Science Rankings (CSRankings) (csr, 2022). The collection process contains three steps. (1) We obtain all research papers published in top-tier conferences from CSRankings, and these papers are available online between 2014 (the year that serverless computing started to popular (Jonas et al., 2019; Wen et al., 2021a)) and October 12, 2022 (the date that we started to collect papers). (2) The first two authors filter out research papers unrelated to serverless computing by independently reading the title and abstract parts of the paper. To evaluate the inter-rater agreement level, we use the most widely used evaluation metric (Uta et al., 2020; Wen et al., 2021a, 2023), Cohen’s Kappa () (Cohen, 1960). The value is 0.946, indicating a high level of agreement and a reliable labeling process (Landis and Koch, 1977). In cases of conflicts, the third arbitrator, who has a decade of research experience in cloud computing, is asked to address conflicts. We collect a total of 68 research papers on serverless computing. Table 1 shows the number of these papers published per year. We observe a rapid growth trend in the last three years (2020 - 2022). (3) As our study aims to evaluate serverless function performance using performance testing techniques, the first two authors jointly select papers that reported serverless function performance from the 68 papers. Finally, 59 papers (86.76% of the total) are retained. These papers cover widely used benchmarks from the serverless computing community, e.g., ServerlessBench (Yu et al., 2020), FunctionBench (Kim and Lee, 2019), and FaaSDom (Maissen et al., 2020).

Relevant serverless functions. We consider serverless functions with the following characteristics: (1) being executed on widely adopted public serverless platforms (ser, 2022b; Eismann et al., 2021; Hassan et al., 2021), i.e., AWS Lambda and Google Cloud Functions; (2) being written in widely used programming languages in the serverless computing community (ser, 2022a, b; Eismann et al., 2021; Eskandani and Salvaneschi, 2021), i.e., Python and JavaScript. Meanwhile, we further identify serverless functions that have been open-sourced and for which relevant documentation has been released to guide the implementation process. Finally, we identify 65 serverless functions that perform various tasks, including machine learning, video processing, Web request, and natural language processing. The distribution of these functions is shown in Figure 2. Out of the 65 functions, 60 are executed on AWS Lambda, while the remaining 5 functions are executed on Google Cloud Functions. This can be attributed to the fact that AWS Lambda is the main driver of the popularity of serverless computing (Jonas et al., 2019; Wen et al., 2021a). As for languages, 53 of the functions are written in Python, whereas the remaining 12 are written in JavaScript. This can be because recent serverless computing-related papers often evaluate machine learning-related tasks, which generally utilize Python-based third-party libraries, e.g., Scikit Learn.
3.3. Experimental setup
Execution configurations of serverless functions. We execute 65 serverless functions using the original function configurations and serverless platforms specified in their original papers. If a configuration is not provided in the paper or its related documentation, we use the default configuration of the platform. At the time of our study, AWS Lambda uses a default memory size of 128 MB (AWS, 2023a) and a timeout of 3 seconds (AWS, 2023b), while Google Cloud Functions adopts a default memory size of 256 MB (Goo, 2023a) and a timeout of 60 seconds (Goo, 2023b). If the configured memory size or timeout time is insufficient to support executions, we increase the value of these parameters and test the serverless function again to ensure successful execution.
We repeatedly invoke the serverless function to produce a series of performance results, which are input to performance testing techniques to check when the repeated runs can be stopped. If the stopping criterion is not reached, we start the next run interval to generate more performance data. By default, we set the number of repetitions of the run interval to five repetitions, a commonly used experimental setting in serverless computing work (Mvondo et al., 2021; Ao et al., 2022; Jangda et al., 2019). This small number allows us to obtain a fine-grained stop location and reduce the unnecessary overhead of running the serverless function. We evaluate the effectiveness of performance testing techniques using cold-start and warm-start performance of the serverless functions. The cold-start performance is obtained by invoking the function after the resources generated by previous invocations have been released. The warm-start performance is obtained by invoking the function before releasing the resources from previous invocations. We use a half-hour invocation frequency for cold-start performance and a five-second frequency for warm-start performance, both after the previous invocation, as they can ensure the serverless function experiences cold and warm starts. For performance testing techniques, we use the same performance results of the serverless functions to fairly compare their effectiveness.
Parameter configurations of PT4Cloud and Metior. To answer RQ1, we use the default settings of PT4Cloud and Metior provided in their open-sourced code. For PT4Cloud, we use the default objective probability () of 90%, i.e., expecting the accuracy of testing results to be at least 90%. For Metior, we use the maximum allowed percentage error () of 3% for the median performance and the confidence level of 95%. We also adjust the key parameters for the stopping criterion of performance testing: of PT4Cloud and of Metior. We set to values of 90%, 92%, 94%, 96%, and 98%, where 92%, 94%, 96%, and 98% are stricter constraints that have not been used in previous evaluations of PT4Cloud (He et al., 2019). We set to values of 5%, 4%, 3%, 2%, and 1%, where 2% and 1% are also stricter constraints not used in previous evaluations of Metior (He et al., 2021). To answer RQ2, we vary the number of repetitions of the run interval as 3, 4, 5, 10, and 20, which are commonly used in serverless computing papers (Perron et al., 2020; Fuerst and Sharma, 2022; Mvondo et al., 2021; Wang et al., 2019; Akkus et al., 2018; Ao et al., 2022, 2022; Jangda et al., 2019) for the total experimental repetitions. Taking these values as the number of repetitions of one run interval, we could investigate if adding a cycle of performance data affects testing results and if the repetitions specified in previous work are sufficient to obtain accurate performance. For the other parameters of PT4Cloud and Metior, we use their default settings.
Evaluation strategy and metrics. We use the performance results of the serverless function being executed 1,000 times as the ground truth performance for identifying the effectiveness of testing results. For the ground truth, we need a relatively large number of performance tests, which can truly cover all potential impacts of platforms. We observe that 1,000 is the highest number of repetitions used in the collected 59 papers (Wang et al., 2018a; Li et al., 2022b). Therefore, we consider 1,000 times as a relatively large number to cover most potential impacts of the serverless platform. We apply performance testing techniques to determine the termination of the repeated runs for the serverless function, i.e., the stop location. The performance data tested in the stop location is deemed to be the accurate performance distribution of the serverless function acquired with the techniques. We compare this distribution with the performance distribution of ground truth using the following two evaluation metrics.
Accuracy: He et al. (He et al., 2019) define the accuracy of performance testing results as the similarity between the performance distribution acquired with performance testing techniques and the corresponding ground truth distribution. The value of the similarity metric proposed by PT4Cloud (He et al., 2019) ranges from 0 to 100%, where 100% indicates the same distribution. We calculate the mean accuracy of the testing results obtained for all tested serverless functions.
Credibility: Previous work (Uta et al., 2020) defines the credibility of the obtained performance result as whether its specific percentile performance is accurate. When a percentile performance obtained from the performance distribution acquired with performance testing techniques falls within the 95% confidence interval for this percentile obtained from the corresponding ground truth distribution, it indicates a 95% probability that this percentile performance is accurate (Uta et al., 2020). It also indicates that the performance testing techniques enable the tested serverless function to get this credible percentile performance. This previous work (Uta et al., 2020) has focused on the performance at the 50th and 90th percentiles to assess the result credibility. To obtain more comprehensive results, we investigate the credibility of testing results from different performance perspectives by extending the percentiles to include the 25th, 50th, 75th, and 90th percentiles. We respectively calculate the percentage of the serverless functions with a credible performance at different percentiles.
Experimental environment. We implemented and ran PT4Cloud, Metior, and the invocation scripts for serverless functions on an Ubuntu 18.04.4 LTS server with an Intel Xeon (R) 4-core processor and 24GiB of memory. The performance testing experiments were conducted between January 10, 2023 and February 28, 2023.
3.4. RQ1: Effectiveness of PT4Cloud and Metior
|
|
|
|
|
||||||||||
| PT4Cloud - cold | 51.30% | 12.31% (8/65) | 12.31% (8/65) | 15.38% (10/65) | 21.54% (14/65) | |||||||||
| PT4Cloud - warm | 45.97% | 23.08% (15/65) | 9.23% (6/65) | 13.85% (9/65) | 18.46% (12/65) | |||||||||
| Mean | 48.64% | 17.70% | 10.77% | 14.62% | 20.00% | |||||||||
| Metior - cold | 61.04% | 24.62% (16/65) | 23.08% (15/65) | 29.23% (19/65) | 18.46% (12/65) | |||||||||
| Metior - warm | 53.58% | 23.08% (15/65) | 24.62% (16/65) | 27.69% (18/65) | 30.77% (20/65) | |||||||||
| Mean | 57.31% | 23.85% | 23.85% | 28.46% | 24.62% |
PT4Cloud provides testing results with 48.64% mean accuracy in cold-start and warm-start performance testing for serverless functions. Moreover, on average, it enables 17.70%, 10.77%, 14.62%, and 20.00% of the serverless functions to get the credible 25th, 50th, 75th, and 90th percentile performance, respectively. This indicates the low effectiveness of PT4Cloud. Specifically, Table 2 shows these results of PT4Cloud. For cold starts, PT4Cloud provides a mean accuracy of 51.30% for the 65 serverless functions, indicating that the performance distribution acquired with PT4Cloud has a low similarity to the ground truth distribution. Only 12.31% of the tested functions get the credible 25th or 50th percentile performance, while 15.38% get the credible 75th percentile performance, and 21.54% get the credible 90th percentile performance. As a result, the performance results obtained by PT4Cloud still fail to get credible percentile performance for at least 78.46% of the functions. For warm starts, PT4Cloud provides a mean accuracy of 45.97%. Similarly, 23.08%, 9.23%, 13.85%, and 18.46% of the tested functions get the credible 25th, 50th, 75th, and 90th percentile performance, respectively.
Metior provides testing results with 57.31% mean accuracy in cold-start and warm-start performance testing for serverless functions. Moreover, on average, it provides the credible 25th, 50th, 75th, and 90th percentile performance for 23.85%, 23.85%, 28.46%, and 24.62% of the functions, respectively. This indicates the low effectiveness of Metior. Specifically, Table 2 shows these results of Metior. For cold starts, Metior provides a mean accuracy of 61.04%, indicating a low distribution similarity to the ground truth. Moreover, the 25th, 50th, 75th, and 90th percentile performance obtained by Metior are credible for 24.62%, 23.08%, 29.23%, and 18.46% of the serverless functions, respectively. For warm starts, Metior provides a mean accuracy of 53.58%. The 25th, 50th, 75th, and 90th percentile performance obtained by Metior are credible for 23.08%, 24.62%, 27.69%, and 30.77% of the serverless functions, respectively.
We further compare the effectiveness of PT4Cloud and Metior under varying values of and , respectively. These values reflect the constraint of their stopping criteria. The results show that these constraints have different effects on the effectiveness.
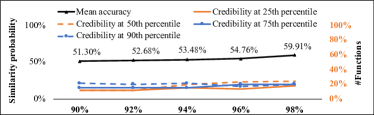
For PT4Cloud, we do not observe significant improvement in evaluation metrics as increases from 90% to 98%. Specifically, Figure 3 illustrates the changes in metric values obtained by PT4Cloud when evaluating the cold-start performance of the serverless functions under varying . The mean accuracy changes from 51.30% to 59.91%. Although PT4Cloud makes more functions to obtain credible percentile performance, the improvement is insignificant. Even if is constrained to 98%, only 18.46%, 24.62%, 20.00%, and 20.00% of the functions can get the credible 25th, 50th, 75th, and 90th percentile performance, respectively. For warm starts, PT4Cloud provides similar results as the cold starts, with mean accuracy changing from 45.97% to 53.28%. When = 98%, PT4Cloud enables 20.00%, 13.85%, 13.85%, and 24.62% of the functions to get the credible 25th, 50th, 75th, and 90th percentile performance, respectively. Due to the space limit, we do not show figures for warm-start results. 111All figures about warm-start results are included in our repository (our, 2023)
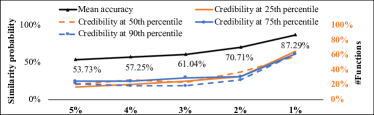
For Metior, the obtained mean accuracy improves from 53.73% to 87.29% in cold starts and from 47.97% to 87.67% in warm starts, as changes from 5% to 1%. Specifically, Figure 4 shows the changes in metric values obtained by Metior when evaluating the cold-start performance of the functions under different . The mean accuracy improves from 53.73% to 87.29% as becomes stricter, indicating that using a stricter maximum allowed error can improve the effectiveness of Metior. However, even if is limited to 1%, the mean accuracy (87.29%) of testing results obtained by Metior does not exceed 90%. Moreover, the percentage of serverless functions with credible performance is low. For example, for the 50th percentile performance, when = 1%, Metior enables 58.46% of the serverless functions to get this credible performance, while when = 5%, only 20.00% of the functions get this credible performance. For warm starts, Metior produces comparable results to cold starts. The mean accuracy increases from 47.97% to 87.67%. When = 1%, Metior provides the credible 50th percentile performance for 61.54% of the functions, compared to only 16.92% at = 5%.
Overall, the effectiveness of Metior outperforms PT4Cloud, suggesting that performance results of serverless functions may have interval data dependency. However, this dependency effect may not be significant in serverless computing. PT4Cloud and Metior have different sensitivity to the constraint of their stopping criteria. While the effectiveness of PT4Cloud does not significantly improve as the constraint is raised, Metior shows an accuracy improvement from 53.73% to 87.29% in cold starts. However, even under the strictest constraint, the accuracy obtained by Metior does not exceed 90%. Overall, the stopping criteria used by PT4Cloud and Metior may be insufficient for serverless computing.
3.5. RQ2: Changes under different numbers of repetitions of the run interval for PT4Cloud and Metior
We further evaluate the effectiveness of PT4Cloud and Metior under varying numbers of repetitions of the run interval. We observe the positive effect of the run interval on their effectiveness.
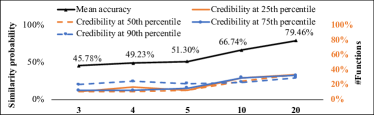
For PT4Cloud, the obtained mean accuracy increases from 45.78% to 79.46% in cold starts and from 34.60% to 75.42% in warm starts, as the number of repetitions of the run interval increases from 3 to 20. Specifically, Figure 5 shows the changes obtained by PT4Cloud in cold-start performance testing. The mean accuracy increases from 45.78% to 79.46%, indicating the positive effect of the run interval on the effectiveness of PT4Cloud. However, while increasing the number of repetitions of the run interval enables more functions to get credible performance, PT4Cloud still does not enable at least 66.15% of the functions to achieve it, as shown in Figure 5. For warm starts, PT4Cloud also shows a positive effect as the number of repetitions of the run interval increases, with the mean accuracy increasing from 34.60% to 75.42%. However, when the number of repetitions of the run interval is set to 20, 52.31% of the functions still do not get credible performance.
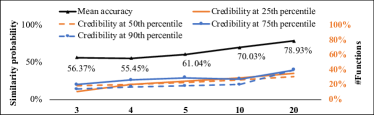
For Metior, as the number of repetitions of the run interval increases from 3 to 20, the obtained mean accuracy increases from 56.37% to 78.93% in cold starts and from 48.01% to 74.39% in warm starts. Specifically, Figure 6 shows the results obtained by Metior in cold-start performance testing. The mean accuracy increases from 56.37% to 78.93%, indicating a positive effect of the run interval on the effectiveness of Metior. However, the accuracy of testing results is still no more than 80%, similar to the results obtained by PT4Cloud. In terms of the credibility of testing results, for example, Metior enables only 30.77% of the functions to get the credible 50th percentile performance when the number of repetitions of the run interval is set to 20. As a result, 69.23% of the serverless functions still cannot get this credible performance. For warm starts, Metior also shows a positive effect with a mean accuracy ranging from 48.01% to 74.39%. Similarly, when the number of repetitions of the run interval is set to 20, 55.38% of the serverless functions still do not get the credible 50th percentile performance.
Overall, we observe that the effectiveness of PT4Cloud and Metior are sensitive to the number of repetitions of the run interval, with improved accuracy and credibility as the number increases. However, the run interval with a small number is typically used in serverless computing. Moreover, from our results, even if the number of repetitions of the run interval is set to 20, the maximum accuracy of testing results obtained by PT4Cloud and Metior is 79.46% and 78.93%, respectively. Moreover, at least 52.31% of the serverless functions still cannot get credible percentile performance.
3.6. Enlightenment
PT4Cloud and Metior are not effective for the performance testing of serverless functions. The possible explanations are as follows.
Short duration. The response latency of serverless functions is often at millisecond level (Shahrad et al., 2020; Zhao et al., 2021). The small duration may lead to trivial performance fluctuation in the numerical value compared to traditional cloud applications’ long-lived and minute-level duration. Thus, there may be little change in stability between performance results, thus terminating repeated runs earlier than necessary.
Small run interval. In one run interval of performance testing, the number of performance results obtained from repeatedly running the serverless function is usually small. This is because the serverless computing scenario typically uses small repetitions. The reasons are as follows. (1) Serverless functions can be triggered at any time, which makes it convenient to obtain any number of performance results. Moreover, developers pay for the cost based on the number of invocations and the resources consumed. However, PT4Cloud and Metior previously tested a large number of performance results of traditional cloud applications obtained from the week- or day-based time intervals. These cloud applications are executed on servers that are always leased (Wen et al., 2023; Jonas et al., 2019; Bhardwaj et al., 2010). Even if servers do not execute any application, developers still have to pay for them. Thus, performing a lot of repetitions on the server will make it cost-effective. (2) In our analysis of research work on serverless computing, we observe that experimental evaluation of previous work typically used a specific number of runs performed on serverless functions. This number is often small repetitions, e.g., 3, 4, 5, 10, and 20 times, thus obtaining a small number of performance results. In contrast, previous cloud computing-related work (Bhardwaj et al., 2010; He et al., 2019, 2021) adopted a period of time of runs to constantly invoke traditional cloud applications for execution. This time is often several weeks or days, thus yielding a large number of performance results. Overall, when testing serverless function performance, using the number of repetitions of the run interval specifically for serverless computing will produce a small amount of new performance data, which may cause little change in stability between performance distributions to be compared. Thus, PT4Cloud and Metior prematurely achieve their stopping criteria to terminate the repeated runs.
We further check the distribution similarity values when applying PT4Cloud to test serverless function performance. These values are basically greater than 99%. Even when we use a large number (e.g., 20) of repetitions in one run interval to produce and add new performance data, most of the similarity values obtained remain around 98%. We check the maximum possible changes in the median performance between performance distributions calculated by Metior. Most changes remain below 2%. When using a run interval with 20 repetitions, most changes remain below 3%. Thus, PT4Cloud and Metior can too early terminate the repeated runs when testing serverless function performance, causing low accuracy.
Therefore, a new performance testing approach with high accuracy is required to test serverless function performance.
4. A New Technique: \toolName
Inspired by our empirical results, we propose \toolName, a new performance testing approach for serverless computing. \toolNameis an automated performance tester for serverless functions that provides accurate and reliable performance results. To use \toolName, developers only need to provide the performance result set of a serverless function with a given input, and \toolNameautomatically determines whether this set accurately reflects real performance and whether more repeated runs are necessary. Within \toolName, we design a stopping criterion with high accuracy to determine if the performance result set of the current test is sufficiently accurate to terminate the execution of further repeated runs. Our stopping criterion comprises two parts: accuracy check and stability check.
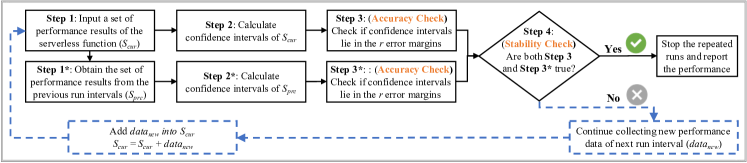
4.1. Overview of \toolName
Figure 7 gives the workflow of \toolName. First, developers input a set of performance results generated by the serverless function to be evaluated, denoted as (Step 1). Second, \toolNamecalculates the required values (e.g., confidence interval) and then performs the accuracy check (Steps 2 and 3). To ensure the reliability of the performance result acquired with our approach, \toolNamealso conducts the same accuracy check for the performance result set obtained from the previous run intervals, denoted as , which is obtained by removing performance data produced by the last run interval from the end of the (Step 1*). \toolNamethen calculates the required values from and conducts the accuracy check (Step 2* and Step 3*). Next, \toolNameperforms the stability check of the stopping criterion to check whether the returned results of Step 3 and Step 3* are both true (Step 4), i.e., satisfying the accuracy check. If yes, \toolNamecan give information that the performance result set of current test is available to represent the actual serverless function performance, and no further repeated runs are needed. Otherwise, developers continue running the serverless function several times (i.e., the number of repetitions specified by one run interval), and the produced new performance data, denoted as , are added to to form a new set of performance results to be evaluated. \toolNamethen conducts a new round of performance testing using the same processing steps.
4.2. Stopping criterion of \toolName
Our stopping criterion includes the accuracy check and the stability check. The accuracy check is designed to ensure the high accuracy of the obtained performance result, while the stability check aims to alleviate the possible influence of result fluctuations and ensure the stability of the result. We will introduce them in detail.
For the accuracy check, \toolNamechecks if the confidence intervals for specified metrics (at the given confidence level), calculated from the performance result set of the current test (), lie within the corresponding error margins of the observed true metrics. For example, \toolNamedetermines whether the calculated 95% confidence interval for the 50th percentile lies within a 1% error margin of the observed true 50th percentile performance. Adopting such an accuracy check aims to find the desired and accurate confidence interval (CI), where the obtained empirical value of a specific metric (e.g., 50th percentile) differs from its observed true performance by no more than the error at a given confidence level. We use CI since it can achieve a robust analysis in the face of random performance fluctuations (Uta et al., 2020). To improve the overall accuracy of the performance result acquired with \toolName, \toolNameconducts the same accuracy check to most performance of . Most performance of a performance distribution typically includes performance results from the 25th percentile to the 75th percentile (Maricq et al., 2018; Zhao et al., 2021; Uta et al., 2020). Moreover, the 50th percentile performance represents the midpoint of the performance distribution and plays an important role in performance analysis (Maricq et al., 2018; Uta et al., 2020). Thus, our accuracy check becomes whether the CIs for the 25th, 50th, and 75th percentiles, calculated from , fall within the error margin of their respective observed true percentile performance, referred to Step 3 in Figure 7. If it is satisfied, is considered accurate.
For the stability check, \toolNamechecks whether both and the performance result set obtained from the previous run intervals () are accurate. This is because potential performance fluctuations could make get a temporary result of meeting the accuracy check. However, performance data might be unstable and thus yield unreliable testing results. Thus, we take the accuracy of into account. Different from the PT4Cloud and Metior that analyze the statistical stability or significant change of distributions, our stability check indirectly reflects the stability of by leveraging the aforementioned accuracy check to . Therefore, we deem to be stable when obtained from previous run intervals also exhibits most of its performance to be accurate. That is to say, for both and , the calculated CIs for the 25th, 50th, and 75th percentiles all lie within the error margin of the observed true 25th percentile, 50th percentile, and 75th percentile performance, respectively. This process refers to Step 4 in Figure 7.
4.3. Variants of \toolName
relies on our accuracy check, which compares the range of the calculated CI with the error margin. We consider non-parametric methods to calculate the required CIs in our approach design. The reason is as follows. We conduct a normality test on performance results for the collected serverless functions. The most powerful normality test (Wpo, 2022), the Shapiro-Wilk test (Shapiro and Wilk, 1965), is applied to performance results with 50 runs of the serverless function. The results show that the performance of over 90% of the serverless functions follows a non-normal distribution in both cold and warm starts. Thus, non-parametric methods are suitable for the performance analysis of serverless functions. Moreover, non-parametric methods work for the performance data with a normal distribution (Maricq et al., 2018). We implement the non-parametric calculation of the CI for the percentile, for Step 2 and Step 2* in Figure 7, based on three types of methods. The following are three variants of \toolName.
\toolName1: We use the general method to calculate CIs. Referring to the method mentioned in previous work (Le Boudec, 2010; Uta et al., 2020; Maricq et al., 2018), the CI for any percentile with a given confidence level can be obtained. First, this method sorts all performance results as a sorted set in ascending order. Then, it is based on data size and the given confidence level to calculate two numbers and uses them as indexes in the sorted set. Values at these two locations are the lower and upper bounds of the CI with a given confidence level.
\toolName2: We use the basic bootstrapping method (Maricq et al., 2018; He et al., 2021) based on resampling technique to calculate CIs. For a given set of performance data, this method constructs the new set of performance results by randomly selecting the performance data from the given set of performance results with replacement. This selection is repeated for times to obtain performance data to constitute a new set. This process is called one resample. The bootstrapping method repeats this process times to obtain resample sets of performance results. Generally, is set to be no less than 1,000 to work properly (He et al., 2021). For each resample set, performance at a specific percentile (e.g., 50th) can be obtained. Finally, values on percentile performance are obtained and sorted. The lower and upper bounds of the CI can be determined based on the sorted values and a given confidence level. For example, for the 95% confidence level, the values at 2.5th percentile and 97.5th percentile in the sorted values are lower and upper bounds of the CI for this percentile.
\toolName3: We use the block bootstrapping method, as described in Metior (He et al., 2021), to calculate CIs. We also apply the automated selection of block size used in Metior to this method. Unlike the basic bootstrapping method, in the block bootstrapping method, the data selection of a round resample becomes the selection and combination of the block data with continuous performance results. For each resample set containing multiple block data, its percentile performance can be calculated. Conducting times of resamples will obtain the total of values about the percentile performance. These values are still sorted, and the lower and upper bounds of the CI for this percentile are generated with a given confidence level.
5. Evaluation
5.1. Research questions
We explore two research questions for studying the effectiveness of \toolNameon the same performance results of the serverless functions used in studying PT4Cloud and Metior.
RQ3: How effective is \toolNamefor serverless functions? This RQ aims to explore the effectiveness of \toolNamein testing serverless function performance. Moreover, we investigate the effectiveness of \toolNameunder different constraints of our stopping criterion.
RQ4: How well does \toolNameapply to serverless functions under different numbers of repetitions of the run interval? This RQ aims to investigate the effect of the different numbers of repetitions of the run interval on the effectiveness of \toolName.
5.2. Experimental settings
We use the same execution configurations of serverless functions, evaluation strategy and metrics, and experimental environment as described in Section 3.3 to evaluate the effectiveness of \toolName.
Parameter configurations of \toolName. To answer RQ3, the confidence level and error demand of \toolNameuse by default the values that have been widely adopted by previous work on performance analysis (Maricq et al., 2018; Uta et al., 2020). and are set to 95% and 1%, respectively. The resample times in \toolName2 and \toolName3 are by default set to 1,000, consistent with previous work (He et al., 2021). We also adjust to 5%, 4%, 3%, 2%, and 1% to investigate the characteristics of our stopping criterion. To answer RQ4, we adjust the number of repetitions of the run interval to 3, 4, 5, 10, and 20, as in RQ2. We use default configurations for other parameters of \toolName.
5.3. RQ3: Effectiveness of \toolName
|
|
|
|
|
||||||||||
| \toolName1 - cold | 97.43% | 92.31% (60/65) | 90.77% (59/65) | 90.77% (59/65) | 95.38% (62/65) | |||||||||
| \toolName1 - warm | 97.14% | 93.85% (61/65) | 90.77% (59/65) | 90.77% (59/65) | 92.31% (60/65) | |||||||||
| Mean | 97.22% | 93.08% | 90.77% | 90.77% | 93.85% | |||||||||
| \toolName2 - cold | 96.01% | 80.00% (52/65) | 81.54% (53/65) | 78.46% (51/65) | 83.08% (54/65) | |||||||||
| \toolName2 - warm | 95.68% | 80.00% (52/65) | 80.00% (52/65) | 76.92% (50/65) | 84.62% (55/65) | |||||||||
| Mean | 95.85% | 80.00% | 80.77% | 77.69% | 83.85% | |||||||||
| \toolName3 - cold | 96.09% | 80.00% (52/65) | 76.92% (50/65) | 78.46% (51/65) | 78.46% (51/65) | |||||||||
| \toolName3 - warm | 95.75% | 83.08% (54/65) | 78.46% (51/65) | 80.00% (52/65) | 84.62% (55/65) | |||||||||
| Mean | 95.92% | 81.54% | 77.69% | 79.23% | 81.54% |
provides testing results with 97.22% mean accuracy in cold-start and warm-start performance testing for serverless functions. This indicates the high effectiveness of \toolName. Specifically, Table 3 shows the results of three variants of \toolName. On average, the mean accuracy obtained by \toolName1, \toolName2, and \toolName3 is 97.22%, 95.85%, and 95.92%, respectively, indicating a high distribution similarity to the ground truth. For the credibility at the percentile performance, \toolName1 provides the credible 25th, 50th, 75th, and 90th percentile performance for 93.08%, 90.77%, 90.77%, and 93.85% of the serverless functions, respectively. \toolName2 provides the credible 25th, 50th, 75th, and 90th percentile performance for 80.00%, 80.77%, 77.69%, and 83.85% of the functions, respectively. \toolName3 provides the credible 25th, 50th, 75th, and 90th percentile performances for 81.54%, 77.69%, 79.23%, and 81.54% of the functions, respectively. These results reveal that the majority of testing results produced with \toolNameare credible.
For three variants of \toolName, we summarize the following points. (1) \toolName1 outperforms the other two, indicating that the CI calculation method of \toolName1 has high accuracy on performance testing for serverless functions. This could be because the other two variants use bootstrapping methods, which adopt the resampling strategy. The resampling process may break the original data distribution and introduce potential noises. In contrast, \toolName1 is based on the original performance data to calculate CI. (2) \toolName2 and \toolName3 show comparable effectiveness. This indicates that our approach design is insensitive to internal data dependency and has a similar effectiveness for the same type of CI calculation method. (3) All variants of \toolNameshow comparable effectiveness in both cold and warm starts, indicating the stability of our approach in performance testing for serverless functions.
Overall, compared to PT4Cloud, \toolNameimproves the mean accuracy of 97.22% - 48.64% = 48.58 percentage points. Moreover, it provides the credible 25th, 50th, 75th, and 90th percentile performance for an additional 93.08% - 17.70% = 75.38%, 90.77% - 10.77% = 80.00%, 90.77% - 14.62% = 76.15%, and 93.85% - 20.00% = 73.85% of the serverless functions, respectively. Compared to Metior, \toolNameimproves the mean accuracy of 97.22% - 57.31% = 39.91 percentage points. \toolNamealso provides the credible 25th, 50th, 75th, and 90th percentile performance for an additional 93.08% - 23.85% = 69.23%, 90.77% - 23.85% = 66.92%, 90.77% - 28.46% = 62.31%, and 93.85% - 24.62% = 69.23% of the serverless functions, respectively.
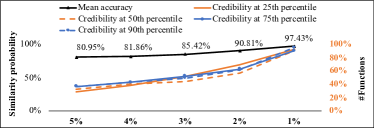
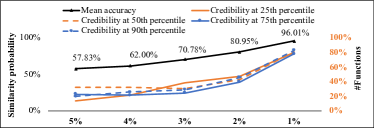
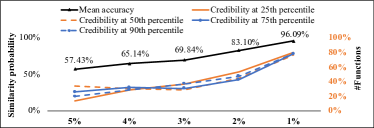
We further compare the effectiveness of \toolNameunder different constraints of our stopping criterion, i.e., the error demand of the accuracy check. We observe that values of all evaluation metrics have improvements as is limited from 5% to 1%. Specifically, Figures 8, 9, and 10 show these changes obtained by three variants in the cold-start performance testing. The mean accuracy improves from 80.95% to 97.43% for \toolName1, from 57.83% to 96.01% for \toolName2, and from 57.43% to 96.09% for \toolName3. For the credibility at the percentile performance, with the use of \toolName1, the proportion of serverless functions that get the credible 25th, 50th, 75th, and 90th percentile performance increases from 29.23% to 92.31%, from 32.31% to 90.77%, from 36.92% to 90.77%, and 36.92% to 95.38%, respectively. With the use of \toolName2, the proportion of the functions that get the credible 25th, 50th, 75th, and 90th percentile performance increases from 13.85% to 80.00%, from 32.31% to 81.54%, from 23.08% to 78.46%, and 20.00% to 83.08%, respectively. With the use of \toolName3, the proportion of the functions that get the credible 25th, 50th, 75th, and 90th percentile performance increases from 13.85% to 80.00%, from 33.85% to 76.92%, from 26.15% to 78.46%, and 20.00% to 78.46%, respectively. Due to the space limit, figures for warm-start results are included in our repository (our, 2023). For warm starts, the mean accuracy improves from 72.37% to 97.14% for \toolName1, from 52.96% to 95.68% for \toolName2, and from 52.56% to 95.75% for \toolName3. The credibility at the percentile performance is similar to that of cold starts.
These results show that the effectiveness of \toolNameis influenced by the constraints of our stopping criterion. The performance testing for serverless functions may require strict error constraints (e.g., an error demand of 1% or less) due to the short-lived duration. In addition, \toolNamewith default configurations outperforms PT4Cloud and Metior that even use the strictest stability demands of = 98% (Figure 3) and = 1% (Figure 4), respectively.
5.4. RQ4: Changes under different numbers of repetitions of the run interval for \toolName
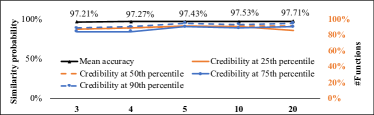
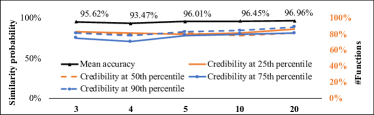
For \toolName, evaluation results do not show significant changes as the number of repetitions of the run interval increases from 3 to 20. Specifically, Figures 11 and 12 show the results obtained by \toolNamefor cold starts. Since testing results obtained by \toolName3 are comparable to the results obtained by \toolName2, we do not show the figure about \toolName3. The mean accuracy obtained by \toolName1, \toolName2, and \toolName3 ranges from 97.21% to 97.71%, from 93.47% to 96.96%, and from 93.01% to 96.91%, respectively. This indicates a negligible change in accuracy. The credibility at the percentile performance is also stable. As the number of repetitions of the run interval increases, \toolName1 produces the credible 25th, 50th, 75th, and 90th percentile performance for serverless functions falling within the following ranges: 86.15% to 92.31%, 87.69% to 92.31%, 84.62% to 90.77%, and 89.23% to 95.38%. \toolName2 produces the credible 25th, 50th, 75th, and 90th percentile performance for serverless functions falling within the following ranges: 80.00% to 86.15%, 78.46% to 83.08%, 70.77% to 81.54%, and 78.46% to 89.23%. \toolName3 produces the credible 25th, 50th, 75th, and 90th percentile performance for serverless functions falling within the following ranges: 80.00% to 86.15%, 76.92% to 83.08%, 69.23% to 80.00%, and 76.92% to 89.23%. Testing results for warm starts are comparable to those for cold starts. Moreover, the results to \toolName3 are highly similar to \toolName2. Overall, these results indicate that the effectiveness of \toolNameis not affected by the number of repetitions of the run interval.
6. Threats to Validity
Internal validity. In our empirical study, we implement and customize PT4Cloud and Metior to allow us to evaluate serverless function performance. Code implementation errors or inconsistencies with the code provided in the paper may occur. To mitigate this threat, all authors review and run the relevant code to ensure the consistency of technical implementation. Moreover, we carefully examine and analyze the intermediate results obtained by the two techniques by inserting breakpoints to ensure code correctness.
External validity. We evaluate the effectiveness of PT4Cloud, Metior, and \toolNameon the performance results of serverless functions. Technical effectiveness may vary depending on the specific serverless functions. This may limit the generalizability of the experimental conclusions that we summarize herein. To mitigate this threat, we collect and test the performance of 65 serverless functions with various task types. Thus, the conclusion of technical effectiveness is based on testing results for most serverless functions. We also ensure a fair comparison by evaluating the techniques using the same serverless function performance results.
7. Related Work
Performance of serverless computing. Performance is the most studied topic in the serverless computing literature (Wen et al., 2023; Li et al., 2022a; Scheuner and Leitner, 2020). Researchers have proposed novel solutions for optimizing the performance of serverless functions (Liu et al., 2023; Oakes et al., 2018; Mahgoub et al., 2021; Lin and Khazaei, 2020; Singhvi et al., 2021; Shahrad et al., 2020). For example, FaaSLight (Liu et al., 2023) loaded only indispensable code for serverless functions to improve the application performance. SOCK (Oakes et al., 2018) cached commonly used libraries in instances to speed up cold-start performance. SONIC (Mahgoub et al., 2021) was a management layer to deploy data-passing methods to improve the communication performance between serverless functions. However, there is no performance testing approach for serverless functions to obtain accurate and reliable performance. To fill the gap, we propose \toolName.
Performance testing of cloud applications. Researchers have proposed several performance testing techniques for traditional cloud applications (Maricq et al., 2018; Wang et al., 2018b; He et al., 2019, 2021). Maricq et al. (Maricq et al., 2018) employed the bootstrapping method for cloud performance testing. He et al. (He et al., 2021) improved this approach by using the block bootstrapping method to consider the internal data dependency. For the stopping criterion of performance testing, Alghmadi et al. (Alghmadi et al., 2016) measured the degree of repetition of data in performance results. However, previous work (He et al., 2019) showed that this stopping criterion was not appropriate for performance testing of cloud applications. PT4Cloud (He et al., 2019) and Metior (He et al., 2021) have considered the stability assessment of performance distributions to terminate the repeated runs, and demonstrated to be the state-of-the-art in performance testing for cloud applications (He et al., 2021). However, our empirical study uncovers that PT4Cloud and Metior shows low effectiveness in serverless functions. Therefore, we propose \toolName, which considers an accuracy check as well as a stability check and outperforms PT4Cloud and Metior.
8. Conclusion
In this paper, we have conducted an empirical study of the state-of-the-art performance testing techniques for traditional cloud computing (i.e., PT4Cloud and Metior) on the new cloud computing paradigm - serverless computing. Specifically, we collected 65 serverless functions from top-tier research venues and used their performance results to evaluate the effectiveness of PT4Cloud and Metior. The results suggest the low effectiveness of these techniques in serverless computing. Therefore, we proposed \toolName, the first performance testing approach specifically tailored for serverless computing, which includes an accuracy check and a stability check. The evaluation results have demonstrated that \toolNameprovides testing results with 97.22% accuracy, 48.58 and 39.91 percentage points higher than PT4Cloud and Metior, respectively.
Acknowledgements.
References
- (1)
- aws (2021) 2021. Comparison of cold starts in serverless functions across AWS, Azure, and GCP. https://mikhail.io/serverless/coldstarts/big3/. Retrieved on December 10, 2022.
- ser (2022a) 2022a. 2018 serverless community survey: huge growth in serverless usage. https://www.serverless.com/blog/2018-serverless-community-survey-huge-growth-usage. Retrieved on December 10, 2022.
- aws (2022) 2022. AWS Lambda. https://docs.aws.amazon.com/lambda/latest/dg/welcome.html. Retrieved on December 10, 2022.
- csr (2022) 2022. CSRankings. https://csrankings.org. Retrieved on October 12, 2022.
- goo (2022) 2022. Google Cloud Functions. https://cloud.google.com/functions. Retrieved on December 10, 2022.
- Wpo (2022) 2022. Normality tests. https://pulmonarychronicles.com/index.php/pulmonarychronicles/article/view/805/1759. Retrieved on February 10, 2023.
- ser (2022b) 2022b. The state of serverless. https://www.datadoghq.com/state-of-serverless/. Retrieved on December 10, 2022.
- AWS (2023a) 2023a. Default memory size of AWS Lambda. https://docs.aws.amazon.com/lambda/latest/operatorguide/computing-power.html. Retrieved on January 15, 2023.
- Goo (2023a) 2023a. Default memory size of Google Cloud Functions. https://cloud.google.com/functions/docs/configuring/memory. Retrieved on January 15, 2023.
- AWS (2023b) 2023b. Default timeout of AWS Lambda. https://docs.aws.amazon.com/lambda/latest/dg/configuration-function-common.html. Retrieved on January 15, 2023.
- Goo (2023b) 2023b. Default timeout of Google Cloud Functions. https://cloud.google.com/functions/docs/configuring/timeout. Retrieved on January 15, 2023.
- our (2023) 2023. Supplemental materials. To be released. Retrieved on March 20, 2023.
- Akkus et al. (2018) Istemi Ekin Akkus, Ruichuan Chen, Ivica Rimac, Manuel Stein, Klaus Satzke, Andre Beck, Paarijaat Aditya, and Volker Hilt. 2018. SAND: Towards high-performance serverless computing. In Proceedings of the 2018 USENIX Annual Technical Conference. 923–935.
- Alghmadi et al. (2016) Hammam M Alghmadi, Mark D Syer, Weiyi Shang, and Ahmed E Hassan. 2016. An automated approach for recommending when to stop performance tests. In Proceedings of the 2016 IEEE international conference on software maintenance and evolution. IEEE, 279–289.
- Ao et al. (2022) Lixiang Ao, George Porter, and Geoffrey M Voelker. 2022. Faasnap: Faas made fast using snapshot-based vms. In Proceedings of the Seventeenth European Conference on Computer Systems. 730–746.
- Bhardwaj et al. (2010) Sushil Bhardwaj, Leena Jain, and Sandeep Jain. 2010. Cloud computing: A study of infrastructure as a service (IAAS). International Journal of engineering and information Technology 2, 1 (2010), 60–63.
- Burger et al. (2019) Andreas Burger, Heiko Koziolek, Julius Rückert, Marie Platenius-Mohr, and Gösta Stomberg. 2019. Bottleneck identification and performance modeling of OPC UA communication models. In Proceedings of the 2019 ACM/SPEC International Conference on Performance Engineering. 231–242.
- Cohen (1960) Jacob Cohen. 1960. A coefficient of agreement for nominal scales. Educational and psychological measurement 20, 1 (1960), 37–46.
- Eismann et al. (2021) Simon Eismann, Joel Scheuner, Erwin Van Eyk, Maximilian Schwinger, Johannes Grohmann, Nikolas Herbst, Cristina Abad, and Alexandru Iosup. 2021. The state of serverless applications: Collection, characterization, and community consensus. IEEE Transactions on Software Engineering 48, 10 (2021), 4152–4166.
- Eskandani and Salvaneschi (2021) Nafise Eskandani and Guido Salvaneschi. 2021. The Wonderless dataset for serverless computing. In Proceedings of the 2021 IEEE/ACM 18th International Conference on Mining Software Repositories. IEEE, 565–569.
- Fouladi et al. (2017) Sadjad Fouladi, Riad S Wahby, Brennan Shacklett, Karthikeyan Vasuki Balasubramaniam, William Zeng, Rahul Bhalerao, Anirudh Sivaraman, George Porter, and Keith Winstein. 2017. Encoding, fast and slow: Low-Latency video processing using thousands of tiny threads. In Proceedings of the 14th USENIX Symposium on Networked Systems Design and Implementation. 363–376.
- Fuerst and Sharma (2022) Alexander Fuerst and Prateek Sharma. 2022. Locality-aware load-balancing for serverless clusters. In Proceedings of the 31st International Symposium on High-Performance Parallel and Distributed Computing. 227–239.
- Hassan et al. (2021) Hassan B Hassan, Saman A Barakat, and Qusay I Sarhan. 2021. Survey on serverless computing. Journal of Cloud Computing 10, 1 (2021), 1–29.
- He et al. (2021) Sen He, Tianyi Liu, Palden Lama, Jaewoo Lee, In Kee Kim, and Wei Wang. 2021. Performance testing for cloud computing with dependent data bootstrapping. In Proceedings of the 36th IEEE/ACM International Conference on Automated Software Engineering. 666–678.
- He et al. (2019) Sen He, Glenna Manns, John Saunders, Wei Wang, Lori Pollock, and Mary Lou Soffa. 2019. A statistics-based performance testing methodology for cloud applications. In Proceedings of the 27th ACM Joint Meeting on European Software Engineering Conference and Symposium on the Foundations of Software Engineering. 188–199.
- Jangda et al. (2019) Abhinav Jangda, Donald Pinckney, Yuriy Brun, and Arjun Guha. 2019. Formal foundations of serverless computing. Proceedings of the ACM on Programming Languages 3, 149 (2019), 1–26.
- Jonas et al. (2019) Eric Jonas, Johann Schleier-Smith, Vikram Sreekanti, Chia-Che Tsai, Anurag Khandelwal, Qifan Pu, Vaishaal Shankar, Joao Carreira, Karl Krauth, Neeraja Yadwadkar, Joseph E. Gonzalez, Raluca Ada Popa, Ion Stoica, and David A. Patterson. 2019. Cloud programming simplified: A Berkeley view on serverless computing. arXiv preprint arXiv:1902.03383 (2019).
- Kim and Lee (2019) Jeongchul Kim and Kyungyong Lee. 2019. Functionbench: A suite of workloads for serverless cloud function service. In Proceedings of the IEEE 12th International Conference on Cloud Computing. IEEE, 502–504.
- Kullback and Leibler (1951) Solomon Kullback and Richard A Leibler. 1951. On information and sufficiency. The annals of mathematical statistics 22, 1 (1951), 79–86.
- Landis and Koch (1977) J Richard Landis and Gary G Koch. 1977. The measurement of observer agreement for categorical data. Biometrics 33, 1 (1977), 159–174.
- Le Boudec (2010) Jean-Yves Le Boudec. 2010. Performance evaluation of computer and communication systems. Vol. 2. Epfl Press Lausanne.
- Li et al. (2022a) Yongkang Li, Yanying Lin, Yang Wang, Kejiang Ye, and Cheng-Zhong Xu. 2022a. Serverless computing: State-of-the-art, challenges and opportunities. IEEE Transactions on Services Computing (2022).
- Li et al. (2022b) Zijun Li, Yushi Liu, Linsong Guo, Quan Chen, Jiagan Cheng, Wenli Zheng, and Minyi Guo. 2022b. FaaSFlow: Enable efficient workflow execution for function-as-a-service. In Proceedings of the 27th ACM International Conference on Architectural Support for Programming Languages and Operating Systems. 782–796.
- Lin and Khazaei (2020) Changyuan Lin and Hamzeh Khazaei. 2020. Modeling and optimization of performance and cost of serverless applications. IEEE Transactions on Parallel and Distributed Systems 32, 3 (2020), 615–632.
- Liu et al. (2023) Xuanzhe Liu, Jinfeng Wen, Zhenpeng Chen, Ding Li, Junkai Chen, Yi Liu, Haoyu Wang, and Xin Jin. 2023. FaaSLight: general application-Level cold-start latency optimization for Function-as-a-Service in serverless computing. ACM Transactions on Software Engineering and Methodology (2023).
- Mahgoub et al. (2021) Ashraf Mahgoub, Li Wang, Karthick Shankar, Yiming Zhang, Huangshi Tian, Subrata Mitra, Yuxing Peng, Hongqi Wang, Ana Klimovic, Haoran Yang, et al. 2021. SONIC: Application-aware data passing for chained serverless applications. In Proceedings of the 2021 USENIX Annual Technical Conference. 285–301.
- Mahgoub et al. (2022) Ashraf Mahgoub, Edgardo Barsallo Yi, Karthick Shankar, Sameh Elnikety, Somali Chaterji, and Saurabh Bagchi. 2022. ORION and the three rights: Sizing, bundling, and prewarming for serverless DAGs. In Proceedings of the 16th USENIX Symposium on Operating Systems Design and Implementation. 303–320.
- Maissen et al. (2020) Pascal Maissen, Pascal Felber, Peter Kropf, and Valerio Schiavoni. 2020. FaaSdom: A benchmark suite for serverless computing. In Proceedings of the 14th ACM International Conference on Distributed and Event-based Systems. 73–84.
- Mampage et al. (2021) Anupama Mampage, Shanika Karunasekera, and Rajkumar Buyya. 2021. A holistic view on resource management in serverless computing environments: taxonomy and future directions. Comput. Surveys (2021).
- Maricq et al. (2018) Aleksander Maricq, Dmitry Duplyakin, Ivo Jimenez, Carlos Maltzahn, Ryan Stutsman, and Robert Ricci. 2018. Taming performance variability. In Proceedings of the 13th USENIX Symposium on Operating Systems Design and Implementation. 409–425.
- Mostafa et al. (2017) Shaikh Mostafa, Xiaoyin Wang, and Tao Xie. 2017. Perfranker: Prioritization of performance regression tests for collection-intensive software. In Proceedings of the 26th ACM SIGSOFT International Symposium on Software Testing and Analysis. 23–34.
- Müller et al. (2020) Ingo Müller, Renato Marroquín, and Gustavo Alonso. 2020. Lambada: Interactive data analytics on cold data using serverless cloud infrastructure. In Proceedings of the 2020 International Conference on Management of Data. 115–130.
- Mvondo et al. (2021) Djob Mvondo, Mathieu Bacou, Kevin Nguetchouang, Lucien Ngale, Stéphane Pouget, Josiane Kouam, Renaud Lachaize, Jinho Hwang, Tim Wood, Daniel Hagimont, et al. 2021. OFC: an opportunistic caching system for FaaS platforms. In Proceedings of the Sixteenth European Conference on Computer Systems. 228–244.
- Oakes et al. (2018) Edward Oakes, Leon Yang, Dennis Zhou, Kevin Houck, Tyler Harter, Andrea Arpaci-Dusseau, and Remzi Arpaci-Dusseau. 2018. SOCK: Rapid task provisioning with serverless-optimized containers. In Proceedings of the 2018 USENIX Annual Technical Conference. USENIX Association, 57–70.
- Parzen (1962) Emanuel Parzen. 1962. On estimation of a probability density function and mode. The annals of mathematical statistics 33, 3 (1962), 1065–1076.
- Patterson et al. (2022) Liam Patterson, David Pigorovsky, Brian Dempsey, Nikita Lazarev, Aditya Shah, Clara Steinhoff, Ariana Bruno, Justin Hu, and Christina Delimitrou. 2022. HiveMind: a hardware-software system stack for serverless edge swarms. In Proceedings of the 49th Annual International Symposium on Computer Architecture. 800–816.
- Perron et al. (2020) Matthew Perron, Raul Castro Fernandez, David DeWitt, and Samuel Madden. 2020. Starling: A scalable query engine on cloud functions. In Proceedings of the ACM SIGMOD International Conference on Management of Data. 131–141.
- Politis and White (2004) Dimitris N Politis and Halbert White. 2004. Automatic block-length selection for the dependent bootstrap. Econometric reviews 23, 1 (2004), 53–70.
- Scheuner and Leitner (2020) Joel Scheuner and Philipp Leitner. 2020. Function-as-a-service performance evaluation: A multivocal literature review. Journal of Systems and Software 170 (2020), 110708.
- Shahrad et al. (2019) Mohammad Shahrad, Jonathan Balkind, and David Wentzlaff. 2019. Architectural implications of function-as-a-service computing. In Proceedings of the 52nd annual IEEE/ACM international symposium on microarchitecture. 1063–1075.
- Shahrad et al. (2020) Mohammad Shahrad, Rodrigo Fonseca, Íñigo Goiri, Gohar Chaudhry, Paul Batum, Jason Cooke, Eduardo Laureano, Colby Tresness, Mark Russinovich, and Ricardo Bianchini. 2020. Serverless in the wild: Characterizing and optimizing the serverless workload at a large cloud provider. In Proceedings of the 2020 USENIX Annual Technical Conference. 205–218.
- Shapiro and Wilk (1965) Samuel Sanford Shapiro and Martin B Wilk. 1965. An analysis of variance test for normality (complete samples). Biometrika 52, 3/4 (1965), 591–611.
- Shlens (2007) Jonathon Shlens. 2007. Notes on kullback-leibler divergence and likelihood theory. Systems Neurobiology Laboratory 92037 (2007), 1–4.
- Singhvi et al. (2021) Arjun Singhvi, Arjun Balasubramanian, Kevin Houck, Mohammed Danish Shaikh, Shivaram Venkataraman, and Aditya Akella. 2021. Atoll: A scalable low-latency serverless platform. In Proceedings of the ACM Symposium on Cloud Computing. 138–152.
- Uta et al. (2020) Alexandru Uta, Alexandru Custura, Dmitry Duplyakin, Ivo Jimenez, Jan Rellermeyer, Carlos Maltzahn, Robert Ricci, and Alexandru Iosup. 2020. Is big data performance reproducible in modern cloud networks?. In Proceedings of the 17th USENIX symposium on networked systems design and implementation. 513–527.
- Wang et al. (2019) Kai-Ting Amy Wang, Rayson Ho, and Peng Wu. 2019. Replayable execution optimized for page sharing for a managed runtime environment. In Proceedings of the Fourteenth EuroSys Conference 2019. 1–16.
- Wang et al. (2018a) Liang Wang, Mengyuan Li, Yinqian Zhang, Thomas Ristenpart, and Michael Swift. 2018a. Peeking behind the curtains of serverless platforms. In Proceedings of the 2018 USENIX Annual Technical Conference. 133–146.
- Wang et al. (2018b) Wei Wang, Ningjing Tian, Sunzhou Huang, Sen He, Abhijeet Srivastava, Mary Lou Soffa, and Lori Pollock. 2018b. Testing cloud applications under cloud-uncertainty performance effects. In Proceedings of the IEEE 11th International Conference on Software Testing, Verification and Validation. IEEE, 81–92.
- Wen et al. (2023) Jinfeng Wen, Zhenpeng Chen, Xin Jin, and Xuanzhe Liu. 2023. Rise of the planet of serverless computing: A systematic review. ACM Transactions on Software Engineering and Methodology (2023).
- Wen et al. (2021a) Jinfeng Wen, Zhenpeng Chen, Yi Liu, Yiling Lou, Yun Ma, Gang Huang, Xin Jin, and Xuanzhe Liu. 2021a. An empirical study on challenges of application development in serverless computing. In Proceedings of the 28th ACM Joint Meeting on European Software Engineering Conference and Symposium on the Foundations of Software Engineering. 416–428.
- Wen et al. (2021b) Jinfeng Wen, Yi Liu, Zhenpeng Chen, Junkai Chen, and Yun Ma. 2021b. Characterizing commodity serverless computing platforms. Journal of Software: Evolution and Process (2021), e2394.
- Wu et al. (2022) Yuncheng Wu, Tien Tuan Anh Dinh, Guoyu Hu, Meihui Zhang, Yeow Meng Chee, and Beng Chin Ooi. 2022. Serverless data science - are we there yet? A case study of model serving. In Proceedings of the 2022 International Conference on Management of Data. 1866–1875.
- Yu et al. (2020) Tianyi Yu, Qingyuan Liu, Dong Du, Yubin Xia, Binyu Zang, Ziqian Lu, Pingchao Yang, Chenggang Qin, and Haibo Chen. 2020. Characterizing serverless platforms with serverlessbench. In Proceedings of the 2020 ACM Symposium on Cloud Computing. 30–44.
- Zhao et al. (2021) Laiping Zhao, Yanan Yang, Yiming Li, Xian Zhou, and Keqiu Li. 2021. Understanding, predicting and scheduling serverless workloads under partial interference. In Proceedings of the International Conference for High Performance Computing, Networking, Storage and Analysis. 1–15.
- Zhao et al. (2019) Yutong Zhao, Lu Xiao, Wang Xiao, Bihuan Chen, and Yang Liu. 2019. Localized or architectural: An empirical study of performance issues dichotomy. In Proceedings of the 2019 IEEE/ACM 41st International Conference on Software Engineering: Companion Proceedings. IEEE, 316–317.