reception date \Acceptedacception date \Publishedpublication date
key word — key word — …— key word
Bright Type II Supernova 2023ixf in M101: A Quick Analysis of the Early-Stage Spectra and Near-Infrared Light Curves
Abstract
We present early-stage analyses of low-resolution () optical spectra and near-infrared light curves of the bright Type II supernova (SN II) 2023ixf in the notable nearby face-on spiral galaxy M101, which were obtained from to d. Our first spectrum showed remarkable emission features of Balmer series, He ii, N iii, C iv, and N iv with a strong blue continuum. Compared with the SNe II showing flash-ionized features, we suggest that this SN could be categorized into the high-luminosity SNe II with a nitrogen/helium-rich circumstellar material (CSM), e.g., SNe 2014G, 2017ahn, and 2020pni. The H emission line can be tentatively explained by a narrower component with a velocity of km s-1 and a broader one with km s-1. The near-infrared light curves were well consistent with those of the another luminous SN 2017ahn, and its absolute magnitudes locate on the bright end in the luminosity distribution of SNe II. These observational facts support that SN 2023ixf is well consistent with high-luminosity SNe II showing evidences of a dense nitrogen/helium-rich CSM.
1 Introduction
The discovery of a supernova (SN) explosion in an extremely nearby galaxy provides a lot of understandings of astrophysics. It makes us to obtain the spectroscopic and multi -band data soon after explosion. Multi-wavelength all-sky survey and follow-up observations may give a strong constraint on the physical properties of an explosive event. The wide-field high-cadence surveys have developed rapidly, and transients including SNe has been discovered at their very young stages, while some highly-active amateur astronomers also exceedingly contribute to the discovery and prompt follow-up of transients.
Recently, prompt spectroscopic observations of some infant Type II SNe were carried out soon after their discovery. The spectra are often dominated by highly-excited emission features with a blue continuum (Gal-Yam et al., 2014; Yaron et al., 2017). The emission features support evidence of the presence of gas surrounding the progenitor (Gal-Yam et al., 2014). Terreran et al. (2022) illustrated that high-excitation lines of hydrogen, carbon and helium were present in the early spectra of the Type II SN 2020pni. They discussed the possibility of a high nitrogen/helium abundance in its circumstellar medium (CSM).
SN 2023ixf was discovered at 14.9 magnitude in the outskirt of the prominent face-on spiral galaxy M101 at 17:27:15.000 (UT) on May 19 in 2023 by Koichi Itagaki (Itagaki, 2023). After that, prompt multi-wavelength and -messenger observations and quick analyses were carried out all over the world (Thwaites et al., 2023; Kawai et al., 2023; Maund et al., 2023; Zhang et al., 2023; Grefenstette, 2023; Perley et al., 2023). Thereafter, this SN brightened steadily but rapidly and reached a maximum brightness of mag around May 24 (Fowler et al., 2023). The detection of progenitor activity in pre-explosion data was also reported (Szalai & Dyk, 2023). SN 2023ixf is the second brightest SN among all-type SNe discovered since SN 1987A in the optical bands, following Type Ia SN 2011fe discovered in M101 which showed a maximum brightness at mag in the -band (Pereira et al., 2013; Zhang et al., 2016). 111Many efforts are being made in ”bright supernova” page to discover bright supernovae and follow up on their brightness in https://rochesterastronomy.org/
In this Letter, we report the early-phase low-resolution spectroscopic observations and the near-infrared imaging observations. In §2, we show our observations and data reduction. In §3, we show the early-stage spectral and near-infrared light curve evolution. We also show the line identification and the comparison with other SNe II. Finally, we present our discussion and conclusion in §4.
2 Observations and Data reduction
The spectroscopic observations were carried out using the spectrograph installed to the 0.4-m reflector on four nights from May 20.5 to May 26.7 UT at the Fujii Kurosaki Observatory (FKO) in Okayama. The wavelength resolution was and the coverage was 4000-7800 Å. The data reduction was performed according to the standard manner. The wavelength calibration was performed using telluric lines, and the flux calibration was done using the spectra of the hot-temperature standard stars observed on the same night as SN 2023ixf. The telluric absorption in the spectra were also corrected. The near-infrared imaging observations were performed using kSIRIUS, the near-infrared simultaneous -band camera 222kSIRIUS was developed in the same concept to SIRIUS (the near-infrared simultaneous three-band camera; (Nagayama et al., 2003) but the current array size is smaller (320x256). The size of the field-of-view is and the pixel scale is pix-1. attached to the Cassegrain focus of the 1.0-m telescope from May 20.7 to May 26.5 on four nights at the Iriki Observatory in Kagoshima. The data reduction was performed according to the standard manner to the NIR imaging data. Magnitudes were obtained through the point-spread-function (PSF) technique using standard IRAF tasks such as DAOPHOT (Stetson, 1987) .
3 Results
3.1 Light curve properties
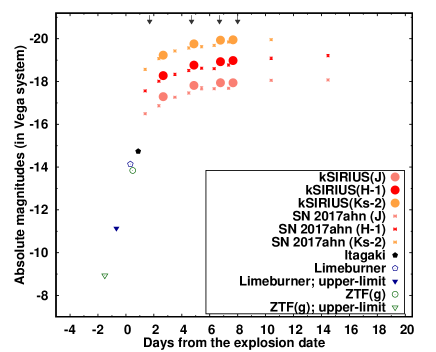
Figure 1 shows our near-infrared multi-band absolute magnitude light curves. The discovery magnitude by Koichi Itagaki (Itagaki, 2023) is also plotted in this figure. The pre-discovery detection and the upper-limit magnitudes reported by Limeburner (2023) and Perley & Irani (2023). A number of pre-discovery and upper-limit magnitudes were collected and the explosion date was estimated to be MJD 60082.83 (Yaron et al., 2023). In this Letter, we define this epoch as .
The distance to the M101 is Mpc which was well calibrated using SN Ia 2011fe (Matheson et al., 2012) and Cepheid stars (Macri et al., 2001; Shappee & Stanek, 2011). The corresponding distance modulus was mag. We measured an equivalent width (EW) of Å for the Na iD doublet in our spectrum at d. The host extinction was then computed using the empirical relation obtained in Poznanski et al. (2012) corresponding to , although the relation has a uncertainty if EW Å. The host galactic extinction was corrected based on this assumption. After the correction, we confirmed that the color were almost similar to those of another Type II SN 2017ahn (Tartaglia et al., 2021).
The -band light curves were compared with those of SN 2017ahn. The light curves of SN 2023ixf impressively follow those of SN 2017ahn. It may make us predict the light curve evolution of SN 2023ixf. The absolute magnitudes were calculated to be , , and mag on at d, respectively. According to this comparison the near-infrared light curves of SN 2023ixf may still rise to a peak magnitude similar to SN 2017ahn ( mag). These locate around the bright end in the luminosity distribution of SNe II (Anderson et al., 2014).
3.2 Line identification and spectral evolution
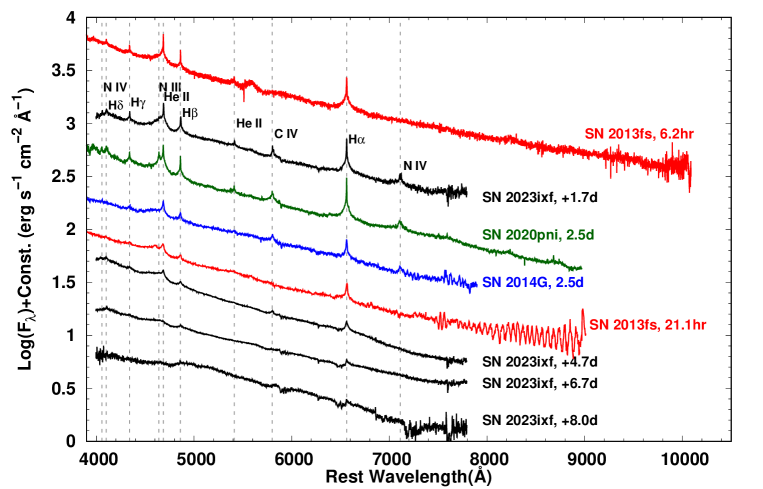
Our first spectrum showed strong emission lines with a blue continuum (see Figure 2). The spectrum was compared with those of other SNe II showing narrow emission lines with a blue continuum. The emission lines of H , H , H and H were identified in our spectra by comparison. The H emission line has multiple components (see Figure 3). The feature can be tentatively resolved by two Gaussian function with full-width at half-maximum (FWHM) of 300 and 2200 km s-1, although adding the third component to the broad one may improve fit accuracy. The width of the narrower component was comparable to the resolution.
The highly-excited nitrogen (N iv 7111) and carbon (C iv 5801) emission lines were also identified by a comparison with SNe 2014G and 2020pni. These emission lines were slightly separated into two components. The N iv 4058 was also marginally detected. These high-excitation level emission lines showed only the narrow component in our data.
The emission feature at 4640-4680 Å was found and contributed by He ii4686, Bowen N iii4634,4642, and C iii4642. The He ii4686 feature consists of the multiple components including the narrow and the broad components. The He ii5412 showed only the narrow component.
At d, the intensity of some emission lines quite weakened. The narrow emission lines of Balmer series greatly attenuated and the broad component cannot almost be recognized. Similarly, the mutliplet of He ii, C iii, and N iii also became weak. The C iv5801 feature was marginally detected by a comparison with the earlier phase one. The N iv 7111 emission line was invisible. The continuum was still unambiguous.
At d, the intensity of the H became very weak and the narrow P Cyg profile developed (see Figure 4). The structure of the absorption component was complicated. The blue end of the absorption reached -5000 km s-1. The H emission line was still seen. The H was not significantly detected. At d, the overall features became weak while the H marginally showed the P Cyg profile.

3.3 Comparison with other SNe II
Figure 2 shows our first spectrum at d, which was compared with SNe 2013fs (Yaron et al., 2017), 2014G (Terreran et al., 2016), and 2020pni (Terreran et al., 2022) 333These spectral data were downloaded in WISERep (http://wiserep.weizmann.ac.il/). Spectra of comparison objects exhibit flash ionized features with a blue continuum. The emission lines are Balmer series, He ii, C iv5801, and N iv7111. Broad components such as H and He ii were also seen as in other objects.
Overall line profile in our spectrum had a excellent match with those of SNe 2014G, and 2020pni. These all exhibited narrow H i and He ii, as well as prominent C iv and N iv emission lines. SN 2017ahn also has high-excitation N iv emission lines (Tartaglia et al., 2021). As we will discuss in §4, these objects form a remarkable subclass of SNe IIP.
Compared with SN 2013fs, no signature of O v emission line were detected in SN 2023ixf during our observations. On the other hand, the emission features of N iv and C iv were invisible in SN 2013fs at t= and hours after its explosion. The H emission line evolution was similar among these objects.

4 Discussion and Conclusion
We presented the observational similarity of SN 2023ixf with SNe 2014G, 2017ahn, and 2020pni based on our original early-stage spectral and near-infrared light curve data. We showed that the near-infrared light curves and their peak absolute magnitudes of SN 2023ixf were well similar to those of SN 2017ahn. Terreran et al. (2022) discussed that the light curves and the spectral evolution of SN 2020pni are well similar to those of SNe 2014G (Terreran et al., 2016), and 2017ahn (Tartaglia et al., 2021). The detection of the highly-excited nitrogen and carbon emission lines are also consistent with those of SNe 2014G and 2020pni. These facts support that SN 2023ixf could be categorized into this subclass.
Terreran et al. (2022) discussed the physical properties of the CSM through the analysis of their flash-ionized features of SN 2020pni using the radiative transfer code, CMFGEN (Hillier & Miller, 1998). They suggested that the surrounding gas has a nitrogen/helium-rich abundance. Assuming that the high luminosity correlates with the large progenitor mass, the high-mass progenitor may be a condition to induce the ejection of the nitrogen/helium-rich gas. However, Pledger & Shara (2023) carried out the quick analysis of the HST data and presented that the progenitor mass would be assuming the single-star evolution . The estimate of the radioactive nickel mass from the cobalt decay line would provide the firm progenitor mass with a small uncertainty.
Terreran et al. (2022) discussed that the large ejection of the envelope may occur within a few years just before explosion from the analysis of the radio and optical spectral data. They discussed that the interaction of the progenitor with a binary companion may trigger the ejection, but pointed out that the large fraction of the flash-ionized event (Khazov et al., 2016; Bruch et al., 2022) disfavors the frequent interaction. For SN 2023ixf, the deep radio observations will be performed in the future. In order to unveil the nature of the CSM and the complex evolution of at the pre-explosion stage, the multi -mode and -wavelength analyses will be encouraged.
We are grateful to graduate and undergraduate students for performing the near-infrared observations. We thank Osamu Ohshima for the helpful advice. This work was supported by Grant-in-Aid for Scientific Research (C) 22K03676. The Kagoshima University 1 m telescope is a member of the Optical and Infrared Synergetic Telescopes for Education and Research (OISTER) program funded by the MEXT of Japan.
References
- Anderson et al. (2014) Anderson, J. P., González-Gaitán, S., Hamuy, M., et al. 2014, ApJ, 786, 67
- Bruch et al. (2022) Bruch, R. J., Gal-Yam, A., Yaron, O., et al. 2022, arXiv e-prints, arXiv:2212.03313
- Fowler et al. (2023) Fowler, M., Sienkiewicz, F., & Dussault, M. 2023, Transient Name Server AstroNote, 143, 1
- Gal-Yam et al. (2014) Gal-Yam, A., Arcavi, I., Ofek, E. O., et al. 2014, Nature, 509, 471
- Grefenstette (2023) Grefenstette, B. 2023, The Astronomer’s Telegram, 16049, 1
- Hillier & Miller (1998) Hillier, D. J., & Miller, D. L. 1998, ApJ, 496, 407
- Itagaki (2023) Itagaki, K. 2023, tNSTR, 1158, 1
- Kawai et al. (2023) Kawai, N., Serino, M., Negoro, H., et al. 2023, The Astronomer’s Telegram, 16044, 1
- Khazov et al. (2016) Khazov, D., Yaron, O., Gal-Yam, A., et al. 2016, ApJ, 818, 3
- Limeburner (2023) Limeburner, S. 2023, Transient Name Server AstroNote, 128, 1
- Macri et al. (2001) Macri, L. M., Calzetti, D., Freedman, W. L., et al. 2001, ApJ, 549, 721
- Matheson et al. (2012) Matheson, T., Joyce, R. R., Allen, L. E., et al. 2012, ApJ, 754, 19
- Maund et al. (2023) Maund, J. R., Wiersema, K., Shrestha, M., Steele, I., & Hume, G. 2023, Transient Name Server AstroNote, 135, 1
- Nagayama et al. (2003) Nagayama, T., Nagashima, C., Nakajima, Y., et al. 2003, Society of Photo-Optical Instrumentation Engineers (SPIE) Conference Series, Vol. 4841, SIRUS: a near infrared simultaneous three-band camera, ed. M. Iye & A. F. M. Moorwood, 459–464
- Pereira et al. (2013) Pereira, R., Thomas, R. C., Aldering, G., et al. 2013, A&A, 554, A27
- Perley et al. (2023) Perley, D. A., Gal-Yam, A., Irani, I., & Zimmerman, E. 2023, Transient Name Server AstroNote, 119, 1
- Perley & Irani (2023) Perley, D. A., & Irani, I. 2023, Transient Name Server AstroNote, 120, 1
- Pledger & Shara (2023) Pledger, J. L., & Shara, M. M. 2023, arXiv e-prints, arXiv:2305.14447
- Poznanski et al. (2012) Poznanski, D., Prochaska, J. X., & Bloom, J. S. 2012, MNRAS, 426, 1465
- Shappee & Stanek (2011) Shappee, B. J., & Stanek, K. Z. 2011, ApJ, 733, 124
- Stetson (1987) Stetson, P. B. 1987, PASP, 99, 191
- Szalai & Dyk (2023) Szalai, T., & Dyk, S. V. 2023, The Astronomer’s Telegram, 16042, 1
- Tartaglia et al. (2021) Tartaglia, L., Sand, D. J., Groh, J. H., et al. 2021, ApJ, 907, 52
- Terreran et al. (2016) Terreran, G., Jerkstrand, A., Benetti, S., et al. 2016, MNRAS, 462, 137
- Terreran et al. (2022) Terreran, G., Jacobson-Galán, W. V., Groh, J. H., et al. 2022, ApJ, 926, 20
- Thwaites et al. (2023) Thwaites, J., Vandenbroucke, J., Santander, M., & IceCube Collaboration. 2023, The Astronomer’s Telegram, 16043, 1
- Yaron et al. (2023) Yaron, O., Bruch, R., Chen, P., et al. 2023, Transient Name Server AstroNote, 133, 1
- Yaron et al. (2017) Yaron, O., Perley, D. A., Gal-Yam, A., et al. 2017, Nature Physics, 13, 510
- Zhang et al. (2016) Zhang, K., Wang, X., Zhang, J., et al. 2016, ApJ, 820, 67
- Zhang et al. (2023) Zhang, Y., Fan, Z., Zheng, J., Zhang, J., & He, M. 2023, Transient Name Server AstroNote, 132, 1