Sizes and mass profiles of candidate massive galaxies discovered by JWST at :
evidence for very early formation of the central pc of present-day ellipticals
Abstract
The first JWST data revealed an unexpected population of red galaxies that appear to have redshifts of and high masses of . Here we fit Sérsic profiles to the F200W NIRCam images of the 13 massive galaxy candidates of Labbé et al., to determine their structural parameters. Satisfactory fits were obtained for nine galaxies. We find that their effective radii are extremely small, ranging from pc to pc, with a mean of pc. For their apparent stellar masses, the galaxies are smaller than any other galaxy population that has been observed at any other redshift. We use the fits to derive circularized three-dimensional stellar mass profiles of the galaxies, and compare these to the mass profiles of massive quiescent galaxies at and nearby elliptical galaxies. Despite the fact that the high redshift galaxies have times smaller half-light radii than their putative descendants, the central stellar densities are very similar. The most straightforward interpretation is that the dense compact inner regions of the most massive ellipticals today were already in place Myr after the Big Bang. We caution that the redshifts and masses of the galaxies remain to be confirmed, and that the complex NIRCam point spread function is not yet fully characterized.
1 Introduction
Our first glimpse into the 11 universe came from detections of young, star-forming galaxies with the combined power of the Hubble and Spitzer Space Telescopes (e.g. Oesch et al., 2016). The physical properties of galaxies at the redshift frontier were well characterized by relatively low stellar masses, with virtually no galaxies with detected at (see, e.g., Stefanon et al., 2021). However, the landscape is rapidly changing, as the James Webb Space Telescope (JWST) enables us to detect galaxies that are fainter, redder, and at higher redshifts (e.g., Castellano et al., 2022; Labbé et al., 2023a; Finkelstein et al., 2022; Atek et al., 2023; Austin et al., 2023; Boyett et al., 2023; Donnan et al., 2023; Looser et al., 2023; Mason et al., 2023; Naidu et al., 2022a, b).
In particular, Labbé et al. (2023a) (L23 hereafter) discovered 13 massive galaxy candidates at with two pronounced breaks in their spectral energy distributions (SEDs) in the Cosmic Evolution Early Release Science (CEERS) survey (Finkelstein et al., 2022, 2023b). As discussed in Boylan-Kolchin (2023) these objects may pose a challenge for galaxy formation theory, and perhaps even for the CDM model, if the masses and redshifts are correct. The halo mass function provides an upper limit on the stellar mass that can form at a given redshift, as the stellar mass cannot exceed the amount of baryons within the halo at a given time: , with the cosmic baryon fraction and being the efficiency of converting baryons into stars. Typical values for the efficiency of baryon conversion (=0.1 and =0.32) imply a too high stellar mass density than allowed by CDM for these redshifts. The only way to be consistent with the data is to require extreme efficiencies converting baryons into stars (0.57-0.99) in the early Universe. Such high star formation efficiencies have never been observed directly, though there is indirect evidence through the modeled star formation histories of the first quiescent galaxies (Antwi-Donso et al. in prep).
Given the implications of a population of early massive galaxies, there have been several studies proposing alternate solutions to solve this tension. The stellar masses may be overestimated, with less extreme estimates when adopting different star formation histories, different initial mass functions (Haslbauer et al., 2022), different synthetic templates (Steinhardt et al., 2023), or taking into account extreme emission lines (Endsley et al., 2023). Other more exotic solutions include different dark energy models (Menci et al., 2022), Early Dark Energy (Boylan-Kolchin, 2023), fuzzy dark matter (Gong et al., 2023), primordial black holes or axion mini clusters (Hütsi et al., 2023), or cosmic strings (Jiao et al., 2023). true nature remains a puzzle that needs to be solved. Finally, contamination by red AGN is also possible and perhaps likely, supported by the detection of a population of compact red sources in JWST imaging data up to (e.g. Furtak et al., 2023; Fujimoto et al., 2023; Ono et al., 2023; Barro et al., 2023; Onoue et al., 2023; Labbé et al., 2023b; Oesch et al., 2023) and through broad line identification with JWST spectroscopy up to (e.g. Kocevski et al., 2023; Harikane et al., 2023; Matthee et al., 2023).
Here we take the stellar masses and redshifts of the L23 sample at face value and ask what the structure is of the sources. Their sizes and morphologies provide clues to their formation and, by extension, to the evolution of the most massive galaxies in the universe. Furthermore, we can test whether most or all of the candidates are dominated by the light of active nuclei, as the objects should then be point sources in the JWST imaging. Throughout this work we assume CDM cosmology with =70 km/s/Mpc, =0.3 and =0.7.
2 Data
This paper is based on one of the first data sets that were obtained with the JWST Near Infrared Camera (NIRCam), the Cosmic Evolution Early Release Science (CEERS) program (PI: Finkelstein; PID: 1345 Finkelstein et al., 2022, 2023b) (see data DOI: Finkelstein et al., 2023a). The initial data consist of four pointings, covering arcmin2 and overlapping with existing HST fields. The JWST data were taken in six broadband filters, F115W, F200W, F150W, F277W, F356W, and F444W, and a medium bandwidth filter F410M. The images are reduced with the standard JWST calibration pipeline (v1.5.2) followed by the grizli pipeline (Brammer, 2023). The final mosaics for each of these bands are available online (Brammer, 2023). The resolution of these mosaics is pix-1 for F115W, F150W and F200W and pix-1 for F277W, F356W and F444W.
The selection of the 13 candidate massive galaxies is described in detail in L23111https://github.com/ivolabbe/red-massive-candidates (catalog https://github.com/ivolabbe/red-massive-candidates). Briefly, they all have a “double-break” in their spectral energy distributions (SEDs), identified as the Lyman break in the rest-frame UV and the Balmer break in the rest-frame optical. The methodology selects galaxies with high mass-to-light ratios while ensuring that the photometric redshifts are well-constrained. The photometric redshifts and stellar masses were found using three codes, EAZY (Brammer et al., 2008), the Prospector-beta settings (Wang et al., 2023) in Prospector (Johnson et al., 2021) and five configurations of Bagpipes (Carnall et al., 2018). L23 adopted a Salpeter (Salpeter, 1955) initial mass function (IMF). From the 7 different measurements for each galaxy, the median value for the photometric redshift and stellar mass is used in this work, following L23. Errors in the stellar masses are from the 16th and 84th median posterior distribution. For more details on the sample selection and SED fitting procedure, we refer to the Methods section in L23.
Follow-up spectroscopy is needed to confirm the stellar masses and the high redshift nature of the sources. For 3 of the 13 galaxies in L23 spectra have been obtained with NIRSpec on JWST. One of the sources, L23-13050, is an AGN at , as shown in Kocevski et al. (2023) (CEERS 3210 therein). It was already suspected to be a potential strong-line emitter at by Pérez-González et al. (2023). L23-35300 and L23-39575 are confirmed to be at high redshift (), as shown in Fujimoto et al. (2023) (CEERS3-1748 and CEERS1-3910).
We obtain point-spread functions (PSFs) for all the galaxies using the WebbPSF tool (Perrin et al., 2014). Synthetic PSFs have the advantage of perfect sampling, centroids, and high S/N ratio. However, several studies have found that WebbPSF profiles are too narrow in the core when comparing them to bright point source profiles (Ding et al., 2022; Ono et al., 2023; Onoue et al., 2023; Weaver et al., 2023).
We therefore also use an empirical PSF, made from stacking isolated, unsaturated stars in the CEERS mosaic. Only stars whose centroid is close to the center of a pixel are considered, and small shifts are applied to center them precisely prior to stacking. In the analysis we give equal weight to the synthetic and empirical PSF. We note that a comparison of the radial profiles of stars and the WebbPSF model showed that they are nearly identical in the F200W (which we use for the galaxy fits).
| ID | (/M⊙) | ||||||||||||
|---|---|---|---|---|---|---|---|---|---|---|---|---|---|
| 7274 | 7.77 | 9.87 | 27.1 | 27.2 | 27.1 | 0.5 | 0.5 | 274 | 268 | 0.5 | 0.5 | 0.5 | 273 |
| 11184 | 7.32 | 10.18 | 27.1 | 27.0 | 27.0 | 1.5 | 1.3 | 236 | 207 | 0.7 | 0.8 | 1.4 | 216 |
| 14924 | 8.83 | 10.02 | 27.5 | 27.5 | 27.4 | 1.1 | 0.5 | 96 | 101 | 0.7 | 0.8 | 0.7 | 108 |
| 16624 | 8.52 | 9.30 | 27.0 | 27.1 | 27.1 | 2.2 | 2.0 | 378 | 331 | 0.7 | 0.7 | 1.6 | 311 |
| 21834 | 8.54 | 9.61 | 28.4 | 28.4 | 28.3 | 0.5 | 0.5 | 146 | 138 | 0.1 | 0.1 | 0.5 | 137 |
| 25666 | 7.93 | 9.52 | 27.7 | 27.8 | 27.7 | 4.1 | 1.7 | 80 | 78 | 0.8 | 0.8 | 1.8 | 86 |
| 28984 | 7.54 | 9.57 | 27.9 | 27.9 | 27.8 | 1.5 | 0.5 | 105 | 121 | 0.5 | 0.6 | 0.8 | 111 |
| 37888 | 6.51 | 9.23 | 28.1 | 28.3 | 28.2 | 1.0 | 0.7 | 110 | 108 | 0.3 | 0.4 | 1.3 | 88 |
| 38094 | 7.48 | 10.89 | 26.3 | 26.6 | 26.5 | 1.1 | 0.5 | 79 | 90 | 0.6 | 0.6 | 0.9 | 82 |
3 Profile Fitting
3.1 Methodology
The candidate massive galaxies reported in L23 are fit with a Sersic (1968) profile,
| (1) |
were is the surface brightness at a distance from the center, is the effective (half-light) radius, and is the corresponding effective surface brightness.
The fits are performed with galfit (Peng et al., 2002, 2010). The free parameters in the fit are the (, ) position of the source, the total integrated magnitude, the effective radius (along the major axis) (), the Sérsic index (), the projected minor-to-major axis ratio (), and the position angle. The major axis radii are circularized using . We allow to vary between 0.5 and 20, between 0.5 and 100 pixels and the total integrated magnitude between -5 and +5 difference from the aperture magnitude reported by L23. Each fit is performed twice, first with the synthetic PSF and then using the empirical PSF (see Sec. 2).
It is not immediately obvious which JWST band to use when measuring morphologies of these early red galaxies. Ideally, we would fit the galaxies in all bands to test whether there are size trends between the different bands.
However, at the shortest wavelengths (F115W and F150W) these red galaxies are often faint, whereas in the long wavelength bands (F277W, F356W, and F444W) the resolution is relatively poor. As a compromise we use the F200W band, sampling the rest-frame near-UV, for our analysis.
It is the reddest band that maintains the spatial sampling of the short wavelength camera. Four galaxies have a S/N ratio 5 even in F200W (L23-2859, L23-13050, L23-35300, and L23-39575). We do not include these galaxies in the analysis.222We verified that their sizes in redder bands are not obviously larger than those of the nine remaining galaxies.
Contaminating sources are masked in the following way. We estimate the background using sigma-clipped statistics with a filter size of 5 pixels and the background RMS. The background is then subtracted from the data and then convolved with a 2D Gaussian kernel with a FWHM of 3 pixels. Using this convolved background-subtracted image, we detect sources with a 1.5 detection threshold, where is the background RMS before convolution. The final result is a mask map, with non-zero valued pixels that are ignored in galfit during the fitting procedure.
L23-16624 has a complicated structure. In the shorter wavelength bands, we clearly observe three components. In the F444W band, these blend together into a bigger source with no substructure. This means that the central component contains most of the stellar mass. Also, the aperture diameter of 0.32” in L23 only fully covers the central component, which is why we choose to only fit the central component and mask out the other two, using a mask threshold of 0.7. Yet, we caution that the photometry and derived stellar mass could be off because of this. We also test fitting with three Sérsic components and this gave similar outcomes for the best fit Sérsic parameters for the central component.
For L23-38094, we also clearly observe two components in F115W and F150W, which also blend together as one source in the longer wavelength bands. Therefore, we fit this galaxy with two Sérsic components and report the results of the central one.
3.2 Sérsic indices, sizes and uncertainties
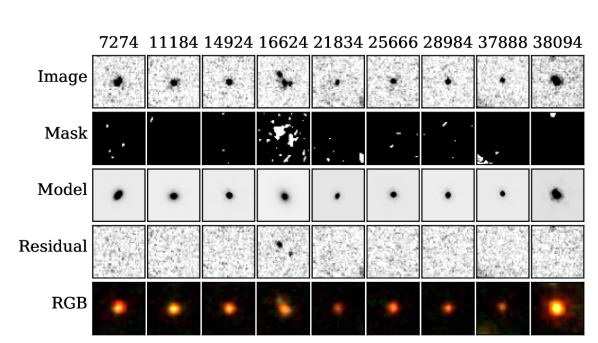
In Fig. 1 we show the individual images for the nine galaxies that are sufficiently bright in F200W. We also show the mask (as described in the previous section), the best-fit model for the WebbPSF run, and the corresponding residual for each source. For these nine galaxies the fits in F200W are generally excellent, with no obvious systematic residuals. The resulting best fit parameters, for both the synthetic and the empirical PSF, are listed in Table 1.
The best-fit circularized effective radii differ by less than % when we fit with the empirical vs theoretical PSF. For some galaxies, the different PSFs affect the measurement of , for example for L23-25666 where =4.1 and =1.7. Interestingly, the sizes are not very different (80 pc and 78 pc).
Estimating uncertainties in the Sérsic profile parameters of faint galaxies is challenging, primarily because systematic effects typically dominate them. In this work, we measure fiducial sizes and Sérsic indices, as well as uncertainties on these parameters, for the nine galaxies fit in F200W in the following way. First, we randomly sample over the galfit errors and each sampled best-fit model is then placed in the residuals of each of the other galaxies (excluding 16624 because the residual has two blobs). Then we fit the galaxies again, as described above, using both the WebbPSF and the empirical PSF. In this way, each galaxy is fit in 7 different residuals and with two different PSFs, leading to different fitted models. With this approach, we include systematic uncertainties in the uncertainty budget. The median values are then adopted as the fiducial and , and the upper and lower uncertainties are given by the (16%,84%) quantiles, which we show in Table 1.
We only allow to vary between 0.5 and 20, so if the modelling finds 0.5 multiple times, the lower uncertainty on will be 0. This happened for L23-21834 and L23-7274. In some cases (especially L23-14924) the errors can be quite large, indicating that some of the galaxies are barely resolved.
In the following, we assume that the observed light is galaxy-dominated and interpret the results accordingly. However, based on the morphology alone we cannot rule out that the light of some galaxies has a significant AGN contribution.
4 Results
4.1 The Size-Mass Relation
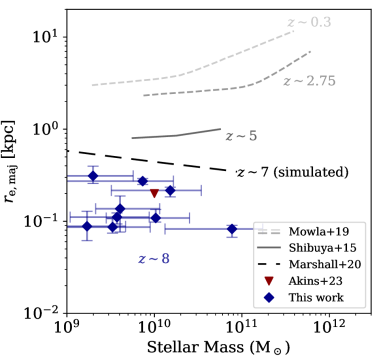
The main result of this study is that the measured sizes in rest-frame UV of the nine galaxies in the structural sample are extremely small, ranging from pc to pc. In Fig. 2 we show the relation between effective radius along the major axis and stellar mass for these nine sources. We also show the (rest-frame optical) size – mass relations since derived by Mowla et al. (2019). The light grey dashed line shows their broken power-law fits for galaxies , which we note as , and for , noted as 2.75. In addition, we add a size-mass relation determined from Shibuya et al. (2015) at (Fig. 5 therein). For the three stellar mass bins (/M⊙) = [9.5-10, 10-10.5, 10.5-11], we take the median effective radius () at . We then plot two linear lines through to these three scatter points, as shown by the dark grey solid line. The size-mass relation of simulated galaxies at in the BLUETIDES cosmological hydrodynamical simulation is shown by the black long dashed line (Marshall et al., 2022) (see Sec. 5).
For their apparent mass and redshift, the galaxies in our structural sample are smaller than any other galaxy population that have been observed at . Taken at face value, our results continue a trend that has been a key result from HST over the past two decades: at fixed stellar mass, galaxies are progressively smaller with increasing redshift (e.g., Bouwens et al., 2004; Daddi et al., 2005; Trujillo et al., 2006, 2007; Buitrago et al., 2008; van Dokkum et al., 2008; van der Wel et al., 2008; Williams et al., 2014). Specifically, the objects in our sample are about smaller than nearby galaxies with the same mass. Furthermore, even if the galaxy stellar masses are overestimated by an order of magnitude, the observed sizes are smaller than typical star-forming galaxies at . Converting the apparent magnitudes into absolute magnitudes and comparing this to the - size relation at for Lyman-break galaxies (e.g. Yang et al., 2022), we find that they are smaller than the average relation at fixed absolute magnitude.
There is some recent corroboration of our results: we show two massive compact galaxies at that were found by Akins et al. (2023) (red triangle in Fig. 2). They find stellar masses of M⊙ and derive an upper limit for the effective radius of pc in F444W for both galaxies. These findings are consistent with the sizes and masses found in this work.
4.2 Stellar Mass Profiles
The small sizes, in combination with the assumed high stellar masses from L23, are remarkable because they imply very high stellar densities. We derive the three-dimensional stellar mass profiles for each galaxy in the structural sample, by performing an Abel transform to the 2D Sérsic profile, following e.g. Bezanson et al. (2009):
| (2) |
with in units of L⊙ kpc-3. To convert each luminosity profile into a stellar mass profile, we make a simplistic assumption that the ratio does not change with radius, such that the shape of the profile remains the same. The profile is then scaled such that its integral equals the total stellar mass, for which we use
| (3) |
that is, we correct the masses in L23 so that the sizes and Sérsic indices from galfit are self-consistent with the total luminosities and masses.
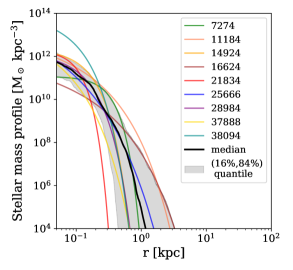
The stellar mass profiles for the nine galaxies are shown in Fig. 3 (left). From the stellar mass profiles we take the median (shown in black) and (16%, 84%) quantile range (shown in grey). As expected, the stellar mass densities are extremely high, reaching M⊙ kpc-3 in the central regions. The density falls of very rapidly with radius, dropping below M⊙ kpc-3 at pc. In the following section we compare the profiles to those of plausible descendants at lower redshifts.
4.3 Comparison to Stellar Mass Profiles of Massive Galaxies at Later Times
An important question is whether the galaxies are too compact, that is,
whether the stellar densities exceed those of all plausible descendants.
We can expect that the most massive galaxies at high redshift evolve into the most massive galaxies at lower redshifts, and that progenitors and descendants can be approximately matched by their cumulative number density
(e.g., van Dokkum et al., 2010; Papovich et al., 2011; Leja et al., 2013; Jaacks et al., 2016; Torrey et al., 2017).
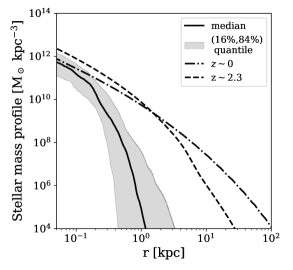
In Fig. 3 (right) we compare333assuming that the measured size in rest-frame UV is equal
to rest-frame optical the median stellar mass profile at to average stellar mass density profiles of
nine massive (M⊙) quiescent galaxies at studied by Kriek et al. (2006), van Dokkum et al. (2008) and Bezanson et al. (2009) (dashed line) and to
elliptical galaxies (M⊙) from Tal et al. (2009) (dash-dotted line).
All three galaxy populations have
a cumulative number density of
a few Mpc-3. As expected, there is a large difference between the stellar mass densities at larger radii (r 1 kpc), where nearby ellipticals and compact galaxies have densities that are at least an order of magnitude higher.
However, the median stellar mass densities in the innermost regions (at 100 pc) are very similar
for all populations, and we infer that the extreme stellar densities
that we find are similar to those of the cores of the most massive systems
throughout cosmic time.
5 Discussion
The central result of our paper is that the candidate massive galaxies at identified in L23 are extremely compact, at least at rest-frame wavelengths of m. We find that they have sizes of pc, making them smaller than galaxies of the same mass by at least an order of magnitude.
Yet, there are a few caveats that need to be considered. Firstly, there may be systematic biases in the galfit sizes. Ono et al. (2023) inject models of various sizes for a range of magnitudes into the noise map and examine the differences between the input and output sizes. They find that the output sizes are underestimated among the faint sources, but that the effect is small for sources with magnitudes 27-28 in F200W. We also assessed the uncertainties by placing models with a wide range of radii and magnitudes in empty areas and recovering their sizes. This method is well-suited for determining systematic differences between true and measured sizes, but unlike our default method (which uses the actual residuals) it does not take differences between real galaxies and Sérsic profiles into account. We find that there is a systematic bias for fainter and larger objects, with measured sizes often underestimating the true sizes, consistent with Ono et al. (2023). However, for the majority of sources in our data (7/9 sources with mag 28 and pixel sizes 4), the effect is small (11% scatter). For the two fainter objects (mag 28 and pixel sizes ), the systematic scatter is larger (24%), but this scatter is still much smaller than the errors measured with the default method (43%). Another important caveat is that the size measurement may depend on wavelength. Initial studies suggest that the effect is small: Yang et al. (2022) find a ratio of () for 7-9 galaxies. However, the effect could be larger for these massive galaxies.
Although it seems difficult to measure sizes this small, we note that it is equivalent to measuring sizes of pc with Hubble at when the differences in angular diameter distance and resolving power are taken into account. Sizes down to pc have been measured routinely with HST (see, e.g., Szomoru et al., 2010). This is also in line with recent results from Yang et al. (2022), who showed that NIRCam imaging data are of sufficient quality to measure effective radii down to 100 pc at z 7.
The stellar densities are correspondingly high, reaching M⊙ kpc-3 in the central regions. While extreme, as shown in Fig. 3, these densities are similar to those of their plausible descendants. The most straightforward interpretation is that the central pc of massive galaxies formed very early, at , and that the subsequent growth was largely inside-out, through star formation in disks or through minor mergers. This extends the arguments made for galaxies in Bezanson et al. (2009); Naab et al. (2009); Hopkins et al. (2010); Trujillo et al. (2011); Barro et al. (2013); van Dokkum et al. (2015) and de la Rosa et al. (2016) all the way to and the central pc. This result is consistent with the abundance matching constraints by Moster et al. (2020) who found that M⊙ galaxies at are progenitors of present day M⊙ galaxies for number densities in the range of Mpc-3.
Turning to the assembly of the galaxies, the small sizes and high densities are qualitatively consistent with extremely efficient dissipative collapse, as required by the stellar masses and number density estimates of the galaxies (Boylan-Kolchin, 2023). As the galaxies are already at the upper end of what can exist at these early times, their star formation rates will likely decrease soon. This is also required by the density profiles in Fig. 3: if the central densities grow further by more than a factor of they would begin to exceed those of their likely low redshift descendants.
If the galaxies quench shortly after it would produce a population of early quiescent galaxies. Such galaxies may have already been observed; specifically, Carnall et al. (2023) find massive quiescent galaxies at and argue that some of these likely had masses of (/M⊙ at .
The early formation of the central pc suggests that supermassive black holes in massive early-type galaxies also formed very early. In fact, the formation of the black hole and the stars may not have been entirely separable events. We calculate the sphere of influence for the median stellar mass profile with , where we use black hole masses of M⊙ and M⊙. This gives pc for M⊙ and 114 pc for M⊙. These values are in the same range as the half-light radii of the galaxies.
It will be interesting to see if the strong size evolution that is implied by our results is reproduced in simulations. The most obvious comparison is with Marshall et al. (2022), who made predictions for sizes of galaxies observed with JWST at using the BLUETIDES cosmological hydrodynamical simulation. In Fig. 2 we show the half mass radius - stellar mass relation that they predict for for a mass-limited sample. Our results fall below their predictions.
We also briefly explore the Hydrangea simulations (see a detailed description in Bahé et al., 2017), which is part of the c-eagle simulations, a set of zoom-in galaxy clusters. Galaxies with similar half mass radii and stellar masses are present in these simulations at , where they are the cores of future massive ellipticals in clusters. This means that we might be observing the highest peaks of the underlying dark matter distribution. Larger area surveys with JWST, combined with spectroscopic redshifts, will show whether we happen to observe a large overdensity at (see for example Hashimoto et al., 2023).
The redshifts and stellar masses of the galaxies remain the main sources of uncertainty. As noted in L23, the galaxies are likely a mix of AGN, objects dominated by extreme and exotic emission lines, and genuine massive galaxies at .
From the morphologies alone, we cannot distinguish between these scenarios (see e.g. Harikane et al., 2023, who show that the measured morphology depends on the contrast between the AGN and the host galaxy). Examining our fits, the most compact sources, L23-25666 and L23-37888 and L23-38094 could be dominated by a point source, and the extreme apparent density of L23-38094 suggests that this object may either be contaminated by an AGN or an extreme emission line object. JWST spectroscopy is needed to make progress on these issues.
References
- Akins et al. (2023) Akins, H. B., Casey, C. M., Allen, N., et al. 2023, arXiv e-prints, arXiv:2304.12347, doi: 10.48550/arXiv.2304.12347
- Atek et al. (2023) Atek, H., Shuntov, M., Furtak, L. J., et al. 2023, MNRAS, 519, 1201, doi: 10.1093/mnras/stac3144
- Austin et al. (2023) Austin, D., Adams, N., Conselice, C. J., et al. 2023, ApJ, 952, L7, doi: 10.3847/2041-8213/ace18d
- Bahé et al. (2017) Bahé, Y. M., Barnes, D. J., Dalla Vecchia, C., et al. 2017, MNRAS, 470, 4186, doi: 10.1093/mnras/stx1403
- Barro et al. (2013) Barro, G., Faber, S. M., Pérez-González, P. G., et al. 2013, ApJ, 765, 104, doi: 10.1088/0004-637X/765/2/104
- Barro et al. (2023) Barro, G., Perez-Gonzalez, P. G., Kocevski, D. D., et al. 2023, arXiv e-prints, arXiv:2305.14418, doi: 10.48550/arXiv.2305.14418
- Bezanson et al. (2009) Bezanson, R., van Dokkum, P. G., Tal, T., et al. 2009, ApJ, 697, 1290, doi: 10.1088/0004-637X/697/2/1290
- Bouwens et al. (2004) Bouwens, R. J., Illingworth, G. D., Blakeslee, J. P., Broadhurst, T. J., & Franx, M. 2004, ApJ, 611, L1, doi: 10.1086/423786
- Boyett et al. (2023) Boyett, K., Trenti, M., Leethochawalit, N., et al. 2023, arXiv e-prints, arXiv:2303.00306, doi: 10.48550/arXiv.2303.00306
- Boylan-Kolchin (2023) Boylan-Kolchin, M. 2023, Nature Astronomy, doi: 10.1038/s41550-023-01937-7
- Brammer (2023) Brammer, G. 2023, grizli, 1.5.2, Zenodo, doi: 10.5281/ZENODO.1146904
- Brammer (2023) Brammer, G. 2023, JWST image mosaics grizli-v4, University of Copenhagen, doi: 10.17894/UCPH.E3D897AF-233A-4F01-A893-7B0FAD1F66C2
- Brammer et al. (2008) Brammer, G. B., van Dokkum, P. G., & Coppi, P. 2008, ApJ, 686, 1503, doi: 10.1086/591786
- Buitrago et al. (2008) Buitrago, F., Trujillo, I., Conselice, C. J., et al. 2008, ApJ, 687, L61, doi: 10.1086/592836
- Carnall et al. (2018) Carnall, A. C., McLure, R. J., Dunlop, J. S., & Davé, R. 2018, MNRAS, 480, 4379, doi: 10.1093/mnras/sty2169
- Carnall et al. (2023) Carnall, A. C., McLeod, D. J., McLure, R. J., et al. 2023, MNRAS, 520, 3974, doi: 10.1093/mnras/stad369
- Castellano et al. (2022) Castellano, M., Fontana, A., Treu, T., et al. 2022, ApJ, 938, L15, doi: 10.3847/2041-8213/ac94d0
- Daddi et al. (2005) Daddi, E., Renzini, A., Pirzkal, N., et al. 2005, ApJ, 626, 680, doi: 10.1086/430104
- de la Rosa et al. (2016) de la Rosa, I. G., La Barbera, F., Ferreras, I., et al. 2016, MNRAS, 457, 1916, doi: 10.1093/mnras/stw130
- Ding et al. (2022) Ding, X., Silverman, J. D., & Onoue, M. 2022, ApJ, 939, L28, doi: 10.3847/2041-8213/ac9c02
- Donnan et al. (2023) Donnan, C. T., McLeod, D. J., Dunlop, J. S., et al. 2023, MNRAS, 518, 6011, doi: 10.1093/mnras/stac3472
- Endsley et al. (2023) Endsley, R., Stark, D. P., Whitler, L., et al. 2023, MNRAS, doi: 10.1093/mnras/stad1919
- Finkelstein et al. (2023a) Finkelstein, S. L., Bagley, M. B., & Yang, G. 2023a, Data from The Cosmic Evolution Early Release Science Survey (CEERS), STScI/MAST, doi: 10.17909/Z7P0-8481
- Finkelstein et al. (2022) Finkelstein, S. L., Bagley, M. B., Haro, P. A., et al. 2022, ApJ, 940, L55, doi: 10.3847/2041-8213/ac966e
- Finkelstein et al. (2023b) Finkelstein, S. L., Bagley, M. B., Ferguson, H. C., et al. 2023b, ApJ, 946, L13, doi: 10.3847/2041-8213/acade4
- Fujimoto et al. (2023) Fujimoto, S., Arrabal Haro, P., Dickinson, M., et al. 2023, ApJ, 949, L25, doi: 10.3847/2041-8213/acd2d9
- Furtak et al. (2023) Furtak, L. J., Zitrin, A., Plat, A., et al. 2023, ApJ, 952, 142, doi: 10.3847/1538-4357/acdc9d
- Gong et al. (2023) Gong, Y., Yue, B., Cao, Y., & Chen, X. 2023, ApJ, 947, 28, doi: 10.3847/1538-4357/acc109
- Harikane et al. (2023) Harikane, Y., Zhang, Y., Nakajima, K., et al. 2023, arXiv e-prints, arXiv:2303.11946, doi: 10.48550/arXiv.2303.11946
- Hashimoto et al. (2023) Hashimoto, T., Álvarez-Márquez, J., Fudamoto, Y., et al. 2023, ApJ, 955, L2, doi: 10.3847/2041-8213/acf57c
- Haslbauer et al. (2022) Haslbauer, M., Kroupa, P., Zonoozi, A. H., & Haghi, H. 2022, ApJ, 939, L31, doi: 10.3847/2041-8213/ac9a50
- Hopkins et al. (2010) Hopkins, P. F., Bundy, K., Hernquist, L., Wuyts, S., & Cox, T. J. 2010, MNRAS, 401, 1099, doi: 10.1111/j.1365-2966.2009.15699.x
- Hütsi et al. (2023) Hütsi, G., Raidal, M., Urrutia, J., Vaskonen, V., & Veermäe, H. 2023, Phys. Rev. D, 107, 043502, doi: 10.1103/PhysRevD.107.043502
- Jaacks et al. (2016) Jaacks, J., Finkelstein, S. L., & Nagamine, K. 2016, ApJ, 817, 174, doi: 10.3847/0004-637X/817/2/174
- Jiao et al. (2023) Jiao, H., Brandenberger, R., & Refregier, A. 2023, arXiv e-prints, arXiv:2304.06429, doi: 10.48550/arXiv.2304.06429
- Johnson et al. (2021) Johnson, B. D., Leja, J., Conroy, C., & Speagle, J. S. 2021, ApJS, 254, 22, doi: 10.3847/1538-4365/abef67
- Kocevski et al. (2023) Kocevski, D. D., Onoue, M., Inayoshi, K., et al. 2023, arXiv e-prints, arXiv:2302.00012, doi: 10.48550/arXiv.2302.00012
- Kriek et al. (2006) Kriek, M., van Dokkum, P. G., Franx, M., et al. 2006, ApJ, 649, L71, doi: 10.1086/508371
- Labbé et al. (2023a) Labbé, I., van Dokkum, P., Nelson, E., et al. 2023a, Nature, 616, 266, doi: 10.1038/s41586-023-05786-2
- Labbé et al. (2023b) Labbé, I., Greene, J. E., Bezanson, R., et al. 2023b, arXiv e-prints, arXiv:2306.07320, doi: 10.48550/arXiv.2306.07320
- Leja et al. (2013) Leja, J., van Dokkum, P., & Franx, M. 2013, ApJ, 766, 33, doi: 10.1088/0004-637X/766/1/33
- Looser et al. (2023) Looser, T. J., D’Eugenio, F., Maiolino, R., et al. 2023, arXiv e-prints, arXiv:2302.14155, doi: 10.48550/arXiv.2302.14155
- Marshall et al. (2022) Marshall, M. A., Wilkins, S., Di Matteo, T., et al. 2022, MNRAS, 511, 5475, doi: 10.1093/mnras/stac380
- Mason et al. (2023) Mason, C. A., Trenti, M., & Treu, T. 2023, MNRAS, 521, 497, doi: 10.1093/mnras/stad035
- Matthee et al. (2023) Matthee, J., Naidu, R. P., Brammer, G., et al. 2023, arXiv e-prints, arXiv:2306.05448, doi: 10.48550/arXiv.2306.05448
- Menci et al. (2022) Menci, N., Castellano, M., Santini, P., et al. 2022, ApJ, 938, L5, doi: 10.3847/2041-8213/ac96e9
- Moster et al. (2020) Moster, B. P., Naab, T., & White, S. D. M. 2020, MNRAS, 499, 4748, doi: 10.1093/mnras/staa3019
- Mowla et al. (2019) Mowla, L., van der Wel, A., van Dokkum, P., & Miller, T. B. 2019, ApJ, 872, L13, doi: 10.3847/2041-8213/ab0379
- Naab et al. (2009) Naab, T., Johansson, P. H., & Ostriker, J. P. 2009, ApJ, 699, L178, doi: 10.1088/0004-637X/699/2/L178
- Naidu et al. (2022a) Naidu, R. P., Oesch, P. A., van Dokkum, P., et al. 2022a, ApJ, 940, L14, doi: 10.3847/2041-8213/ac9b22
- Naidu et al. (2022b) Naidu, R. P., Oesch, P. A., Setton, D. J., et al. 2022b, arXiv e-prints, arXiv:2208.02794, doi: 10.48550/arXiv.2208.02794
- Oesch et al. (2016) Oesch, P. A., Brammer, G., van Dokkum, P. G., et al. 2016, ApJ, 819, 129, doi: 10.3847/0004-637X/819/2/129
- Oesch et al. (2023) Oesch, P. A., Brammer, G., Naidu, R. P., et al. 2023, MNRAS, 525, 2864, doi: 10.1093/mnras/stad2411
- Ono et al. (2023) Ono, Y., Harikane, Y., Ouchi, M., et al. 2023, ApJ, 951, 72, doi: 10.3847/1538-4357/acd44a
- Onoue et al. (2023) Onoue, M., Inayoshi, K., Ding, X., et al. 2023, ApJ, 942, L17, doi: 10.3847/2041-8213/aca9d3
- Papovich et al. (2011) Papovich, C., Finkelstein, S. L., Ferguson, H. C., Lotz, J. M., & Giavalisco, M. 2011, MNRAS, 412, 1123, doi: 10.1111/j.1365-2966.2010.17965.x
- Peng et al. (2002) Peng, C. Y., Ho, L. C., Impey, C. D., & Rix, H.-W. 2002, AJ, 124, 266, doi: 10.1086/340952
- Peng et al. (2010) —. 2010, AJ, 139, 2097, doi: 10.1088/0004-6256/139/6/2097
- Pérez-González et al. (2023) Pérez-González, P. G., Barro, G., Annunziatella, M., et al. 2023, ApJ, 946, L16, doi: 10.3847/2041-8213/acb3a5
- Perrin et al. (2014) Perrin, M. D., Sivaramakrishnan, A., Lajoie, C.-P., et al. 2014, in Space Telescopes and Instrumentation 2014: Optical, Infrared, and Millimeter Wave, Vol. 9143 (SPIE), 91433X, doi: 10.1117/12.2056689
- Salpeter (1955) Salpeter, E. E. 1955, ApJ, 121, 161, doi: 10.1086/145971
- Sersic (1968) Sersic, J. L. 1968, Atlas de Galaxias Australes
- Shibuya et al. (2015) Shibuya, T., Ouchi, M., & Harikane, Y. 2015, ApJS, 219, 15, doi: 10.1088/0067-0049/219/2/15
- Stefanon et al. (2021) Stefanon, M., Bouwens, R. J., Labbé, I., et al. 2021, ApJ, 922, 29, doi: 10.3847/1538-4357/ac1bb6
- Steinhardt et al. (2023) Steinhardt, C. L., Kokorev, V., Rusakov, V., Garcia, E., & Sneppen, A. 2023, ApJ, 951, L40, doi: 10.3847/2041-8213/acdef6
- Szomoru et al. (2010) Szomoru, D., Franx, M., van Dokkum, P. G., et al. 2010, ApJ, 714, L244, doi: 10.1088/2041-8205/714/2/L244
- Tal et al. (2009) Tal, T., van Dokkum, P. G., Nelan, J., & Bezanson, R. 2009, AJ, 138, 1417, doi: 10.1088/0004-6256/138/5/1417
- Torrey et al. (2017) Torrey, P., Wellons, S., Ma, C.-P., Hopkins, P. F., & Vogelsberger, M. 2017, MNRAS, 467, 4872, doi: 10.1093/mnras/stx370
- Trujillo et al. (2007) Trujillo, I., Conselice, C. J., Bundy, K., et al. 2007, MNRAS, 382, 109, doi: 10.1111/j.1365-2966.2007.12388.x
- Trujillo et al. (2011) Trujillo, I., Ferreras, I., & de La Rosa, I. G. 2011, MNRAS, 415, 3903, doi: 10.1111/j.1365-2966.2011.19017.x
- Trujillo et al. (2006) Trujillo, I., Feulner, G., Goranova, Y., et al. 2006, MNRAS, 373, L36, doi: 10.1111/j.1745-3933.2006.00238.x
- van der Wel et al. (2008) van der Wel, A., Holden, B. P., Zirm, A. W., et al. 2008, ApJ, 688, 48, doi: 10.1086/592267
- van Dokkum et al. (2008) van Dokkum, P. G., Franx, M., Kriek, M., et al. 2008, ApJ, 677, L5, doi: 10.1086/587874
- van Dokkum et al. (2010) van Dokkum, P. G., Whitaker, K. E., Brammer, G., et al. 2010, ApJ, 709, 1018, doi: 10.1088/0004-637X/709/2/1018
- van Dokkum et al. (2015) van Dokkum, P. G., Nelson, E. J., Franx, M., et al. 2015, ApJ, 813, 23, doi: 10.1088/0004-637X/813/1/23
- Wang et al. (2023) Wang, B., Leja, J., Bezanson, R., et al. 2023, ApJ, 944, L58, doi: 10.3847/2041-8213/acba99
- Weaver et al. (2023) Weaver, J. R., Cutler, S. E., Pan, R., et al. 2023, arXiv e-prints, arXiv:2301.02671, doi: 10.48550/arXiv.2301.02671
- Williams et al. (2014) Williams, C. C., Giavalisco, M., Cassata, P., et al. 2014, ApJ, 780, 1, doi: 10.1088/0004-637X/780/1/1
- Yang et al. (2022) Yang, L., Morishita, T., Leethochawalit, N., et al. 2022, ApJ, 938, L17, doi: 10.3847/2041-8213/ac8803