The First LHAASO Catalog of Gamma-Ray Sources
Abstract
We present the first catalog of very-high energy and ultra-high energy gamma-ray sources detected by the Large High Altitude Air Shower Observatory (LHAASO). The catalog was compiled using 508 days of data collected by the Water Cherenkov Detector Array (WCDA) from March 2021 to September 2022 and 933 days of data recorded by the Kilometer Squared Array (KM2A) from January 2020 to September 2022. This catalog represents the main result from the most sensitive large coverage gamma-ray survey of the sky above 1 TeV, covering declination from 20∘ to 80∘. In total, the catalog contains 90 sources with an extended size smaller than and a significance of detection at . Based on our source association criteria, 32 new TeV sources are proposed in this study. Among the 90 sources, 43 sources are detected with ultra-high energy ( TeV) emission at significance level. We provide the position, extension, and spectral characteristics of all the sources in this catalog.
1 Introduction
Gamma rays, located at the highest energy band of the cosmic electromagnetic radiation, serve as a powerful probe for astrophysics and fundamental physics under extreme conditions. Most gamma rays are produced through the acceleration and propagation of relativistic particles, such as protons or electrons, in astrophysical sources. Relativistic electrons can scatter low-energy photons, including star light, dust scattered light and the Cosmic Microwave Background (CMB), to the gamma-ray band via the inverse Compton process.The whole universe is filled with low energy photons, especially the CMB. Therefore, gamma rays are a unique tool to probe the relativistic electrons when the surrounding magnetic field is weak and the synchrotron radiation is undetectable. Relativistic protons interact with the surrounding medium to create hadronic cascades, which include secondary mesons that quickly decay into gamma-rays. Hence, gamma rays are also an important tool to study the origin, acceleration and propagation of cosmic rays (CRs).
Thanks to the advancements in space-based and ground-based gamma-ray detectors, our knowledge about the high energy gamma-ray universe has made impressive progress over the past two decades. At high energy (HE, GeV), the Fermi Large Area Telescope (Fermi-LAT, Atwood et al., 2009) has been surveying the whole sky since 2008 and detected 6658 Galactic and extragalactic gamma-ray sources using the first twelve years of observations (Abdollahi et al., 2022). Compared to its predecessor, EGRET (Hartman et al., 1999), the number of detected sources has increased by a factor of more than 20, and some new categories of gamma-ray emitters have been revealed. Important evidence about the acceleration of GeV–TeV CRs were found in two ancient supernova remnants (Ackermann et al., 2013). The Dark Matter Particle Explorer (DAMPE) collaboration also reported the detection of more than 200 gamma-ray sources above GeV (Duan et al., 2021).
At Very High Energy (VHE, TeV), ground-based gamma-ray detectors are necessary due to their large area requirements. The successful operation of the second generation Imaging Atmospheric Cherenkov Telescopes (IACTs), such as H.E.S.S. (Aharonian et al., 2006), MAGIC (Aleksić et al., 2016), and VERITAS (Meagher & VERITAS Collaboration, 2015), has significantly increased the number of detected VHE gamma-ray sources from about 10 to over 200 since 2004. Several categories of VHE gamma-ray emitters have been firmly established, including Active Galactic Nuclei (AGNs), pulsars and Pulsar Wind Nebulae (PWNe), Supernova Remnants (SNRs), binaries, starburst galaxies, Gamma-Gay Bursts (GRBs) and others. However, due to their narrow Field Of View (FOV, 3∘ 5∘) and low duty cycle (10% 15%), IACTs are not suitable for performing long-term comprehensive sky surveys. Most VHE sources are detected while searching for counterparts of sources observed at lower energies, and only certain parts of galactic plane have been surveyed by the IACTs, such as H.E.S.S. (H. E. S. S. Collaboration, 2018) and VERITAS (Staszak & VERITAS Collaboration, 2015).
To achieve an overall view of the VHE universe, a roughly unbiased sky survey is needed, similar to that carried out by Fermi-LAT in the GeV band. Ground-based Extensive Air Shower (EAS) arrays, with their large field of view and high duty cycle, are ideal detectors for this scientific goal. Several VHE gamma-ray surveys with positive results have been conducted to date, including those by Tibet AS (Amenomori et al., 2005), Milagro (Abdo et al., 2007), and ARGO-YBJ (Bartoli et al., 2013). However, due to the limitations of detector sensitivity, only a handful of sources have been observed. Nonetheless, impressive progress has been made in observing some typical extended sources (Bartoli et al., 2014) and variable AGNs (Bartoli et al., 2016, 2012), highlighting the invaluable role of EAS arrays in VHE gamma-ray observation. Recently, the sensitivity of EAS arrays has greatly improved thanks to the successful operation of the new generation arrays, such as HAWC and LHAASO. The HAWC Observatory has detected 65 VHE sources including 20 new ones using five years of data in their third catalog (3HWC; Albert et al., 2020). In particular, HAWC has revealed a new source category,the TeV pulsar halo (Abeysekara et al., 2017), which is a useful tool to probe the CR diffusion in the interstellar medium (ISM) near PWNe.
Another crucial characteristic of the EAS array is that it can extend the observation to the Ultra-High Energy (UHE, PeV) range due to its large detector area and long duty cycle. The Tibet AS collaboration first reported a UHE gamma-ray source, the Crab Nebula (Amenomori et al., 2019), followed by another three sources reported by the HAWC collaboration (Abeysekara et al., 2020). Recently, the LHAASO collaboration has made exciting progress by reporting the detection of 12 UHE gamma-ray sources with a statistical significance of over 7 and the maximum energy up to 1.4 PeV (Cao et al., 2021a). Additionally, some sources were observed with VHE emission for the first time (Cao et al., 2021b, c). These observations provide crucial candidates to explore the origin of PeV CRs within the Galaxy. LHAASO also detected PeV gamma-ray emission from the Crab Nebula, revealing an extreme electron accelerator with unprecedented high accelerating efficiency (LHAASO Collaboration, 2021). These observation involving the highest gamma-ray energy also shed light on exploring the Lorentz Invariance Violation (Cao et al., 2022a) and dark matter (Cao et al., 2022b). It is worth noting that these results were achieved using only 1 year of data and half of the LHAASO array prior to completion of its construction.
This paper is structured as follows. Section 2 briefly describes the LHAASO detector and the data set. Additionally, it presents the background estimation and significance sky maps. In Section 3, the methods of searching for sources and constructing the catalog are introduced. The characteristics of WCDA and KM2A source components are briefly described and compared. In Section 4, a final source catalog is compiled, including relevant positional, spatial, and spectral information. The results of some typical source populations are discussed in Section 5. Section 6 provides a summary.
2 Instrument and Data Analysis
2.1 The LHAASO Detector and Data
LHAASO is a multi-purpose and comprehensive EAS array, designed for the study of CRs and gamma rays across a wide energy range, from sub-TeV to beyond 1 PeV (Ma et al., 2022). It consists of three interconnected detector arrays, a 1.3 km2 array (KM2A) for gamma-ray detection above 10 TeV, a 78,000 m2 Water Cherenkov Detector Array (WCDA) for TeV gamma-ray detection, and a Wide Field-of-view Cherenkov Telescopes Array (WFCTA) mainly for CR physics. When a high-energy extraterrestrial particle, gamma ray or CR, enters Earth’s atmosphere, it initiates a cascade consisting of secondary hadrons, muons, leptons, and photons known as an air shower. The WCDA and KM2A detectors record different components of these air showers, which are used to reconstruct the types, energies, and arrival directions of the primary particles. The WCDA consists of three ponds: WCDA-1 and WCDA-2, both measuring 150 m 150 m , and WCDA-3 measuring 300 m 110 m. The total area of the array is 78,000 m2. WCDA-1, WCDA-2, WCDA-3 are composed of 900, 900, 1320 detector units, respectively. Each detector unit is 5 m 5 m separated by non-reflecting black plastic curtains and is equipped with two upward-facing PMTs (8-inch and 1.5 inch PMT combination) on the bottom at the center of the unit. To further lower the threshold energy, WCDA-2 and WCDA-3 employ a 20-inch and 3-inch PMT combination. Each pond is filled with purified water up to 4 m above the PMT photo-cathodes. A closed recycling system is implemented to maintain water purity and achieve an attenuation length for near-ultraviolet light longer than 15 meters.
The results presented here for WCDA were obtained using the full-array configuration from 2021 March 5 to 2022 September 30. For each PMT, a hit is formed with the threshold of 1/3 photoelectron (PE) for an 8-inch PMT, and 1 PE for a 20-inch MCP-PMT. A trigger algorithm was implemented to record CR air showers by requiring at least 30 PMTs fired among 12 12 PMT arrays simultaneously within a window of 250 ns. To ensure a reliable data sample, data quality checks were performed based on the DAQ data status and reconstruction quality. The total effective live time used in the data analysis is around 508 days with a trigger rate around 35 kHz. The number of gamma-like events recorded by WCDA is around 1.29 events after certain data selection and gamma-ray/background discrimination cuts. More details about the array and the reconstruction can be found in Aharonian et al. (2021a).
KM2A is composed of 5195 electromagnetic particle detectors (EDs) and 1188 muon detectors (MDs) distributed over an area of 1.3 km2. Each ED consists of 1-m2 plastic scintillator covered by a 0.5-cm thick lead plate and a 1.5-inch photomultiplier tube (PMT). The typical detection efficiency is about 98% and time resolution is about 2 ns. The response time and signal amplitude of each ED is calibrated using offline methods (Lv et al., 2018; Aharonian et al., 2022). A trigger is generated when 20 EDs are fired within a 400 ns window. The signals recorded by EDs are used to determine the energy and arrival direction of the primary particles. Each MD consists of a cylindrical water tank, with a diameter of 6.8 m and a height of 1.2 m, and a 8-inch PMT, which is filled with pure water and buried under 2.5 m of soil. The MDs are designed to detect the muon component of showers, which is used to discriminate between gamma-ray and hadron-induced showers. The performance of KM2A for the gamma-rays with energies from 10 TeV to 1.6 PeV has been thoroughly tested using detector simulations and observations of the Crab Nebula (Aharonian et al., 2021b). The resolution is energy- and zenith-dependent. For showers with a zenith angle less than 20°, the angular resolution ranges from 0.5∘ at 20 TeV to 0.2∘ at 100 TeV. The energy resolution is about 24% at 20 TeV and 13% at 100 TeV. The rejection power of the hadron-induced showers is about 1000 at 20 TeV and greater than 4000 at energies above 100 TeV.
The KM2A detectors were constructed and merged into the data acquisition system (DAQ) in stages. The first half of the KM2A consisting of 2365 EDs and 578 MDs started operating in December 2019. This partial array was expanded to a 3/4 array, comprising 3978 EDs and 917 MDs, in December 2020. The whole KM2A was completed and operated starting 2021 July 19. The KM2A data collected from 2019 December 27 to 2022 July 31 were used for the analysis in this work. The total live time is days, corresponding to 730 days of complete KM2A detector. The pipeline of KM2A data analysis presented in Aharonian et al. (2021b) is directly adopted in this analysis with the same event selection conditions. After the pipeline cuts, the number of events used in this analysis is with reconstructed energies above 25 TeV.
2.2 Data Binning and Background Estimation
We use only events with zenith angles less than 50∘ in this analysis, corresponding to the survey region in the declination band from to 80∘. For the WCDA data, events are divided into five groups according to the number of hits (), i.e., 100-200, 200-300, 300-500, 500-800, 800. For Crab-like sources, the corresponding energies roughly range from 1 TeV to 25 TeV. It should be noted that events in the same bin for a source with a harder spectrum, or at a larger declination, will tend to have a larger average energy. The PSF width of WCDA data depends on the shower size which is closely related to . Therefore, it is insensitive to depend on declination or spectrum. The Crab observation provides a clear measurement of the angular resolution (denoted as ), which is ,,, and in the five bins, respectively. For the KM2A data, events are divided into five groups per decade according to reconstructed energy (), i.e, 25-40 TeV, 40-63 TeV, 63-100 TeV, 100-160 TeV, 160-250 TeV, 250-400 TeV, 400-630 TeV, 630-1000 TeV, 1000-1600 TeV, 1600 TeV. The median energy and the angular resolution in each bin slightly vary with the declination and spectrum of the source. The properties of each bin are shown in Table 1.
| Detector | (TeV) | (TeV) | |
|---|---|---|---|
| WCDA | 100-200 | 0.68 | 1.7 |
| 200-300 | 0.46 | 3.0 | |
| 300-500 | 0.37 | 4.9 | |
| 500-800 | 0.29 | 8.9 | |
| 800 | 0.25 | 17.4 | |
| KM2A | 25-40 | 0.43 | 29.5 |
| 40-63 | 0.36 | 46.8 | |
| 63-100 | 0.30 | 74.1 | |
| 100-160 | 0.26 | 117.5 | |
| 160-250 | 0.23 | 190.5 | |
| 250-400 | 0.20 | 302.0 | |
| 400-630 | 0.18 | 478.6 | |
| 630-1000 | 0.17 | 758.6 | |
| 1000-1600 | 0.16 | 1202.3 | |
| 1600 | 0.16 | 1949.8 |
Note. — is the 68% containment radius of angular resolution. is median energy in each bin. We consider a reference source with a broken power-law spectrum of an index of 2.5 in 1-25 TeV and an index of 3.5 above 25 TeV, at a declination of .
The sky maps in celestial coordinates (right ascension and declination) are divided into pixels, and each pixel is filled with the number of the detected events according to their arrival direction. To obtain the excess of gamma-ray induced showers in each pixel, the “direct integration method” (Fleysher et al., 2004) is adopted to estimate the number of background events. This method uses events with the same direction in local coordinates but different arrival times to estimate the background. In this work, the integrated time is 10 hours and the events within the regions of the Galactic plane () and VHE gamma-ray sources (with space angle less than 5∘) are excluded to estimate the background which is dominated by the residual CRs. The isotropic diffuse gamma rays and electrons may contribute slightly to the background.
The diffuse Galactic gamma-ray emission (GDE) resulting from the interaction of CRs with the interstellar medium (ISM) and background photons is an essential component of the gamma-ray sky. In Galactic plane, the VHE and UHE GDE has already been clearly detected (Abramowski et al., 2014; Amenomori et al., 2021; Cao et al., 2023). Therefore, the GDE is also an essential background to take into account for detecting and characterizing gamma-ray sources. In VHE and UHE band, the GDE have been interpreted to be mainly pion decay photons generated from hadronic interactions of CR with ISM. Approximately 99% of the ISM mass is gas. Modeling the VHE and UHE GDE requires knowledge of CR intensities and spectra, along with the distributions of gas, throughout the Galaxy. However, due to the variation of gas density and CR density across the Galaxy, it is not possible to completely disentangle the GDE. To simplify the analysis, we ignore the variation of CR density. The flux morphology of GDE is assumed to follow the spatial distribution of gas, which coexist with dust grains. Observations have shown that the gas-to-dust ratio leads to a mass ratio of . The dust column density can therefore provide a template for the GDE morphology. In this work, we use the GDE template derived by Planck maps of dust optical depth (Planck Collaboration et al., 2014, 2016). The spectral function is assumed to be identical in all regions. To avoid the influence of the gamma-ray sources, the spectrum of GDE is estimated using the region of Galactic latitude and then extrapolating it to other Galactic plane regions (). Note that the region of several VHE sources in the region of is also masked for the measurement of GDE, effectively excluding the contribution of both Galactic and extragalactic sources. The GDE spectrum for this region is found to be well reproduced by the diffuse Galactic gamma-ray emission model, which takes into account the local CR spectrum and the gas column density. We add the extrapolated GDE maps from the measurements in the region of to the background maps for subsequent analysis.
2.3 Significance Map
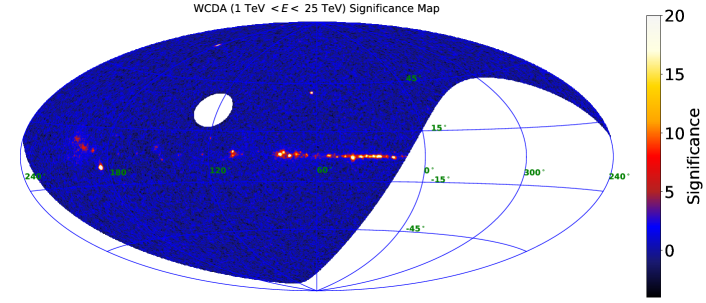
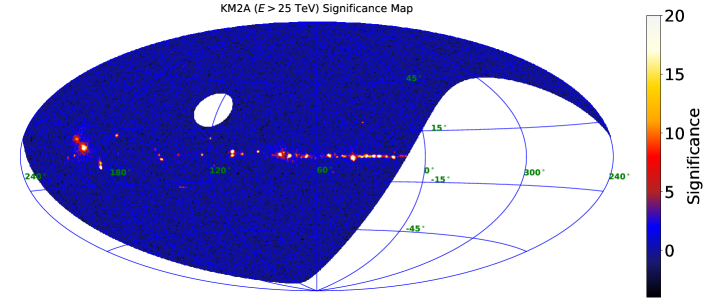
We can calculate the significance of excess centered at each pixel using the event and background maps as described in previous section, taking the detector responses into consideration. The WCDA and KM2A data are separately analyzed. To combine the data bins of each instrument, the 3D-likelihood method is used. A likelihood ratio test is performed between the background-only model and the one point source model. The likelihood calculation assumes that the number of counts in each pixel is distributed according to a Poisson distribution, with the mean given by the number of background counts for the background-only model and the number of background plus expected gamma-ray counts for the source model (Stewart, 2009). The test statistic (TS), defined as , where is the maximum likelihood value for the null hypothesis and is the maximum value for the source hypothesis, is used to estimate the significance. In this work, a power-law spectrum is assumed with an index of 2.6 for WCDA data in the energy range 125 TeV and 3.0 for KM2A data at energies 25 TeV as initial conditions. This leaves only one free parameter for the likelihood calculation. According to Wilks’ Theorem, the TS is distributed as with one degree of freedom (dof), and the significance can be estimated with S = . Figure 1 shows the significance maps obtained in the energy bands and in Galactic coordinates. The signals are clearly visible. However, most sources in the Galactic plane are nearby and overlapping. Hence, further analysis is needed to derive each source separately.
3 Construction of the Catalog
The identification of point-like gamma-ray sources and their corresponding significance can be roughly derived from Figure 1. However, it is important to note that the significance may be overestimated due to the overlap with nearby sources. Conversely, in the search for point sources, a significant portion of the sources may actually be extended, resulting in an underestimation of their significance. To improve source detection, the significance of a given source is reassessed by coupling the fitting of localization, extension and spectrum, and new potential sources are also explored. In the first step, the WCDA and KM2A data are analyzed separately to achieve two source component catalogs, one for energies ranging from 125 TeV and another for energies above 25 TeV. These two source component catalogs are merged into the final source catalog following a specific procedure. The sources with clear TeV emission will also be identified in the final catalog.
3.1 All Sky Fitting and Source Component Detection
The WCDA data and KM2A data are analyzed following the same strategy to fit the entire sky region and yield the source components with the characteristics of localization, extension and spectrum.
3.1.1 Determination of Seeds and ROIs
The signals shown in Figure 1 are potential point sources, denoted as “seeds”. To identify these seeds in the maps, all local maxima within a 0.5∘ region centered around the candidate, with a significant above 4, are selected. Most of the seeds are concentrated in the inner Galactic plane, while in the outer Galactic plane, the seeds are clustering in the region near Geminga. In other areas of sky region, a few individual seeds stand out.
To facilitate the fitting process, all sky data are split into different regions of interest (ROI) based on the seeds and their clustering characteristics. For the inner Galactic plane region, a sliding window 20 ROI is adopted along Galactic longitude with a step length of 10∘. For the Geminga region, a ROI with the radius of 12∘ centered at right ascension () and declination () is used. For isolated seeds, the ROIs are circular regions with a 3∘ radius, and the overlapping ROIs are merged into one.
3.1.2 Source Component Detection Procedure
The seeds obtained in Section 3.1.1 may not correspond to a real source component because the spectrum and extension characteristics are not fully considered. Moreover, the position can be influenced by nearby sources with small angular separations. Thus, an analysis pipeline based on a three-dimensional maximum likelihood algorithm is developed for further analysis. Using this analysis pipeline, the spectral information and spatial morphology and significance for individual source components can be determined simultaneously. Some technical details are described below:
-
•
The first step of the 3D maximum likelihood algorithm is to build a source model characterized by a 2D-Gaussian morphology based on the initial positions of the seeds. The source spectrum is assumed to follow a power-law shape , where is the differential flux at , is the reference energy which is set to 3 TeV for WCDA data and to 50 TeV for KM2A data, respectively, and is the spectral index.
-
•
Starting with one Gaussian component, we add Gaussian components successively to the source model of each ROI. A likelihood ratio test is used to compare between two models with and Gaussian components. We define TS = , where and represents the maximum likelihood of the model with and source components, respectively. During this iterative process, an additional source characterized by 5 free parameters (, , extension, differential flux and spectral index) is added to the model if TS (3.8 for 5 dof).
-
•
The iteration process is terminated once no significant residual is left in the TS map for each ROI. Here, no significant residual means that no pixel is with TS (4 for 1 dof) in the residual TS map, which is calculated by adding the current sources to the background model and using the method similar to that in Sec. 2.3.
-
•
During the fitting process, all of the parameters are optimized simultaneously. The Spectral parameter of the GDE is always keep to fixed.
-
•
After completing the previous steps, the WCDA and KM2A source component lists are formed, respectively, by merging all the list determined in each ROI. Due to the overlap ROIs, the same source component may appear in two or more ROIs. In such cases, the one that was closest to the center of the ROI is selected.
This analysis pipeline yields a preliminary source component list, in which most components have good estimates of parameters. However two possible biases may exist for two cases: 1) the target Gaussian component is close to the ROI edge or a bright source; 2) the iteration fitting scheme described above could converge toward a local maximum. Additional checks have been implemented for these two cases using a new ROI centered on the position of each component and re-analyzing the target source component with free parameters for all components in the ROI. If new parameters of the target source component do not significantly differ from the previous iteration fitting, the new parameters of this source component are considered reliable and are adopted. The significant difference refers to the situation where the variance of a single parameter is greater than the corresponding statistical error. If significant variations are observed, a manual fitting process is conducted. This involves adjusting the starting values of the parameters and/or the size of the ROI until the parameters of the target source component converge. This convergence is determined through a visual inspection of likelihood profiles. Once the parameters are obtained, the TS value of each source component is evaluated within each ROI. In this evaluation, the positions and extensions of the other components are fixed, while the spectral parameters are left free for optimization.
3.1.3 False Positive Expectation
The trial factor can be roughly estimated as , where is the solid angle of the LHAASO survey sky within the declination ranging from to , and is the minimum location searching radius for seeds. Since the TS value for the above components follows the distribution with 5 degrees of freedom, TS = 25 corresponds to the -value of . Based on this, we can expect that 2.4 sources in our survey are false detections due to background fluctuations.Thus, we set a higher threshold of TS = 37 (5 for 5 dof) for reported sources, corresponding to an expectation of 0.01 false-positive sources. For sources with both WCDA and KM2A components, the summed TS value of 50 (5.1 for 10 dof) corresponds to the comparable false-detection to that of the single component of TS = 37. Hence, we also report the sources of which two components are with . Furthermore, due to the mismodeling GDE background, the sources in the gas-rich region with a low significance level might still be potential false detection. Therefore, further study is required to determine whether or not they are real sources.
3.2 Localization, Extension, and Energy Spectrum
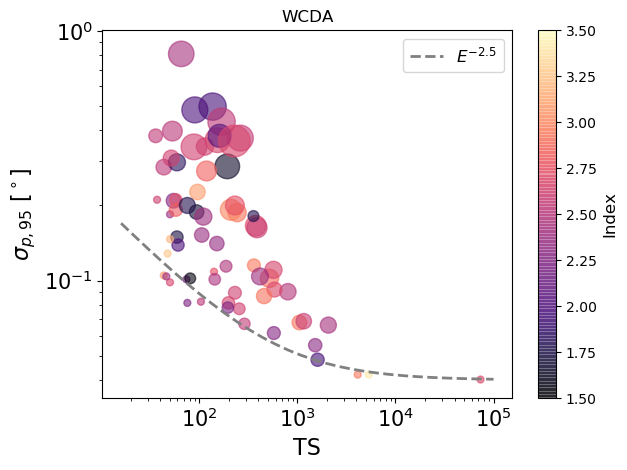
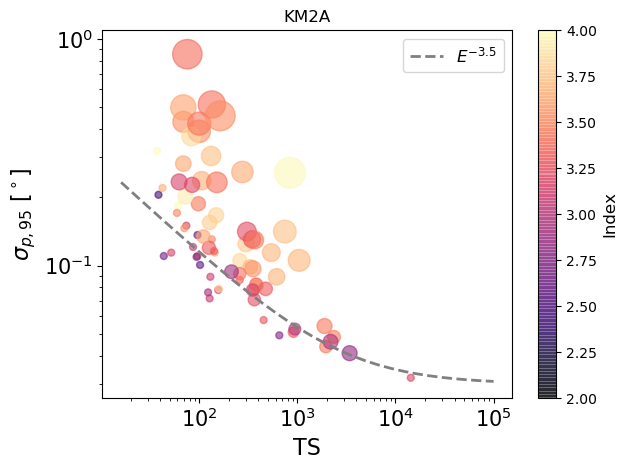
The localization of each source component, represented by and , is given by the procedure in Sec 3.1.2. The statistical errors of the localization (, ) are also estimated by analyzing the shape of the likelihood function with the HESSE tool in the Minuit2 package. It is worth noting that the localization of a faint or soft source component is more sensitive to the influence of diffuse emission and nearby sources. As a result, we may find asymmetric position error circles for these components, where . To account for this, we conservatively consider the bigger error as the one-dimensional position error, i.e., . In this work, we report the position uncertainties at the 95% confidence level as , where the 2.45 is the factor by which the 95% confidence level position uncertainty is related to for a two-dimensional axisymmetric Gaussian. Figure 2 illustrates the position uncertainties as a function of the TS values. The relatively large dispersion seen at a given TS is due to variations in local conditions , the source extension and the source spectrum. Considering the systematic error, the error radius (95% confidence) of the LHAASO sources ranges from to .
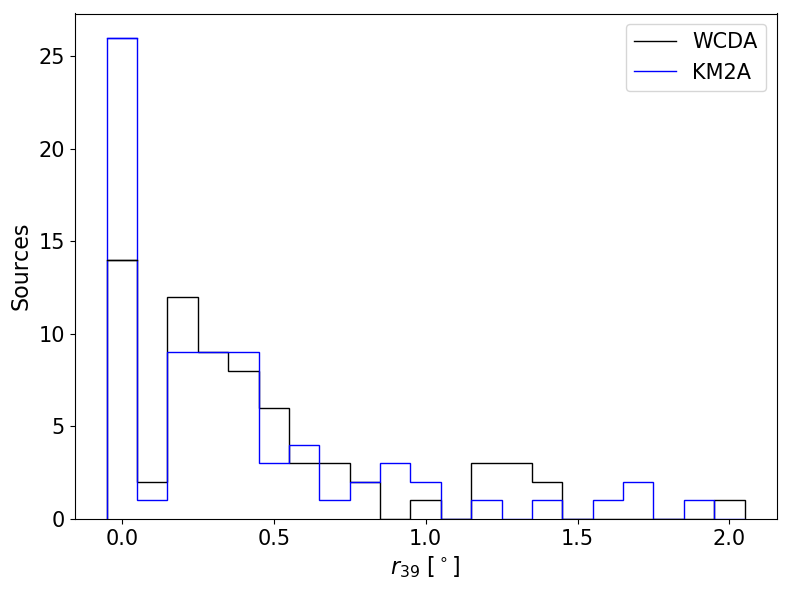
The extension size of each source component is described by a two-dimensional Gaussian (namely in this work) corresponding to 39% of the source flux. A statistical error for the measured extension () at the level can also be determined. The measurement of is invalid for the point-like components unresolved by LHAASO. Thus, for all source components, the extension Test Statistic () is performed. Here , where and are the maximum-likelihood values assuming the source spatial model is a point-like and 2D-Gaussian model, respectively. When the is lower than 9 corresponding to a significance smaller than level, we change the 2D-Gaussian spatial model to a point-like model and re-optimize the position and spectral parameters. The upper limits on the extension () at the 95% confidence level for these point-like components are derived from the shape of the likelihood function. Figure 3 shows the extension size of each source component. Roughly 1/3 are unresolved by LHAASO and modeled by a point-like morphology, and roughly 2/3 are modeled by a 2D-Gaussian morphology with an extension size ranging from to .
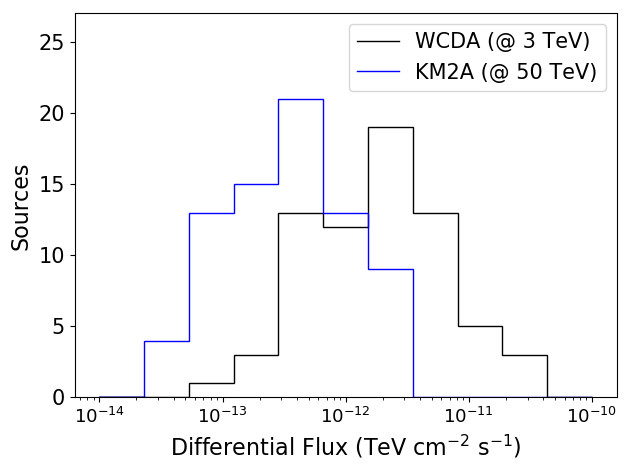
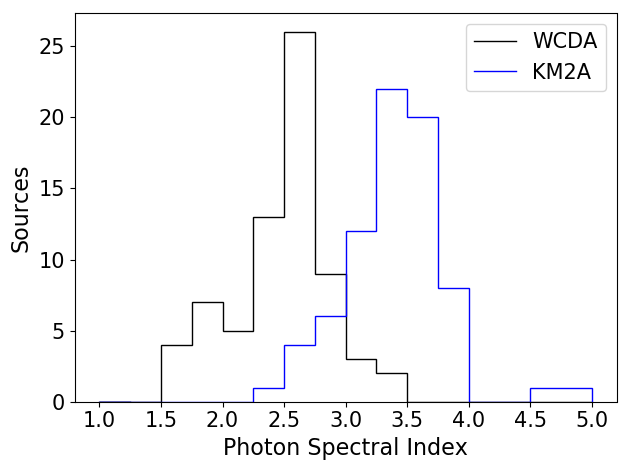
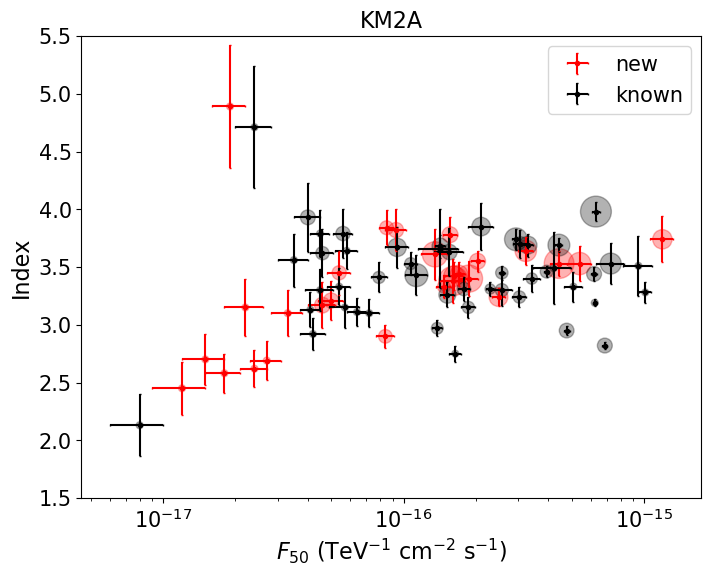
The spectral energy distribution (SED) of each source component is modeled by a simple power law (PL). Figure 4 shows the distribution of the SED parameters of the source components. The differential flux has a mean of for WCDA components at 3 TeV and for KM2A components at 50 TeV. The photon index distributions are obviously different, with an average of for WCDA components and for KM2A components, implying that a single power law shape cannot describe the overall SED for the majority of 1LHAASO catalog sources.
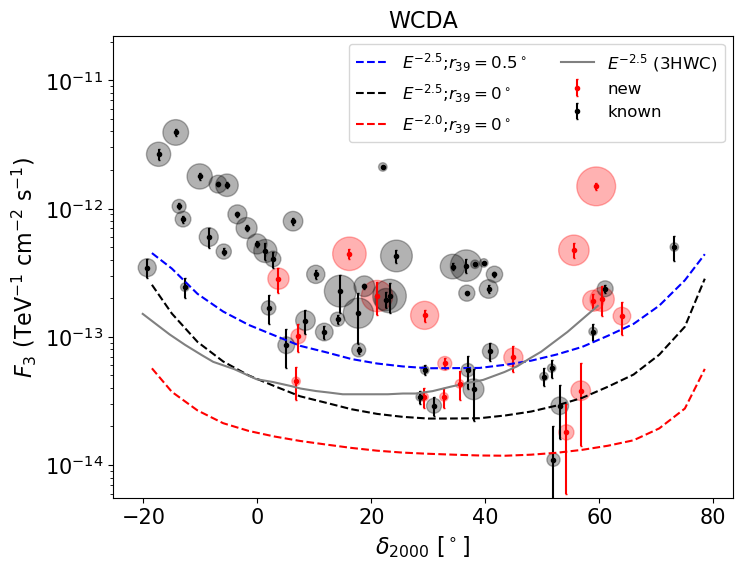
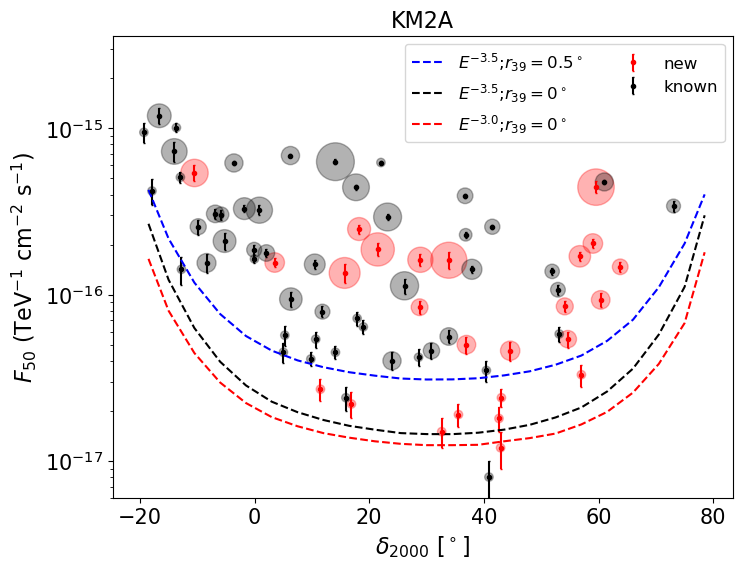
We compare the flux measurements with the sensitivity of source derived by our used data set. The flux sensitivity is defined as the flux normalization required to have 50% probability of detecting a source at level. As shown in Figure 5, the sensitivity dependents on the declination, spectral index and source size. Sources passing directly overhead, with a declination of for LHAASO ( for HAWC), exhibit the highest sensitivity. The sensitivity for a source with a softer spectrum or larger size, or at a larger declination, will tend to decrease. Thus, about 10 WCDA sources, which have fluxes above the 3HWC point source sensitivity, have not been included into the 3HWC catalog due to their large size and/or soft spectrum. In addition, it is possible that the source searching strategy employed in the 3HWC catalog results in the failure to detect several of these sources.
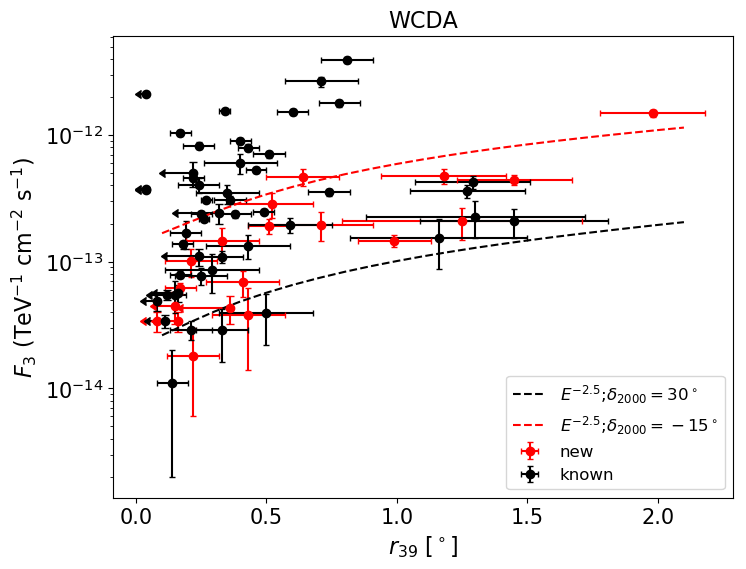
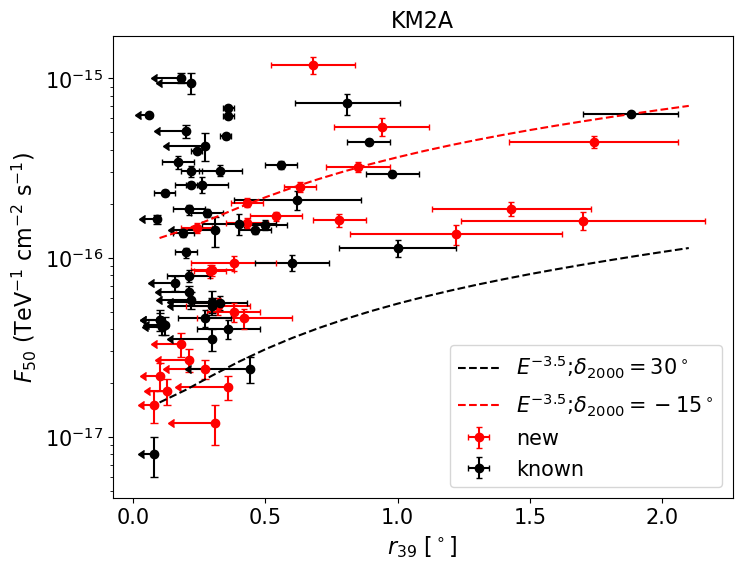
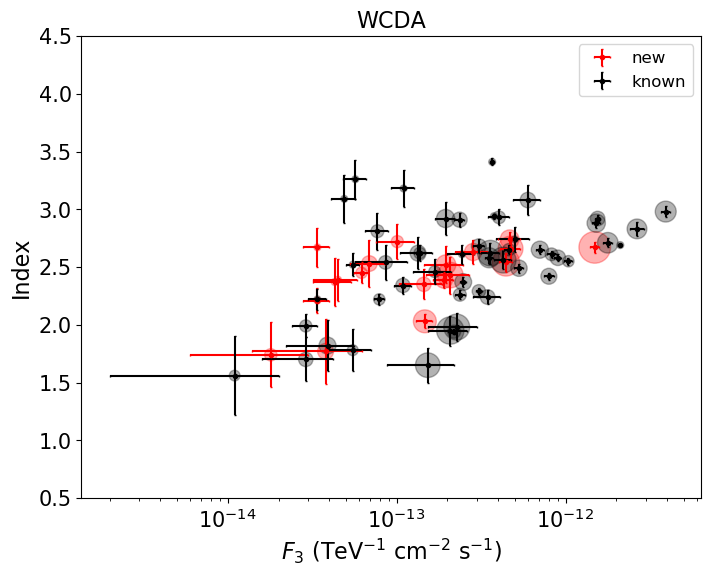
Figure 6 shows the 1LHAASO source fluxes related to source sizes or source photon spectral index. In the flux-size panel, we illustrate the approximate flux sensitivity limit of the 1LHAASO source as a function of source size. It can be observed that the sensitivity worsens as the source size increases, as mentioned earlier. For extended sources with sizes larger than , we may find a possible lack of sources with flux or . In the index-flux panel, the photon index in the WCDA band appears to be uncorrelated with the flux . However, there might be a broken power-law correlation between the photon index in the KM2A band and the logarithm of , with a break occurring at a flux of . It is not yet clear whether this phenomenon is caused by an instrument selection effect or a physical relation.
3.3 Source Detection Above 100 TeV
An exciting characteristic of LHAASO is that it can extend the observation to the UHE regime owing to the large detector area. The UHE sources are crucial to identify the emission mechanism and explore the maximum acceleration energy within the sources, and they are also very important candidates to explore the origin of PeV CRs within the Galaxy. To explore UHE sources, the sources detected at energies above 25 TeV are selected. The SED parameters of these sources are re-optimized while freezing the spatial model parameters, i.e., the position and extension size, to the values measured at . The TS values above 100 TeV (denoted by TS100) are calculated. Sources are with TS 20 ( significance level based on the distribution with two degrees of freedom) are claimed as UHE sources in this work.
3.4 Merging of the Source Components
A WCDA component and a KM2A component are considered to be the same source according to the agreement in position, i.e., , where is the positional offset between the WCDA component and the KM2A component, and and are the position uncertainties at the confidence level for the WCDA and the KM2A components, respectively. is the position-offset correction of the components, possibly due to the physical position variation or the changes in morphology at different energy bands. Additionally, incomplete descriptions of the GDE and/or of nearby sources in the analysis can also contribute to the positional offset. It is difficult to determine the value of the for each source. We expect that is related to the source extension. As a simple criterion, we adopt a loose condition with , where and are the extensions of the WCDA and KM2A components, respectively. We merge the closest pairs of the WCDA and KM2A components that satisfy this condition. Ultimately, 54 pairs of components are merged.
3.5 Known TeV Source Association
We have conducted a preliminary association of LHAASO sources with known TeV sources based on their position. A searching radius is defined by , where and are the position error and extension size of the source component. For the LHAASO sources with KM2A and WCDA components, the position and extension of the component with higher significance is used. For the point-like source components, is set to the extension upper limit. The average value of the position errors for the known TeV sources detected by EAS arrays is about 0.3∘. While for the sources detected by IACTs, the average position error is around 0.05∘. Roughly, we used the factor of 0.3 degree for the searching radius. If , a maximum searching radius of is applied.
The vast majority of the known TeV sources from ground based observatories are included in the TeV online catalog, i.e., TeVCat111http://TeVCat.uchicago.edu(Wakely & Horan, 2008). It is frequently updated, containing 252 TeV source entries to date. When associating LHAASO sources with known TeV sources, we used the canonical name and position reported in TeVCat. We exclude the TeV pulsars for the associations, since the pulsed TeV emission is expected to be null in our source searching procedure. If no TeV source in TeVCat is found for association, we further compare 1LHAASO sources with 3HWC sources, which include some sources not yet included in TeVCat so far. We list the closest TeV counterparts within the searching radius for each LHAASO source, as shown in table 2.
3.6 Systematic Uncertainties and Caveats
Based on the measurement of the standard candle, the Crab Nebula, with a position of and for the systematic error estimation, a systematic pointing error can be evaluated as for KM2A data. For the WCDA data, an investigation of the pointing systematic error has been conducted using three point sources: Crab Nebula, Mrk 421, and Mrk 501. The maximum error is from Mrk 501 at about , which is taken as the pointing error of the WCDA array in this work. It is important to note that no clear zenith angle dependence of the systematic error is found according to the observation of the Crab Nebula using events at different zenith angles, ranging over 0∘-15∘, 15∘-30∘, and 30∘-50∘. Furthermore, no systematic location bias related to declination has been identified based on the observation of the CR Moon shadow at different declination bands.
The systematic uncertainty of the size of 1LHAASO sources could be contributed by the uncertainties of the Point Spread Function (PSF). For KM2A data, we obtained a systematic bias for the at the order of by comparing the Crab measurement with our simulated data. For WCDA data, we compared the observed events profile among Crab, Mrk 421, and Mrk 501. The uncertainties can also yield a systematic bias of . Thus, we can conservatively estimate the systematic error to be at the order of for WCDA and for KM2A component.
The systematic errors affecting the spectrum have been investigated in Aharonian et al. (2021a) and in Aharonian et al. (2021b). The main systematic error is contributed by the atmospheric model in the Monte Carlo simulations. The total systematic uncertainty is estimated to be 7% on the flux and 0.02 on the spectral index for KM2A SED measurement. In the case of WCDA data, the overall systematic uncertainty can be as large as on the flux, which is estimated by the same method in Aharonian et al. (2021a). The power-law spectral shape can adequately describe the WCDA components, while it is not suitable for about 1/3 KM2A components which shown an evident curved shape at energies above 25 TeV. A detailed spectrum study needs to be carried out in the future.
Mismodeling of GDE could affect the fitted locations, extensions, and SEDs of several source components, especially for those with lower fluxes and larger sizes. A rough assessment of the impact of the GDE was performed by excluding it from the background maps for the source components in the Galactic plane region. As a result, 11 KM2A source components and 10 WCDA source components exhibited changes (in terms of location, flux, index, or extension) exceeding three times the statistical errors. Source components that were significantly affected by the GDE were tentatively labeled as such. The GDE test is not thorough because we cannot determine all the sources affected by the GDE mismodeling. As a conservative approach, source components with an extended size greater than were excluded due to the growing impact of the GDE with increasing component size. Further understanding of very extended sources or obvious GDE-impacted sources requires deeper study of the GDE model, which is beyond the scope of this work.
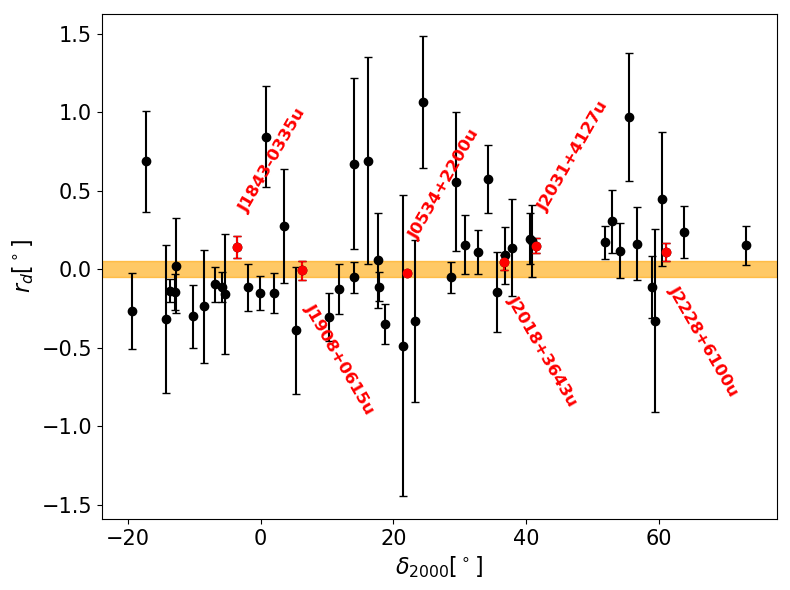
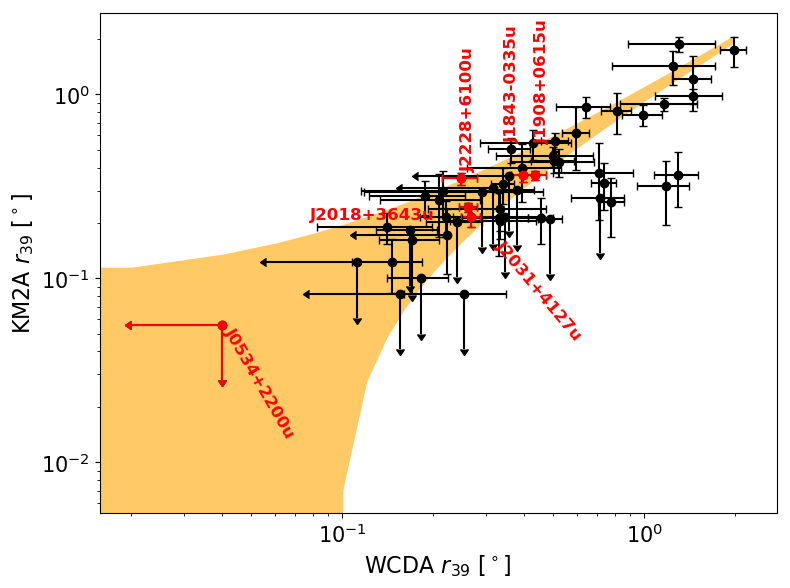
As shown in Figure 7, at 95% confidence level, approximately 40% of the merged sources exhibit a noticeable bias in position or differences in extension. The shift could be an indication of an energy-dependent morphology of these sources. However, it should be noted that due to the poor angular resolution of LHAASO, the offset in position and extension could also be influenced by emission from nearby unresolved sources or mismodeling of GDE. There is a possibility of a false merged source, which could be a combination of WCDA and KM2A components that are physically unrelated. To further examine this, we have roughly conducted individual investigations on the surface brightness distribution and spectrum of each merged source. During this process, conflicts were found in 11 merged sources, which are tentatively labeled as dubious mergers. More comprehensive studies are needed to confirm the physical association between the two components of the dubious merged sources.
4 Results
Following the above procedure, the source catalog of LHAASO has been constructed. Overall, 90 sources with extension are found over the whole LHAASO survey sky. Among them, 65 sources exhibit extended morphology with a confidence level greater than . A total of 54 sources have been simultaneously detected by both WCDA and KM2A. Among all the sources, 43 UHE sources have been detected at confidence level when TeV.
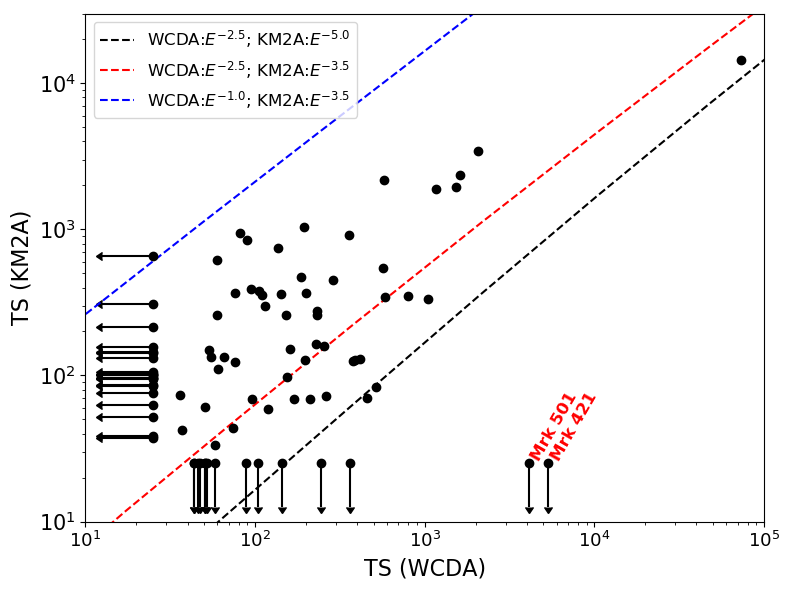
Table 2 presents a comprehensive list of all LHAASO sources obtained through the above procedure, ordered by 222The machine-readable file can be downloaded from the website https://opendata.ihep.ac.cn/#/Search. To illustrate these catalog sources, a detailed view of 82 sources with Galactic latitude are shown in Figures 11-12, in which most sources are concentrated in the inner Galactic plane. Eight individual sources are detected at Galactic latitude , as shown in Figure 13. Among them, 1LHAASO J1653+3943 and 1LHAASO J1104+3810, which correspond to Mrk 421 and Mrk 501 respectively, have been significantly detected by the WCDA detector, however, no gamma-ray emission has been found at E25 TeV by KM2A detector, due to significant absorption from interstellar radiation fields (ISRFs) and CMB. In addition to Mrk 421 and Mrk 501, there are another 34 sources detected by only one detector. This finding is reasonable considering the curved spectral shape, as illustrated in Figure 8. The different shapes of the spectra can result in various relationships in the TS value between WCDA and KM2A detections.
5 Discussion
5.1 PeVatrons
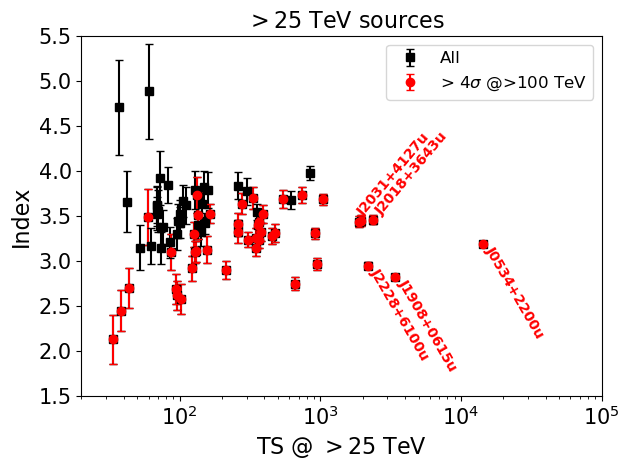
The search for and identification of galactic sources capable of accelerating CRs up to PeV energies, known as PeVatrons, is of great importance. UHE gamma rays serve as a crucial and highly promising tool for achieving this target. With its unprecedented sensitivity at UHE, LHAASO represents the best instrument to survey the PeVatrons. In fact, using approximately 300 days of data collected by the half KM2A, LHAASO has already detected 12 UHE sources with significance above 7 and maximum energies reaching up to 1.4 PeV (Cao et al., 2021a), providing crucial candidates for hadronic PeVatron exploration. In this paper, 43 sources with significance above 4 at energy beyond 100 TeV are listed in Table 2. Since these sources are well detected at with much higher significance, they are significant enough to be identified as UHE sources. Among the 43 sources, 22 sources are detected with significance above 7 (TS 54) at 100 TeV, improving by a factor of 2 the previous number of sources in Cao et al. (2021a). It is worth noting that 57% (43 out of 75) 25 TeV sources are UHE sources. According to Figure 9, most of these UHE sources have higher significance or harder spectral index than the other 25 TeV sources, which indicates that the remaining 25 TeV sources may also be detected as UHE sources by LHAASO in the future with further accumulation of data. This provides important evidence for the exciting fact that the Milky Way is full of UHE sources and full of PeV particle accelerators. Further deep analysis focusing on these sources one by one or type by type to identify the emission mechanism is a straightforward task to explore and identify the hadronic PeVatrons.
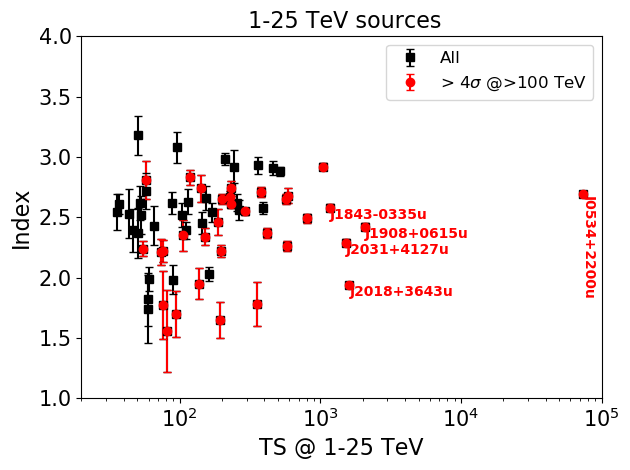
According to Table 2, 76% (33 out of 43) UHE sources are detected at energies 125 TeV by WCDA. Figure 9 shows the spectral index versus significance for these sources at energies 125 TeV. For comparison, other sources detected at energies 125 TeV are also presented in the figure, excluding the extragalactic sources listed in Table 2. The UHE sources have harder spectral index or higher significance than the others in the energy band 1-25 TeV. Up to now, more than 250 VHE sources have been detected, and more than 100 sources are within the Galaxy with a significant fraction being located in the southern sky, which is out the FOV of LHAASO. These Galactic sources would be important UHE candidates and may be revealed with UHE emission in the future observations.
It is worth noting that 10 out of 43 UHE sources were not detected by WCDA in 1-25 TeV band. These sources exhibit dominant gamma-ray emissions at energies around a few tens of TeV or TeV. Among them, sources like 1LHAASO J0216+4237u possibly belong to a new population of gamma-ray sources. These would demonstrate the distinctive importance of the UHE window at higher energy, which could explore new phenomena and new extreme celestial bodies of the Universe. With more accumulation of data, LHAASO will discover more sources with such features in the future. These sources should be also important candidates for PeVatron exploration and identification.
5.2 TeV Sources Discovered by LHAASO
As shown in Table 2, there are 25 sources without any known TeV source association. Additionally, 7 sources have conflicting extensions (with a difference of more than 0.5∘) compared to the known TeV sources within the searching region. Therefore, tentatively, these 32 sources are announced as new TeV sources detected by LHAASO in this catalog. To determine the physical nature of these sources it is often necessary to analyze their spectral and morphological features, as well as the information about multi-wavelength associations. In this section, we conduct a preliminary analysis of the associations for each new TeV source. The majority of these newly discovered LHAASO sources are expected to be Galactic sources, due to their extended properties or their KM2A component detection. However, several point-like sources detected only by WCDA could potentially have an extra-galactic origin. It is known that there are a number of types of Galactic gamma-ray emitters, such as SNRs, PSRs and their PWNe, massive star clusters (MSCs), star-forming regions(SFRs), superbubbles, binaries, etc. The vast majority of detected Galactic TeV sources are likely to be associated with SNRs and PWNe (H. E. S. S. Collaboration, 2018). To search for SNR and PWN associations, we take into account the most complete catalog of SNRs and PWNe to date, SNRcat333http://www.physics.umanitoba.ca/snr/SNRcat (Ferrand & Safi-Harb, 2012). Although we do not expect pulsed TeV emission from a pulsar to be detected by LHAASO, the pulsar is a probe to illustrate the characteristic properties of an association SNR and/or PWN, and is also an indicator of a possible unseen SNR and/or PWN. For the pulsar associations, we used the web-based Australia Telescope National Facility Pulsar catalog (ATNF pulsar catalog 444https://www.atnf.csiro.au/research/pulsar/psrcat/). There is less association between low spin-down luminosity pulsars and known TeV sources, hence we apply a cut of . Additionally, we search for associated high-energy (HE) gamma-ray sources in the 4FGL catalog (Abdollahi et al., 2020), which covers the sources at energies ranging from 0.1 GeV to 500 GeV. Note that in this section we claim an association or a counterpart based on a position less than away. For the likely extragalactic sources, the AGN catalog is adopted to search for associations within the position error. The association results are listed in Table 3.
Seven of the new TeV sources do not have any associations. They are tentatively classified as “dark” sources in this work. We list and discuss these “dark” sources briefly here:
-
•
1LHAASO J0007+5659u is a point-like source detected only by KM2A. It is an UHE source with a significance of TS100 = 43.5 at energies above 100 TeV, implying a Galactic origin.
-
•
1LHAASO J0206+4302u and 1LHAASO J0212+4254u are the point-like sources only detected by KM2A. Due to both of them being UHE sources, we suggest a Galactic origin, although these two sources are obviously far from the Galactic plane with Galactic latitude . As shown in Figure 13, these two sources and 1LHAASO J0216+4237u are close by and likely to be connected by bridges. Considering that they have a similar spectral shape (with the index of ), we favor a physical association among these three 1LHAASO sources.
-
•
1LHAASO J1937+2128 is an extended source with the size of with the WCDA and KM2A components. Although 3HWC J1935+213 ( away) and 3HWC J1936+223 ( away) are found in point searches and are within the region around the center position of this 1LHAASO source, we report this source as a new detection due to its larger extension size.
-
•
1LHAASO J1959+1129u is a point-like TeV source detected above 25 TeV with TS = 90.2, and also detected as an UHE source with TS. We cannot find any pulsar, SNR or PWN counterparts within a region around its position. Interestingly, it is from the low mass X-ray binary (LXB) 4U 1957+11 which is a black hole candidate with the simplest and cleanest soft, disk-dominated spectra (Nowak et al., 2012) in the X-ray regime. The TeV emission from 11LHAASO J1959+1129u is possibly associated with LXB 4U 1957+11. A dedicated study of 1LHAASO J1959+1129u from our LHAASO group is ongoing.
-
•
1LHAASO J2200+5643u is an extended TeV source with the size of detected by WCDA and KM2A simultaneously. It is an UHE source with the significance of TS100 = 38. The spectral index is at energies ranging from 10 TeV to 30 TeV as measured by WCDA and is at energies above 25 TeV as detected by KM2A, implying a peak or a break energy at a few tens of TeV.
-
•
1LHAASO J2229+5927u is a large extended source with the size detected by WCDA and by KM2A. Within the region centered at the position of the WCDA component, we cannot find any counterpart. The famous SNR G106.3+2.7, which has been extensively studied as a candidate PeVatron, is located at the edge of the extended region of 1LHAASO J2229+5927u. It is possible that this 1LHAASO source is the product of CRs escaping from SNR G106.3+2.7. More detailed study for this 1LHAASO source is ongoing by our collaboration.
Eight of the new TeV sources have GeV counterparts only. The details of these sources are as follows:
-
•
1LHAASO 0056+6346u is an extended source () detected by WCDA and KM2A detectors simultaneously. It is also a UHE source with TS100 = 94. The spectral shape is obviously curved with the index by WCDA and by KM2A. The unidentified point-like GeV source 4FGL J0057.9+6326 is 0.38∘ from this 1LHAASO source.
-
•
1LHAASO J0500+4454 is an extended source with a size of , only detected by WCDA in this work. The extension characteristic supports a Galactic origin. An unidentified point-like GeV source 4FGL J0501.7+4459 is 0.32∘ from this 1LHAASO source.
-
•
1LHAASO J1858+0330 is an extended source with a size of detected by WCDA with a significance of TS = 114 and by KM2A with a significance of TS = 299. It is located in the Galactic plane ( and ), towards which a complex gas distribution exists. The closest GeV source is 4FGL J1857.9+0313c which is identified as the a blazar candidate of uncertain type by the Fermi-LAT group. We exclude that the 1LHAASO source is associated with this extragalactic GeV source due to the extension characteristic. Another unidentified point-like GeV source 4FGL J1858.0+0354 is from this 1LHAASO source, and an association cannot be ruled out.
-
•
1LHAASO J1902+0648 is a point-like source with a significance of TS = 46.2 only detected by WCDA. The unidentified GeV source 4FGL J1902.5+0654 is from this 1LHAASO source.
-
•
1LHAASO J1924+1609 is an extended source with detected by WCDA and KM2A simultaneously. Although 3HWC J1923+169, found in a point search by the HAWC group, is from the center of the WCDA component, we announce 1LHAASO J1924+1609 as a new TeV source due to its large extended size. Within the region around the centroid of the WCDA component, there are three unidentified point-like GeV sources, i.e., 4FGL J1924.3+1601c, 4FGL J1925.4+1616 and 4FGL J1924.3+1628. Note that the positional offset between the WCDA component and the KM2A component is about with an uncertainty (at 95% confidence level). The pulsar PSR J1921+1544 (,,) is from the position of the KM2A component.
-
•
1LHAASO J1931+1653 is a point-like source with a significance of TS = 51.8, only detected by KM2A. The unidentified GeV source 4FGL J1931.1+1656 is from this 1LHAASO source.
-
•
1LHAASO J2027+3657 is an extended source with only detected by KM2A. It is resolved from the previously published LHAASO source LHASSO J2018+3651, which is one of the brightest sources observed by LHAASO. The point-like GeV source 4FGL J2026.5+3718c is located within a region around this 1LHAASO source.
-
•
1LHAASO J2047+4434 is an extended TeV source with TS = 62.4, only detected by KM2A. A weak WCDA component with TS is found but is not included in this catalog. The unidentified point-like GeV source 4FGL J02049.3+4440c is from this 1LHAASO source.
Sixteen of the new TeV sources have pulsar or PWN/SNR associations. Each source is briefly described as follows:
-
•
1LHAASO J0216+4237u is a point-like source located at high Galactic latitude . Interestingly, from this source, an energetic millisecond pulsar PSR J0216+4238 ( , , , ms) is located. The large position offset reduces the possibility of an association between 1LHAASO J0216+4237u and PSR J0216+4238. As mentioned above, we favor a physical association between 1LHAASO J0216+4237u, 1LHAASO J0206+4302u and 1LHAASO J0212+4254u. More details will be discussed in a forthcoming report.
-
•
1HAASO J0249+6022 is an extended source with for the WCDA component and with for the KM2A component. We can find that the KM2A component overlaps the extended region of the WCDA component, with a positional offset of . The WCDA component at energies 120 TeV could plausibly include the emission of two TeV sources, resulting in the large position offset compared to the KM2A component. In our searching radius, we just find one pulsar counterpart (PSR J0248+6021, kpc , , ms), from the position of the KM2A component. The 1LHAASO source is likely to correspond to an astrophysical system associated with PSR J0248+6021, such as a composite SNR.
-
•
1LHAASO J0359+5406 is an extended source with a size of detected by WCDA and KM2A simultaneously. Two energetic pulsars, PSR B0355+54 ( kpc, , , ms) and PSR J0359+5414 ( is unknown, , , ms) are and away, respectively, from the position of the KM2A component. The X-ray observations have revealed the presence of a compact nebula and a fainter tail of emission visible up to southwest of PSR B0355+54 (Klingler et al., 2016), and of diffuse X-ray emission extended roughly along the SE-NE direction around PSR J0359+5414 (Zyuzin et al., 2018). Thus, this 1LHAASO source is likely to be a TeV PWN powered by PSR B0355+54 or PSR J0359+5414. On the other hand, it could be a TeV halo associated with the middle-aged pulsar PSR B0355+54. It is worth noting that the HAWC collaboration also reported their detection at the same time (Albert et al., 2023).
-
•
1LHAASO J0428+5531 is an extended source detected by WCDA and KM2A detectors simultaneously. The WCDA component is with . We can find that the shell-type SNR G150.3+04.5, with a size of (Gao & Han, 2014), is from the center of the WCDA component. In the GeV band, an extended source 4FGL J0426.5+5522e modeled as a disk is also associated with SNR G150.3+04.5 (Ajello et al., 2017). The WCDA component of 1LHAASO J0428+5531 is possibly of SNR origin due to the comparable location and extension size in the multi-wavelength observation. The extended KM2A component () is from the central position of the WCDA component and away from the radio west shell of SNR G150.3+04.5 (with a size of , also named SNR G150.8+03.8 in Gerbrandt et al., 2014). A point-like GeV source 4FGL J0426.5+5434, which is possibly a pulsar candidate due to the curved SED and the cutoff energy at a few GeV, is from the position of KM2A component. Whether the KM2A component of 1LHAASO J0428+5531 is associated with the SNR G150.8+03.8 needs more study due to the obvious offset of the position and the extension size.
-
•
1LHAASO J0534+3533 is a point-like source detected by WCDA and KM2A in this work, which is near the centroid position of the shell-type SNR G172.8+01.5, away. However, the radio shell size of SNR G172.8+01.5 is estimated as , which is much larger than the TeV emission size of 1LHAASO J0534+3533. If the radio shell is physically associated with 1LHAASO J0534+3533, the TeV emission is likely to be a product of the central pulsar wind nebula.
-
•
1LHAASO J1814-1636u is an extended UHE source with the size of , only detected by KM2A. Only two SNRs, i.e., G14.1-00.1 ( away) and SNR G014.3+00.1 ( away) are found in our searching catalog. However, both SNR candidates are with radio shell size, which is inconsistent with that of gamma-ray emission. An unidentified GeV source 4FGL J1816.2-1654c is found at away from the position of the TeV emission.
-
•
Source 1LHAASO J1831-1028 only has an extended KM2A component and with the size of . In our association procedure, we just find three SNR candidates, i.e., G021.0-00.4 ( away), G021.5-00.1 ( away) and G021.8-00.6 ( away), all of which are with a radio size of . Due to the larger conflict between the size of TeV emission and that of radio shell, we disfavor that the same population of electrons produces the TeV emission and the radio emission.
-
•
1LHAASO J1852+0050u is an extended source with a WCDA component and KM2A component. The nearest known TeV source is 2HWC J1852+013* ( away), which is suffers from GDE impact and is without an extended size measurement. We claim this 1LHAASO source as a new TeV source due to its large extension. The middle-aged pulsar, PSR J1853+0056 ( = 3.84 kpc, , ) is the nearest pulsar, from the position of the KM2A component. The 1LHAASO source is possibly a TeV halo associated with this middle-aged pulsar. On the other hand, an extended GeV source 4FGL J1852.4+0037e (namely Kes 79), modeled by disk shape and identified as the SNR or PWN type by the -LAT group, is in agreement with the position and size of the 1LHAASO source. In addition, the SNRcat source G033.6+00.1, which is a small extended radio source with the size of , is suggested to be associated with the GeV source.
-
•
1LHAASO J1906+0712 is an extended source only detected by WCDA with the size of . A gamma-ray pulsar PSR J1906+0722 (,, is unknown) is from this 1LHAASO source. away, a shell-type SNR G041.1-00.3 (3C 397) is detected in the radio band with the size of , which is also detected by Fermi-LAT in the GeV band. The pulsar associated with SNR 3C 397 is not identified. An unidentified GeV source 4FGL J1906.9+0712 is also found within the region of 1LHAASO J1906+0712.
-
•
1LHAASO J1928+1813u is an extended source with only detected by KM2A. It is resolved from the UHE source LHAASO J1929+1745 seen in previous LHAASO results. Within the region around the centroid of 1LHAASO J1928+1813u, we can find the source SNR G053.4+00.0 ( away), which is a shell-type SNR with the radio size of at a distance kpc. Two GeV sources listed in 4FGL are found within the association region. At away, there is an energetic pulsar PSR J1928+1746 ( = 4.34 kpc, , ).
-
•
1LHAASO J1954+3253 is an extended TeV source (), only detected by WCDA with the significance of TS = 144. SNR G069.0+02.7 (also named CTB 80) with the size overlaps this 1LHAASO source. SNR CTB 80 is an old SNR with a kinematic distance of kpc. At the center of SNR CTA 80, the pulsar PSR B1951+32 (,, ) is generally regarded as the compact object associated with this old SNR. A X-ray PWN around the pulsar PSR B1951+32 has been identified by ROSAT, which is shown as a 5 arcmin extended nebula. The pulsar and the SNR/PWN are also detected by -LAT, which are 4FGL J1952.9+3252 and 4FGL J1955.1+3321, respectively. We note that the position of TeV emission is from that of the pulsar and its X-ray PWN, for which more study is needed to confirm the physical association between the 1LHAASO source and CTB 80.
-
•
1LHAASO J1956+2921 is a large extended source with an WCDA component and KM2A component. It is resolved from the published LHAASO source LHAASO J1958+2845. At from the position of the WCDA component, a shell type SNR with radio size of is found.
-
•
1LHAASO J1959+2846u is an UHE TeV source with the extension size of , only detected by KM2A, which is also resolved the from previously published source LHAASO J1956+2845. The pulsar PSR J1959+2846 ( away, , , ) is the only pulsar counterpart in our searching radius. SNR G065.8-00.5 and SNR G066.0-00.0 are found at and from the position of 1LHAASO J1959+2846u, with radio sizes of and , respectively.
-
•
1LHAASO J2002+3244u is a point-like source with TS=74.0 as detected by WCDA and with TS = 43.6 as detected by KM2A. It is also an UHE source with TS100 = 28.1. 4FGL J2002.3+3246 is spatially coincident with this source, which is identified as a potential association with a SNR or PWN by the -LAT group. A shell type SNR G069.7+01.0 is possibly associated with 1LHAASO 2002+3244u ( away). We favor that 1LHAASO 2002+3244u has an SNR origin because the position and size of TeV emission agree with the radio shell of SNR G069.7+01.0.
-
•
1LHAASO J2028+3352 is a large extended source with , only detected by KM2A. from their centroid position, a middle-aged pulsar PSR J2028+3332 (,) is found, implying a possible TeV halo identification. Two GeV sources are found within the region around the 1LHAASO source, of which one is the pulsar PSR J2028+3332 and the other is an unidentified point-like source.
-
•
1LHAASO J2238+5900 is an extended source with the size of as detected by WCDA with TS = 110.2 and with the size of detected by KM2A with TS. Just one pulsar PSR J2238+5903 (, , ) is found within region of this source, at from the centroid position of the KM2A component. The young pulsar and the size of TeV emission shrinking with increasing energy support that 1LHAASO J2238+5900 has a PWN origin.
One possible new extragalactic source is as follows:
-
•
1LHAASO J1219+2915 is a point-like source, only detected by WCDA with a significance of TS = 49.2, and located at high Galactic latitude (). We cannot find any pulsar or SNR/PWN counterpart associated with this source. It is a likely extragalactic source due to the high Galactic latitude and null detection by KM2A. The closest AGN counterpart is the LINER-type AGN NGC 4278, from the 1LHAASO source. It is the most possible association even though we can not firmly identify this 1LHAASO source at present.
5.3 Pulsar Wind Nebulae or TeV Halos in the 1LHAASO Catalog
Pulsars left behind from supernova explosions are rapidly spinning neutron stars with extremely strong magnetic fields. The pulsed gamma-ray emission dominates at GeV energies, and only a few cases can extend to VHE. At VHE, the steady emission is from a PWN produced by the termination of the ultra-relativistic wind. PWNe constitute one of the largest VHE source populations within the Galaxy. The Crab nebula PWN has also been identified as an electron PeVatron (LHAASO Collaboration, 2021). The diffusion of escaping particles from a PWN would leads to extended VHE gamma-ray emission, which has been extensive discussed as a “TeV halo” after the discoveries of several cases (Abeysekara et al., 2017; Aharonian et al., 2021c). TeV halos are thought to form around middle-aged pulsars with ages of at least several tens of thousands of years. PWNe or TeV halos should also contribute a significant fraction of the 1LHAASO sources, and an effective method to check for this is to search for spatial coincidence with the known pulsars.
To search for pulsars associated with 1LHAASO sources, the ATNF pulsar catalog is adopted. For the hunting of associations in astronomy, an important work is to estimate the possibility of spatially coincidence by accident. A similar method as that used in Mattox et al. (1997) is adopted here. According to a previous empirical result at VHE, the identified PWN or halo type VHE sources are always associated with pulsars with high spindown power. Therefore, for each pulsar within 0.5∘ of a 1LHAASO source, the chance probability is estimated according to the space angle and pulsar spindown power using
| (1) |
Where is the characteristic angle between confusing sources,
| (2) |
and where is the number density of pulsars with not lower than that of the candidate pulsar. The is counted using the pulsars nearby the candidate pulsar with Galactic latitude and longitude , where (, ) denotes the Galactic coordinates of the candidate pulsar.
With this searching, 65 1LHAASO sources are found with at least one pulsar nearby within 0.5∘. To decrease the fake association by accident, the pulsars with chance probability higher than 1% are excluded. After this filter, 35 1LHAASO sources are found with one associated pulsar each and 2 1LHAASO sources, 1LHAASO J0359+5406 and 1LHAASO J1929+1846, are found with two associated pulsars each. For the source with two associations, the associated pulsar with a lower chance probability is listed. There are also two pairs of 1LHAASO sources, 1LHAASO J1848-0001u vs. 1LHAASO J1850-0004 and 1LHAASO J2020+3638 vs. 1LHAASO J2020+3649u, associated with the same pulsar. Again, the 1LHAASO source with a lower chance probability is listed. Finally, 35 associated pulsars are derived for the 1LHAASO sources. Detailed information about these associations is listed in Table 4.
Figure 10 shows the spindown power versus age of the associated pulsars. For comparison, all the pulsars of the ATNF catalog within LHAASO FOV are also shown in the figure. As expected, the TeV-gamma associated pulsars are among that with the most energetic spindown power (). Among these associated pulsars, the ages of 24 pulsars are less than 100k years. The corresponding 1LHAASO sources have a high possibility to be PWNe. The ages of 11 pulsars are older than 100k years, and this marks the corresponding 1LHAASO sources to possibly be PWNe/TeV halos. It is worth noting that some of them have already been identified as PWNe or PWN/TeV halos in the TeVCat, as marker in the Table 4. An exciting result is that one pulsar, i.e., PSR J0218+4232, is a millisecond pulsar, which has been expected to produce VHE emission but there has been a lack of observation evidence. The spatial coincidence between this millisecond pulsar and 1LHAASO J0216+4237u is notable, with a confidence level of 2.9. This finding favor the existence of VHE emission around millisecond pulsars, although a non-physical association cannot be definitively ruled out.
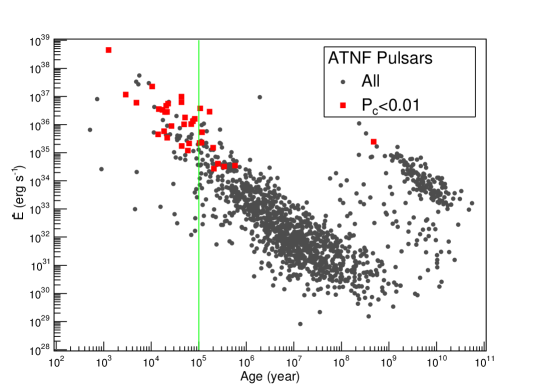
According to Figure 10, most of the energetic pulsars with higher than 10. within the FOV of LHAASO are associated with 1LHAASO sources. These shows that the PWNe of energetic pulsars are promising as effective to VHE gamma-ray emitters. It is worth noting that no VHE or UHE emission was found from a handful of energetic pulsars with higher than 10. according to Figure 10. This shows that emission of PWNs may also be affected by other parameters of the pulsars or the surrounding environment, besides the spindown power. Among the 35 1LHAASO sources with pulsar associations, twenty-two are labeled as UHE sources. This result suggests that PWNe also contribute a significant portion of the UHE sources and acceleration of electrons close to or up to 1 PeV is common for energetic PWNe. In addition to the Crab Nebula, more electron PeVatrons may be revealed by LHAASO in the future.
6 Summary
The 1LHAASO catalog, with 90 VHE gamma-ray sources, is the first comprehensive search conducted using data from the LHAASO observatory. The catalog utilizes 508 days of data from the full WCDA and 933 days of data from the full KM2A and its partial array. With 32 sources discovered, this survey is the most sensitive and roughly unbiased investigation of large sky regions in the VHE band, covering a declination range from to 80∘. Seven new sources do not have counterparts in the GeV gamma-ray, pulsar, and SNR catalogs, and are referred to as “dark sources”. Among the 90 1LHAASO sources, sixty-nine are detected with emissions in the energy range 1-25 TeV, while seventy-five are detected at emission energy of TeV, both with a significance above 5. The catalog provides information on the extension and spectrum of each source, with 65 sources exhibiting clear extension. To be conservative and avoid confusion with diffuse gamma rays from the Galactic plane, only sources with extensions less than 2∘ are included in the 1LHAASO catalog. Additionally, 43 sources exhibit clear UHE emission, with a significance above 4 at TeV. This significantly expands the current number of known UHE sources, by a factor of 3, and suggests that most Galactic VHE sources are potential UHE sources, indicating a prevalence of PeV particle accelerators in the Milky Way. Ten out of the forty-three UHE sources are not detected at the 1-25 TeV range, possibly representing a new class of gamma-ray sources dominated by emission above tens of TeV. Thirty-five 1LHAASO sources are associated with energetic pulsars, with a chance coincident probability of less than 1%. Apart from sources already identified as PWNe or TeV halos, the remaining sources associated with energetic () pulsars are likely PWNs or TeV halos. The majority of energetic pulsars within the LHAASO field of view are associated with 1LHAASO sources, and a significant fraction of these sources are also UHE sources. This suggests that PWNe associated with energetic pulsars are effective emitters of VHE and UHE radiation and have a general capability to accelerate electrons close to or up to PeV energies.
With a large FOV and full duty cycle, the full LHAASO detector configuration has been monitoring the sky since July 2021 and will continue operations for the next 20 years. With the the accumulation of data, the sensitivity in both the VHE and UHE bands will improve. Further optimization of data analysis and refining detector response simulation are ongoing, which may also expand its capacity. Deep and multi-wavelength analysis focusing on the 1LHAASO sources one by one is also ongoing. Therefore, LHAASO is expected to unveil more new discoveries and provide a deeper understanding of the VHE and UHE universe in the near future.
7 Acknowledgments
We would like to thank all staff members who work at the LHAASO site above 4400 meters above sea level year-round to maintain the detector and keep the water recycling system, electricity power supply and other components of the experiment operating smoothly. We are grateful to Chengdu Management Committee of Tianfu New Area for the constant financial support for research with LHAASO data. This research work is supported by the following grants: The National Key R&D program of China No.2018YFA0404201, No.2018YFA0404202, No.2018YFA0404203, No.2018YFA0404204, National Natural Science Foundation of China No.12022502, No.U1831208, No.12205314, No.12105301, No.12261160362, No.12105294, No.U1931201, No.12005246, No.12173039, Department of Science and Technology of Sichuan Province, China No.2021YFSY0030, Project for Young Scientists in Basic Research of Chinese Academy of Sciences No.YSBR-061, and in Thailand by the NSRF via the Program Management Unit for Human Resources & Institutional Development, Research and Innovation (No. B37G660015).
8 author contributions
S.Q. Xi and S.Z. Chen led the drafting of text and performed the data analysis of KM2A, S.C. Hu and M. Zha conducted the data analysis of WCDA. Y.Y. Guo and J.Y. He provided the cross-check. G.M. Xiang illustrated some figures in this article. Zhen Cao, the spokesperson of the LHAASO Collaboration, coordinated the specific working group for this paper involving all corresponding authors. All other authors participated in data analysis, including detector calibration, data processing, event reconstruction, data quality checks, and various simulations, and provided comments on the manuscript.
References
- Abdo et al. (2007) Abdo, A. A., Allen, B., Berley, D., et al. 2007, ApJ, 664, L91, doi: 10.1086/520717
- Abdollahi et al. (2020) Abdollahi, S., Acero, F., Ackermann, M., et al. 2020, ApJS, 247, 33. doi:10.3847/1538-4365/ab6bcb
- Abdollahi et al. (2022) Abdollahi, S., Acero, F., Baldini, L., et al. 2022, ApJS, 260, 53, doi: 10.3847/1538-4365/ac6751
- Albert et al. (2023) Albert, A., Alfaro, R., Arteaga-Velázquez, J. C., et al. 2023, ApJ, 944, L29. doi:10.3847/2041-8213/acb5ee
- Abeysekara et al. (2017) Abeysekara, A. U., Albert, A., Alfaro, R., et al. 2017, Science, 358, 911, doi: 10.1126/science.aan4880
- Abeysekara et al. (2020) —. 2020, Phys. Rev. Lett., 124, 021102, doi: 10.1103/PhysRevLett.124.021102
- Abramowski et al. (2014) Abramowski, A., Aharonian, F., Ait Benkhali, F., et al. 2014, Phys. Rev. D, 90, 122007. doi:10.1103/PhysRevD.90.122007
- Ackermann et al. (2013) Ackermann, M., Ajello, M., Allafort, A., et al. 2013, Science, 339, 807, doi: 10.1126/science.1231160
- Aharonian et al. (2006) Aharonian, F., Akhperjanian, A. G., Bazer-Bachi, A. R., et al. 2006, A&A, 457, 899, doi: 10.1051/0004-6361:20065351
- Aharonian et al. (2021a) Aharonian, F., An, Q., Axikegu, et al. 2021a, Chinese Physics C, 45, 085002, doi: 10.1088/1674-1137/ac041b
- Aharonian et al. (2021b) —. 2021b, Chinese Physics C, 45, 025002, doi: 10.1088/1674-1137/abd01b
- Aharonian et al. (2021c) Aharonian, F., An, Q., Axikegu, Bai, L. X., et al. 2021c, Phys. Rev. Lett., 126, 241103, doi: 10.1103/PhysRevLett.126.241103
- Aharonian et al. (2022) —. 2022, Phys. Rev. D, 106, 122004, doi: 10.1103/PhysRevD.106.122004
- Ajello et al. (2017) Ajello, M., Atwood, W. B., Baldini, L., et al. 2017, ApJS, 232, 18, doi: 10.3847/1538-4365/aa8221
- Albert et al. (2020) Albert, A., Alfaro, R., Alvarez, C., et al. 2020, ApJ, 905, 76, doi: 10.3847/1538-4357/abc2d8
- Aleksić et al. (2016) Aleksić, J., Ansoldi, S., Antonelli, L. A., et al. 2016, Astroparticle Physics, 72, 76, doi: 10.1016/j.astropartphys.2015.02.005
- Amenomori et al. (2005) Amenomori, M., Ayabe, S., Chen, D., et al. 2005, ApJ, 633, 1005, doi: 10.1086/491612
- Amenomori et al. (2019)
- Amenomori et al. (2021) Amenomori, M., Bao, Y. W., Bi, X. J., et al. 2021, Phys. Rev. Lett., 126, 141101. doi:10.1103/PhysRevLett.126.141101 Amenomori, M., Bao, Y. W., Bi, X. J., et al. 2019, Phys. Rev. Lett., 123, 051101, doi: 10.1103/PhysRevLett.123.051101
- Atwood et al. (2009) Atwood, W. B., Abdo, A. A., Ackermann, M., et al. 2009, ApJ, 697, 1071, doi: 10.1088/0004-637X/697/2/1071
- Bartoli et al. (2012) Bartoli, B., Bernardini, P., Bi, X. J., et al. 2012, ApJ, 758, 2, doi: 10.1088/0004-637X/758/1/2
- Bartoli et al. (2013) —. 2013, ApJ, 779, 27, doi: 10.1088/0004-637X/779/1/27
- Bartoli et al. (2014) —. 2014, ApJ, 790, 152, doi: 10.1088/0004-637X/790/2/152
- Bartoli et al. (2016) —. 2016, ApJS, 222, 6, doi: 10.3847/0067-0049/222/1/6
- Cao et al. (2021a) Cao, Z., Aharonian, F. A., An, Q., et al. 2021a, Nature, 594, 33, doi: 10.1038/s41586-021-03498-z
- Cao et al. (2021b) Cao, Z., Aharonian, F., An, Q., et al. 2021b, ApJ, 919, L22, doi: 10.3847/2041-8213/ac2579
- Cao et al. (2021c) —. 2021c, ApJ, 917, L4, doi: 10.3847/2041-8213/ac0fd5
- Cao et al. (2022a) —. 2022a, Phys. Rev. Lett., 128, 051102, doi: 10.1103/PhysRevLett.128.051102
- Cao et al. (2022b) —. 2022b, Phys. Rev. Lett., 129, 261103, doi: 10.1103/PhysRevLett.129.261103
- Cao et al. (2023) —. 2023, arXiv e-prints, arXiv:2305.05372, doi: 10.48550/arXiv.2305.05372
- Duan et al. (2021) Duan, K.-K., et al. 2021, PoS, ICRC2021, 631, doi: 10.22323/1.395.0631
- Ferrand & Safi-Harb (2012) Ferrand, G., & Safi-Harb, S. 2012, Advances in Space Research, 49, 1313, doi: 10.1016/j.asr.2012.02.004
- Fleysher et al. (2004) Fleysher, R., Fleysher, L., Nemethy, P., Mincer, A. I., & Haines, T. J. 2004, ApJ, 603, 355, doi: 10.1086/381384
- Gao & Han (2014) Gao, X. Y., & Han, J. L. 2014, A&A, 567, A59, doi: 10.1051/0004-6361/201424128
- Gerbrandt et al. (2014) Gerbrandt, S., Foster, T. J., Kothes, R., Geisbüsch, J., & Tung, A. 2014, A&A, 566, A76, doi: 10.1051/0004-6361/201423679
- H. E. S. S. Collaboration (2018) H. E. S. S. Collaboration, Abdalla, H., Abramowski, A., et al. 2018, A&A, 612, A1, doi: 10.1051/0004-6361/201732098
- Hartman et al. (1999) Hartman, R. C., Bertsch, D. L., Bloom, S. D., et al. 1999, ApJS, 123, 79, doi: 10.1086/313231
- Klingler et al. (2016) Klingler, N., Rangelov, B., Kargaltsev, O., et al. 2016, ApJ, 833, 253, doi: 10.3847/1538-4357/833/2/253
- LHAASO Collaboration (2021) LHAASO Collaboration, Cao, Z., Aharonian, F., et al. 2021, Science, 373, 425, doi: 10.1126/science.abg5137
- Lv et al. (2018) Lv, H., He, H., Sheng, X., et al. 2018, Astroparticle Physics, 100, 22, doi: 10.1016/j.astropartphys.2018.02.011
- Ma et al. (2022) Ma, X.-H., Bi, Y.-J., Cao, Z., et al. 2022, Chinese Physics C, 46, 030001, doi: 10.1088/1674-1137/ac3fa6
- Mattox et al. (1997) Mattox, J. R., Schachter, J., Molnar, L., Hartman, R. C., & Patnaik, A. R. 1997, ApJ, 481, 95, doi: 10.1086/304039
- Meagher & VERITAS Collaboration (2015) Meagher, K., & VERITAS Collaboration. 2015, in International Cosmic Ray Conference, Vol. 34, 34th International Cosmic Ray Conference (ICRC2015), 792, doi: 10.22323/1.236.0792
- Nowak et al. (2012) Nowak, M. A., Wilms, J., Pottschmidt, K., et al. 2012, ApJ, 744, 107, doi: 10.1088/0004-637X/744/2/107
- Planck Collaboration et al. (2014) Planck Collaboration, Abergel, A., Ade, P. A. R., et al. 2014, A&A, 571, A11, doi: 10.1051/0004-6361/201323195
- Planck Collaboration et al. (2016) Planck Collaboration, Aghanim, N., Ashdown, M., et al. 2016, A&A, 596, A109, doi: 10.1051/0004-6361/201629022
- Staszak & VERITAS Collaboration (2015) Staszak, D., & VERITAS Collaboration. 2015, in International Cosmic Ray Conference, Vol. 34, 34th International Cosmic Ray Conference (ICRC2015), 868, doi: 10.22323/1.236.0868
- Stewart (2009) Stewart, I. M. 2009, A&A, 495, 989. doi: 10.1051/0004-6361:200811311
- Wakely & Horan (2008) Wakely, S. P., & Horan, D. 2008, in International Cosmic Ray Conference, Vol. 3, International Cosmic Ray Conference, 1341–1344
- Zyuzin et al. (2018) Zyuzin, D. A., Karpova, A. V., & Shibanov, Y. A. 2018, MNRAS, 476, 2177, doi: 10.1093/mnras/sty359
| Source name | Components | TS | TS100 | Assoc.(Sep.[∘]) | ||||||
|---|---|---|---|---|---|---|---|---|---|---|
| 1LHAASO J00075659u | KM2A | 1.86 | 57.00 | 0.12 | 0.18 | 86.5 | 0.330.05 | 3.100.20 | 43.6 | |
| WCDA | 0.27 | |||||||||
| 1LHAASO J00077303u | KM2A | 1.91 | 73.07 | 0.07 | 0.170.03 | 361.0 | 3.410.27 | 3.400.12 | 171.6 | CTA 1 (0.12) |
| WCDA | 1.48 | 73.15 | 0.10 | 0.22 | 141.6 | 5.011.11 | 2.740.11 | |||
| 1LHAASO J00566346u | KM2A | 14.10 | 63.77 | 0.08 | 0.240.03 | 380.2 | 1.470.10 | 3.330.10 | 94.1 | |
| WCDA | 13.78 | 63.96 | 0.15 | 0.330.07 | 106.1 | 1.450.41 | 2.350.13 | |||
| 1LHAASO J02064302u | KM2A | 31.70 | 43.05 | 0.13 | 0.27 | 96.0 | 0.240.03 | 2.620.16 | 82.8 | |
| WCDA | 0.09 | |||||||||
| 1LHAASO J02124254u | KM2A | 33.01 | 42.91 | 0.20 | 0.31 | 38.4 | 0.120.03 | 2.450.23 | 30.2 | |
| WCDA | 0.07 | |||||||||
| 1LHAASO J02164237u | KM2A | 34.10 | 42.63 | 0.10 | 0.13 | 102.0 | 0.180.03 | 2.580.17 | 65.6 | |
| WCDA | 0.20 | |||||||||
| 1LHAASO J02496022 | KM2A | 42.39 | 60.37 | 0.16 | 0.380.08 | 148.8 | 0.930.09 | 3.820.18 | ||
| WCDA | 41.52 | 60.49 | 0.40 | 0.710.10 | 53.3 | 1.960.51 | 2.520.16 | |||
| 1LHAASO J03395307 | KM2A | 54.79 | 53.13 | 0.11 | 0.22 | 144.0 | 0.580.06 | 3.640.16 | LHAASO J0341+5258 (0.37) | |
| WCDA | 0.21 | |||||||||
| 1LHAASO J03435254u* | KM2A | 55.79 | 52.91 | 0.08 | 0.200.02 | 388.1 | 1.070.07 | 3.530.10 | 20.2 | LHAASO J0341+5258 (0.28) |
| WCDA | 55.34 | 53.05 | 0.18 | 0.330.05 | 94.1 | 0.290.13 | 1.700.19 | |||
| 1LHAASO J03595406 | KM2A | 59.78 | 54.10 | 0.10 | 0.300.04 | 259.2 | 0.850.06 | 3.840.15 | ||
| WCDA | 59.68 | 54.21 | 0.14 | 0.220.05 | 59.3 | 0.180.12 | 1.740.28 | |||
| 1LHAASO J04285531* | WCDA | 67.23 | 55.53 | 0.36 | 1.180.12 | 153.8 | 4.730.65 | 2.660.10 | ||
| KM2A | 66.63 | 54.63 | 0.18 | 0.320.06 | 98.0 | 0.540.06 | 3.450.19 | |||
| 1LHAASO J05004454 | WCDA | 75.01 | 44.92 | 0.28 | 0.410.07 | 43.6 | 0.690.16 | 2.530.20 | ||
| KM2A | 0.09 | |||||||||
| 1LHAASO J05343533 | KM2A | 83.53 | 35.56 | 0.18 | 0.36 | 60.8 | 0.190.03 | 4.890.53 | ||
| WCDA | 83.38 | 35.48 | 0.18 | 0.36 | 50.4 | 0.430.11 | 2.370.21 | |||
| 1LHAASO J05342200u | WCDA | 83.623 | 22.012 | 0.004 | 0.04 | 73603.7 | 21.100.11 | 2.690.01 | Crab (0.01) | |
| KM2A | 83.614 | 22.036 | 0.011 | 0.06 | 14328.1 | 6.230.10 | 3.190.03 | 2381.4 | ||
| 1LHAASO J05422311u | KM2A | 85.71 | 23.20 | 0.14 | 0.980.05 | 745.3 | 2.930.12 | 3.740.09 | 21.2 | HAWC J0543+233 (0.21) |
| WCDA* | 86.07 | 23.19 | 0.50 | 1.450.18 | 136.9 | 2.080.54 | 1.950.13 | |||
| 1LHAASO J06172234 | WCDA | 94.35 | 22.57 | 0.18 | 0.590.08 | 243.4 | 1.950.27 | 2.920.14 | IC 443 (0.14) | |
| KM2A | 0.17 | |||||||||
| 1LHAASO J06223754 | KM2A | 95.50 | 37.90 | 0.08 | 0.460.03 | 615.0 | 1.420.07 | 3.680.10 | LHAASO J0621+3755 (0.03) | |
| WCDA | 95.67 | 37.93 | 0.29 | 0.500.09 | 59.3 | 0.390.17 | 1.820.22 | |||
| 1LHAASO J06311040 | KM2A | 97.77 | 10.67 | 0.11 | 0.30 | 141.6 | 0.540.06 | 3.330.16 | 3HWC J0631+107(0.06) | |
| WCDA | 0.36 | |||||||||
| 1LHAASO J06341741u | KM2A | 98.57 | 17.69 | 0.10 | 0.890.04 | 1043.3 | 4.420.15 | 3.690.06 | 23.0 | Geminga (0.54) |
| WCDA | 98.51 | 17.72 | 0.28 | 1.160.17 | 193.2 | 1.530.65 | 1.650.15 | |||
| 1LHAASO J06350619 | KM2A | 98.76 | 6.33 | 0.23 | 0.600.07 | 106.1 | 0.940.10 | 3.670.18 | HAWC J0635+070 (0.67) | |
| WCDA | 0.90 | |||||||||
| 1LHAASO J07031405 | KM2A | 105.83 | 14.10 | 0.26 | 1.880.09 | 841.0 | 6.300.23 | 3.980.08 | 2HWC J0700+143 (0.72) | |
| WCDA | 105.32 | 14.55 | 0.48 | 1.300.21 | 90.2 | 2.270.74 | 1.980.12 | |||
| 1LHAASO J11043810 | WCDA | 166.07 | 38.18 | 0.01 | 0.04 | 5343.6 | 3.680.10 | 3.410.03 | Mrk 421 (0.02) | |
| KM2A | 0.06 | |||||||||
| 1LHAASO J12192915 | WCDA | 184.98 | 29.25 | 0.09 | 0.08 | 50.4 | 0.340.06 | 2.670.17 | ||
| KM2A | 0.05 | |||||||||
| 1LHAASO J16533943 | WCDA | 253.43 | 39.73 | 0.01 | 0.04 | 4121.6 | 3.770.08 | 2.940.02 | Mrk 501 (0.04) | |
| KM2A | 0.07 | |||||||||
| 1LHAASO J17275016 | WCDA | 261.89 | 50.28 | 0.10 | 0.08 | 43.6 | 0.490.08 | 3.090.21 | 1ES 1727+502 (0.14) | |
| KM2A | 0.03 | |||||||||
| 1LHAASO J17400948u | KM2A | 265.03 | 9.81 | 0.07 | 0.11 | 156.2 | 0.410.04 | 3.130.15 | 37.2 | 3HWC J1739+099(0.13) |
| WCDA | 0.29 | |||||||||
| 1LHAASO J18091918u | KM2A | 272.38 | -19.30 | 0.13 | 0.22 | 134.6 | 9.461.27 | 3.510.26 | 88.4 | HESS J1809-193 (0.24) |
| WCDA | 272.66 | -19.32 | 0.20 | 0.350.06 | 54.8 | 3.460.61 | 2.240.06 | |||
| 1LHAASO J18131245 | KM2A | 273.36 | -12.75 | 0.22 | 0.31 | 42.2 | 1.420.27 | 3.660.34 | HESS J1813-126 (0.07) | |
| WCDA | 273.35 | -12.73 | 0.21 | 0.32 | 37.2 | 2.440.44 | 2.610.08 | |||
| 1LHAASO J18141719u* | WCDA | 273.69 | -17.33 | 0.27 | 0.710.07 | 118.8 | 26.502.46 | 2.830.06 | 2HWC J1814-173 (0.16) | |
| KM2A | 273.27 | -17.89 | 0.17 | 0.27 | 59.3 | 4.200.75 | 3.490.31 | 41.0 | ||
| 1LHAASO J18141636u | KM2A | 273.72 | -16.62 | 0.30 | 0.680.08 | 132.2 | 11.901.30 | 3.740.20 | 50.4 | 2HWC J1814-173 (0.72) |
| WCDA | 19.71 | |||||||||
| 1LHAASO J18251418 | WCDA | 276.29 | -14.32 | 0.19 | 0.810.05 | 210.2 | 39.202.30 | 2.980.05 | HESS J1825-137 (0.56) | |
| KM2A | 276.25 | -14.00 | 0.43 | 0.810.10 | 68.9 | 7.260.98 | 3.530.18 | |||
| 1LHAASO J18251256u | KM2A | 276.44 | -12.94 | 0.08 | 0.20 | 259.2 | 5.080.42 | 3.330.13 | 121.0 | HESS J1826-130 (0.14) |
| WCDA | 276.55 | -13.04 | 0.08 | 0.240.03 | 231.0 | 8.270.54 | 2.610.03 | |||
| 1LHAASO J18251337u | KM2A | 276.45 | -13.63 | 0.05 | 0.18 | 453.7 | 10.100.61 | 3.280.09 | 249.6 | HESS J1825-137 (0.15) |
| WCDA | 276.55 | -13.73 | 0.05 | 0.170.02 | 289.0 | 10.400.56 | 2.550.03 | |||
| 1LHAASO J18311007u* | WCDA | 277.75 | -10.12 | 0.16 | 0.780.04 | 376.4 | 17.801.06 | 2.710.04 | HESS J1831-098 (0.25) | |
| KM2A | 277.81 | -9.83 | 0.12 | 0.260.05 | 125.4 | 2.560.27 | 3.300.14 | 53.3 | ||
| 1LHAASO J18311028 | KM2A | 277.84 | -10.48 | 0.39 | 0.940.09 | 100.0 | 5.390.60 | 3.530.15 | HESS J1833-105 (0.55) | |
| WCDA | 7.77 | |||||||||
| 1LHAASO J18340831 | WCDA | 278.62 | -8.53 | 0.22 | 0.400.07 | 96.0 | 5.991.09 | 3.080.13 | HESS J1834-087 (0.24) | |
| KM2A | 278.44 | -8.38 | 0.28 | 0.400.07 | 68.9 | 1.550.21 | 3.630.21 | |||
| 1LHAASO J18370654u | WCDA* | 279.39 | -6.90 | 0.06 | 0.340.01 | 1049.8 | 15.500.54 | 2.920.03 | HESS J1837-069 (0.05) | |
| KM2A | 279.31 | -6.86 | 0.09 | 0.330.04 | 331.2 | 3.060.21 | 3.700.12 | 25.0 | ||
| 1LHAASO J18390548u | KM2A | 279.79 | -5.81 | 0.06 | 0.220.02 | 364.8 | 3.030.20 | 3.240.09 | 127.7 | LHAASO J1839-0545 (0.17) |
| WCDA* | 279.85 | -5.90 | 0.07 | 0.220.02 | 198.8 | 4.620.29 | 2.650.04 | |||
| 1LHAASO J18410519 | WCDA | 280.33 | -5.33 | 0.09 | 0.600.03 | 519.8 | 15.200.84 | 2.880.04 | HESS J1841-055 (0.25) | |
| KM2A* | 280.21 | -5.23 | 0.37 | 0.620.12 | 82.8 | 2.100.25 | 3.850.20 | |||
| 1LHAASO J18430335u | KM2A | 280.91 | -3.60 | 0.04 | 0.360.01 | 1892.2 | 6.190.20 | 3.440.06 | 295.8 | HESS J1843-033 (0.06) |
| WCDA | 281.01 | -3.50 | 0.06 | 0.400.02 | 1162.8 | 9.010.43 | 2.580.03 | |||
| 1LHAASO J18480153u | WCDA* | 282.06 | -1.89 | 0.10 | 0.510.03 | 571.2 | 7.050.40 | 2.650.04 | HESS J1848-018 (0.11) | |
| KM2A* | 282.02 | -1.78 | 0.11 | 0.560.03 | 542.9 | 3.290.17 | 3.690.10 | 36.0 | ||
| 1LHAASO J18480001u | KM2A | 282.19 | -0.02 | 0.04 | 0.09 | 655.4 | 1.640.10 | 2.750.07 | 316.8 | IGR J18490-0000 (0.08) |
| WCDA | 0.95 | |||||||||
| 1LHAASO J18500004u* | WCDA | 282.74 | -0.07 | 0.08 | 0.460.02 | 800.9 | 5.300.32 | 2.490.04 | HESS J1852-000 (0.36) | |
| KM2A | 282.89 | -0.07 | 0.07 | 0.210.03 | 349.7 | 1.860.12 | 3.150.09 | 102.0 | ||
| 1LHAASO J18520050u* | KM2A* | 283.10 | 0.84 | 0.26 | 0.850.06 | 275.6 | 3.220.22 | 3.640.12 | 22.1 | 2HWC J1852+013* (0.55) |
| WCDA | 283.73 | 1.40 | 0.20 | 0.640.07 | 231.0 | 4.670.70 | 2.740.06 | |||
| 1LHAASO J18570245 | WCDA | 284.37 | 2.75 | 0.11 | 0.240.04 | 361.0 | 4.040.57 | 2.930.07 | HESS J1857+026 (0.11) | |
| KM2A | 0.32 | |||||||||
| 1LHAASO J18570203u | KM2A | 284.38 | 2.06 | 0.07 | 0.280.03 | 475.2 | 1.780.10 | 3.310.10 | 112.4 | HESS J1858+020 (0.21) |
| WCDA | 284.50 | 1.98 | 0.11 | 0.190.03 | 187.7 | 1.680.43 | 2.460.11 | |||
| 1LHAASO J18580330 | KM2A* | 284.59 | 3.51 | 0.12 | 0.430.04 | 299.3 | 1.560.10 | 3.780.15 | ||
| WCDA | 284.79 | 3.70 | 0.34 | 0.520.08 | 114.5 | 2.840.63 | 2.630.10 | |||
| 1LHAASO J19020648 | WCDA | 285.58 | 6.80 | 0.10 | 0.15 | 46.2 | 0.450.13 | 2.390.18 | ||
| KM2A | 0.06 | |||||||||
| 1LHAASO J19060712 | WCDA | 286.56 | 7.20 | 0.21 | 0.210.05 | 57.8 | 1.010.25 | 2.720.15 | ||
| KM2A | 0.19 | |||||||||
| 1LHAASO J19070826 | WCDA* | 286.96 | 8.44 | 0.31 | 0.430.08 | 51.8 | 1.340.29 | 2.620.14 | 2HWC J1907+084* (0.18) | |
| KM2A | 0.29 | |||||||||
| 1LHAASO J19080615u | KM2A | 287.05 | 6.26 | 0.03 | 0.360.01 | 3410.6 | 6.860.16 | 2.820.03 | 912.0 | MGRO J1908+06 (0.07) |
| WCDA | 287.05 | 6.26 | 0.05 | 0.430.02 | 2070.2 | 7.970.54 | 2.420.03 | |||
| 1LHAASO J19100516* | KM2A | 287.55 | 5.28 | 0.15 | 0.30 | 74.0 | 0.570.08 | 3.150.18 | SS 433 w1 (0.26) | |
| WCDA | 287.88 | 5.07 | 0.38 | 0.290.09 | 36.0 | 0.860.29 | 2.540.15 | |||
| 1LHAASO J19121014u | WCDA | 288.22 | 10.25 | 0.08 | 0.360.03 | 585.6 | 3.070.24 | 2.680.06 | HESS J1912+101 (0.10) | |
| KM2A* | 288.38 | 10.50 | 0.13 | 0.500.04 | 346.0 | 1.520.10 | 3.260.11 | 68.9 | ||
| 1LHAASO J19130501 | KM2A | 288.28 | 5.03 | 0.11 | 0.10 | 96.0 | 0.450.06 | 3.300.18 | SS 433 e1 (0.15) | |
| WCDA | 0.37 | |||||||||
| 1LHAASO J19141150u | KM2A* | 288.73 | 11.84 | 0.09 | 0.210.04 | 259.2 | 0.790.06 | 3.410.13 | 26.0 | 2HWC J1914+117* (0.13) |
| WCDA* | 288.81 | 11.74 | 0.14 | 0.330.04 | 151.3 | 1.090.12 | 2.340.07 | |||
| 1LHAASO J19191556 | KM2A | 289.78 | 15.93 | 0.32 | 0.44 | 37.2 | 0.240.04 | 4.710.53 | 3HWC J1918+159(0.09) | |
| WCDA | 0.03 | |||||||||
| 1LHAASO J19221403 | WCDA | 290.70 | 14.06 | 0.07 | 0.180.02 | 256.0 | 1.370.10 | 2.620.07 | W 51 (0.13) | |
| KM2A | 290.73 | 14.11 | 0.07 | 0.10 | 158.8 | 0.450.04 | 3.790.20 | |||
| 1LHAASO J19241609 | WCDA* | 291.09 | 16.15 | 0.43 | 1.450.11 | 169.0 | 4.440.41 | 2.540.08 | 3HWC J1923+169(0.86) | |
| KM2A* | 290.53 | 15.71 | 0.50 | 1.220.20 | 68.9 | 1.350.17 | 3.610.22 | |||
| 1LHAASO J19281813u | KM2A | 292.07 | 18.23 | 0.14 | 0.630.03 | 306.2 | 2.480.16 | 3.240.08 | 44.9 | 2HWC J1928+177 (0.46) |
| WCDA | 0.48 | |||||||||
| 1LHAASO J19281746u | WCDA | 292.14 | 17.78 | 0.07 | 0.170.02 | 196.0 | 0.790.05 | 2.220.05 | 2HWC J1928+177 (0.01) | |
| KM2A | 292.17 | 17.89 | 0.07 | 0.16 | 127.7 | 0.720.07 | 3.100.12 | 44.9 | ||
| 1LHAASO J19291846u* | WCDA | 292.34 | 18.77 | 0.10 | 0.490.02 | 416.2 | 2.480.11 | 2.370.04 | SNR G054.1+00.3 (0.29) | |
| KM2A | 292.04 | 18.97 | 0.08 | 0.21 | 130.0 | 0.640.06 | 3.110.12 | 26.0 | ||
| 1LHAASO J19311653 | KM2A | 292.79 | 16.90 | 0.11 | 0.10 | 51.8 | 0.220.04 | 3.150.25 | ||
| WCDA | 0.31 | |||||||||
| 1LHAASO J19372128 | KM2A* | 294.32 | 21.48 | 0.51 | 1.430.15 | 134.6 | 1.870.17 | 3.400.15 | 3HWC J1935+213(0.36) | |
| WCDA* | 294.30 | 21.00 | 0.81 | 1.250.23 | 65.6 | 2.080.59 | 2.430.16 | |||
| 1LHAASO J19452424* | WCDA | 296.36 | 24.40 | 0.37 | 1.290.11 | 262.4 | 4.270.51 | 2.560.08 | 2HWC J1949+244 (0.97) | |
| KM2A | 297.42 | 23.97 | 0.20 | 0.360.06 | 72.2 | 0.400.05 | 3.930.30 | |||
| 1LHAASO J19512608 | KM2A* | 297.94 | 26.15 | 0.42 | 1.000.11 | 100.0 | 1.130.12 | 3.430.17 | 3HWC J1951+266(0.47) | |
| WCDA | 0.48 | |||||||||
| 1LHAASO J19522922 | WCDA | 298.05 | 29.38 | 0.07 | 0.12 | 104.0 | 0.550.05 | 2.520.10 | 2HWC J1953+294 (0.21) | |
| KM2A | 0.09 | |||||||||
| 1LHAASO J19542836u | KM2A | 298.55 | 28.60 | 0.07 | 0.12 | 123.2 | 0.420.05 | 2.920.14 | 44.9 | 2HWC J1955+285 (0.24) |
| WCDA | 298.50 | 28.57 | 0.07 | 0.11 | 75.7 | 0.340.04 | 2.220.09 | |||
| 1LHAASO J19543253 | WCDA | 298.63 | 32.88 | 0.09 | 0.170.03 | 144.0 | 0.620.06 | 2.450.09 | ||
| KM2A | 0.04 | |||||||||
| 1LHAASO J19562921 | WCDA | 299.24 | 29.35 | 0.38 | 0.990.07 | 161.3 | 1.470.16 | 2.030.06 | LHAASO J1956+2845 (0.63) | |
| KM2A | 298.84 | 28.92 | 0.23 | 0.780.05 | 151.3 | 1.620.14 | 3.420.12 | |||
| 1LHAASO J19592846u | KM2A | 299.78 | 28.78 | 0.09 | 0.290.03 | 213.2 | 0.840.07 | 2.900.10 | 74.0 | |
| WCDA | 0.38 | |||||||||
| 1LHAASO J19591129u | KM2A | 299.82 | 11.49 | 0.10 | 0.21 | 94.1 | 0.270.04 | 2.690.17 | 60.8 | |
| WCDA | 0.11 | |||||||||
| 1LHAASO J20023244u | WCDA | 300.64 | 32.74 | 0.09 | 0.16 | 74.0 | 0.340.06 | 2.210.11 | ||
| KM2A | 300.60 | 32.64 | 0.11 | 0.08 | 43.6 | 0.150.03 | 2.700.22 | 28.1 | ||
| 1LHAASO J20053415* | WCDA | 301.30 | 34.25 | 0.16 | 0.740.04 | 388.1 | 3.530.21 | 2.580.05 | 2HWC J2006+341 (0.22) | |
| KM2A | 301.81 | 33.87 | 0.15 | 0.330.05 | 127.7 | 0.560.05 | 3.790.21 | |||
| 1LHAASO J20053050 | KM2A | 301.45 | 30.85 | 0.13 | 0.270.05 | 110.2 | 0.460.05 | 3.620.21 | 3HWC J2005+311(0.32) | |
| WCDA | 301.37 | 30.99 | 0.13 | 0.210.04 | 60.8 | 0.290.05 | 1.990.10 | |||
| 1LHAASO J20183643u | KM2A | 304.65 | 36.72 | 0.04 | 0.240.01 | 2362.0 | 3.930.11 | 3.460.05 | 139.2 | MGRO J2019+37 (0.11) |
| WCDA | 304.61 | 36.75 | 0.03 | 0.260.01 | 1608.0 | 2.190.06 | 1.940.02 | |||
| 1LHAASO J20204034 | WCDA | 305.03 | 40.57 | 0.08 | 0.380.03 | 458.0 | 2.360.16 | 2.910.06 | VER J2019+407 (0.19) | |
| KM2A | 305.20 | 40.43 | 0.14 | 0.30 | 70.6 | 0.350.05 | 3.560.23 | |||
| 1LHAASO J20203638 | WCDA | 305.14 | 36.63 | 0.34 | 1.270.11 | 88.4 | 3.590.43 | 2.620.09 | VER J2019+368 (0.28) | |
| KM2A | 0.18 | |||||||||
| 1LHAASO J20203649u | KM2A | 305.23 | 36.82 | 0.04 | 0.120.02 | 912.0 | 2.290.09 | 3.310.06 | 86.5 | VER J2019+368 (0.30) |
| WCDA | 305.25 | 36.91 | 0.18 | 0.150.02 | 357.2 | 0.550.16 | 1.780.18 | |||
| 1LHAASO J20273657 | KM2A | 306.88 | 36.95 | 0.23 | 0.380.05 | 84.6 | 0.500.06 | 3.210.17 | ||
| WCDA | 0.29 | |||||||||
| 1LHAASO J20283352 | KM2A | 307.21 | 33.88 | 0.86 | 1.700.23 | 75.7 | 1.610.19 | 3.380.19 | ||
| WCDA | 0.77 | |||||||||
| 1LHAASO J20314052u* | WCDA | 307.90 | 40.88 | 0.19 | 0.250.05 | 57.8 | 0.770.12 | 2.810.16 | LHAASO J2032+4102 (0.20) | |
| KM2A | 308.14 | 40.88 | 0.13 | 0.08 | 33.6 | 0.080.02 | 2.130.27 | 38.4 | ||
| 1LHAASO J20314127u | KM2A | 307.95 | 41.46 | 0.03 | 0.220.01 | 1953.6 | 2.560.08 | 3.450.06 | 136.9 | TeV J2032+4130 (0.12) |
| WCDA | 307.85 | 41.60 | 0.04 | 0.270.01 | 1521.0 | 3.070.12 | 2.290.03 | |||
| 1LHAASO J20474434 | KM2A* | 311.92 | 44.58 | 0.23 | 0.420.09 | 62.4 | 0.460.06 | 3.170.20 | ||
| WCDA | 0.33 | |||||||||
| 1LHAASO J21085153u | KM2A | 317.10 | 51.90 | 0.04 | 0.190.02 | 942.5 | 1.380.07 | 2.970.07 | 252.8 | LHAASO J2108+5157 (0.06) |
| WCDA* | 316.83 | 51.95 | 0.09 | 0.140.03 | 81.0 | 0.110.09 | 1.560.34 | |||
| 1LHAASO J22005643u | KM2A | 330.08 | 56.73 | 0.13 | 0.540.05 | 368.6 | 1.700.10 | 3.440.10 | 38.4 | |
| WCDA | 330.38 | 56.73 | 0.20 | 0.430.07 | 75.7 | 0.380.24 | 1.770.28 | |||
| 1LHAASO J22286100u | KM2A | 337.01 | 61.00 | 0.04 | 0.350.01 | 2180.9 | 4.760.14 | 2.950.04 | 605.2 | SNR G106.3+02.7 (0.13) |
| WCDA | 336.79 | 61.02 | 0.05 | 0.250.02 | 576.0 | 2.370.16 | 2.260.04 | |||
| 1LHAASO J22295927u | WCDA | 337.26 | 59.45 | 0.36 | 1.980.10 | 228.0 | 14.900.99 | 2.670.05 | ||
| KM2A* | 337.88 | 59.55 | 0.46 | 1.740.16 | 163.8 | 4.430.36 | 3.530.11 | 31.4 | ||
| 1LHAASO J22385900 | KM2A | 339.54 | 59.00 | 0.09 | 0.430.03 | 353.4 | 2.030.12 | 3.550.09 | ||
| WCDA* | 339.40 | 58.92 | 0.18 | 0.510.04 | 110.2 | 1.910.26 | 2.390.07 | |||
| 1LHAASO J23235854 | WCDA | 350.80 | 58.90 | 0.14 | 0.24 | 50.4 | 1.100.17 | 3.180.16 | Cassiopeia A (0.10) | |
| KM2A | 0.15 | |||||||||
| 1LHAASO J23465138 | WCDA | 356.70 | 51.64 | 0.12 | 0.16 | 47.6 | 0.570.09 | 3.260.17 | 1ES 2344+514 (0.08) | |
| KM2A | 0.07 |
Note. — The first column lists the LHAASO catalog name. The name designation is 1LHAASO JHHMM+DDMM, where the 1 refers to this being the first LHAASO catalog, JHHMM+DDMM is according to the source location. For a source observed by both WCDA and KM2A, the source name corresponds to the position of that with higher significance level. If the source is an UHE source with TS, we add “u” at the end of the name, i.e., 1LHAASO JHHMM+DDMMu. For dubiously merged sources, we label the names with “*”.
Note. — The 2nd column lists the component name, represented by the detector name. If the component suffers a significant GDE impact in our test, we label the component with “*”.
Note. — The 3rd 5th columns list the position parameters for the source components. and are the right ascension and declination at J2000.0 epoch. is the 95% statistical uncertainty of the source component position. The units are degrees.
Note. — The 6th column lists the extension of the source components. is the 39% containment radius of the 2D-Gaussian model. For the point-like source components, the 95% statistical upper limits (i.e., ) are shown.
Note. — The 7th column lists the TS values of the source components. It is distributed as with 5 dof.
Note. — The 8th 9th columns list the parameters of the power-law SED of the source components. The power-law shape is defined by , where is the differential flux, is the reference energy which is 3 TeV for the WCDA component and 50 TeV for the KM2A component, and is the photon spectral index. is in a units of cm-2 s-1 TeV-1 and cm-2 s-1 TeV-1 for the WCDA the KM2A components, respectively. For a source with single component detection, we give the 95% statistical upper limits of of the non-detected component with the same position, extension and photon index.
Note. — The 10th column lists the TS values of the UHE sources at energies 100 TeV.
Note. — The 11th column lists the closest known TeV source counterpart within the searching region (as described in Sec. 3.5). The angular separation between the TeV counterpart and the LHAASO source is shown in parentheses.
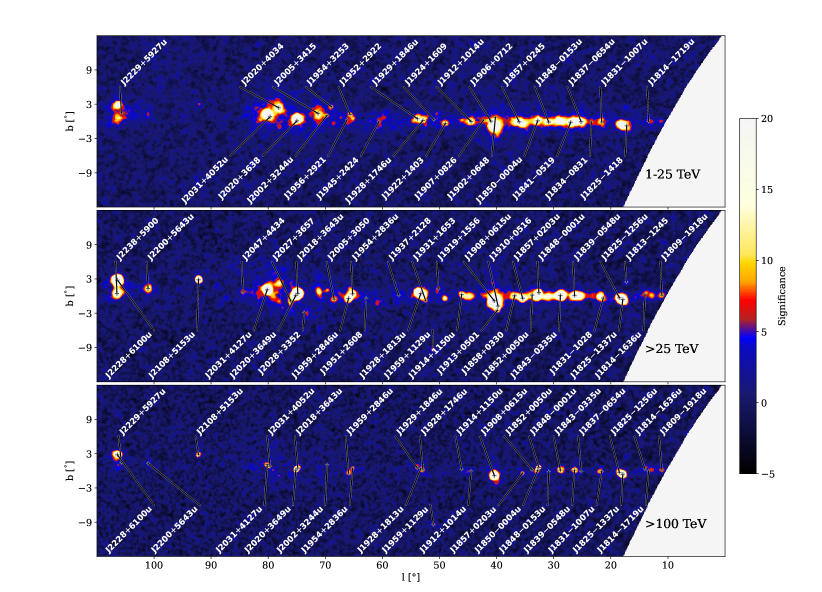
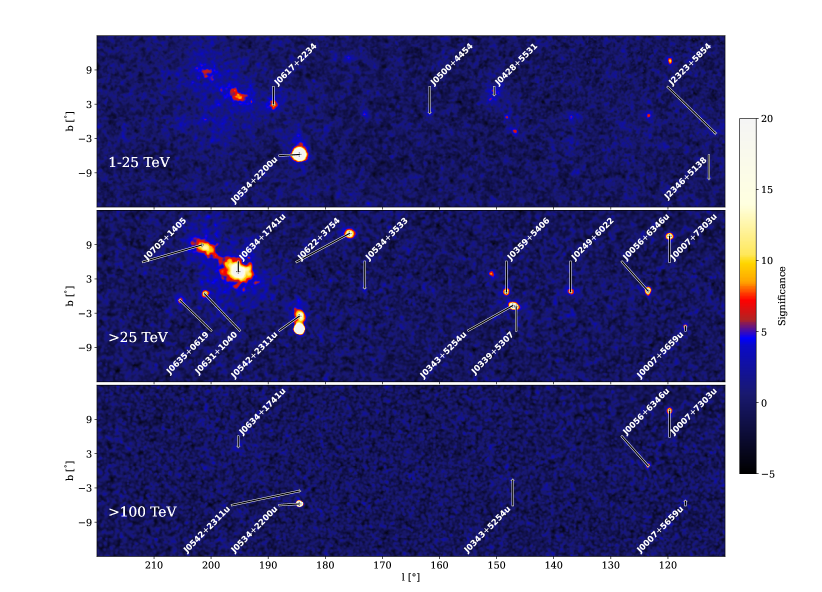
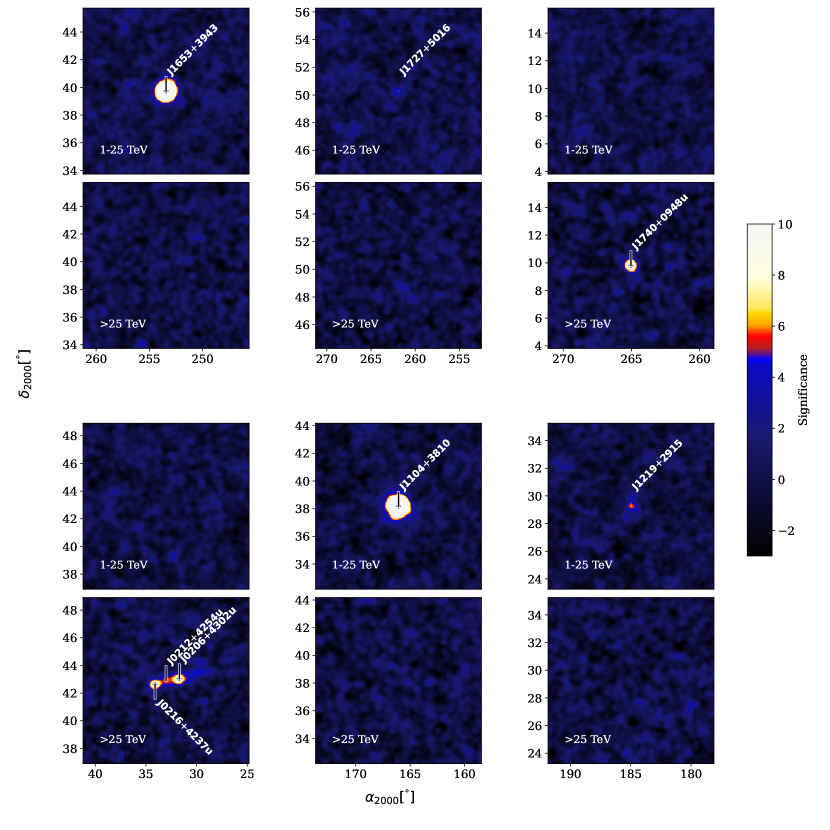
| Name | Sep.[∘] | Assoc. | Description |
|---|---|---|---|
| 1LHAASO J00075659u | |||
| 1LHAASO J02064302u | |||
| 1LHAASO J02124254u | |||
| 1LHAASO J19372128 | |||
| 1LHAASO J19591129u | |||
| 1LHAASO J22005643u | |||
| 1LHAASO J22295927u | |||
| 1LHAASO J00566346u | 0.38 | 4FGL J0057.9+6326 | |
| 1LHAASO J05004454 | 0.32 | 4FGL J0501.7+4459 | |
| 1LHAASO J18580330 | 0.31 | 4FGL J1857.9+0313c | LQAC 284+003;bcu; |
| 0.41 | 4FGL J1858.0+0354 | ||
| 1LHAASO J19020648 | 0.12 | 4FGL J1902.5+0654 | |
| 1LHAASO J19241609 | 0.12 | 4FGL J1924.3+1601c | |
| 0.29 | 4FGL J1925.4+1616 | ||
| 0.33 | 4FGL J1924.3+1628 | ||
| 1LHAASO J19311653 | 0.05 | 4FGL J1931.1+1656 | |
| 1LHAASO J20273657 | 0.40 | 4FGL J2026.5+3718c | NVSS J202726+372249;unk; |
| 1LHAASO J20474434 | 0.32 | 4FGL J2049.3+4440c | |
| 1LHAASO J02164237u | 0.33 | ATNF PSR J0218+4232 | ,, |
| 0.33 | 4FGL J0218.1+4232 | PSR J0218+4232;MSP; | |
| 1LHAASO J02496022 | 0.16 | ATNF PSR J0248+6021 | ,, |
| 0.14 | 4FGL J0248.4+6021 | PSR J0248+6021;PSR; | |
| 1LHAASO J03595406 | 0.12 | SNRcat G148.1+00.8 | http://SNRcat.physics.umanitoba.ca/SNRrecord.php?id=G148.1p00.8 |
| 0.12 | ATNF PSR B0355+54 | ,, | |
| 0.15 | ATNF PSR J0359+5414 | , | |
| 0.15 | 4FGL J0359.4+5414 | PSR J0359+5414;PSR; | |
| 1LHAASO J04285531 | 0.26 | SNRcat G150.3+04.5 | http://SNRcat.physics.umanitoba.ca/SNRrecord.php?id=G150.3p04.5 |
| 0.48 | 4FGL J0425.6+5522e | SNR G150.3+04.5;SNR;=1.359 Gaussian; | |
| 1LHAASO J05343533 | 0.30 | SNRcat G172.8+01.5 | http://SNRcat.physics.umanitoba.ca/SNRrecord.php?id=G172.8p01.5 |
| 1LHAASO J18141636u | 0.31 | SNRcat G014.3+00.1 | http://SNRcat.physics.umanitoba.ca/SNRrecord.php?id=G005.7m00.1 |
| 0.43 | SNRcat G014.1-00.1 | http://SNRcat.physics.umanitoba.ca/SNRrecord.php?id=G005.7m00.1 | |
| 0.44 | 4FGL J1816.2-1654c | PMN J1816-1649;unk; | |
| 1LHAASO J18311028 | 0.30 | SNRcat G021.0-00.4 | http://SNRcat.physics.umanitoba.ca/SNRrecord.php?id=G053.6m02.2 |
| 0.36 | SNRcat G021.5-00.1 | http://SNRcat.physics.umanitoba.ca/SNRrecord.php?id=G053.6m02.2 | |
| 0.49 | SNRcat G021.8-00.6 | http://SNRcat.physics.umanitoba.ca/SNRrecord.php?id=G053.6m02.2 | |
| 1LHAASO J18520050u | 0.17 | SNRcat G033.6+00.1 | http://SNRcat.physics.umanitoba.ca/SNRrecord.php?id=G033.6p00.1 |
| 0.31 | ATNF PSR J1853+0056 | ,, | |
| 0.21 | 4FGL J1852.4+0037e | Kes 79;spp;0.63 Disk; | |
| 1LHAASO J19060712 | 0.34 | SNRcat G041.1-00.3 | http://SNRcat.physics.umanitoba.ca/SNRrecord.php?id=G041.1m00.3 |
| 0.19 | ATNF PSR J1906+0722 | , | |
| 0.19 | 4FGL J1906.9+0712 | ||
| 0.20 | 4FGL J1906.4+0723 | PSR J1906+0722;PSR; | |
| 0.37 | 4FGL J1907.6+0703 | 3C 397;snr; | |
| 1LHAASO J19281813u | 0.39 | SNRcat G053.4+00.0 | http://SNRcat.physics.umanitoba.ca/SNRrecord.php?id=G053.4p00.0 |
| 0.47 | ATNF PSR J1928+1746 | ,, | |
| 0.22 | 4FGL J1928.4+1801c | MG2 J192830+1759;unk; | |
| 0.48 | 4FGL J1929.8+1832 | 1RXS J193012.1+183201;unk; | |
| 1LHAASO J19543253 | 0.25 | SNRcat G069.0+02.7 | http://SNRcat.physics.umanitoba.ca/SNRrecord.php?id=G069.0p02.7 |
| 0.33 | ATNF PSR B1951+32 | ,, | |
| 0.32 | 4FGL J1952.9+3252 | PSR J1952+3252;PSR; | |
| 0.49 | 4FGL J1955.1+3321 | SNR G069.0+02.7;spp; | |
| 1LHAASO J19562921 | 0.36 | SNRcat G066.0-00.0 | http://SNRcat.physics.umanitoba.ca/SNRrecord.php?id=G066.0m00.0 |
| 1LHAASO J19592846u | 0.15 | SNRcat G065.8-00.5 | http://SNRcat.physics.umanitoba.ca/SNRrecord.php?id=G001.9p00.3 |
| 0.39 | SNRcat G066.0-00.0 | http://SNRcat.physics.umanitoba.ca/SNRrecord.php?id=G001.9p00.3 | |
| 0.10 | ATNF PSR J1958+2846 | ,, | |
| 0.09 | 4FGL J1958.7+2846 | PSR J1958+2846;PSR; | |
| 1LHAASO J20023244u | 0.04 | SNRcat G069.7+01.0 | http://SNRcat.physics.umanitoba.ca/SNRrecord.php?id=G069.7p01.0 |
| 0.47 | ATNF PSR B2000+32 | ,, | |
| 0.05 | 4FGL J2002.3+3246 | SNR G069.7+01.0;spp; | |
| 1LHAASO J20283352 | 0.36 | ATNF PSR J2028+3332 | , |
| 0.36 | 4FGL J2028.3+3331 | PSR J2028+3332;PSR; | |
| 0.40 | 4FGL J2027.0+3343 | 1RXS J202658.5+334253;unk; | |
| 1LHAASO J22385900 | 0.07 | ATNF PSR J2238+5903 | ,, |
| 0.07 | 4FGL J2238.5+5903 | PSR J2238+5903;PSR; | |
| 1LHAASO J12192915 | 0.05 | NGC 4278 | AGN; z=0.002; |
Note. — In the description of the 4FGL counterparts, ‘unk’ represents sources solely associated with the likelihood-ratio method from large radio and X-ray surveys, ‘bcu’ is a blazar candidate of uncertain type, ‘spp’ is a supernova remnant or pulsar wind nebula, ‘PSR’ is a gamma-ray pulsar identified by pulsations, and ‘snr’ is the Supernova remnant (Abdollahi et al., 2022).
| Source name | PSR name | Sep.(∘) | d (kpc) | (kyr) | () | Identified type in TeVCat | |
|---|---|---|---|---|---|---|---|
| 1LHAASO J0007+7303u | PSR J0007+7303 | 0.05 | 1.40 | 14 | 4.5e+35 | 7.3e-05 | PWN |
| 1LHAASO J0216+4237u | PSR J0218+4232 | 0.33 | 3.15 | 476000 | 2.4e+35 | 3.6e-03 | |
| 1LHAASO J0249+6022 | PSR J0248+6021 | 0.16 | 2.00 | 62 | 2.1e+35 | 1.5e-03 | |
| 1LHAASO J0359+5406 | PSR J0359+5414 | 0.15 | - | 75 | 1.3e+36 | 7.2e-04 | |
| 1LHAASO J0534+2200u | PSR J0534+2200 | 0.01 | 2.00 | 1 | 4.5e+38 | 3.2e-06 | PWN |
| 1LHAASO J0542+2311u | PSR J0543+2329 | 0.30 | 1.56 | 253 | 4.1e+34 | 8.3e-03 | |
| 1LHAASO J0622+3754 | PSR J0622+3749 | 0.09 | - | 208 | 2.7e+34 | 2.5e-04 | PWN/TeV Halo |
| 1LHAASO J0631+1040 | PSR J0631+1037 | 0.11 | 2.10 | 44 | 1.7e+35 | 3.5e-04 | PWN |
| 1LHAASO J0634+1741u | PSR J0633+1746 | 0.12 | 0.19 | 342 | 3.3e+34 | 1.3e-03 | PWN/TeV Halo |
| 1LHAASO J0635+0619 | PSR J0633+0632 | 0.39 | 1.35 | 59 | 1.2e+35 | 9.4e-03 | |
| 1LHAASO J1740+0948u | PSR J1740+1000 | 0.21 | 1.23 | 114 | 2.3e+35 | 1.4e-03 | |
| 1LHAASO J1809-1918u | PSR J1809-1917 | 0.05 | 3.27 | 51 | 1.8e+36 | 6.2e-04 | |
| 1LHAASO J1813-1245 | PSR J1813-1245 | 0.01 | 2.63 | 43 | 6.2e+36 | 6.3e-06 | |
| 1LHAASO J1825-1256u | PSR J1826-1256 | 0.09 | 1.55 | 14 | 3.6e+36 | 1.6e-03 | |
| 1LHAASO J1825-1337u | PSR J1826-1334 | 0.11 | 3.61 | 21 | 2.8e+36 | 2.8e-03 | PWN/TeV Halo |
| 1LHAASO J1837-0654u | PSR J1838-0655 | 0.12 | 6.60 | 23 | 5.6e+36 | 2.2e-03 | PWN |
| 1LHAASO J1839-0548u | PSR J1838-0537 | 0.20 | - | 5 | 6.0e+36 | 6.1e-03 | |
| 1LHAASO J1848-0001u | PSR J1849-0001 | 0.06 | - | 43 | 9.8e+36 | 1.2e-04 | PWN |
| 1LHAASO J1857+0245 | PSR J1856+0245 | 0.16 | 6.32 | 21 | 4.6e+36 | 3.1e-03 | PWN |
| 1LHAASO J1906+0712 | PSR J1906+0722 | 0.19 | - | 49 | 1.0e+36 | 5.9e-03 | |
| 1LHAASO J1908+0615u | PSR J1907+0602 | 0.23 | 2.37 | 20 | 2.8e+36 | 6.8e-03 | |
| 1LHAASO J1912+1014u | PSR J1913+1011 | 0.13 | 4.61 | 169 | 2.9e+36 | 1.5e-03 | |
| 1LHAASO J1914+1150u | PSR J1915+1150 | 0.09 | 14.01 | 116 | 5.4e+35 | 1.8e-03 | |
| 1LHAASO J1928+1746u | PSR J1928+1746 | 0.04 | 4.34 | 83 | 1.6e+36 | 1.6e-04 | |
| 1LHAASO J1929+1846u | PSR J1930+1852 | 0.29 | 7.00 | 3 | 1.2e+37 | 2.6e-03 | PWN |
| 1LHAASO J1954+2836u | PSR J1954+2836 | 0.01 | 1.96 | 69 | 1.1e+36 | 1.6e-05 | PWN |
| 1LHAASO J1954+3253 | PSR J1952+3252 | 0.33 | 3.00 | 107 | 3.7e+36 | 6.7e-03 | |
| 1LHAASO J1959+2846u | PSR J1958+2845 | 0.10 | 1.95 | 22 | 3.4e+35 | 2.8e-03 | PWN |
| 1LHAASO J2005+3415 | PSR J2004+3429 | 0.25 | 10.78 | 18 | 5.8e+35 | 9.9e-03 | |
| 1LHAASO J2005+3050 | PSR J2006+3102 | 0.20 | 6.04 | 104 | 2.2e+35 | 9.2e-03 | |
| 1LHAASO J2020+3649u | PSR J2021+3651 | 0.05 | 1.80 | 17 | 3.4e+36 | 1.5e-04 | PWN |
| 1LHAASO J2028+3352 | PSR J2028+3332 | 0.36 | - | 576 | 3.5e+34 | 8.0e-03 | |
| 1LHAASO J2031+4127u | PSR J2032+4127 | 0.08 | 1.33 | 201 | 1.5e+35 | 1.0e-03 | PWN |
| 1LHAASO J2228+6100u | PSR J2229+6114 | 0.27 | 3.00 | 10 | 2.2e+37 | 2.2e-03 | PWN |
| 1LHAASO J2238+5900 | PSR J2238+5903 | 0.07 | 2.83 | 27 | 8.9e+35 | 3.0e-04 |